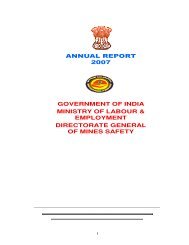
Annual Report,2009 - Directorate General of Mines Safety
Annual Report,2009 - Directorate General of Mines Safety
Annual Report,2009 - Directorate General of Mines Safety

Create successful ePaper yourself
Turn your PDF publications into a flip-book with our unique Google optimized e-Paper software.
DGMS <strong>Annual</strong> <strong>Report</strong>,<strong>2009</strong><br />
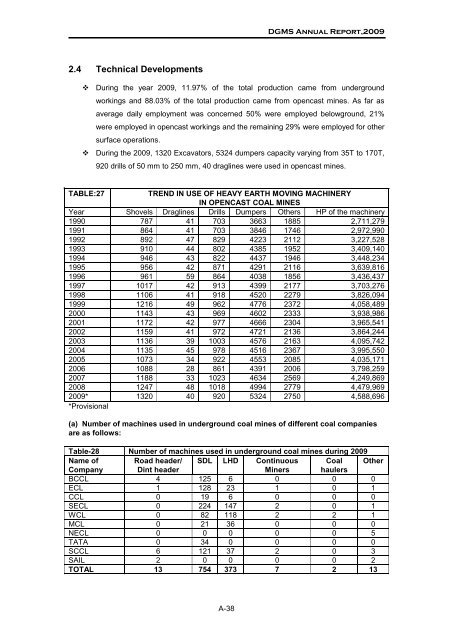
2.4 Technical Developments<br />
During the year <strong>2009</strong>, 11.97% <strong>of</strong> the total production came from underground<br />
workings and 88.03% <strong>of</strong> the total production came from opencast mines. As far as<br />
average daily employment was concerned 50% were employed belowground, 21%<br />
were employed in opencast workings and the remaining 29% were employed for other<br />
surface operations.<br />
During the <strong>2009</strong>, 1320 Excavators, 5324 dumpers capacity varying from 35T to 170T,<br />
920 drills <strong>of</strong> 50 mm to 250 mm, 40 draglines were used in opencast mines.<br />
TABLE:27<br />
TREND IN USE OF HEAVY EARTH MOVING MACHINERY<br />
IN OPENCAST COAL MINES<br />
Year Shovels Draglines Drills Dumpers Others HP <strong>of</strong> the machinery<br />
1990 787 41 703 3663 1885 2,711,279<br />
1991 864 41 703 3846 1746 2,972,990<br />
1992 892 47 829 4223 2112 3,227,528<br />
1993 910 44 802 4385 1952 3,409,140<br />
1994 946 43 822 4437 1946 3,448,234<br />
1995 956 42 871 4291 2116 3,639,816<br />
1996 961 59 864 4038 1856 3,436,437<br />
1997 1017 42 913 4399 2177 3,703,276<br />
1998 1106 41 918 4520 2279 3,826,094<br />
1999 1216 49 962 4776 2372 4,058,489<br />
2000 1143 43 969 4602 2333 3,938,986<br />
2001 1172 42 977 4666 2304 3,965,541<br />
2002 1159 41 972 4721 2136 3,864,244<br />
2003 1136 39 1003 4576 2163 4,095,742<br />
2004 1135 45 978 4516 2367 3,995,550<br />
2005 1073 34 922 4553 2085 4,035,171<br />
2006 1088 28 861 4391 2006 3,798,259<br />
2007 1188 33 1023 4634 2569 4,249,869<br />
2008 1247 48 1018 4994 2779 4,479,969<br />
<strong>2009</strong>* 1320 40 920 5324 2750 4,588,696<br />
*Provisional<br />
(a) Number <strong>of</strong> machines used in underground coal mines <strong>of</strong> different coal companies<br />
are as follows:<br />
Table-28 Number <strong>of</strong> machines used in underground coal mines during <strong>2009</strong><br />
Name <strong>of</strong> Road header/ SDL LHD Continuous Coal Other<br />
Company Dint header<br />
Miners haulers<br />
BCCL 4 125 6 0 0 0<br />
ECL 1 128 23 1 0 1<br />
CCL 0 19 6 0 0 0<br />
SECL 0 224 147 2 0 1<br />
WCL 0 82 118 2 2 1<br />
MCL 0 21 36 0 0 0<br />
NECL 0 0 0 0 0 5<br />
TATA 0 34 0 0 0 0<br />
SCCL 6 121 37 2 0 3<br />
SAIL 2 0 0 0 0 2<br />
TOTAL 13 754 373 7 2 13<br />
A-38