Annual Report,2009 - Directorate General of Mines Safety
Annual Report,2009 - Directorate General of Mines Safety Annual Report,2009 - Directorate General of Mines Safety
No. of Accidents DGMS Annual Report,2009 4. Distribution of fatal roof fall accidents by distance from face Distance from face Number of accidents (metres) 2005 % 2006 % 2007 % 2008 % 2009 % total % 0.00- 5.00 11 61 9 69 1 8 6 44 7 29 34 42 5.01- 10.00 0 0 0 0 4 31 1 7 7 29 12 15 10.01- 20.00 1 6 1 8 0 0 3 21 1 4 6 8 20.01 & above 4 22 1 8 2 15 3 21 4 17 14 15 not applicable/ available 2 11 2 15 6 46 1 7 5 21 16 20 Total 18 100 13 100 13 100 14 100 24 100 82 100 Analysis by Distance from Face 20.01 & above, 14, 15% not applicable, 16, 20% 0.00- 5.00, 34, 42% 10.01- 20.00, 6, 8% 5.01- 10.00, 12, 15% 5. Distribution of fatal roof fall accidents by type of roof support Type of support Number of accidents 2005 % 2006 % 2007 % 2008 % 2009 % total % No support 0 0 0 0 0 0 0 0 0 0 0 0 Timber supports only Timber and steel supports Roof bolts and others Other supports 5 28 4 31 1 8 1 7 4 17 15 18 1 6 0 0 0 0 1 7 1 4 3 4 9 50 7 54 1 8 1 7 0 0 18 22 3 16 2 15 11 84 11 79 19 79 46 56 Total 18 100 13 100 13 100 14 100 24 100 82 100 25 20 15 10 5 0 2005 2006 2007 2008 2009 Year Type of Roof Other Support supports Roof bolts and others Timber and steel supports Timber supports only No support Analysis by Type of Roof Support Other supports, 46, 56% Timber supports only, 15, 18% Timber and steel supports, 3, 4% Roof bolts and others, 18, 22% A-22
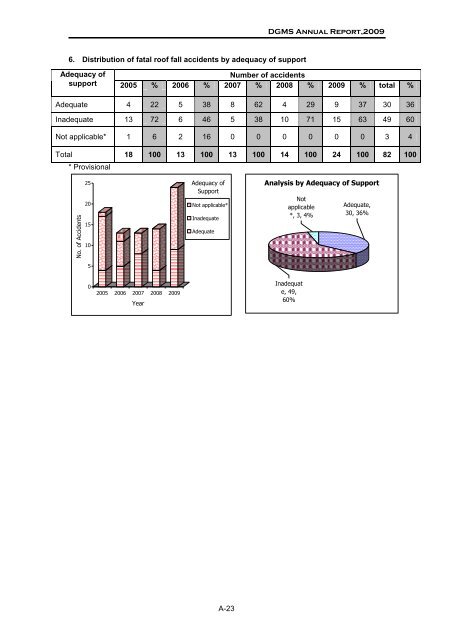
No. of Accidents DGMS Annual Report,2009 6. Distribution of fatal roof fall accidents by adequacy of support Adequacy of support Number of accidents 2005 % 2006 % 2007 % 2008 % 2009 % total % Adequate 4 22 5 38 8 62 4 29 9 37 30 36 Inadequate 13 72 6 46 5 38 10 71 15 63 49 60 Not applicable* 1 6 2 16 0 0 0 0 0 0 3 4 Total 18 100 13 100 13 100 14 100 24 100 82 100 * Provisional 25 20 15 Adequacy of Support Not applicable* Inadequate Adequate Analysis by Adequacy of Support Not applicable *, 3, 4% Adequate, 30, 36% 10 5 0 2005 2006 2007 2008 2009 Year Inadequat e, 49, 60% A-23
- Page 1 and 2: DGMS Annual Report,2009 1.0 Introdu
- Page 3 and 4: DGMS Annual Report,2009 1.3 Role an
- Page 5 and 6: DGMS Annual Report,2009 responsibil
- Page 7 and 8: DGMS Annual Report,2009 orders unde
- Page 9 and 10: DGMS Annual Report,2009 Details of
- Page 11 and 12: DGMS Annual Report,2009 TABLE: 15 P
- Page 13 and 14: DGMS Annual Report,2009 Table 18 gi
- Page 15 and 16: DGMS Annual Report,2009 309(49%) we
- Page 17 and 18: DGMS Annual Report,2009 2.2.3B.1 Gr
- Page 19 and 20: DGMS Annual Report,2009 accidents h
- Page 21: No. of Accidents No. of Accidents D
- Page 25 and 26: No. of Accidents No. of Accidents D
- Page 27 and 28: No. of Accidents No. of Accidents D
- Page 29 and 30: No. of Accidents No. of Accidents M
- Page 31 and 32: DGMS Annual Report,2009 2.2.3B.3 Si
- Page 33 and 34: DGMS Annual Report,2009 Further ana
- Page 35 and 36: DGMS Annual Report,2009 2.3 Dangero
- Page 37 and 38: DGMS Annual Report,2009 Availabili
- Page 39 and 40: Bucket wheel Excavator Dragline Sur
- Page 41 and 42: DGMS Annual Report,2009 2.6 Vocatio
- Page 43 and 44: DGMS Annual Report,2009 2.8 Owner-w
- Page 45 and 46: DGMS Annual Report,2009 Owner Year
- Page 47 and 48: DGMS Annual Report,2009 Owner Year
- Page 49 and 50: DGMS Annual Report,2009 Owner 2.9 O
- Page 51 and 52: DGMS Annual Report,2009 Owner Year
- Page 53 and 54: DGMS Annual Report,2009 Owner Year
- Page 55 and 56: DGMS Annual Report,2009 3.0 Non-Coa
- Page 57 and 58: DGMS Annual Report,2009 2006 78 79
- Page 59 and 60: DGMS Annual Report,2009 TABLE: 38 T
- Page 61 and 62: DGMS Annual Report,2009 3.2.2.3 Tra
- Page 63 and 64: DGMS Annual Report,2009 3.3 Respons
- Page 65 and 66: DGMS Annual Report,2009 *Provisiona
- Page 67 and 68: DGMS Annual Report,2009 3.9 Mineral
- Page 69 and 70: DGMS Annual Report,2009 Fatal Accid
- Page 71 and 72: DGMS Annual Report,2009 Fatal Accid
No. <strong>of</strong> Accidents<br />
DGMS <strong>Annual</strong> <strong>Report</strong>,<strong>2009</strong><br />
6. Distribution <strong>of</strong> fatal ro<strong>of</strong> fall accidents by adequacy <strong>of</strong> support<br />
Adequacy <strong>of</strong><br />
support<br />
Number <strong>of</strong> accidents<br />
2005 % 2006 % 2007 % 2008 % <strong>2009</strong> % total %<br />
Adequate 4 22 5 38 8 62 4 29 9 37 30 36<br />
Inadequate 13 72 6 46 5 38 10 71 15 63 49 60<br />
Not applicable* 1 6 2 16 0 0 0 0 0 0 3 4<br />
Total 18 100 13 100 13 100 14 100 24 100 82 100<br />
* Provisional<br />
25<br />
20<br />
15<br />
Adequacy <strong>of</strong><br />
Support<br />
Not applicable*<br />
Inadequate<br />
Adequate<br />
Analysis by Adequacy <strong>of</strong> Support<br />
Not<br />
applicable<br />
*, 3, 4%<br />
Adequate,<br />
30, 36%<br />
10<br />
5<br />
0<br />
2005 2006 2007 2008 <strong>2009</strong><br />
Year<br />
Inadequat<br />
e, 49,<br />
60%<br />
A-23


