Mapping and Visualizing Sea Level Rise and ... - GeoTools - NOAA
Mapping and Visualizing Sea Level Rise and ... - GeoTools - NOAA
Mapping and Visualizing Sea Level Rise and ... - GeoTools - NOAA
SHOW LESS

Create successful ePaper yourself
Turn your PDF publications into a flip-book with our unique Google optimized e-Paper software.
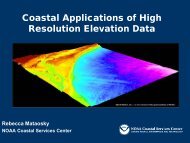
In Charleston, South Carolina<br />
Vulnerable Areas Are Lower Than We Thought<br />
Up to 3 meters (10 feet) LOWER!!<br />
The average<br />
difference<br />
between the<br />
10m NED <strong>and</strong><br />
the lidar is<br />
more than<br />
2.5m (8ft).