Mapping and Visualizing Sea Level Rise and ... - GeoTools - NOAA
Mapping and Visualizing Sea Level Rise and ... - GeoTools - NOAA
Mapping and Visualizing Sea Level Rise and ... - GeoTools - NOAA

You also want an ePaper? Increase the reach of your titles
YUMPU automatically turns print PDFs into web optimized ePapers that Google loves.
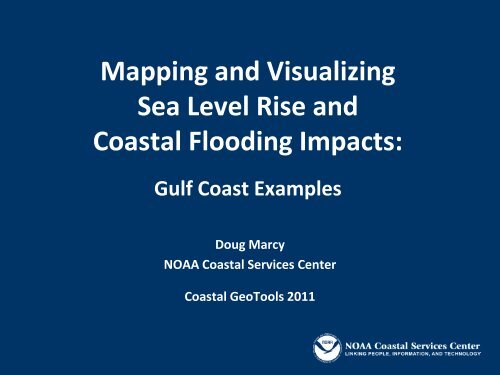
<strong>Mapping</strong> <strong>and</strong> <strong>Visualizing</strong><br />
<strong>Sea</strong> <strong>Level</strong> <strong>Rise</strong> <strong>and</strong><br />
Coastal Flooding Impacts:<br />
Gulf Coast Examples<br />
Doug Marcy<br />
<strong>NOAA</strong> Coastal Services Center<br />
Coastal <strong>GeoTools</strong> 2011
State, Regional, <strong>and</strong> County Needs<br />
• Assistance with collection of consistent, st<strong>and</strong>ardized<br />
elevation data <strong>and</strong> avoidance of duplication<br />
• Federal agency guidance <strong>and</strong> justification for flood, tide,<br />
<strong>and</strong> storm elevations for coastal areas to use for creating<br />
inundation models<br />
• Methods <strong>and</strong> st<strong>and</strong>ards for mapping coastal inundation<br />
• Simple sea level rise (SLR) visualization tools that show highrisk<br />
areas with possible future flooding problems so that<br />
l<strong>and</strong> acquisition <strong>and</strong> adaptation planning can start now
When It Comes to Flood <strong>Mapping</strong> or <strong>Sea</strong> <strong>Level</strong><br />
<strong>Rise</strong> Projection, Elevation Data Is the Key . . .<br />
• 2009 National Research Council report “<strong>Mapping</strong> the zone:<br />
Improving Flood Map Accuracy”<br />
Topographic/bathymetric data is the most important factor in<br />
determining the accuracy of flood maps<br />
• Climate Change Science Program SAP 4.1, “Coastal<br />
Elevations <strong>and</strong> Sensitivity to <strong>Sea</strong>-<strong>Level</strong> <strong>Rise</strong>”<br />
<strong>Sea</strong> level rise mapping requires high-resolution elevation data<br />
(Current national datasets {30m DEMs} are not adequate)
Importance of Elevation Data<br />
Profile in Charleston, South Carolina<br />
30-meter NED data (1 arc second)<br />
10-meter NED data (1/3 arc second)<br />
Lidar data<br />
NED – National Elevation Dataset
In Charleston, South Carolina<br />
Vulnerable Areas Are Lower Than We Thought<br />
Up to 3 meters (10 feet) LOWER!!<br />
The average<br />
difference<br />
between the<br />
10m NED <strong>and</strong><br />
the lidar is<br />
more than<br />
2.5m (8ft).
Digital Elevation DEM Accuracy Model (DEM) <strong>and</strong> Accuracy SLR <strong>and</strong> Results <strong>Mapping</strong> Results<br />
3-meter lidar DEM<br />
VA = ~20 centimeters)<br />
10-meter NED DEM<br />
(VA = ~1 meter)<br />
0.5-meter<br />
SLR<br />
0.5-meter SLR<br />
+ 1 root mean<br />
square error<br />
(RMSE)
Build Best<br />
Terrain Available<br />
NED<br />
Digital Coast - JABLTCX<br />
Raw Points/Breaklines
Enforce Hydro-<br />
Connectivity
Enforce Hydro-<br />
Connectivity
5-meter<br />
Resolution<br />
Resolution<br />
Requirements<br />
10-meter<br />
Resolution
The Ocean Is Not a Flat Surface<br />
(especially in bays <strong>and</strong> estuaries)<br />
~2FT difference
Vertical Transformation<br />
Using VDatum to convert between tidal,<br />
orthometric, <strong>and</strong> ellipsoidal datums<br />
• Vertical Datum Transformation Tool<br />
• Developed jointly by <strong>NOAA</strong>’s Office of Coast<br />
Survey <strong>and</strong> the National Geodetic Survey<br />
• Provides a method to accurately combine<br />
topographic (orthometric) <strong>and</strong> bathymetric<br />
(tidal) elevation data<br />
• Application is limited to the region it was<br />
developed for
State, Regional, <strong>and</strong> County Needs<br />
• Simple visualization tools<br />
• Show potential impacts of SLR scenarios<br />
• Show how everyday tidal flooding will become<br />
worse <strong>and</strong> more frequent<br />
Examples: Charleston, South Carolina – Wilmington, Delaware –<br />
Mississippi/Alabama counties – Houston/Galveston counties
0m rise = 2 times in 2008<br />
0.5m rise = 289 times (66 times twice a day)
Present Day / Current Conditions
Approximately 1.5 meters (~5 feet)<br />
above Mean High Water
Long Isl<strong>and</strong>, New York – Storm Surge <strong>and</strong> <strong>Sea</strong> <strong>Level</strong> <strong>Rise</strong>
What Data Are Needed to Determine SLR Impacts<br />
(Dec. 09 <strong>Sea</strong> <strong>Level</strong> <strong>Rise</strong> <strong>and</strong> Inundation Community Workshop Executive Summary)<br />
www.csc.noaa.gov/publications/inundation-workshop.html<br />
1. Data to underst<strong>and</strong> l<strong>and</strong> forms <strong>and</strong> where <strong>and</strong> how water will flow: This<br />
includes geomorphology, topography/bathymetry (LiDAR), vertical<br />
datums, etc.<br />
2. Monitoring data <strong>and</strong> environmental drivers: This includes tides, water<br />
levels, waves, precipitation, historical <strong>and</strong> predictive shoreline erosion<br />
data, local sediment budget, etc.<br />
3. Consistent sea level rise scenarios <strong>and</strong> projections across agencies to<br />
support local planning: This includes not only the amount of sea level rise<br />
projected within a given area, but also storm frequency information <strong>and</strong><br />
general time frame within which these changes are anticipated.
What Data Are Needed to Determine SLR Impacts<br />
(Dec. 09 <strong>Sea</strong> <strong>Level</strong> <strong>Rise</strong> <strong>and</strong> Inundation Community Workshop Executive Summary)<br />
www.csc.noaa.gov/publications/inundation-workshop.html<br />
4. Data to characterize vulnerabilities <strong>and</strong> impacts of sea level rise: This<br />
includes population data, l<strong>and</strong> use, buildings <strong>and</strong> critical infrastructure,<br />
natural resources, economic information, etc.<br />
5. Community characteristics: This includes demographics, societal<br />
vulnerabilities, economic activity, public attitudes <strong>and</strong> underst<strong>and</strong>ing of<br />
risks, etc.<br />
6. Legal frameworks <strong>and</strong> administrative structure: This includes zoning,<br />
permitting regimes, legislative restrictions, etc.
What Tools Are Necessary to Carry Out<br />
Adaptation Planning<br />
(Dec. 09 <strong>Sea</strong> <strong>Level</strong> <strong>Rise</strong> <strong>and</strong> Inundation Community Workshop Executive Summary)<br />
www.csc.noaa.gov/publications/inundation-workshop.html<br />
1. Easy to access<br />
2. Transparent method<br />
3. Actionable output that can be incorporated into decision-making process<br />
4. Cross between supporting planning <strong>and</strong> decision-making<br />
Tool Categories<br />
• Communication tools for stakeholder engagement, visioning,<br />
<strong>and</strong> consensus building<br />
• Tools to monitor <strong>and</strong> model current <strong>and</strong> future states<br />
• Visualization <strong>and</strong> scenario-building tools<br />
• Implementation
<strong>Sea</strong> <strong>Level</strong> <strong>Rise</strong> <strong>and</strong> Coastal Flooding<br />
Impacts Viewer
Phase I: Geographic Scope<br />
Texas<br />
• Harris County<br />
• Chambers County<br />
• Brazoria County<br />
• Galveston County<br />
Mississippi<br />
• Jackson County<br />
• Harrison County<br />
• Hancock County<br />
Working with U.S. Geological Survey, <strong>Sea</strong> Grant, Gulf Coast Services Center,<br />
Digital Coast Partners, National Ocean Service’s Center for Operational<br />
Oceanographic Products <strong>and</strong> Services (CO-OPS), Dewberry, University of South<br />
Carolina, Bureau of Labor Statistics
Phase II: Increased Geography<br />
by <strong>GeoTools</strong><br />
Alabama<br />
• Mobile<br />
• Baldwin<br />
Florida<br />
• Escambia<br />
• Santa Rosa<br />
• Okaloosa<br />
• Walton<br />
• Bay<br />
• Gulf<br />
• Franklin<br />
• Wakulla<br />
• Jefferson<br />
• Taylor<br />
• Dixie<br />
• Levy
Impacts of <strong>Sea</strong> <strong>Level</strong> <strong>Rise</strong><br />
Components<br />
‣ Visualize impacts for mean higher high water (MHHW) 6-foot SLR<br />
scenarios overlaid on aerial imagery, street map, <strong>and</strong> terrain map.<br />
Photos of SLR on individual structures will illustrate site-specific impacts.<br />
Unconnected<br />
Low-Lying Areas
Components<br />
Communicate <strong>Mapping</strong> Confidence<br />
‣ Visualize the mapping confidence of inundation area based on<br />
uncertainty of elevation data <strong>and</strong> MHHW tidal surface.<br />
Zone of Uncertainty
Components<br />
Coastal Flood Frequency<br />
‣Communicate that today’s flood is tomorrow’s high tide. Use three years<br />
of observed water level data at National Ocean Service National Water<br />
<strong>Level</strong> Observation Network (NWLON) stations to show increased<br />
frequency of everyday flooding.<br />
National Weather Service<br />
Coastal Flood<br />
Warning Areas
Components<br />
Visualize Marsh Impacts<br />
‣Visualize the impacts of SLR scenarios on marshes using Coastal<br />
Change Analysis Program (C-CAP) data.
Components<br />
Social <strong>and</strong> Economic Vulnerability<br />
‣ Include Social Vulnerability Index (SOVI) from USC <strong>and</strong> data<br />
from Bureau of Labor Statistics (BLS) showing impacts on<br />
society <strong>and</strong> economy.<br />
Social Vulnerability Index (Cutter)<br />
Bureau of Labor Statistics (Department of Labor)<br />
- Businesses<br />
- Employees<br />
- Wages
Future: Increase Geography<br />
Reporting Capability<br />
• Finish Texas<br />
• Finish Florida<br />
• Louisiana<br />
• CA, OR, WA<br />
• Mid-Atlantic<br />
• Pacific<br />
• Southeast<br />
• Northeast<br />
• Great Lakes<br />
Reporting<br />
• % of vulnerable population in<br />
each SLR increment<br />
• % of businesses, employees,<br />
wages in each SLR increment<br />
• % l<strong>and</strong> cover class change with<br />
each SLR increment
Data Distribution<br />
Lots of Layers (36 total)<br />
• Conditioned DEMs<br />
• SLR layers<br />
• Marsh migration layers<br />
• Uncertainty layers<br />
• Shallow coastal flooding layer<br />
• SOVI data<br />
• BLS data<br />
Lots of Ways to Distribute<br />
• Raster geodatabases via FTP<br />
• Representational State Transfer<br />
(REST) page<br />
• Web map service (WMS)<br />
• Arc image service<br />
• Web coverage service (WCS)<br />
What is the best way
Available via <strong>NOAA</strong> Digital Coast Tools<br />
www.csc.noaa.gov/digitalcoast/
Delivered via Inundation Toolkit<br />
www.csc.noaa.gov/inundation/
Technical Assistance<br />
Voted, Discussed, <strong>and</strong> Agreed<br />
Photos Courtesy of Nancy Gassman
Want More Detail<br />
Make sure to attend these talks:<br />
Nate Harold<br />
Wednesday at 8:30 a.m. – Kensington A<br />
• What to Believe: Factors for Consideration in Evaluating Marsh<br />
Impacts from <strong>Sea</strong> <strong>Level</strong> <strong>Rise</strong><br />
Brian Hadley<br />
Wednesday at 2:00 p.m. – Somerset<br />
• <strong>Mapping</strong> Inundation Uncertainty with a St<strong>and</strong>ard Score (Z-<br />
Score) Technique<br />
Tools Showcase<br />
Wednesday at 4 p.m. – Windsor Ballroom (T11)