REP11/PR JOINT FAO/WHO FOOD STANDARDS PROGRAMME ...
REP11/PR JOINT FAO/WHO FOOD STANDARDS PROGRAMME ...
REP11/PR JOINT FAO/WHO FOOD STANDARDS PROGRAMME ...

You also want an ePaper? Increase the reach of your titles
YUMPU automatically turns print PDFs into web optimized ePapers that Google loves.
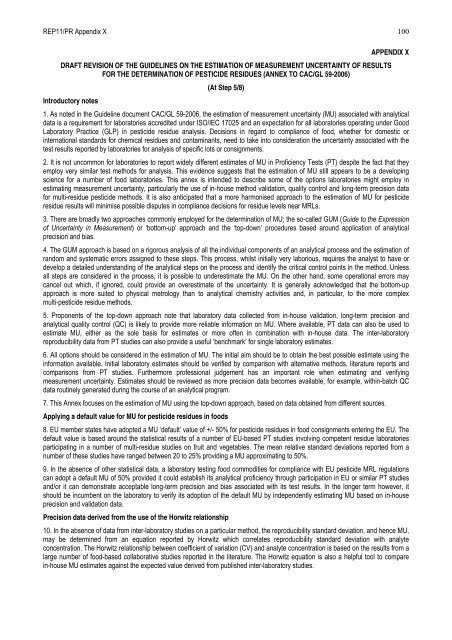
<strong>REP11</strong>/<strong>PR</strong> Appendix X 100<br />
APPENDIX X<br />
DRAFT REVISION OF THE GUIDELINES ON THE ESTIMATION OF MEASUREMENT UNCERTAINTY OF RESULTS<br />
FOR THE DETERMINATION OF PESTICIDE RESIDUES (ANNEX TO CAC/GL 59-2006)<br />
(At Step 5/8)<br />
Introductory notes<br />
1. As noted in the Guideline document CAC/GL 59-2006, the estimation of measurement uncertainty (MU) associated with analytical<br />
data is a requirement for laboratories accredited under ISO/IEC 17025 and an expectation for all laboratories operating under Good<br />
Laboratory Practice (GLP) in pesticide residue analysis. Decisions in regard to compliance of food, whether for domestic or<br />
international standards for chemical residues and contaminants, need to take into consideration the uncertainty associated with the<br />
test results reported by laboratories for analysis of specific lots or consignments.<br />
2. It is not uncommon for laboratories to report widely different estimates of MU in Proficiency Tests (PT) despite the fact that they<br />
employ very similar test methods for analysis. This evidence suggests that the estimation of MU still appears to be a developing<br />
science for a number of food laboratories. This annex is intended to describe some of the options laboratories might employ in<br />
estimating measurement uncertainty, particularly the use of in-house method validation, quality control and long-term precision data<br />
for multi-residue pesticide methods. It is also anticipated that a more harmonised approach to the estimation of MU for pesticide<br />
residue results will minimise possible disputes in compliance decisions for residue levels near MRLs.<br />
3. There are broadly two approaches commonly employed for the determination of MU; the so-called GUM (Guide to the Expression<br />
of Uncertainty in Measurement) or ‘bottom-up’ approach and the ‘top-down’ procedures based around application of analytical<br />
precision and bias.<br />
4. The GUM approach is based on a rigorous analysis of all the individual components of an analytical process and the estimation of<br />
random and systematic errors assigned to these steps. This process, whilst initially very laborious, requires the analyst to have or<br />
develop a detailed understanding of the analytical steps on the process and identify the critical control points in the method. Unless<br />
all steps are considered in the process, it is possible to underestimate the MU. On the other hand, some operational errors may<br />
cancel out which, if ignored, could provide an overestimate of the uncertainty. It is generally acknowledged that the bottom-up<br />
approach is more suited to physical metrology than to analytical chemistry activities and, in particular, to the more complex<br />
multi-pesticide residue methods.<br />
5. Proponents of the top-down approach note that laboratory data collected from in-house validation, long-term precision and<br />
analytical quality control (QC) is likely to provide more reliable information on MU. Where available, PT data can also be used to<br />
estimate MU, either as the sole basis for estimates or more often in combination with in-house data. The inter-laboratory<br />
reproducibility data from PT studies can also provide a useful ‘benchmark’ for single laboratory estimates.<br />
6. All options should be considered in the estimation of MU. The initial aim should be to obtain the best possible estimate using the<br />
information available. Initial laboratory estimates should be verified by comparison with alternative methods, literature reports and<br />
comparisons from PT studies. Furthermore professional judgement has an important role when estimating and verifying<br />
measurement uncertainty. Estimates should be reviewed as more precision data becomes available, for example, within-batch QC<br />
data routinely generated during the course of an analytical program.<br />
7. This Annex focuses on the estimation of MU using the top-down approach, based on data obtained from different sources.<br />
Applying a default value for MU for pesticide residues in foods<br />
8. EU member states have adopted a MU ‘default’ value of +/- 50% for pesticide residues in food consignments entering the EU. The<br />
default value is based around the statistical results of a number of EU-based PT studies involving competent residue laboratories<br />
participating in a number of multi-residue studies on fruit and vegetables. The mean relative standard deviations reported from a<br />
number of these studies have ranged between 20 to 25% providing a MU approximating to 50%.<br />
9. In the absence of other statistical data, a laboratory testing food commodities for compliance with EU pesticide MRL regulations<br />
can adopt a default MU of 50% provided it could establish its analytical proficiency through participation in EU or similar PT studies<br />
and/or it can demonstrate acceptable long-term precision and bias associated with its test results. In the longer term however, it<br />
should be incumbent on the laboratory to verify its adoption of the default MU by independently estimating MU based on in-house<br />
precision and validation data.<br />
Precision data derived from the use of the Horwitz relationship<br />
10. In the absence of data from inter-laboratory studies on a particular method, the reproducibility standard deviation, and hence MU,<br />
may be determined from an equation reported by Horwitz which correlates reproducibility standard deviation with analyte<br />
concentration. The Horwitz relationship between coefficient of variation (CV) and analyte concentration is based on the results from a<br />
large number of food-based collaborative studies reported in the literature. The Horwitz equation is also a helpful tool to compare<br />
in-house MU estimates against the expected value derived from published inter-laboratory studies.