WORLD PRESS TRENDS - World Association of Newspapers
WORLD PRESS TRENDS - World Association of Newspapers
WORLD PRESS TRENDS - World Association of Newspapers

Create successful ePaper yourself
Turn your PDF publications into a flip-book with our unique Google optimized e-Paper software.
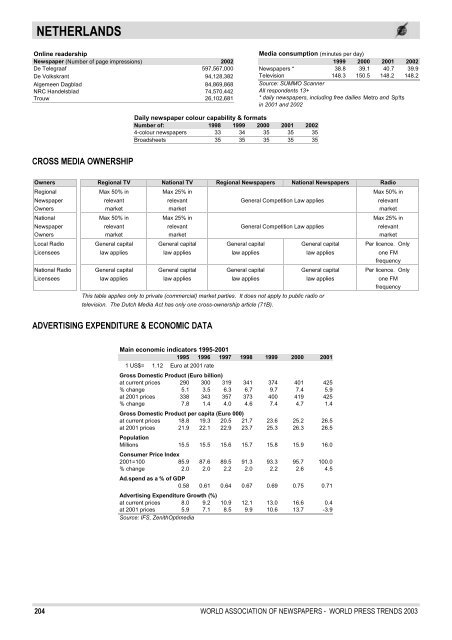
NETHERLANDS<br />
Online readership<br />
Newspaper (Number <strong>of</strong> page impressions) 2002<br />
De Telegraaf 597,567,000<br />
De Volkskrant 94,128,382<br />
Algemeen Dagblad 84,869,868<br />
NRC Handelsblad 74,570,442<br />
Trouw 26,102,681<br />
Media consumption (minutes per day)<br />
1999 2000 2001 2002<br />
<strong>Newspapers</strong> * 38.8 39.1 40.7 39.9<br />
Television 148.3 150.5 148.2 148.2<br />
Source: SUMMO Scanner<br />
All respondents 13+<br />
* daily newspapers, including free dailies Metro and Sp!ts<br />
in 2001 and 2002<br />
Daily newspaper colour capability & formats<br />
Number <strong>of</strong>: 1998 1999 2000 2001 2002<br />
4-colour newspapers 33 34 35 35 35<br />
Broadsheets 35 35 35 35 35<br />
CROSS MEDIA OWNERSHIP<br />
Owners Regional TV National TV Regional <strong>Newspapers</strong> National <strong>Newspapers</strong> Radio<br />
Regional Max 50% in Max 25% in Max 50% in<br />
Newspaper relevant relevant General Competition Law applies relevant<br />
Owners market market market<br />
National Max 50% in Max 25% in Max 25% in<br />
Newspaper relevant relevant General Competition Law applies relevant<br />
Owners market market market<br />
Local Radio General capital General capital General capital General capital Per licence. Only<br />
Licensees law applies law applies law applies law applies one FM<br />
frequency<br />
National Radio General capital General capital General capital General capital Per licence. Only<br />
Licensees law applies law applies law applies law applies one FM<br />
frequency<br />
This table applies only to private (commercial) market parties. It does not apply to public radio or<br />
television. The Dutch Media Act has only one cross-ownership article (71B).<br />
ADVERTISING EXPENDITURE & ECONOMIC DATA<br />
Main economic indicators 1995-2001<br />
1995 1996 1997 1998 1999 2000 2001<br />
1 US$= 1.12 Euro at 2001 rate<br />
Gross Domestic Product (Euro billion)<br />
at current prices 290 300 319 341 374 401 425<br />
% change 5.1 3.5 6.3 6.7 9.7 7.4 5.9<br />
at 2001 prices 338 343 357 373 400 419 425<br />
% change 7.8 1.4 4.0 4.6 7.4 4.7 1.4<br />
Gross Domestic Product per capita (Euro 000)<br />
at current prices 18.8 19.3 20.5 21.7 23.6 25.2 26.5<br />
at 2001 prices 21.9 22.1 22.9 23.7 25.3 26.3 26.5<br />
Population<br />
Millions 15.5 15.5 15.6 15.7 15.8 15.9 16.0<br />
Consumer Price Index<br />
2001=100 85.9 87.6 89.5 91.3 93.3 95.7 100.0<br />
% change 2.0 2.0 2.2 2.0 2.2 2.6 4.5<br />
Ad.spend as a % <strong>of</strong> GDP<br />
0.58 0.61 0.64 0.67 0.69 0.75 0.71<br />
Advertising Expenditure Growth (%)<br />
at current prices 8.0 9.2 10.9 12.1 13.0 16.6 0.4<br />
at 2001 prices 5.9 7.1 8.5 9.9 10.6 13.7 -3.9<br />
Source: IFS, ZenithOptimedia<br />
204<br />
<strong>WORLD</strong> ASSOCIATION OF NEWSPAPERS - <strong>WORLD</strong> <strong>PRESS</strong> <strong>TRENDS</strong> 2003