FIELD GUIDE Monitoring Tigers, Co-Predators, Prey and their Habitats
FIELD GUIDE Monitoring Tigers, Co-Predators, Prey and their Habitats
FIELD GUIDE Monitoring Tigers, Co-Predators, Prey and their Habitats

You also want an ePaper? Increase the reach of your titles
YUMPU automatically turns print PDFs into web optimized ePapers that Google loves.
<strong>FIELD</strong> <strong>GUIDE</strong><br />
<strong>Monitoring</strong> <strong>Tigers</strong>, <strong>Co</strong>-<strong>Predators</strong>,<br />
<strong>Prey</strong> <strong>and</strong> <strong>their</strong> <strong>Habitats</strong><br />
QhYM xkbM<br />
ckk] lg&ijHk{kh] pkSik;ksa ,oa<br />
muds oklLFky dk vuqJo.k<br />
Yadvendradev Jhala & Qamar Qureshi<br />
Wildlife Institute of India,<br />
Dehradun<br />
Rajesh Gopal<br />
National Tiger <strong>Co</strong>nservation<br />
Authority, New Delhi<br />
Rajan Amin<br />
Zoological Society of London,<br />
United Kindom<br />
Illustrations<br />
Jaldeep Chauhan,<br />
Insideart, Dehradun<br />
NATIONAL TIGER CONSERVATION AUTHORITY, NEW DELHI, &<br />
WILDLIFE INSTITUTE OF INDIA , DEHRADUN<br />
TECHNICAL PUBLICATION-2009
Citation<br />
Y.V.Jhala, Q.Qureshi, R.Gopal, <strong>and</strong> R.Amin, 2009. Field Guide: <strong>Monitoring</strong> tigers, co-predators,<br />
prey <strong>and</strong> <strong>their</strong> habitats. Third ed. Technical Publication of National Tiger <strong>Co</strong>nservation<br />
Authority, New Delhi <strong>and</strong> the Wildlife Institute of India, Dehradun.
<strong>Co</strong>ntents<br />
Page No.<br />
Preface 1<br />
Introduction 3<br />
Sampling for Tiger, Leopard & Other Carnivore Sign Encounter Rates 9<br />
Sampling for Ungulate Encounter Rates 16<br />
Sampling for Vegetation <strong>and</strong> Human Disturbance 21<br />
Sampling for Ungulate Pellets 34<br />
Sampling Track Plots 40<br />
Patrol Data 44<br />
Appendix-I : Major Ungulate Species 48<br />
Appendix-II : Tracks of Major Carnivores 50<br />
Appendix-III : Fecal Pellets of Wild Ungulates <strong>and</strong> <strong>their</strong> Characteristics 51<br />
Appendix-IV: Acknowledgements <strong>and</strong> Photo credits 55<br />
Appendix-V: Vulture Data Sheet 56<br />
Appendix-VI: Initialization Procedure for GPS units 58
Preface<br />
The objective of this field guide is to communicate field friendly st<strong>and</strong>ardized protocols for<br />
data collection for the front line staff <strong>and</strong> officers of the forest department. The data when<br />
analyzed would provide a scientific basis for assessing the status of tigers, other carnivores,<br />
prey species <strong>and</strong> <strong>their</strong> habitat. To this end the first edition of 2005 served its purpose. In this<br />
second edition, we incorporate the experience of the first cycle of assessment for the entire<br />
country done between 2005-2006. Based on this assessment tiger occupancy was recorded<br />
2<br />
only in 94,000 km for the entire country. Though potential tiger habitat was over 300,000<br />
2<br />
km . Source populations of importance that were responsible for maintaining <strong>and</strong><br />
perpetuating tiger occupancy at l<strong>and</strong>scape scales were few <strong>and</strong> primarily found within<br />
protected areas. It is crucial that the pulse of these source populations is kept by the<br />
management so as to detect declines <strong>and</strong> take remedial action in time. The periodicity of<br />
four years for assessing the status of tigers <strong>and</strong> sympatric carnivores at the scale of the<br />
entire country was found to be rather long for monitoring source populations. We<br />
recommend that the source populations (Tiger reserves <strong>and</strong> Protected Areas) be monitored<br />
on a seasonal or annual cycle. Based on earlier experience some of the data forms are<br />
marginally modified to meet the data requirements for the country wide monitoring <strong>and</strong> a<br />
new data forms added for monitoring source populations. The entire set of protocols in this<br />
field guide need to be completed for source population monitoring while all except two<br />
(the information from track plot <strong>and</strong> patrol data) needs to be implemented for the country<br />
wide monitoring done every four years.<br />
The field guide serves as a cook book for data collection protocols on carnivore occupancy<br />
(data sheet 1), prey abundance (data sheet 2 & 4), human impacts on the habitat (datasheet<br />
3B) <strong>and</strong> habitat status (data sheet 3A & 3C). A user friendly data entry <strong>and</strong> analysis<br />
software is provided separately to accompany this field guide in an attempt to make data<br />
entry error free <strong>and</strong> permit the wildlife managers to use <strong>their</strong> data locally for management<br />
purposes. When the protocols outlined in this field guide are followed <strong>and</strong> data analyzed<br />
the wildlife manager will have reliable information on carnivore species occupancy in time<br />
<strong>and</strong> space (at the resolution of a beat <strong>and</strong> any higher scale), relative abundance <strong>and</strong> change<br />
in prey species status, trends in <strong>and</strong> areas of impact by human activities, <strong>and</strong> habitat status<br />
<strong>and</strong> changes therein over a specified timescale.
3<br />
Introduction<br />
<strong>Monitoring</strong> tigers is a process, the end product of which is not only the number of tigers but<br />
an indication that there has been a change in number of tigers, with an underst<strong>and</strong>ing of the<br />
factors that have been responsible for this change. We are concerned, therefore, to devise a<br />
methodology for detecting this change, establishing its direction, <strong>and</strong> measuring its extent<br />
<strong>and</strong> intensity. Often monitoring is confused with record keeping <strong>and</strong> data collection using a<br />
methodology. There has been considerable amount of field data recording of wildlife<br />
especially in protected areas for the past three decades. There is frequently a misconception<br />
that once the data are collected, statisticians will analyze the data <strong>and</strong> provide inferences<br />
that will be useful for conservation science <strong>and</strong> management. If the data collection <strong>and</strong><br />
record keeping are not strictly uniform <strong>and</strong> st<strong>and</strong>ardised <strong>and</strong> are not also supported by full<br />
information on total survey effort, it becomes difficult, often impossible, to make<br />
comparisons or draw inferences. Thus there is no substitute for an objective-oriented, well<br />
designed monitoring program that defines in advance the exact st<strong>and</strong>ard methods for<br />
data collection <strong>and</strong> record keeping. Here, foresight plays an important role in data analysis<br />
which is determined well in advance by the study design that specifically addresses the<br />
objectives of the monitoring program.<br />
There are several manuals published for conducting tiger census or estimating <strong>their</strong><br />
numbers. Many of these rely on acquired “expert” skills, while others need a high level of<br />
scientific <strong>and</strong> technical skill. There is no substitute for good scientific design in<br />
implementing an effective monitoring scheme for tigers <strong>and</strong> <strong>their</strong> habitats, but we believe<br />
that for such a scheme to succeed at the National level in India (or even at a l<strong>and</strong>scape level)<br />
the vast resources of the Government machinery <strong>and</strong> sheer manpower of the forest<br />
department needs to be harnessed. Individual scientists, ecologists, <strong>and</strong> scientific<br />
organizations have developed effective monitoring schemes for individual tiger reserves,<br />
or tiger population estimation methods, but we believe that to maximise the contribution<br />
to tiger conservation, monitoring methods must become institutionalized within the system<br />
responsible for implementing tiger conservation. Institutionalization of these protocols <strong>and</strong><br />
monitoring designs is currently possible only when the Forest Department is a major stake<br />
holder in implementing these protocols.
4<br />
Here lies the need for a simple, field friendly but scientifically sound protocol that requires<br />
minimal technical skill for collecting the required data to address the objectives of the<br />
monitoring program. Since monitoring would need to be done in all tiger habitats including<br />
reserve forests <strong>and</strong> revenue forest l<strong>and</strong>, the effort <strong>and</strong> time investment needed for data<br />
collection should be such that it does not become a burden <strong>and</strong> is done with enthusiasm. At<br />
the same time the data generated by these simple protocols should meet the needed<br />
scientific rigor for analysis <strong>and</strong> appropriate inferences. Since, most forests in India still have<br />
the old tradition of maintaining compartment boundaries <strong>and</strong> beat guards still patrol <strong>their</strong><br />
beats, we have considered the beat (composed of one to several compartments) as the unit<br />
for sampling. Thereby systematically distributing the sampling units throughout the tiger<br />
habitat. Where the beat system is not in place or is defunct, we propose to rejuvenate it, or to<br />
2<br />
delineate sampling units of 15-20 km of habitat blocks on a 1:50,000 scale map based on<br />
natural boundaries.<br />
The protocols detailed in this manual are extremely simple <strong>and</strong> do not require any high<br />
level of technical skill – persons collecting data should be literate to a point of being able to<br />
write <strong>and</strong> count. The maximum required of some of them is that they would need to learn to<br />
switch on a GPS unit to write down its reading. The data generated would be such that they<br />
would permit scientifically reliable inference regarding current tiger status, population<br />
trends, habitat, <strong>and</strong> prey status with a high level of spatial resolution.<br />
Needless to say, the inference drawn from any data depends on the authenticity <strong>and</strong><br />
sincerity of data collection <strong>and</strong> reporting. By making the protocols <strong>and</strong> data sheets very<br />
simple <strong>and</strong> easy, stressing not the number of animals or tigers, but more on signs (<strong>and</strong><br />
therefore occupancy), <strong>and</strong> by making observers fill in the data directly while still in the field,<br />
we have tried to minimize the tendency of reporting inflated numbers. We include a note of<br />
caution to the supervisory officers to instil into <strong>their</strong> staff the importance <strong>and</strong> value of<br />
reporting authentic data.<br />
The explicit purpose of this field manual is that it will be used as a reference guide to ensure<br />
st<strong>and</strong>ardisation of data collection needed for monitoring tiger status <strong>and</strong> habitat across a<br />
large l<strong>and</strong>scape. The simple text in English <strong>and</strong> Hindi <strong>and</strong> the diagrammatic presentation of<br />
protocols along with sample data sheets makes the manual useful for officers, but its<br />
primary users are likely to be the beat guards. The same set of protocols sampled at shorter<br />
intervals (annually or seasonally) would serve the purpose of monitoring source<br />
populations of tigers (Tiger Reserves & Protected Areas).
The protocols prescribed in this field guide are the first steps for generating data that will<br />
contribute to the “Tiger Habitat <strong>and</strong> Population Evaluation System” for the Nation. This<br />
system would not only serve as a monitoring tool for the tiger <strong>and</strong> its habitats but would<br />
also serve to monitor the forests, <strong>their</strong> extents, threats, prey species etc., in effect monitor the<br />
entire wilderness resource for which the tiger serves as a flagship. The system is sufficiently<br />
versatile for use in evaluating the status <strong>and</strong> habitat of several endangered species. The<br />
initial investment <strong>and</strong> effort seem formidable but once developed the system would pay<br />
dividends <strong>and</strong> require minimal resources to update at regular intervals. It would not only<br />
serve as a tool for monitoring wilderness resources but could in effect be used for diverse<br />
needs such as l<strong>and</strong> use planning for agriculture, communication network, mineral<br />
extraction, etc. for the entire l<strong>and</strong>scape within each Tiger <strong>Co</strong>nservation Unit covering<br />
thous<strong>and</strong>s of square kilometres. This approach to l<strong>and</strong> use planning would ensure a holistic<br />
evaluation of any change that is to be introduced keeping in mind the economic, social,<br />
conservation <strong>and</strong> other values of the area.<br />
The Tiger Habitat <strong>and</strong> Population Evaluation System would ensure that we keep the pulse<br />
of the tiger population <strong>and</strong> its habitat for the future generations to come. The system will<br />
collect <strong>and</strong> compile information in a scientifically structured manner. The system would<br />
enable us to detect site-specific changes in time to address them with timely intervention by<br />
management <strong>and</strong> policy decisions. The system would permit a comprehensive analysis at<br />
micro levels like a small patch of forest or at macro scale e.g. a conservation unit, or at mega<br />
scale e.g. country wide analysis. With this system the information would be readily<br />
available to managers, scientists, <strong>and</strong> policy makers enabling them to make decisions on<br />
actual facts available from the field <strong>and</strong> not on educated guesses, unreliable information or<br />
expert systems. This state of the art technology application of remotely sensed satellite data<br />
in GIS domain, combined with high spatial resolution field data for conservation in the subcontinent<br />
would ensure international recognition of our conservation efforts. It will help<br />
remove any doubt that may exist to our commitment to conserve the magnificent tiger <strong>and</strong><br />
its last remaining habitats on this earth.<br />
5
1- Sampling for Tiger, Leopard, <strong>and</strong> Other Carnivore Sign<br />
Encounter Rate<br />
9<br />
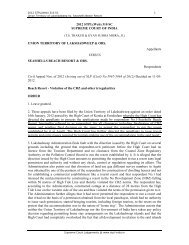
To obtain data on the presence, absence <strong>and</strong> intensity of use of a beat by tigers <strong>and</strong> other<br />
carnivores, we shall quantify the relative abundance of tiger, leopard, <strong>and</strong> carnivore signs in<br />
an area. The following procedure needs to be followed for data collection:<br />
<br />
<br />
<br />
<br />
<br />
<br />
<br />
<br />
<br />
Abeat will be considered as a sampling unit.<br />
Areas within the beat that have the maximum potential for tiger <strong>and</strong> leopard<br />
occupancy will be intensively searched.<br />
Since tigers <strong>and</strong> leopards have a tendency of using dirt roads, trails, foot paths, river<br />
beds <strong>and</strong> nullahas, these l<strong>and</strong>scape features within the beat need to be searched<br />
intensively (Figure 1).<br />
While sampling for tiger <strong>and</strong> leopard signs, record should also be kept<br />
for signs of any other carnivore that are encountered.<br />
One to three persons who know the terrain <strong>and</strong> habitat features of the beat should<br />
conduct the search for tiger <strong>and</strong> leopard signs.<br />
There should be 3-5 separate searches (in different compartments within the beat<br />
<strong>and</strong>/or at different times 1-5 days apart) with each search covering 5km distance in<br />
areas having the best potential for tiger presence. It is important to record the<br />
distance covered <strong>and</strong> the time spent during each search separately (in the data sheet-<br />
1) <strong>and</strong> accurately. If time is spent resting or in other activities while conducting the<br />
search, this duration should be reported separately. If possible the GPS coordinate of<br />
the begining point of each search path should be recorded. For source population<br />
monitoring a GPS track log record or recording of GPS coordinates every 20<br />
minutes is required.<br />
The total minimum distance covered while searching for tiger <strong>and</strong> leopard signs<br />
should be 15km per beat.<br />
Tiger, leopard <strong>and</strong> other carnivore signs should be classified into the following<br />
categories 1) pugmark trails, 2) scats (old : dry with hair <strong>and</strong> bones visible; fresh: dry<br />
but intact with shiny surface; very fresh: soft, moist, <strong>and</strong> smelly), 3) scrapes, 4) scent<br />
marks (spray, rolling), 5) rake marks on trunks, 6) vocalization (roaring), 7) actual<br />
sighting.<br />
A brief description of the topography <strong>and</strong> forest type should be recorded for each<br />
sign.
10<br />
<br />
<br />
<br />
<br />
<br />
<br />
<br />
Forest <strong>and</strong> terrain categories should be limited to 3-5 which occur locally <strong>and</strong> are<br />
decided before data collection.<br />
In case of pugmark trails, each trail set is considered as one sign (not each pugmark<br />
as one sign). In case a tiger (or other carnivore) continues to walk along a dirt road<br />
for a long distance (say 1km), then this should be considered as one sign, <strong>and</strong> a<br />
comment recorded in the remarks section of the data regarding distance covered by a<br />
pugmark trail of a single tiger.<br />
Tiger <strong>and</strong> leopard signs if encountered outside of the sampling route should also be<br />
recorded with GPS coordinates (if available) <strong>and</strong> with appropriate comments.<br />
Special emphasis should be given to sign of tigress & leopards with cubs, <strong>and</strong> any<br />
authentic evidence of tiger cubs (sightings of cubs, lactating tigress, tracks, etc.)<br />
obtained within the past twelve months should be mentioned in the data sheet.<br />
Τhe number of livestock that are killed by predators within the past three months<br />
needs to be recorded in the questionnaire following the data sheet.<br />
It is important to report data sincerely. It is likely that there may be reliable<br />
information that tiger/leopard is present in the beat being sampled, but no<br />
tiger/leopard signs are recorded during the intensive search survey. In such cases,<br />
mention should be made in the remarks column of the data sheets. However, failure<br />
in obtaining tiger sign from a beat is equally important as recording tiger/leopard<br />
signs <strong>and</strong> for appropriate analysis of this data the actual data should be reported.<br />
Periodicity: All forested beats in tiger l<strong>and</strong>scapes (Tiger Reserves, Protected Areas,<br />
Reserve <strong>and</strong> Protected Forests, Revenue Forests) will be sampled once in four years.<br />
All source populations of tigers (Tiger Reserves <strong>and</strong> Protected Areas) will be<br />
sampled with this protocol twice in a year (summer <strong>and</strong> winter).
11<br />
DATA SHEET - 1<br />
Data Sheet for Tiger, Leopard &<br />
Other Carnivore Sign Encounter Rate<br />
Observers name: .................................. Start time : ..................................................<br />
Date: .................................................... End time : ....................................................<br />
Begin GPS Lat: ...............................N,<br />
Long: ......................................................... E<br />
Forest division: ................................... Range: ................................................<br />
Beat : ..................................................<br />
Total kms. walked ....................... km.<br />
Time spent on any other activity ......... min.<br />
S. No *Carnivore Species ^Sign Type Forest Type Terrain Type Remarks<br />
1.<br />
2.<br />
3.<br />
*Carnivore species to be recorded: tiger, leopard, wild dog, bear, hyaena, wolf, jackal ^Sign types to be recorded are pugmark<br />
trails, scats (old: dry with hair <strong>and</strong> bones visible; fresh: dry but intact with shiny surface; very fresh: soft, moist, <strong>and</strong> smelly),<br />
scrapes, scent marks (spray, rolling), rake marks on trunks, vocalization (roaring), actual sighting.<br />
1) Has any tigress with cubs been reported during the past 12 months:<br />
Yes____ No____ Approximate date/month___________<br />
a) Seen by staff, b) Pugmarks,<br />
c) Reported by local persons, d) Seen by officials ( the appropriate)<br />
How many cubs __________, approximate age of cubs ________________.<br />
2) In case tigers are known to be present in the beat, but no sign was obtained during the sampling period then<br />
mention on what evidence was this conclusion made (pugmark, direct sighting, scat, other sign)___________.<br />
Approximate date/month_______ tiger presence was last recorded in the beat.<br />
3) Has any leopard with cubs been reported during the past 12 months:<br />
Yes____ No____ Approximate date___________<br />
a) Seen by staff, b) Pugmarks,<br />
c) Reported by local persons, d) Seen by officials ( the appropriate)<br />
How many cubs __________, approximate age of cubs ________________.<br />
4) In case leopards are known to be present in the beat, but no sign was obtained during the sampling period<br />
then mention on what evidence was this conclusion made (pugmark, direct sighting, scat, other<br />
sign)___________.<br />
Approximate date/month _______ leopard presence was last recorded in the beat.<br />
5) How many livestock predation events have been recorded in the past 3<br />
months, ______ by tigers, ___________ by leopards, ___________ by<br />
dhole, _______ by other carnivores (specify which carnivores known) no. of events:______, _____, _____,<br />
carnivores_____, _____, _____.<br />
6) <strong>Co</strong>mments & Remarks :<br />
_____________________________________________________________
12<br />
Figure 1. Sampling for tiger sign vkjs[k 1- ckk ds fpUgksa dh x.kuk
12<br />
Figure 1. Sampling for tiger sign vkjs[k 1- ckk ds fpUgksa dh x.kuk
12<br />
Figure 1. Sampling for tiger sign vkjs[k 1- ckk ds fpUgksa dh x.kuk
15<br />
izi= & 1<br />
ckk@rsUnqvk ,oa vU;<br />
ekalHkf{k;ksa ds fpUgksa dk losZ{k.k<br />
ladyudrkZ % ............... le; izkjaHk % ............... v{kkarj.........N<br />
fnukad % ................ le; vUr % ............... ns kkarj.........E<br />
oueaMy % ................... jsat % .....................<br />
chV % .................. iw.kZ r; nwjh .................. fd-ehfoJke<br />
esa fcrk;k x;k le; ............<br />
Øa- iztkfr ¼ekal Hk{kh½* fpà ds izdkj ** taxy ds izdkj HkkSfrdh fVIi.kh<br />
1<br />
2<br />
3<br />
* ekalHk{kh tkfr % ckk] rsUnqvk] taxyh dqRrk] ydM+ckk] Hkkyw vkSj HksfM+;k A<br />
** fpUgksa ds izdkj% ixekdZ] MªkWfiax ¼fo’ Bk½]vkokt] xkjk ¼eos kh@oU;tho½] [kjksap ¼tehu@isM+½] izR;{k ns[kukA<br />
1. fiNys ckjg eghus esa ckfku ds cPpksa ds gksus dk izek.k gk¡@ugha.............<br />
cPpksa dh<br />
la[;k .................. vuqekfur vk;q .................... fnukad@ekg................<br />
d½ ou deZpkjh }kjk ns[kk x;k] [k½ infpUg ik;s x;s]<br />
x½ LFkkuh; fuoklh }kjk lwpuk k½ vf/kdkjh }kjk ns[ks x,<br />
¼mijksDr mfpr O;k[;k dks djsa½<br />
2.<br />
vxj ckk ds gksus ds izek.k chV esa gks] ijarq [kkst ds nkSjku dksbZ fpUg u feyk gks] rc ckk ds gksus dk izek.k<br />
............................ vkSj vuqekfur frfFk@ekg.......................<br />
fy[ksa A<br />
3. fiNys ckjg eghus esa rsUnqvk ds cPpksa ds gksus dk izek.k] gk¡@ugha ................ cPpksa dh la[;k<br />
....................... vuqekfur vk;q .................. fnukad@ekg .................<br />
d½ ou deZpkjh }kjk ns[kk x;k] [k½ infpUg ik;s x;s]<br />
x½ LFkkuh; fuoklh }kjk lwpuk k½ vf/kdkjh }kjk ns[ks x,<br />
¼mijksDr mfpr O;k[;k dks djsa½<br />
4.<br />
vxj rsUnqvk ds ekStwn gksus ds izek.k chV esa gks] ijarq [kkst ds nkSjku dksbZ fpUg u feyk gks] rc rsanqvk ds<br />
gksus dk izek.k ................... vkSj vuqekfur frfFk@ekg ...................... fy[ksaA<br />
5- bl chV esa fiNys 3 eghuksa esa ikyrw tkuojksa ds f kdkj dh tkudkjh] ijHkf{k;ksa }kjk f kdkj dh la[;k] ckk ------------<br />
rsUnqvk------------ taxyh dqRrk------------- vkSj vU; ijHk{kh--------------A ¼ijHk{kh dk fooj.k½ kVukvksa dh la[;k% --------] ---------] -----<br />
---] ijHk{kh---------] --------] ---------A<br />
6- lq>ko ,oa fVIi.kh&<br />
------------------------------------------------------------------------------------------------------------------------------------------------
16<br />
2 - Sampling for Ungulate Encounter Rates<br />
This protocol outlines a simple method for quantifying ungulate abundance in an area<br />
based on visual encounters while walking along fixed line transects. The following<br />
procedure needs to be followed for data collection:<br />
<br />
<br />
<br />
A beat would be considered as the unit for sampling.<br />
After considering the shape, size, vegetation, <strong>and</strong> terrain type of the beat, a transect<br />
line of a minimum of 2km <strong>and</strong> not exceeding 4 km will be marked for sampling.<br />
The transect line should traverse similar habitat (broad vegetation types) as far as<br />
possible. If the beat is composed of 2 or 3 distinct vegetation types eg. mixed teak<br />
forest comprising 40% of the beat <strong>and</strong> the remaining 60% comprised of<br />
miscellaneous forest with bamboo, then 2 separate line transects should be marked<br />
for sampling as shown in Figure 2b.<br />
Figure 2. Marking transects in a beat.<br />
a) Line transect in a beat with similar habitat b) Line transect in a beat with 2 habitat types.<br />
<br />
<br />
<br />
<br />
As shown in Figure 2b, the line transect within a beat may be broken up into 2 or<br />
more segments so that each segment has a minimum length of 2km <strong>and</strong> traverses<br />
similar habitat.<br />
Care should be taken that a line transect is not located near a busy road nor should it<br />
run parallel to a river or other features of the l<strong>and</strong>scape which may bias sighting of<br />
ungulates.<br />
For each transect the beginning <strong>and</strong> end point coordinates (Latitude <strong>and</strong><br />
Longitude) should be recorded by a global positioning system (GPS) receiver.<br />
The broad forest type <strong>and</strong> terrain type that the transect traverses needs to be<br />
recorded.
17<br />
<br />
<br />
<br />
<br />
<br />
<br />
Each transect should be walked by 1-2 persons during the early morning hours (6:30<br />
am to 8:30 am). Preferably one of the persons walking should be a good field person<br />
who is able to spot wildlife.<br />
A record should be kept of all herbivores (<strong>and</strong> other listed wildlife) seen during the<br />
walk in the prescribed format (see data sheet). For each animal sighting the<br />
following needs to be recorded: 1) sighting no, 2) time of the sighting, 3) species (e.g.<br />
sambar, chital, wild pig etc.), 4) group size – number of animals of the same species<br />
in the group sighted, it is important to try to count the number of animals in the<br />
group as accurately as possible. Animals are considered to belong to two different<br />
groups if the closest animals from the two groups are separated by a distance of over<br />
30m, <strong>and</strong> 5) forest <strong>and</strong> terrain type where the animals were seen.<br />
If possible the number of young (fawns/calves less than 1 year of age) seen in the<br />
group should also be recorded.<br />
A broad habitat category (vegetation <strong>and</strong> terrain type) needs to be recorded for each<br />
sighting eg. 12 chital (10 adults <strong>and</strong> 2 young) were seen at 6:40 am, in mixed teak<br />
forest, gently undulating terrain.<br />
Each line transect needs to be walked atleast on three different mornings for<br />
estimating ungulate encounter rates during the country wide monitoring done<br />
every four years.<br />
For intensive monitoring of source populations (Tiger Reserves <strong>and</strong> Protected<br />
Areas) the line transects should be walked a minimum of eight times in summer<br />
<strong>and</strong> in winter.<br />
DATA SHEET - 2<br />
Encounter Rate on Line Transects<br />
Observer name: .......................................... Start time: ............................<br />
Date: ............................. End time: .................................<br />
ID no. of line transect:......................... Total length: ................km Forest division:................<br />
Range : ................................<br />
Beat:.............................<br />
Transect forest type: .............. Transect terrain type .:......................<br />
Weather condition: Cloudy/Clear sky/Rain<br />
Beginning GPS Lat: ...........................N; Long: ......................................E<br />
End GPS Lat : ...................................N; Long: ......................................E<br />
Sighting<br />
No<br />
1<br />
Time Species* Total Nos.<br />
(Adults & Young)<br />
Young Forest Type Terrain<br />
Type<br />
Remarks<br />
2<br />
*Species that need to be recorded on the transect: chital, sambar, nilgai, gaur, barking deer, elephant, rhino, wild<br />
buffalo, swamp deer, hog deer, chowsingha, blackbuck, chinkara, wild pig, langur, peafowl, hare, cattle (live<br />
stock), <strong>and</strong> other mammalian species seen.
18<br />
Figure 3. Sampling for ungulate encounter rates vkjs[k 3- pkSik;ksa dh x.kuk
2 & PkkSik;ksa dh fof/kor x.kuk dk izk#i<br />
19<br />
;g izk:i pkSIkk;ksa dh x.kuk dk vklku vkSj dkjxj rjhdk gSA bl fof/k ds }kjk js[kkafdr fd;s x;s ekxZ<br />
¼VªkalsDV½ ij pyuk gksxkA bl ekxZ dks js[kkafdr vkSj ml ij x.kuk djus dh fof/k fuEufyf[kr gS &<br />
vkadM+s bdV~Bk djus ds fy;s chV gekjh bdkbZ gksxh<br />
chV] mudh cukoV] {ks=Qy] ouLifr vkSj HkwfLFkfr fo ks’ krkvksads vk/kkj ij 2 fdeh ls 4 fdeh yEch<br />
js[kkafdr ekxZ dh igpku x.kuk bdkbZ ds :i esa dh tk;sxhA<br />
;g ykbu VªkalSDV chV esa ,d gh rjg dh ouLifr esa Mkyk tk;sxkA ;fn chV esa nks] ;k nks ls vf/kd<br />
rjg dh ouLifr;ka gksaA mnkgj.k ds rkSj ij fefJr lkxkSu ou 40% vkSj cpk gqvk 60 % {ks=Qy ckal<br />
dk fefJr ou dk gks rc nks ykbu VªkalSDV nksuksa ouLifr;ksa esa cukus gksaxs] ftlesa izR;sd VªkUlsDV dh<br />
yEckbZ 2 fd-eh- gksxhA<br />
vkjs[k 2-<br />
v½ ykbu VªkalSDV ml chV esa<br />
tgk¡ ,d rjg dh ouLifr gks<br />
chV esa ykbu VªkalSDV dks fpfUgr djuk<br />
c½ ykbu VªkalSDV tgk¡ ij chV esa<br />
rjg&rjg dh ouLifr gksa<br />
<br />
<br />
<br />
<br />
<br />
<br />
tSlk fd vkjs[k 2 ¼c½ esa crk;k x;k gS] chV esa ykbu VªkalSDV dks nks fgLlksa ckaVk x;k gSA izR;sd fgLls<br />
esa de ls de 2 fdeh dk js[kkafdr ekxZ gksuk pkfg;sA<br />
bl ckr dk /;ku j[kk tk;s fd ykbu VªkalSDV O;Lr lM+d] unh vFkok Hkwn` ; ds js[kh; y{k.kksa ds<br />
lekukarj u gks A<br />
izR;sd chV esa ykbu VªkalSDV ds izkjfEHkd ,oa vfUre fgLls dk th-ih-,l- fjlhoj }kjk v{kka k vkSj<br />
ns kkarj ysuk gksxkA<br />
VªkUlsDV ij cgqyrk ls ik;s tkus okys ou ,oa HkkSfrdh dk izdkj fy[ksaA<br />
,d ;k nks O;fDr;ksa dks ykbu VªkalSDV ij izkr% ¼6-30 & 8-30½ pyuk gksxkA ekxZ ij pyus okys<br />
O;fDr dks ouLifr ,oa tkuojksa ds ckjs esa Kku gksuk pkfg;sA<br />
izR;sd tkuoj tks ns[kk x;k gks] mlds ckjs esa MkVk khV ¼uewuk ns[ksa½ essa tkudkjh ntZ djsa% 1½ tkuoj
*
21<br />
3 - Sampling for Vegetation <strong>and</strong> Human Disturbance<br />
To quantify the habitat parameters <strong>and</strong> determine levels of human disturbance, sampling<br />
will be done along the same line transect on which ungulate encounter rates were<br />
estimated. For economy of time <strong>and</strong> effort it would be possible to first sample the line<br />
transect during early morning hours for ungulate encounter rate <strong>and</strong> then while returning<br />
along the same line, sample for vegetation <strong>and</strong> human disturbance (<strong>and</strong> also for ungulate<br />
pellets - section 4). Sampling for vegetation <strong>and</strong> human disturbance (<strong>and</strong> ungulate pellets)<br />
will be done only once on a transect<br />
<br />
<br />
<br />
<br />
<br />
<br />
Again a beat will be the sampling unit, <strong>and</strong> sampling will be done along the<br />
established line transect.<br />
The beginning <strong>and</strong> end point coordinates of the line transect need to be recorded<br />
using a GPS unit. If possible GPS coordinates for each plot should be recorded.<br />
The same principal of laying line transects as explained in the section on ungulate<br />
encounter rates is applicable here (see Figure 2).<br />
For each transect, the broad vegetation type <strong>and</strong> associated terrain type eg. mixed<br />
teak forest on hilly terrain, sal forest on flat l<strong>and</strong>, etc. should be recorded (based on<br />
Champion & Seth, 1968 classification). There would be 1-3 vegetation types<br />
occurring locally <strong>and</strong> these need to be communicated to the forest staff a prior.<br />
Vegetation <strong>and</strong> human disturbance would need to be sampled every 400m along<br />
the transect.<br />
The vegetation <strong>and</strong> human disturbance would need to be quantified visually at the<br />
following categories for each plot:<br />
(a) In 15 m. radius circular plot<br />
1) Within a distance of approximately 15 m of the observer the five most<br />
dominant trees (over-story, all vegetation > 6ft in height, including bamboo)<br />
need to be listed in the order of dominance (abundance) (see Figure 4). If there<br />
are less than 5 species then only record these<br />
2) The observer needs to list the 5 most dominant shrub species (middle-story,<br />
vegetation >40cm & < 6ft) in order of dominance (abundance) within 15m of<br />
the location. The observer needs to categorize shrub density (under-story<br />
vegetation) as absent (0%), very low (25%), low (50%), medium (75%), <strong>and</strong><br />
dense (100%) on a five point scale (0 to 4).
22<br />
3) If exotic invasive weeds are present, <strong>their</strong> abundance needs to be scored on 0 to<br />
4 scale (0 being absent <strong>and</strong> 4 high abundance) <strong>and</strong> the three most common<br />
weeds seen in 15m radius need to be listed in order of abundance.<br />
4) The observer needs to visually quantify the canopy cover at the location. The<br />
observer should classify the proportion of the sky above him that is covered by<br />
canopy foliage <strong>and</strong> categorize it into 0.8<br />
canopy cover by sampling 5 points along a diagonal of the 15m plot (see Figure<br />
5).<br />
5) Within the same 15m radius the observer needs to record number of trees with<br />
signs of lopping, wood cutting, presence/absence of human/livestock foot trail<br />
<strong>and</strong> if there are evidences of grass/bamboo cutting.<br />
6) If any livestock or humans are visible from the plot then record <strong>their</strong> presence as<br />
Yes in data sheet.<br />
7) A mention needs to be made in the data sheet regarding the number of<br />
permanent human settlements, human population, <strong>and</strong> livestock population<br />
present in the beat (to the best of his knowledge).<br />
8) A mention also needs to be made based on the observer’s knowledge if any non<br />
timber forest product (NTFP) is collected from the beat. If yes, which NTFP <strong>and</strong><br />
the magnitude of collection on a 5 point scale (0- no collection 4-high rate of<br />
collection).<br />
(b)<br />
In 1m radius circular plot<br />
This plot should be laid 5m away from the centre of the 15m circular plot. The<br />
observer needs to use a 2m long stick to define an imaginary circle around him<br />
with the stick as the diameter. Within this circular plot (2m diameter) the<br />
observer needs to a) quantify the percent ground cover, i.e. the proportion of<br />
the ground covered by herbs, grasses (green <strong>and</strong> dry), weeds, <strong>and</strong> bare ground,<br />
b) list the 3 most dominant grass species <strong>and</strong> herb species in order of dominance<br />
(see Figure 6).
23<br />
Figure 4. Sampling tree <strong>and</strong> shrub species in<br />
a 15m plot every 400m along the transect<br />
vkjs[k 4- isM+ksa dh tkfr dh igpku] 15eh- IykWV esa<br />
gjsd 400eh- js[kkafdr ekxZ ij A
24<br />
Figure 5. Estimating the canopy cover overhead vkjs[k 5- isM+ksa dh panok dk vkadyu
25<br />
vkjs[k 6- ouLifr }kjk vkPNkfnr<br />
Hkwfe dk vkadyu<br />
Figure 6. Estimating ground cover<br />
in a 1m radius circular plot
26<br />
Broad<br />
vegetation<br />
<strong>and</strong> terrain<br />
for the plot<br />
Data Sheet - 3A<br />
Vegetation (15m radius plot)<br />
Name of Observer: …………………. Date: ………………… Forest Division……………. Range: ……………………<br />
Beat: ………………………………… ID No. of Line Transect: ……………………<br />
Plot<br />
No.<br />
Tree Species *<br />
(Descending<br />
Order of<br />
Dominance)<br />
Shrub Species/<br />
Shrub like Tree<br />
Species *<br />
(Descending Order<br />
of Dominance)<br />
1 2 3 4 5 1 2 3 4 5<br />
Shrub<br />
Abundance<br />
0to4<br />
0-absent to<br />
4-very high<br />
Weed/Invasive Species<br />
(Descending Order of<br />
Dominance)<br />
1 2 3<br />
Weed/Invasive<br />
Abundance<br />
0to4<br />
0-absent to<br />
4-very high<br />
Canopy<br />
<strong>Co</strong>ver (0-1)<br />
1<br />
2<br />
3<br />
4<br />
5<br />
6<br />
7<br />
8<br />
9<br />
10<br />
*Bamboo more than 2m is entered in “Tree” category, less than 2m in “Shrub” category
27<br />
Data Sheet - 3B<br />
Human Disturbance<br />
Name of Observer: …………………. Date: ………………… Forest Division……………. Range: ……………………<br />
Beat: ………………………………… ID No. of Line Transect: ……………………<br />
Plot<br />
No.<br />
Wood Cutting<br />
(No. of trees<br />
cut)<br />
Lopping<br />
(No. of trees<br />
lopped)<br />
Grass/ Bamboo<br />
Cutting<br />
(Yes/No)<br />
Human Disturbances<br />
Presence of<br />
Human/Livestock/Trail<br />
(Yes/No)<br />
People Seen<br />
(Yes/No)<br />
Livestock<br />
Seen<br />
(Yes/No)<br />
Latitude<br />
(D,M,S,<br />
North)<br />
Longitude<br />
(D,M,S,<br />
East)<br />
1<br />
2<br />
3<br />
4<br />
5<br />
6<br />
7<br />
8<br />
9<br />
10<br />
Are there any permanent human settlements in the beat (Yes/No). If Yes, how many_____. Approximate human population___________,<br />
Approximate livestock population _______ Cattle, _______ Goat/Sheep, _______ Other Livestock.<br />
Is there NTFP collection in the beat____ Yes/No. If yes, what NTFP is collected_____________, __________, ___________, ___________,<br />
Rate NTFP collection on a scale of 0-4, 0-No to 4-Very high_______________, _______________, _______________, ______________.
28<br />
Remarks<br />
Data Sheet - 3C<br />
Recording Ground <strong>Co</strong>ver (1 m radius)<br />
Name of Observer: …………………. Date: ………………… Forest Division……………. Range: ……………………<br />
Beat: ………………………………… ID No. of Line Transect: ……………………<br />
Plot<br />
No.<br />
1<br />
Dry<br />
Leaf<br />
Litter<br />
%<br />
Ground <strong>Co</strong>ver<br />
(The following 5 columns should total 100%)<br />
Dry<br />
Grass %<br />
Green<br />
Grass<br />
%<br />
Herb<br />
(Small<br />
Plants)<br />
%<br />
Weeds<br />
%<br />
Bare<br />
Ground<br />
%<br />
Grass Species<br />
(Report in descending<br />
order of numbers½<br />
Herb Species<br />
(Report in descending<br />
order of numbers)<br />
1 2 3 1 2 3<br />
2<br />
3<br />
4<br />
5<br />
6<br />
7<br />
8<br />
9<br />
10
30<br />
ns[kh x;h rhu lcls lkekU; [kjirokj dks cgqyrk ds dze esa fy[ksaA<br />
4- vkadyudRrkZ }kjk isM+ksa ds N= dk vkadyu ns[kdj ifjek.khdj.k fd;s tkus dh vko”;drk gSA<br />
isM+ksa ds N= }kjk 0-8<br />
¼vkjs[k 5½ ds :i esa gksA bls 15 eh0 IykV dh fr;Zd js[kk ds lkFk 5 fcanqvksa dh lSEifyax }kjk<br />
fd;k tkuk pkfg, ¼fp= 5 ns[ksa½A<br />
5- mlh 15 eh0 v/kZO;kl ds vUnj fujh{k.kdRrkZ dks ywfiax ds ladsrksa okys o`{kksa dh la[;k] o`{k dVkbZ]<br />
euq’ ;@i”kqvksads pyus ls cus ekxZ dh mifLFkfr@vuqifLFkfr ,oa kkl@ck¡l dVkbZ ds izek.kksa]<br />
;fn ekStwn gksa] rks mudh la[;k Hkh fjdkMZ dh tkuh pkfg,A<br />
6- ;fn IykV esa dksbZ i”kq ;k euq’ ;fn[kkbZ nsrk gS rks mudh mifLFkfr dks MkVk”khV esa ^gk¡* ds :i esa<br />
ntZ djsaA<br />
7- LFkkbZ :i ls ekuoh; O;oLFkkiu] ekuo vkcknh ,oa i”kq vkcknh tks chV esa ekStwn gSa] ds ckjs esa<br />
MkVk”khV 3&ch esa mYys[k fd;s tkus dh vko”;drk gS ¼mldh loksZRre tkudkjh ds vk/kkj<br />
ij½A<br />
8- vdk’ Bh;ou mRikn ¼NTFP)<br />
bdV~Bk fd;s tkus dh tkudkjh nsaA vxj NTFP bdV~Bk gksrh<br />
gS] rks vkadyudRrkZ ds loksZRre Kku ds vk/kkj ij mldk Hkh mYys[k fd;s tkus dh vko”;drk<br />
gSA ;fn gk¡ rks NTFP vkSj mlds laxzg.k dk ifjek.k ikap Jsf.k;ksa ¼0& dksbZ laxzg.k ugha 4&<br />
laxzg.k dh mPp nj½ esa djsaA<br />
1 eh- v/kZO;kl ¼2 eh0 O;kl½ ds IykWV esa ¼izi=&3l½<br />
;g IykV vkadyudrkZ isM+ksa ds IykV ds ek/;e ls 5 eh- dh nwjh ij MkysaA kkl] ikS/ks vkSj<br />
[kjirokj ds fy;s 2 eh0 dh ydM+h ls vius vklikl dkYifud xksykdkj cukdj mlesa mudk<br />
vkadyu djsaA vkadyudrkZ bl 2 eh0 O;kl esa ¼v½ ouLifr }kjk vkPNkfnr Hkwfe izfr”kr dk<br />
vkadyu djs] tSls kkl ¼gjh vkSj kq’ d½][kjijrokj] fxjh gqbZ ifÙk;ka vkSj [kqyh vuko`Rr tehu]<br />
¼c½ fxjh gqbZ ifÙk;ksa vkSj VwVh Vgfu;ksa dk izfr”kr] ¼l½ bl xksykdkj esa kkl] ikS/ks] [kjirokj<br />
izR;sd dh rhu tkfr;ksa dks lwphc) Øe esa mudh de gksrh la[;k ds vuqlkj fy[ksa ¼vkjs[k 6½
31<br />
IykWV ds fy;s<br />
foLr`r ouLifr<br />
,oa HkkSfyd {ks=<br />
izi=&3v<br />
ouLifr dk losZ{k.k dk izk:i ¼15 ehVj ds v/kZO;kl esa½&v<br />
ladyudRrkZ % ------------------------------------------ fnukad % ------------------------------------------ oueaMy% ------------------------------ jsat% -----------------------------------<br />
chV % ----------------------------------------------------------- Vªk¡ts+DV ykbu Øekad % -----------------------------------------------<br />
IyWkV<br />
ua-<br />
N=<br />
kuRo<br />
¼0 ls<br />
1<br />
rd½<br />
isM+*<br />
¼la[;k ds kVrs Øe esa Jsf.k;ksa esa<br />
fy[ksa½<br />
>kM+h@>kM+h ds leku o`{kksa dh<br />
tkfr;k¡*<br />
¼la[;k ds kVrs Øe esa Jsf.k;ksa<br />
esa fy[ksa½<br />
>kM+h kuRo<br />
0ls4rd<br />
¼0&u gksuk]<br />
4& cgqr vf/kd<br />
kuRo gksuk½<br />
[kjirokj@cgqyrk<br />
¼la[;k ds kVrs Øe<br />
esa Jsf.k;ksa esa fy[ksa½<br />
Js.kh Js.kh Js.kh<br />
,d nks rhu pkj ikap ,d nks rhu pkj ikap ,d nks rhu<br />
[kjirokj cgqyrk<br />
0ls4<br />
¼0&vuqifLFkr]<br />
4& vfr mPp½<br />
1<br />
2<br />
3<br />
4<br />
5<br />
6<br />
7<br />
8<br />
9<br />
10<br />
11<br />
12<br />
13<br />
2eh0 ls vf/kd m¡pkbZ okys ck¡l dks ^^o`{k** dh Js.kh esa] ,oa 2eh0 ls de m¡pkbZ okys ck¡l dks ^^>kM+h** dh Js.kh esa fy[ksaA
32<br />
izi=&3c<br />
ekuoh; O;o/kku<br />
ladyudRrkZ % ------------------------------------------ fnukad % ------------------------------------------ oueaMy% ------------------------------ jsat % -----------------------------------<br />
chV % ----------------------------------------------------------- Vªk¡ts+DV ykbu Øekad % -----------------------------------------------<br />
IyWkV<br />
ua- isM+ksa dh dVkbZ<br />
¼dVs gq, isM+ksa<br />
dh la[;k½<br />
1<br />
2<br />
3<br />
4<br />
5<br />
6<br />
7<br />
8<br />
9<br />
10<br />
11<br />
12<br />
'kk[kkvksa dh dVkbZ<br />
¼dVh kk[kkvksa dh<br />
la[;k½<br />
kkl@<br />
ckal dh dVkbZ<br />
¼ gk¡@uk ½<br />
tSfod ncko<br />
ixMafM;ksa ¼gka@ugha½<br />
euq’ ; ;k ikyrw Ik”kq }kjk<br />
¼ gk¡@uk ½<br />
euq’ ; dh<br />
ekStwnxh<br />
¼ gk¡@uk ½<br />
ikyrw Ik”kqvksa dh<br />
ekStwnxh<br />
¼ gk¡@uk ½<br />
v{kka”k<br />
¼fM0]fe0]ls0½<br />
mRrj<br />
ns”kkarj<br />
¼fM0]fe0]ls0½<br />
iwoZ<br />
D;k chV esa euq';ksa ds LFkkbZ fuokl LFky gSa gk¡@ ughA ;fn gk¡] rks fdruh--------------------------------- mudh vuqekfur tula[;k -----------------------------------------<br />
ikyrw tkuojksa dh la[;k-----------------] eos”kh------------] HksM+@cdjh---------------] vU; i”kq----------------------------A<br />
D;k bl chV esa ,u-Vh-,Q-ih- bdV~Bk dh tkrh gS gk¡@ ukA vxj gk¡ rks ,uVh,Qih ds uke ----------------------] -----------------] ----------------------] ----------------------<br />
,u-Vh-,Q-ih- bdV~Bk fd;s tkus dh nj] 0 ls 4 dh Js.kh esa fy[ksa ¼0&ugha vkSj 4&cgqr vf/kd½
33<br />
fVIi.kh<br />
izi=& 3 l<br />
Hkwfe vkPNknu dk losZ{k.k ¼1 ehVj ds v/kZO;kl½<br />
ladyudRrkZ % ------------------------------------------ fnukad % ------------------------------------------ oueaMy% ------------------------------ jsat % -----------------------------------<br />
chV % ----------------------------------------------------------- Vªk¡ts+DV ykbu Øekad % -----------------------------------------------<br />
1<br />
2<br />
3<br />
4<br />
5<br />
6<br />
7<br />
8<br />
9<br />
10<br />
11<br />
12<br />
13<br />
14<br />
IyWkV<br />
ualw[ks<br />
iRrs<br />
%<br />
kkl<br />
lw[kk<br />
%<br />
Hkwfe vkPNknu<br />
ikapksa dkye dk ;ksx lkS izfr'kr gksuk pkfg,<br />
kkl<br />
gjk<br />
%<br />
gcZ<br />
¼NksVs ikS/ks½<br />
%<br />
[kjirokj<br />
%<br />
[kkyh<br />
Hkwfea<br />
%<br />
kkl dh iztkfr<br />
¼la[;k ds kVrs Øe esa Jsf.k;ksa<br />
esa fy[ksa½<br />
>kfM+;ksa dh iztkfr<br />
¼la[;k ds kVrs Øe esa Jsf.k;ksa esa<br />
fy[ksa½<br />
,d nks rhu ,d nks rhu
34<br />
4 - Sampling for Ungulate Pellets<br />
Ungulate abundance will also be indexed by enumerating <strong>their</strong> faecal pellets. This exercise<br />
will be done on the same line transect that has been sampled for ungulate encounter rate. To<br />
save time, this exercise could be done after the line transect has been sampled in the early<br />
morning for ungulate encounters <strong>and</strong> whilst doing the habitat <strong>and</strong> human disturbance<br />
sampling.<br />
<br />
<br />
<br />
<br />
<br />
At every 400m along the transect (line of walk) the observer needs to sample an area<br />
of 2m by 20m, perpendicular to the transect for quantifying ungulate pellets. This is<br />
done by using the 2m long stick held at the centre horizontally in his h<strong>and</strong> <strong>and</strong> by<br />
walking slowly looking left <strong>and</strong> right for 20m. The plot is placed alternately to the<br />
right <strong>and</strong> left of the transect at every 400m (see Figure 7). The topography <strong>and</strong> forest<br />
type should be recorded for each plot even if pellets are not seen.<br />
All ungulate pellets encountered need to be recognized to ungulate species <strong>and</strong><br />
recorded in appropriate columns of the attached data sheet (see Appendix 3).<br />
The number of faecal pellets need to be counted. In cases where the pellets occur in<br />
large heaps, then they should be categorized into the following categories: A (50-<br />
100), B (100-200) <strong>and</strong> C (>200).<br />
In areas where small livestock like sheep <strong>and</strong> goat are known to be grazing, it is<br />
possible that feacal pellets of these can be confused with wild ungulates especially<br />
those of chital. In such areas, a mention needs to be made that goat or sheep graze<br />
the area.<br />
In the last row of the data sheet the observer needs to report if ungulate/animal<br />
listed in the data sheet occurs in the sampled beat to the best of his knowledge<br />
irrespective of whether its pellets/dung were recorded in the plots.
35<br />
Data Sheet - 4<br />
Pellet <strong>Co</strong>unts of Ungulates<br />
Name of Observer: …………………. Date: ………………… Forest division……………………….Range: …………………….<br />
Beat: ………………………………… ID No. of line transect: ..…………………<br />
Forest Type<br />
Terrain Type<br />
Chital<br />
Sambar<br />
Wild Pig<br />
Nilgai<br />
Gaur<br />
Barasingha<br />
Barking Deer<br />
Hog Deer<br />
Chinkara<br />
Chowsingha<br />
Mouse deer<br />
Hare<br />
Blackbuck<br />
Wild buffalo<br />
Elephant<br />
Rhino<br />
Langur<br />
Cattle<br />
Goat &<br />
Sheep<br />
Other<br />
Domestic<br />
livestock<br />
Others/Unid.<br />
Plot No.<br />
1<br />
2<br />
3<br />
4<br />
5<br />
6<br />
7<br />
8<br />
9<br />
10<br />
*Present<br />
/ Absent<br />
*Based on your personal knowledge mention if the species occurs in the beat irrespective of whether its<br />
dung was recorded or not.<br />
1. Do goat/sheep graze the sampled area Yes / No<br />
2. In case pellets are obtained in large piles then these could be categorized into the following categories:<br />
No. of Pellets Category<br />
50-100 A<br />
100-200 B<br />
>200 C
36<br />
Figure 7. Quantifying ungulate faecal pellets vkjs[k 7- pkSik;ksa ds xkscj dh fxurh
A B C >
38<br />
izi= & 4<br />
oU;izkf.k;ksa ,oa eosf”k;ksa dh ysaMh ,oa xkscj dk losZ{k.k<br />
ladyudRrkZ % ------------------------------------------ fnukad % ------------------------------------------ oueaMy% ------------------------------ jsat % -----------------------------------<br />
chV % ----------------------------------------------------------- Vªk¡ts+DV ykbu Øekad % -----------------------------------------------<br />
Tkaxy dk<br />
izdkj<br />
IykWV<br />
ua-<br />
HkkSfrdh<br />
phry<br />
lkaHkj<br />
Tkaxyh<br />
lqvj<br />
Ukhyxk;<br />
xkSj<br />
Ckkjkflakk<br />
dkdM+<br />
ikM+k ¼gkWx<br />
fM;j½<br />
fpadkjk<br />
pkSflaxk<br />
Ewklk fgju<br />
[kjxks'k<br />
dkyk e`x<br />
Tkaxyh HkSal<br />
gkFkh<br />
xSaMk<br />
Xkk;@ HkSal<br />
HksM+@<br />
cdjh<br />
vU;<br />
taxyh<br />
tkuoj<br />
vU; ikyrq<br />
tkuoj<br />
1<br />
2<br />
3<br />
4 S<br />
5<br />
6<br />
7<br />
8<br />
9<br />
10<br />
*gka@<br />
ugha<br />
* vkidh futh tkudkjh ds vuqlkj mijksDr tkuoj vkids chV esa ik;s tkrs gSa ;k ughaA<br />
fVIi.kh& 1- {ks= esa cdjh@HksM+ pjrh gSa \ gk¡ @ugh<br />
2- vxj vkidks uhyxk;@pkSflakk@fpadkjk@dkyk e`x dh ysafM;ksa dk
40<br />
5 - Sampling Track Plots<br />
(Source Populations: Tiger Reserves, Protected Areas)<br />
As a part of intensive monitoring of source populations of tigers, data will be recorded<br />
from pressure impression pads (PIP’s, track plots) in every beat.<br />
<br />
<br />
<br />
<br />
<br />
A minimum of 5 PIPs will be permanently maintained in each beat. The dimension<br />
of the PIP shall not be less than 6m in length the width of the PIP should equal the<br />
foot path, jungle trail or dry nullaha’s width on which the PIP is made.GPS<br />
coordinates of all PIP’s need to be recorded.<br />
The location of the PIPs within the beat should be such that they maximize the<br />
possibility of recording carnivore tracks. Minimum distance between any 2 PIPs<br />
should be more than 1.5km.<br />
The PIPs should be cleaned of debris, leaf litter, gravel <strong>and</strong> covered with fine dust of<br />
about 0.5cm depth. After preparing the PIP, data should be recorded the next<br />
morning <strong>and</strong> the PIP cleared of all tracks. The PIPs should be sampled thrice every<br />
month during summer <strong>and</strong> winter. In case a prepared PIP is disturbed due to rain,<br />
traffic etc. then it should be set again before data is collected. The topography <strong>and</strong><br />
forest type should be recorded for each PIP.<br />
Trails of all carnivore <strong>and</strong> mega herbivores species should be recorded e.g. tiger one<br />
track set, leopard two track sets, several dhole track sets (as it may not be possible to<br />
identify individual track sets due to many tracks by a passing dhole pack), one small<br />
cat track (as species level identification may not be possible).<br />
It is important to note that a track set is constituted by one to many pugmarks made<br />
by a single animal traversing the track plot (PIP). One need not identify the gender<br />
or individual animal (tiger), but if this information is known, it should be entered in<br />
the remarks column. If there are more than one track sets of “same” animal eg. a<br />
tiger moving up <strong>and</strong> down the trail several times, they should be recorded as<br />
separate track sets.
41<br />
Data Sheet-5<br />
Track Plot for Carnivores <strong>and</strong> Mega Herbivores<br />
(Pressure Impression Pad)<br />
Name of Observer: …………………. Date: ………………… Forest Division……………. Range: ……………………<br />
Beat: ………………………………… ID No. of Line Transect: ……………………<br />
Forest Type<br />
Terrain Type<br />
Tiger<br />
Leopard<br />
Sloth Bear<br />
Dhole<br />
Hyena<br />
Jackal<br />
Small Cat<br />
Gaur<br />
Elephant<br />
Rhino<br />
Water Buffalo<br />
Others<br />
Others<br />
Deg N<br />
Min N<br />
Sec N<br />
Deg E<br />
Min E<br />
Sec E<br />
PIP<br />
No.<br />
1<br />
2<br />
3<br />
4<br />
5<br />
If tracks of young carnivores (eg. tiger cubs) are observed, please mention in remarks.<br />
Remarks: ……………………………………………………………………………………………………………………………………<br />
………………………………………………………………………………………………………………………………………………
42<br />
5 & VªSd IykV dk izk:i<br />
¼lzksr vkckfn;k¡% ckk fjtoZ] lajf{kr {ks=½<br />
ckkksa dh lzksr tula[;k dh xgu fuxjkuh ds ,d Hkkx ds :i esa izR;sd chV esa izs”kj bEizs”ku iSM ¼ihvkbZih]<br />
VªSd IykWV~l½ ls MkVk fjdkMZ fd;k tk;sxkA<br />
izR;sd chV esa] de ls de ikap ih-vkbZih- dks LFkk;h :i ls vuqjf{kr fd;k tk;sxkA ih-vkbZ-ih- dh<br />
eki Ng ehVj yEckbZ ls de ugha gksxh rFkk yEckbZ o pkSM+kbZ] iSny jkLrs] taxy Vªsy rFkk lw[ks ukys<br />
dh pkSM+kbZ ds leku gksus pkfg,] ftlij ih-vkbZ-ih- cuk;k x;k gksA lHkh ih-vkbZ-ih- ds th-ih-,lfunsZ”kkadksa<br />
dks fjdkMZ djus dh vko”;drk gSA<br />
chV ds Hkhrj ihvkbZih ds LFkku bl izdkj gksuk pkfg, fd mlls ekalHkf{k;ksa ds VªSDl ds fjdkMZ dh<br />
vf/kd ls vf/kd laHkkouk gksA nks ih-vkbZ-ih- ds chp de ls de 1-5 fdeh- dh nwjh gksuh pkfg,A<br />
ih-vkbZ-ih- dks dwM+k&djdV] lM+s iRrksa rFkk dadM+&iRFkj gVk dj lkQ fd;k tkuk pkfg, rFkk mls<br />
ckjhd feV~Vh ls yxHkx 0-5 ls-eh- dh xgjkbZ rd
43<br />
izi=&5<br />
ekalHkf{k;ksa rFkk cM+s r`.kHkf{k;ksa ds fy, VªSd IykWV~l<br />
¼izs”kj bEizs”ku iSM½<br />
ladyudRrkZ % ------------------------------------------ fnukad % ------------------------------------------ oueaMy% ------------------------------ jsat % -----------------------------------<br />
chV % ----------------------------------------------------------- Vªk¡ts+DV ykbu Øekad % -----------------------------------------------<br />
ih-vkbZ-ih la[;k<br />
ou dk izdkj<br />
HkwHkkx dk izdkj<br />
ckk<br />
Rsanqvk<br />
jhN<br />
44<br />
6 - Patrol Data<br />
This data set is to be collected while the forest staff is on routine patrol duty. The purpose of<br />
the data is to provide the Wildlife Manager with information on spatial coverage of patrols,<br />
locations of crimes <strong>and</strong> illegal activities, wildlife mortality <strong>and</strong> sightings (direct <strong>and</strong><br />
indirect) of rare, threatened <strong>and</strong> indicator species. Once data are collected <strong>and</strong> entered in<br />
the software, spatial <strong>and</strong> temporal patterns <strong>and</strong> trends for the above mentioned parameters<br />
can be analysed for patrol effort in relation to comparable data on disturbance activity <strong>and</strong><br />
animal abundance, <strong>and</strong> to incorporate the results of these analyses in the tactical planning<br />
for security <strong>and</strong> management purposes.<br />
<br />
<br />
<br />
<br />
<br />
<br />
While on a patrol (foot, vehicle, elephant, boat etc), use a h<strong>and</strong> hold GPS unit in “log<br />
track” mode to record the patrol route.<br />
If expertise on GPS use is not available then simply record the GPS coordinates<br />
every 30 minutes on a foot patrol. For vehicle based patrols the road travelled<br />
should also be marked on the park map using a GPS unit. This data should be<br />
downloaded onto a computer <strong>and</strong> recorded in the database with rest of the patrol<br />
information.<br />
Record (with coordinates) any illegal activity observed by you while on the patrol<br />
<strong>and</strong> also record approximately how long it has been since the illegal activity took<br />
place, <strong>and</strong> the action taken (if any).<br />
Illegal activities can include signs of wood cutting, lopping of fodder branches,<br />
grass <strong>and</strong> bamboo cutting, livestock grazing, campsite, snare, trap, poachers seen,<br />
gunshots heard, fishing, fire, NTFP collection (NTFP specify what is collected in<br />
remarks).<br />
Record all wildlife mortality observed (with coordinates) along with probable<br />
cause of death.<br />
Record sightings of all endangered species occurring in your park (with<br />
coordinates) in the prescribed format (see data sheet). It is important to try to count<br />
the number of animals in the group as accurately as possible. Animals are<br />
considered to belong to two different groups if the closest animals from the two<br />
groups are separated by a distance of over 30m.
45<br />
Data Sheet-6<br />
Patrol Form<br />
Name of Guard: …………………. Date: …………… Forest Division…………..… Range: ………….…….<br />
Beat: …………………………….. No. of Persons on Patrol: ……… Armed……………. Unarmed…………………..<br />
Patrol Type: General Duties, Investigations, Surveillance, Others Patrol Method: Foot, Jeep, Motorbike, Bicycle, Elephant <strong>and</strong><br />
Others<br />
Lat Long Illegal Activities Animal Mortality Records<br />
Time<br />
Animal<br />
species<br />
seen<br />
Group<br />
size seen<br />
Deg<br />
Min<br />
Sec<br />
Deg<br />
Min<br />
Sec<br />
Type<br />
Time<br />
elapsed<br />
Details<br />
Action<br />
taken<br />
Data<br />
Place<br />
Species<br />
Gender<br />
(M/F/Un)<br />
Age<br />
(Y/Ad/Un)<br />
Carcass<br />
state<br />
Cause of<br />
death<br />
Samples<br />
taken<br />
M – Male, F – Female, Un – Unknown, Y – Young, Ad – Adult.
46<br />
6 & iSVªksy MkVk<br />
bl MkVk lzksr dks ml le; laxzfgr fd;k tkuk pkfg, tc ou deZpkjh viuh nSfud x”r M~;wVh ij jgrs<br />
gSaA bl MkVk dk mn~ns”; oU;tho izca/kdksa dks] x”r ds LFkkuh; {ks=] vijk/k ds {ks= rFkk xSj dkuwuh<br />
xfrfof/k;ksa rFkk oU;thoksa dh e`R;qrk lEcU/kh lwpuk ,oa nqyZHk] ladVxzLr rFkk lwpd izk.kh tkfr;ksa ds ns[ks<br />
tkus ¼izR;{k vkSj vizR;{k½ ds ckjs esa tkudkjh miyC/k djkuk gSA tc ,d ckj MkVk ds laxzg.k rFkk lkWVos;j<br />
esa ,UVªh dk dk;Z iwjk gks tk;s] rc uhfr ,oa izca/ku mn~ns”;kas ds fy,] mijksDr of.kZr iSjkehVlZ ds fy, LFkkfud]<br />
vYidkfyd i)fr;ksa rFkk rjhdksa dk fo”ys’ k.kfd;k tk ldrk gS vkSj lqj{kk ,oa mn~ns ;ksa ds fy;s prqjkbZiw.kZ<br />
fu;kstu esa bu fo ys k.kksads ifj.kkeksa dks kkfey djuk gSA<br />
<br />
<br />
<br />
<br />
<br />
<br />
x”r ¼iSny] okgu] gkFkh] uko vkfn ls½ ds le; x”r ds ekxZ esa cus yEcs VSªd dks fjdkMZ djus ds fy,<br />
gkFk esa idM+s tkus ;ksX; th-ih-,l- dk iz;ksx djuk pkfg,A<br />
;fn th-ih-,l- dk iz;skx djuk ugha vkrk gks rks iSny x”r ds le; izR;sd vk/ks kaVs esa th-ih-,lfunsZ<br />
kk¡d dks lk/kkj.k rjhds ls fjdkMZ fd;k tkuk pkfg,A okgu ij x”r yxkus ds fy, ftl jkLrs<br />
ls vki tk jgs gSa] ml ekxZ dks ikdZ ds uD”ks ij fpfUgr fd;k tkuk pkfg,A bl MkVk dks dEI;wVj esa<br />
MkmuyksM fd;k tkuk pkfg, vkSj MkVkcsl esa miyC/k ”ks klwpukvksa ds lkFk ntZ fd;k tkuk pkfg,A<br />
x”r ds le; ;fn vkidks dksbZ xSj dkwuuh fØ;kdyki ¼xfrfof/k½ fn[kkbZ ns rks mls fjdkMZ<br />
¼funsZ kk¡dksa lfgr½ fd;k tkuk pkfg, rFkk ml ij dh xbZ dkjZokbZ ¼;fn dksbZ gks½ dks fjdkMZ djsaA<br />
lkFk gh xSj dkuwuh fØ;kdyki gksus dh vof/k dk Hkh mYys[k djsaA<br />
xSj dkwuuh xfrfof/k;ksa esa vxzfyf[kr dks ”kkfey fd;k tk ldrk gS & ydM+h dh dVkbZ] pkjs ds fy,<br />
NksVh Vgfu;ksa dh dkaV&NkaV] kkl o ckal dh dVkbZ] i”kqvksa dh pjkbZ] f kfoj LFky] tky]<br />
pksj&QUnk] ns[ks x;s f”kdkjh] lqukbZ nh tkus okyh cUnwd dh vkokt] eNyh idM+uk] vkx]<br />
,uVh,Qih laxzg.k ¼,u-Vh-,Q-ih& laxzg.k dh fVIi.kh esa Li’ Vdjsa½A<br />
x”r ds nkSjku lHkh izdkj dh oU;tho e`R;qrk ¼funsZ kk¡dksa lfgr½ dks mldh e`R;q ds laHkkfor dkj.kksa<br />
lfgr fjdkMZ djsaA<br />
vkids ikdZ esa ikbZ tkus okyh lHkh ladVxzLr izk.kh tkfr;ksa ds ns[ks tkus dks ¼funsZ kk¡dksa lfgr½<br />
fu/kkZfjr izi= ¼MkVk khV ns[ksa½ esa ntZ djsaA ;g egRoiw.kZ gS fd lewg esa ekStwn tkuojksa dh] ;FkklEHko<br />
lVhd la[;k dh x.kuk dh tk;sA ;fn nks utnhdh lewgksa ds tkuojksa ds chp dh nwjh 30 eh0 ls<br />
vf/kd gS] rks mUgsa nks vyx lewgksa ds :i esa fcuk tk;sA
47<br />
izi=& 6<br />
iSVªksy izi=<br />
xkMZ dk uke% --------------------------- fnukad% --------------------------------------- ou e.My% ----------------------------------jsat%------------------------------------------ chV% -------------------------------------<br />
x”r ij O;fDr;ksa dh la[;k% ------------------- gfFk;kjcan-------------------- xSj gfFk;kjcan-----------------------<br />
x”r dk izdkj % lkekU; M~;wVh] tkap iM+rky] fuxjkuh ij] vU;x”r dk lk/ku % iSny] thi] eksVj lkbfdy] lkbfdy] gkFkh] vU;<br />
MkVk le;<br />
v{kka”k ns”kkUrj xSj dkuwuh xfrfof/k;ka oU;thoksa dh e`R;qrk dk fjdkMZ<br />
LFkku<br />
fMxzh fe0 lS0 fMxzh fe0 lS0<br />
ns[ks<br />
x;s<br />
tkuoj<br />
ns[ks<br />
x;s<br />
lewg<br />
iztkfr<br />
izdkj le;<br />
O;rhr<br />
fd;k<br />
fooj.k dh xbZ<br />
dkjZokbZ<br />
fyax ¼uj]<br />
eknk]<br />
vKkr½<br />
vk;q ¼”kkod]<br />
o;Ld] vKkr<br />
dadky<br />
dh<br />
fLFkfr<br />
ekSr<br />
dk<br />
dkj.k<br />
fy;s<br />
x;s<br />
uewus
48<br />
Appendix-I Major ungulate species<br />
I:<br />
ifjf”k’ V&<br />
eq[; taxyh pkSik;sa<br />
Chital phry<br />
Sambar lkaHkj<br />
Nilgai uhyxk; Gaur xkSj<br />
Chinkara fpadkjk Chowsingha pkSflakk
49<br />
Hog Deer ikMk Mouse Deer ewlk fgju<br />
Barasingha ckjkflakk<br />
Wild Pigs taxyh lqvj<br />
Blackbuck dkyk e`x<br />
Barking Deer dkdM+ ¼HksMdh½
50<br />
Appendix-II : Tracks of major carnivores<br />
ifjf”k’ V& II :<br />
eq[; ekalHk{kh tkuojksa ds infpUg<br />
6 in.<br />
Tiger ckk<br />
Leopard rsUnqvk<br />
3.5 in.<br />
Hyaena ydM+cXkk Dhole lksudqÙkk Jackal xhnM+<br />
7 in.<br />
Sloth Bear Hkkyw
51<br />
Appendix-III : Fecal pellets of wild ungulates <strong>and</strong> <strong>their</strong> characteristics<br />
Sambar<br />
Though sambar occur in most forested areas, <strong>their</strong> preferred habitat is forested hilly areas<br />
with ample water availability. Their fecal pellets are characterized by a barrel shape, the<br />
base of which is flattened to concave in shape. The tip of the pellet tapers to a flattish point.<br />
Adult sambar pellets range in size from 1.5 to 2cm in length <strong>and</strong> 0.8 to 1.4cm in diameter.<br />
Small size pellets from young sambar can sometimes be confused with chital pellets due to<br />
overlap in size.<br />
Chital<br />
Chital are restricted to flattish or undulating forested terrain. They normally avoid steep<br />
hilly terrain. Their fecal pellets are cylindrical with the bottom end rounded <strong>and</strong> the apical<br />
region tapering to a point. Adult chital pellets range in size from 1.2 to 1.8cm, but are much<br />
slender in comparison to sambar <strong>and</strong> nilgai pellets. In degraded areas chital pellets can be<br />
confused with goat pellets.<br />
Nilgai<br />
Nilgai occur in open forests, scrub <strong>and</strong> thorn jungle, <strong>and</strong> degraded areas. They can also be<br />
found at low densities in prime forests. Nilgai have a tendency to defecate at fixed latrine<br />
sites forming dung piles. The fecal pellets of nilgai are similar in size to sambar but are<br />
distinguished by a cylindrical shape with flat or smooth angular surfaces. The base of nilgai<br />
pellets is not as flat as that of sambar. Adult nilgai pellets 1.5 to 2cm in length with a<br />
diameter of 1 to 1.4cm on the average. The color is often dark brown to blackish.<br />
Barking Deer<br />
Barking deer pellets are likely to be found throughout forested areas except in dry forested<br />
tracts. The fecal pellets are elongated <strong>and</strong> crinkled often with a twisted look <strong>and</strong> dented<br />
surface. The pellets taper towards both ends giving a spindle shape, the tips vary from<br />
being long <strong>and</strong> hook like to blunt. In a clump it is often common to encounter a large<br />
variation in size <strong>and</strong> shape between individual pellets from the same animal. They range in<br />
size between 1 to 1.8cm <strong>and</strong> about 0.4 to 0.7 cm in diameter.
52<br />
Chowsingha<br />
Chowsingha pellets are small in size. They vary in shape, being ovoid or slightly elongated.<br />
The length of the pellets vary between 0.6 to 1.2cm <strong>and</strong> the diameter is between 0.6 to 0.8cm.<br />
There is a distinct habitat separation between chowsingha <strong>and</strong> blackbuck <strong>and</strong> therefore<br />
there is less likelyhood of confusing the pellets of the two species. Often habitats of chital,<br />
chowsingha <strong>and</strong> barking deer may overlap.
53<br />
ifjf”k’ V& III :<br />
pkSik;ksa dk xkscj vkSj muds y{k.k<br />
lkaHkj<br />
lkaHkj T;knkrj ou {ks=ksa esa ik;k tkrk gS] ijUrq mudh cgqrk;kr ikuh okys igkM+h {ks=ksa esa gksrh gSA lkaHkj dk<br />
xkscj cSjy ds vkdkj dk gksrk gSA ysf.M;ka ,d rjQ mHkjh gqbZ vkSj xksykdkj gksrh gSa] mldh yEckbZ 1-5&2 lseh-<br />
,oa O;kl 0-8&1-4 ls-eh- gksrk gSA lkaHkj ds NksVs cPps dh ysf.M;ka phry ls yxHkx leku gksrh gS ijUrq<br />
Åij fn;s x;s fooj.k ls lkaHkj dks igpkuuk vklku gksxkA uhyxk; dh ys.Mh yxHkx o;Ld lkaHkj ds leku<br />
gh gksrh gS ijUrq lkaHkj vkSj uhyxk; esa oklLFky vyx gksus ls nksuksa iztkfr;kas dks ,d txg gksus dh lEHkkouk<br />
de gksxhA<br />
phry<br />
phry vf/kdrj lery ;k e/;e mrkj&p
54<br />
Appendix-III : Fecal pellets of wild ungulates <strong>and</strong> <strong>their</strong> characteristics<br />
ifjf”k’ V& III :<br />
pkSik;ksa dk xkscj vkSj muds y{k.k<br />
Sambar lkaHkj<br />
Chital phry<br />
Nilgai uhyxk;<br />
Barking Deer kqVjh ¼HksM+dh½<br />
Chowsingha pkSflakk
55<br />
Appendix-IV<br />
Acknowledgements: Shri P.R. Sinha, Dr. V.B. Mathur, Dr. Anil Bhardwaj, Shri K.K.<br />
Shrivastava, Ms. Bitapi Sinha, Ms. Babita Sharma,<br />
Shri Virendra Sharma <strong>and</strong> Shri Kuldeep Chauhan.<br />
Photo Credits:<br />
Subharghya Das (cover), Q. Qureshi, Y.V. Jhala, Bitapi C.<br />
Sinha, Umesh Tiwari, Joseph Vattakaven, Md. Zahir, Suresh<br />
Chowdhary, Kuldeep Barwal
56<br />
Appendix-V : Vulture Data Sheet<br />
Readers Name & Signature:…………<br />
Forest circle:…………………<br />
Range:………………………<br />
Forest type:…………………….…<br />
Date:…………………….<br />
Forest division:……………<br />
Beat:…………….…………<br />
Terrain Type:.……….…<br />
Sl.<br />
No.<br />
1.<br />
2.<br />
3.<br />
4..<br />
5.<br />
6.<br />
7.<br />
8.<br />
9.<br />
10.<br />
11.<br />
12.<br />
Vulture Species<br />
Seen (if Possible)<br />
*<br />
Number<br />
Activity Flying/<br />
Roosting/<br />
Feeding<br />
Remarks<br />
* Mention species identity only if you are sure, otherwise mention large or small vulture,<br />
red head, or other description of colour in remarks column.<br />
1. Are you aware of any vulture deaths in your beat within the past 3 years Yes / No.<br />
2. Are there any active vulture nests in your beat Yes / No.<br />
If yes, How many …………. On trees ………………, on hills / cliffs……………….
57<br />
ifjf”k’ V& V:<br />
fx) izi=<br />
vafdr djus okys dk uke ,oa gLrk{kj %--------------------------- frfFk% ---------------------------------<br />
ou izHkkx% -------------------------------------------------- {ks=% -------------------------------------<br />
x”r dk bykdk ¼chV½% ------------------------ ou vkdkj% -----------------------<br />
HkkSxksfyd izns”k dk izdkj % ---------------------------------------<br />
Ø- fx) iztkfr;k¡ ns[kh xbZa<br />
¼;fn laHko gks½ *<br />
1-<br />
2-<br />
3-<br />
4-<br />
5-<br />
6-<br />
7-<br />
8-<br />
9-<br />
10-<br />
la[;k<br />
xfrfof/k;k¡ mM+ku ds le;@<br />
clsjs esa@Hkkstu ds le;<br />
fVIi.kh<br />
* ;fn vkius HkyhHkkafr lqfuf”pr dj fy;k gS] rHkh iztkfr dh igpku dk mYys[k djsa] vU;Fkk cM+k ;k<br />
NksVk fx)] yky flj] ;k vU; fooj.kksa dk mYys[k fVIi.kh ds vUrxZr djsaA<br />
1½<br />
D;k vkidks vius x”r ds bykds esa foxr rhu o’kksZa ds nkSjku gqbZ fdlh fx) dh ekSr dh<br />
tkudkjh gS <br />
gk¡@ugha<br />
2½ D;k vkids x”r ds bykds esa fx) ds dksbZ lfdz; clsjs ¼kksalys½ gSa <br />
;fn gk¡] rks fdrus ----------------------------------------o`{kksa ij --------------------------------------------] igkfM+;ksa@[kM+h<br />
pV~Vkuksa ij -----------------------------------------------------
58<br />
Appendix-VI : Initialization Procedure for GPS Units<br />
1) Step 1: Press red button to switch on the GPS unit<br />
2) Leave the unit on in view of the open sky for 15-20 minutes when first switched<br />
on after several days.<br />
3) Go to main menu by pressing Page button or Menu button depending on the GPS<br />
unit.<br />
4) Select Setup from the Sub menu<br />
5) Select Navigation from the Setup menu<br />
6) Highlight position/location menu by pressing enter<br />
7)<br />
o<br />
Use arrow keys to scroll through the options <strong>and</strong> select hddd MM’SS.S”<br />
8) Now Highlight Map Datum <strong>and</strong> select WGS 84 by pressing enter <strong>and</strong> scrolling<br />
through by the arrow keys.<br />
9) Highlight units <strong>and</strong> select metric units (in the same way as done above).<br />
10) Highlight Heading <strong>and</strong> select True orAuto.<br />
11) Quit the Navigation Menu<br />
12) Select system setup <strong>and</strong> set date, time etc. (the Indian time is +5:30 hrs offset<br />
from GMT). In offset feed in +5:30 to get correct local time displayed by the GPS<br />
unit instead of the GMT time.<br />
13) Report the GPS coordinates in degrees, minutes <strong>and</strong> seconds in decimals.
59<br />
ifjf”k’ V&VI : th-ih-,l- mi;ksx gsrq funsZ”k<br />
1½ igyk dne% th-ih-,l- ;wfuV dks pkyw ¼ij dk;Z½ djus ds fy;s yky cVu nck;saA<br />
2½ ;fn ;wfuV dks dbZ fnuksa ds i”pkr igyh ckj pkyw fd;k x;k gS] rc mls [kqys vkleku ds<br />
uhps pkyw djds 15&20 fefuV ds fy;s NksM+ nsaA<br />
3½ th-ih-,l- ;wfuV ds vuqlkj ns[krs gq, eq[; esU;w esa tkus ds fy;s ist cVu ;k esU;w cVu<br />
nck;saA<br />
4½ lc esU;w ls lsV vi dks pqusaA<br />
5½ lsVvi esU;w ls usohxs”ku dks pqusaA<br />
6½ ,UVj cVu ds }kjk fLFkfr@LFkku esU;w dks izdkf”kr djsaA<br />
7½ fodYiksa dks tkuus ds fy;s ,jks ¼rhj½ cVuksa dk mi;ksx djsa ,oa hddd° MM’ SS.S” dk<br />
p;u djsaA<br />
8½ vc ekufp= ds Kkr rF;ksa ij izdk”k Mkysa vkSj ,UVj cVu ds }kjk WGS 84 dks pqusa ,oa ,jks<br />
¼rhj½ cVuksa ds }kjk tkudkjh ysaA<br />
9½ ;wfuVksa ij izdk”k Mkysa ,oa ehfVªd ;wfuVksa dks pqusa ¼Bhd mlh rjg tSlk Åij fd;k gS½A<br />
10½ “kh’kZd dks izdkf”kr djsa ,oa ^Vªw* ;k ^vkWVks* dks pqusaA<br />
11½ usohxs”ku esU;w ls ckgj vk;saA<br />
12½ flLVe lsVvi dks pqusa vkSj frfFk] le; bR;kfn dks Bhd dj ysa ¼Hkkjrh; le;] xzhufop ehu<br />
Vkbe ¼th-,e-Vh-½ ls $5%30 k.Vs vkxs jgrk gS½A th-,e-Vh- le; ds LFkku ij th-ih-,l-<br />
;wfuV }kjk lgh LFkkuh; le; tkuus ds fy;s vkWQlsV esa $5%30 HkjsaA<br />
13½ th-ih-,l- funsZ”kkadksa dks fMxzh] fefuV ,oa lsd.M dks n”keyo esa fjiksVZ djsaA