Lab 9: The Effects of Sea Level Changes
Lab 9: The Effects of Sea Level Changes
Lab 9: The Effects of Sea Level Changes

Create successful ePaper yourself
Turn your PDF publications into a flip-book with our unique Google optimized e-Paper software.
SJSU Geol 4L Planet Earth <strong>Lab</strong> <strong>Lab</strong> 9 p. 1 <strong>of</strong> 7<br />
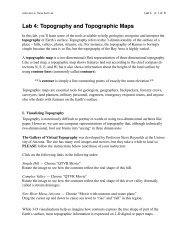
<strong>Lab</strong> 9: <strong>The</strong> <strong>Effects</strong> <strong>of</strong> <strong>Sea</strong> <strong>Level</strong> <strong>Changes</strong><br />
In this lab, we will investigate the effects on Earth and its inhabitants <strong>of</strong> rising sea level.<br />
_____________________________________________________________________________<br />
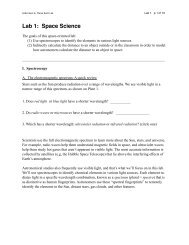
I. <strong>The</strong> World’s Oceans & <strong>Sea</strong>s<br />
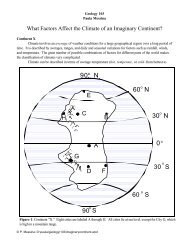
Before we investigate the effects <strong>of</strong> sea level, we’ll review the locations <strong>of</strong> major bodies <strong>of</strong> water<br />
around the globe. <strong>Lab</strong>el the following features on the map on the next page using the abbreviations<br />
in parentheses. Clues are provided to help you determine the locations <strong>of</strong> most <strong>of</strong> them.<br />
Atlantic Ocean (AtO)<br />
Pacific Ocean (PO)<br />
Indian Ocean (IO)<br />
Arctic Ocean (ArO)<br />
Persian Gulf (PG)<br />
Red <strong>Sea</strong> (RS)<br />
Gulf <strong>of</strong> Califorrnia (GC)<br />
Bering <strong>Sea</strong> (BS)<br />
Caribbean <strong>Sea</strong> (CbS)<br />
Mediterranean <strong>Sea</strong> (MS)<br />
Gulf <strong>of</strong> Mexico (GM)<br />
Caspian <strong>Sea</strong> (CS)<br />
Hudson Bay (HB)<br />
You shouldn’t need a clue for this one.<br />
Ditto for this one.<br />
<strong>The</strong> smallest <strong>of</strong> the three main oceans.<br />
Some geographers don’t consider it a real ocean; it’s covered with<br />
ice for much <strong>of</strong> the year.<br />
Oil-rich, bordered by Kuwait, Saudi Arabia, Iraq, and Iran.<br />
Contains a young divergent plate boundary.<br />
Separates Baja from the rest <strong>of</strong> Mexico; aka the <strong>Sea</strong> <strong>of</strong> Cortes.<br />
Not far from the Bering Strait.<br />
Bounded by Cuba, Venezuela, and Central America.<br />
You should know this one.<br />
Oil-rich, much to the delight <strong>of</strong> Texans and Mexicans<br />
Not really a sea, but a huge landlocked lake near Azerbaijan.<br />
O-h-h-h, Ca-a-nada-a-a-a.
SJSU Geol 4L Planet Earth <strong>Lab</strong> <strong>Lab</strong> 9 p. 2 <strong>of</strong> 7
SJSU Geol 4L Planet Earth <strong>Lab</strong> <strong>Lab</strong> 9 p. 3 <strong>of</strong> 7<br />
II. Causes <strong>of</strong> <strong>Sea</strong>-<strong>Level</strong> Change<br />
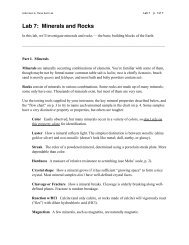
Many types <strong>of</strong> geologic studies indicate that<br />
global sea level must have changed many times in<br />
the past, at times higher and at times lower than<br />
current sea level. For instance, the drowned river<br />
channels that are cut into the floors <strong>of</strong> San Francisco<br />
Bay and San Pablo Bay (diagram at right)<br />
must have formed when sea level was lower and<br />
the ocean coastline was west <strong>of</strong> the Golden Gate.<br />
<strong>The</strong> entire bay system is a back-flooded stream<br />
drainage.<br />
A. Why would sea level change<br />
Three possible reasons are climate, plate tectonics, and pumping.<br />
1. Climate change: When air temperature decreases, less glacial ice melts, glaciers grow<br />
in thickness and extent, and sea level falls (a “glacial” period). Conversely, warmer air<br />
temperatures melt glaciers and raise sea level (an “interglacial”—our current situation).<br />
2. Plate tectonics: <strong>The</strong> Earth’s surface may be pushed up or down by forces acting at plate<br />
boundaries. For example, the northern edge <strong>of</strong> Australia is colliding with Indonesian islands,<br />
shoving them upward and causing a drop in sea level from the islands’ perspective.<br />
3. Pumping: Pumping <strong>of</strong> underground water or hydrocarbons (gas, oil) can cause the land<br />
surface to sink. If this happens along a coastline, water will flood the sinking region,<br />
causing a rise in sea level from the land’s perspective.<br />
1. Which <strong>of</strong> the three reasons describe above, acting on its own, i.e., independently <strong>of</strong> the other<br />
two reasons, could cause sea-level rise in the following combinations <strong>of</strong> coastal areas<br />
1 2 3 Antarctica<br />
1 2 3 Florida<br />
1 2 3 San Francisco Bay area<br />
1 2 3 Antarctica, San Francisco Bay area<br />
1 2 3 Florida, San Francisco Bay Area<br />
1 2 3 Antarctica, Florida, San Francisco Bay Area
SJSU Geol 4L Planet Earth <strong>Lab</strong> <strong>Lab</strong> 9 p. 4 <strong>of</strong> 7<br />
III. Impacts <strong>of</strong> <strong>Sea</strong> <strong>Level</strong> Rise<br />
A. Beringia and Immigration to North America<br />
<strong>The</strong> two maps below show the modern ranges <strong>of</strong> reindeer and caribou. Unlike large mammals at<br />
lower latitudes, which tend to have geographically limited ranges, reindeer and caribou are found<br />
over a huge range—the entire width <strong>of</strong> two separate continents. <strong>The</strong>ir puzzlingly broad range can<br />
be explained by considering changes <strong>of</strong> sea level.<br />
Asia and North America are separated by the narrow, shallow Bering Strait—but remember that<br />
Earth currently is in an interglacial period. During glacial periods, sea level drops and Eurasia<br />
and North America are connected as a single continent. Over many glacial-interglacial cycles,<br />
many land animals have been able to migrate back and forth across the exposed low-lying land<br />
connection, which is known as Beringia (buh-RIN-jee-ah).<br />
Reindeer and caribou weren’t the only animals to cross Beringia. Most anthropologists think that<br />
the ancestors <strong>of</strong> Native Americans migrated on foot from Asia to North America via Beringia.<br />
Examine the maps on Plate 5, which show reconstructions <strong>of</strong> Beringia starting 13,000 years ago.<br />
1. When would the migration route have become impassable due to rising sea level (circle one)<br />
a. 12,000 to 11,000 years ago b. 11,000 to 10,000 years ago<br />
c. 10,000-9,000 years ago d. 9,000-8,000 years ago<br />
2. During which 1000-year period was the most land area flooded<br />
a. 13,000 to 12,000 years ago b. 12,000 to 11,000 years ago<br />
c. 10,000-9,000 years ago d. 9,000-8,000 years ago<br />
3. Why wasn’t the land surface covered at a constant rate Briefly explain two possible reasons.
SJSU Geol 4L Planet Earth <strong>Lab</strong> <strong>Lab</strong> 9 p. 5 <strong>of</strong> 7<br />
B. California During and Since the Last Ice Age<br />
Consult the color maps (Plates 4 and 6) that show modern California and late Pleistocene California<br />
(about 18,000 years ago, at the height <strong>of</strong> the last Ice Age). Light green areas on the late<br />
Pleistocene map were exposed continental land surfaces.<br />
1. Briefly contrast the late Pleistocene and modern geography and water resources <strong>of</strong>:<br />
a. Coastal California<br />
b. <strong>The</strong> Central Valley (Sacramento & San Joaquin)<br />
c. <strong>The</strong> Sierra Nevada, and the region east <strong>of</strong> the southern Sierra Nevada
SJSU Geol 4L Planet Earth <strong>Lab</strong> <strong>Lab</strong> 9 p. 6 <strong>of</strong> 7<br />
2. On this 1895 map, what geographic feature is shown south <strong>of</strong> Hanford in Kings County<br />
(southeastern corner <strong>of</strong> the map) _________________________<br />
3. Is this feature on the late Pleistocene map __________<br />
4. Is it on the modern map ________<br />
5. Suggest an explanation for the change in this feature’s appearance over time.
SJSU Geol 4L Planet Earth <strong>Lab</strong> <strong>Lab</strong> 9 p. 7 <strong>of</strong> 7<br />
C. <strong>Sea</strong>-level Rise in the South Bay<br />
Use the 11” x 17” excerpt <strong>of</strong> the topographic map <strong>of</strong> Mountain View, CA. <strong>The</strong> contour interval<br />
<strong>of</strong> this map is 5’ (5 feet).<br />
1. Using a colored pencil, shade in all areas that have elevations <strong>of</strong> 20’ or lower (this will include<br />
the salt evaporation ponds in the bay).<br />
<strong>The</strong> area you have shaded shows the effect <strong>of</strong> a 20-foot-rise in sea level if humans<br />
were unable or unwilling to construct sufficient dikes to keep the water out.<br />
2. Find each <strong>of</strong> the following six features on the map. Circle (in the list below, not on the map)<br />
those that would be affected by rising sea level:<br />
Runways at M<strong>of</strong>fett Field<br />
Shoreline <strong>The</strong>ater (Shoreline at MV Park)<br />
Sunnyvale Municipal Golf Course Intersection <strong>of</strong> San Antonio Rd. and U.S. 101<br />
Sunnyvale Baylands Park<br />
<strong>The</strong> aqueduct near U.S. 101 in Sunnyvale<br />
3. Use a different color or pattern to show the area that lies between the 20’ and 40’ contours.<br />
This shows the additional area that would be flooded if sea level rose another 20’.<br />
4. Which increment <strong>of</strong> sea-level rise affected a larger area Circle one:<br />
a. the first 20-foot rise (from 0’ to 20’) b. the second 20-foot rise (from 20’ to 40’)<br />
5. In complete sentences, explain why the two 20-foot rises covered different areas.