Fact Book Document 2003-2004 - West Virginia Wesleyan College
Fact Book Document 2003-2004 - West Virginia Wesleyan College Fact Book Document 2003-2004 - West Virginia Wesleyan College
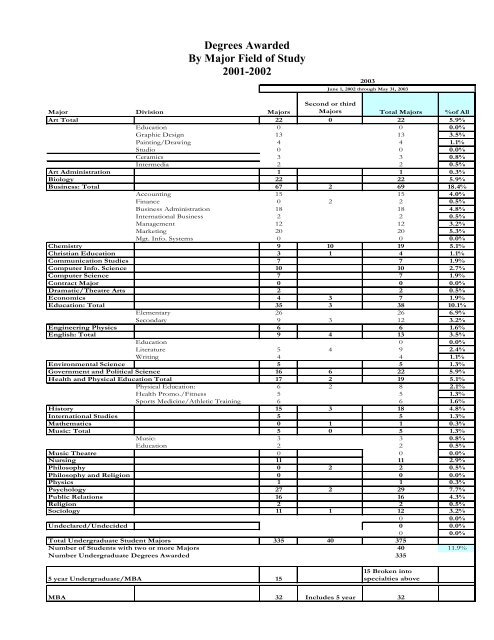
Degrees Awarded By Major Field of Study 20012002 2003 June 1, 2002 through May 31, 2003 Major Division Majors Second or third Majors Total Majors %of All Art Total 22 0 22 5.9% Education 0 0 0.0% Graphic Design 13 13 3.5% Painting/Drawing 4 4 1.1% Studio 0 0 0.0% Ceramics 3 3 0.8% Intermedia 2 2 0.5% Art Administration 1 1 0.3% Biology 22 22 5.9% Business: Total 67 2 69 18.4% Accounting 15 15 4.0% Finance 0 2 2 0.5% Business Administration 18 18 4.8% International Business 2 2 0.5% Management 12 12 3.2% Marketing 20 20 5.3% Mgt. Info. Systems 0 0 0.0% Chemistry 9 10 19 5.1% Christian Education 3 1 4 1.1% Communication Studies 7 7 1.9% Computer Info. Science 10 10 2.7% Computer Science 7 7 1.9% Contract Major 0 0 0.0% Dramatic/Theatre Arts 2 2 0.5% Economics 4 3 7 1.9% Education: Total 35 3 38 10.1% Elementary 26 26 6.9% Secondary 9 3 12 3.2% Engineering Physics 6 6 1.6% English: Total 9 4 13 3.5% Education 0 0.0% Literature 5 4 9 2.4% Writing 4 4 1.1% Environmental Science 5 5 1.3% Government and Political Science 16 6 22 5.9% Health and Physical Education Total 17 2 19 5.1% Physical Education: 6 2 8 2.1% Health Promo./Fitness 5 5 1.3% Sports Medicine/Athletic Training 6 6 1.6% History 15 3 18 4.8% International Studies 5 5 1.3% Mathematics 0 1 1 0.3% Music: Total 5 0 5 1.3% Music: 3 3 0.8% Education 2 2 0.5% Music Theatre 0 0 0.0% Nursing 11 11 2.9% Philosophy 0 2 2 0.5% Philosophy and Religion 0 0 0.0% Physics 1 1 0.3% Psychology 27 2 29 7.7% Public Relations 16 16 4.3% Religion 2 2 0.5% Sociology 11 1 12 3.2% 0 0.0% Undeclared/Undecided 0 0.0% 0 0.0% Total Undergraduate Student Majors 335 40 375 Number of Students with two or more Majors 40 11.9% Number Undergraduate Degrees Awarded 335 5 year Undergraduate/MBA 15 15 Broken into specialties above MBA 32 Includes 5 year 32
200203 Graduating Degrees by Major Field of Study with 1999 2003 Minimum to Maximum Range 75 70 65 # Graduates 60 55 50 45 40 35 30 25 20 15 10 5 0 Minimum Maximum Business: Total Education: Total Psychology Government and Political Science Biology Art Total Health and Physical Education Total Chemistry History Public Relations English: Total Sociology Nursing Computer Info. Science Economics Computer Science Communication Studies Engineering Physics Music: Total International Studies Environmental Science Christian Education Religion Philosophy Dramatic Arts Physics Mathematics Arts Administration Philosophy and Religion Music Theatre Contract Major MBA (including 5 yr) 20022003
- Page 1 and 2: Fact Book 20032004 Seventh Editio
- Page 3 and 4: Table of Contents Mission and Organ
- Page 5 and 6: WEST VIRGINIA WESLEYAN COLLEGE Stat
- Page 7 and 8: Board of Trustees, Administrative E
- Page 9 and 10: All others offering formal instruct
- Page 11 and 12: The Vice Chair of the Faculty shall
- Page 13 and 14: 1. The council shall recommend cand
- Page 15 and 16: 3. The council shall be responsible
- Page 17 and 18: Fall 2003 New Students 17
- Page 19 and 20: Fall 19982002 FullTime Freshmen
- Page 21 and 22: Fall 2003 Student Body 21
- Page 23 and 24: West Virginia Wesleyan College Unde
- Page 25 and 26: Fulltime and Parttime Undergrad
- Page 28 and 29: CAMPUS ACTIVITIES & ORGANIZATIONS O
- Page 30 and 31: West Virginia Wesleyan College Fall
- Page 34 and 35: Faculty and Staff
- Page 36 and 37: West Virginia Wesleyan College Facu
- Page 38 and 39: West Virginia Wesleyan College Facu
- Page 40 and 41: West Virginia Wesleyan College Empl
- Page 42 and 43: Finances 42
- Page 44 and 45: Tuition and Required Fees Peer and
- Page 46 and 47: West Virginia Wesleyan College Expe
- Page 48 and 49: West Virginia Wesleyan College Admi
Degrees Awarded<br />
By Major Field of Study<br />
20012002<br />
<strong>2003</strong><br />
June 1, 2002 through May 31, <strong>2003</strong><br />
Major Division Majors<br />
Second or third<br />
Majors Total Majors %of All<br />
Art Total 22 0 22 5.9%<br />
Education 0 0 0.0%<br />
Graphic Design 13 13 3.5%<br />
Painting/Drawing 4 4 1.1%<br />
Studio 0 0 0.0%<br />
Ceramics 3 3 0.8%<br />
Intermedia 2 2 0.5%<br />
Art Administration 1 1 0.3%<br />
Biology 22 22 5.9%<br />
Business: Total 67 2 69 18.4%<br />
Accounting 15 15 4.0%<br />
Finance 0 2 2 0.5%<br />
Business Administration 18 18 4.8%<br />
International Business 2 2 0.5%<br />
Management 12 12 3.2%<br />
Marketing 20 20 5.3%<br />
Mgt. Info. Systems 0 0 0.0%<br />
Chemistry 9 10 19 5.1%<br />
Christian Education 3 1 4 1.1%<br />
Communication Studies 7 7 1.9%<br />
Computer Info. Science 10 10 2.7%<br />
Computer Science 7 7 1.9%<br />
Contract Major 0 0 0.0%<br />
Dramatic/Theatre Arts 2 2 0.5%<br />
Economics 4 3 7 1.9%<br />
Education: Total 35 3 38 10.1%<br />
Elementary 26 26 6.9%<br />
Secondary 9 3 12 3.2%<br />
Engineering Physics 6 6 1.6%<br />
English: Total 9 4 13 3.5%<br />
Education 0 0.0%<br />
Literature 5 4 9 2.4%<br />
Writing 4 4 1.1%<br />
Environmental Science 5 5 1.3%<br />
Government and Political Science 16 6 22 5.9%<br />
Health and Physical Education Total 17 2 19 5.1%<br />
Physical Education: 6 2 8 2.1%<br />
Health Promo./Fitness 5 5 1.3%<br />
Sports Medicine/Athletic Training 6 6 1.6%<br />
History 15 3 18 4.8%<br />
International Studies 5 5 1.3%<br />
Mathematics 0 1 1 0.3%<br />
Music: Total 5 0 5 1.3%<br />
Music: 3 3 0.8%<br />
Education 2 2 0.5%<br />
Music Theatre 0 0 0.0%<br />
Nursing 11 11 2.9%<br />
Philosophy 0 2 2 0.5%<br />
Philosophy and Religion 0 0 0.0%<br />
Physics 1 1 0.3%<br />
Psychology 27 2 29 7.7%<br />
Public Relations 16 16 4.3%<br />
Religion 2 2 0.5%<br />
Sociology 11 1 12 3.2%<br />
0 0.0%<br />
Undeclared/Undecided 0 0.0%<br />
0 0.0%<br />
Total Undergraduate Student Majors 335 40 375<br />
Number of Students with two or more Majors 40 11.9%<br />
Number Undergraduate Degrees Awarded 335<br />
5 year Undergraduate/MBA 15<br />
15 Broken into<br />
specialties above<br />
MBA 32 Includes 5 year 32


