Download PDF - Field Exchange - Emergency Nutrition Network
Download PDF - Field Exchange - Emergency Nutrition Network
Download PDF - Field Exchange - Emergency Nutrition Network
- No tags were found...

You also want an ePaper? Increase the reach of your titles
YUMPU automatically turns print PDFs into web optimized ePapers that Google loves.
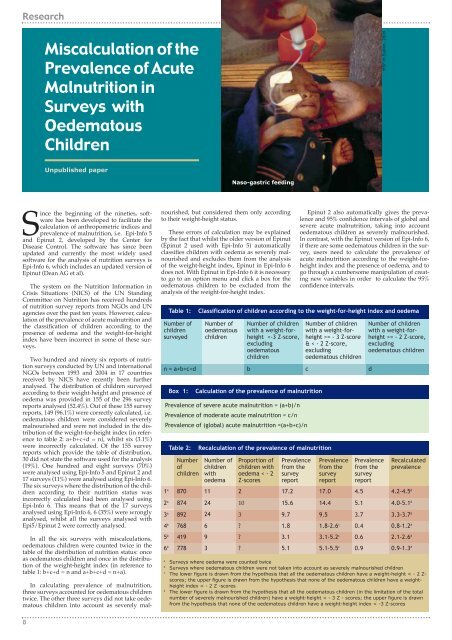
Research<br />
Miscalculation of the<br />
Prevalence of Acute<br />
Malnutrition in<br />
Surveys with<br />
Oedematous<br />
Children<br />
MSF-H.Sudan, 2004<br />
Unpublished paper<br />
Naso-gastric feeding<br />
Since the beginning of the nineties, software<br />
has been developed to facilitate the<br />
calculation of anthropometric indices and<br />
prevalence of malnutrition, i.e. Epi-Info 5<br />
and Epinut 2, developed by the Center for<br />
Disease Control. The software has since been<br />
updated and currently the most widely used<br />
software for the analysis of nutrition surveys is<br />
Epi-Info 6, which includes an updated version of<br />
Epinut (Dean AG et al).<br />
The system on the <strong>Nutrition</strong> Information in<br />
Crisis Situations (NICS) of the UN Standing<br />
Committee on <strong>Nutrition</strong> has received hundreds<br />
of nutrition survey reports from NGOs and UN<br />
agencies over the past ten years. However, calculation<br />
of the prevalence of acute malnutrition and<br />
the classification of children according to the<br />
presence of oedema and the weight-for-height<br />
index have been incorrect in some of these surveys.<br />
Two hundred and ninety six reports of nutrition<br />
surveys conducted by UN and international<br />
NGOs between 1993 and 2004 in 17 countries<br />
received by NICS have recently been further<br />
analysed. The distribution of children surveyed<br />
according to their weight-height and presence of<br />
oedema was provided in 155 of the 296 survey<br />
reports analysed (52.4%). Out of these 155 survey<br />
reports, 149 (96.1%) were correctly calculated, i.e.<br />
oedematous children were considered severely<br />
malnourished and were not included in the distribution<br />
of the weight-for-height index (in reference<br />
to table 2: a+b+c+d = n), whilst six (3.1%)<br />
were incorrectly calculated. Of the 155 survey<br />
reports which provide the table of distribution,<br />
30 did not state the software used for the analysis<br />
(19%). One hundred and eight surveys (70%)<br />
were analysed using Epi-Info 5 and Epinut 2 and<br />
17 surveys (11%) were analysed using Epi-Info 6.<br />
The six surveys where the distribution of the children<br />
according to their nutrition status was<br />
incorrectly calculated had been analysed using<br />
Epi-Info 6. This means that of the 17 surveys<br />
analysed using Epi-Info 6, 6 (35%) were wrongly<br />
analysed, whilst all the surveys analysed with<br />
Epi5/Epinut 2 were correctly analysed.<br />
In all the six surveys with miscalculations,<br />
oedematous children were counted twice in the<br />
table of the distribution of nutrition status: once<br />
as oedematous children and once in the distribution<br />
of the weight-height index (in reference to<br />
table 1: b+c+d = n and a+b+c+d = n+a).<br />
In calculating prevalence of malnutrition,<br />
three surveys accounted for oedematous children<br />
twice. The other three surveys did not take oedematous<br />
children into account as severely malnourished,<br />
but considered them only according<br />
to their weight-height status.<br />
These errors of calculation may be explained<br />
by the fact that whilst the older version of Epinut<br />
(Epinut 2 used with Epi-Info 5) automatically<br />
classifies children with oedema as severely malnourished<br />
and excludes them from the analysis<br />
of the weight-height index, Epinut in Epi-Info 6<br />
does not. With Epinut in Epi-Info 6 it is necessary<br />
to go to an option menu and click a box for the<br />
oedematous children to be excluded from the<br />
analysis of the weight-for-height index.<br />
Table 1:<br />
Number of<br />
children<br />
surveyed<br />
Epinut 2 also automatically gives the prevalence<br />
and 95% confidence intervals of global and<br />
severe acute malnutrition, taking into account<br />
oedematous children as severely malnourished.<br />
In contrast, with the Epinut version of Epi-Info 6,<br />
if there are some oedematous children in the survey,<br />
users need to calculate the prevalence of<br />
acute malnutrition according to the weight-forheight<br />
index and the presence of oedema, and to<br />
go through a cumbersome manipulation of creating<br />
new variables in order to calculate the 95%<br />
confidence intervals.<br />
Classification of children according to the weight-for-height index and oedema<br />
Number of<br />
oedematous<br />
children<br />
Number of children<br />
with a weight-forheight<br />
= - 3 Z-score<br />
& < - 2 Z-score,<br />
excluding<br />
oedematous children<br />
n = a+b+c+d b c d<br />
Number of children<br />
with a weight-forheight<br />
>= - 2 Z-score,<br />
excluding<br />
oedematous children<br />
Box 1: Calculation of the prevalence of malnutrition<br />
Prevalence of severe acute malnutrition = (a+b)/n<br />
Prevalence of moderate acute malnutrition = c/n<br />
Prevalence of (global) acute malnutrition =(a+b+c)/n<br />
Table 2: Recalculation of the prevalence of malnutrition<br />
Number Number of Proportion of Prevalence Prevalence Prevalence Recalculated<br />
of children children with from the from the from the prevalence<br />
children with oedema < - 2 survey survey survey<br />
oedema Z-scores report report report<br />
1 a 870 11 2<br />
17.2 17.0 4.5 4.2-4.5 d<br />
2 a 874 24 10<br />
15.6 14.4 5.1 4.0-5.1 d<br />
3 a 892 24 3 9.7 9.5 3.7 3.3-3.7 d<br />
4 b 768 6 <br />
1.8 1.8-2.6 c 0.4 0.8-1.2 d<br />
5 b 419 9 3.1 3.1-5.2 c 0.6 2.1-2.6 d<br />
6 b 778 3 5.1 5.1-5.5 c 0.9 0.9-1.3 d<br />
a<br />
Surveys where oedema were counted twice<br />
b<br />
Surveys where oedematous children were not taken into account as severely malnourished children<br />
c<br />
The lower figure is drawn from the hypothesis that all the oedematous children have a weight-height < - 2 Z-<br />
scores; the upper figure is drawn from the hypothesis that none of the oedematous children have a weightheight<br />
index < - 2 Z -scores<br />
d<br />
The lower figure is drawn from the hypothesis that all the oedematous children (in the limitation of the total<br />
number of severely malnourished children) have a weight-height < - 3 Z - scores; the upper figure is drawn<br />
from the hypothesis that none of the oedematous children have a weight-height index < -3 Z-scores<br />
8