Progress in Phenology Monitoring, Data Analysis, and Global - TUM
Progress in Phenology Monitoring, Data Analysis, and Global - TUM
Progress in Phenology Monitoring, Data Analysis, and Global - TUM

You also want an ePaper? Increase the reach of your titles
YUMPU automatically turns print PDFs into web optimized ePapers that Google loves.
International Conference<br />
<strong>Progress</strong> <strong>in</strong> <strong>Phenology</strong><br />
Monitor<strong>in</strong>g, <strong>Data</strong> <strong>Analysis</strong>, <strong>and</strong> <strong>Global</strong><br />
Change Impacts<br />
October 4-6, 2000<br />
Freis<strong>in</strong>g, Germany<br />
Abstract Booklet<br />
Organized <strong>in</strong> conjunction with the<br />
First workshop of the 5th<br />
Framework Programme<br />
EU-project POSITIVE<br />
International<br />
Society of<br />
Biometeorology<br />
Dutch National<br />
Research<br />
Programme on<br />
<strong>Global</strong> Air<br />
Pollution <strong>and</strong><br />
Climate Change<br />
Sponsored by<br />
Deutsche<br />
Forschungsgeme<strong>in</strong>schaft<br />
Deutsche<br />
Meteorologische<br />
Gesellschaft<br />
Edited by<br />
A. Menzel<br />
Technische<br />
Universität<br />
München<br />
POSITIVE
PROGRAMME COMMITTEE<br />
Elisabeth Beaubien, University of Alberta, Canada<br />
Dr. Elisabeth Koch, Zentralanstalt für Meteorologie und Geodynamik, Austria<br />
Dr. Annette Menzel, Technical University of Munich, Germany<br />
Prof. Mark D. Schwartz, University of Wiscons<strong>in</strong>-Milwaukee, USA<br />
Tim Sparks, Centre for Ecology <strong>and</strong> Hydrology, UK<br />
Arnold van Vliet, Wagen<strong>in</strong>gen University/Maastricht University, The Netherl<strong>and</strong>s<br />
ORGANISING COMMITTEE<br />
Dr. Annette Menzel, Dr. Michaela M. Hirschberg<br />
Technical University of Munich<br />
Department of Ecology / Bioclimatology <strong>and</strong> Pollution Research<br />
Am Hochanger 13<br />
85 354 Freis<strong>in</strong>g<br />
Germany<br />
e-mail: menzel@met.forst.tu-muenchen.de<br />
Phone: (+49) 8161 714740<br />
Fax: (+49) 8161 714753<br />
EU-project POSITIVE:<br />
http://www.forst.tu-muenchen.de/EXT/LST/METEO/positive/<br />
Department of Ecology / Bioclimatology <strong>and</strong> Pollution Research:<br />
http://www.forst.tu-muenchen.de/EXT/LST/METEO/<strong>in</strong>dex.html/<br />
2
CONTENTS<br />
WELCOME ................................................................................................................................................... 9<br />
SCHEDULE ................................................................................................................................................ 11<br />
ABSTRACTS.............................................................................................................................................. 15<br />
SESSION 1 PHENOLOGICAL MONITORING AND NETWORKS ........................................................... 15<br />
METEOROLOGICAL AND PHENOLOGICAL OBSERVATIONS WITHIN THE PAN-EUROPEAN<br />
PROGRAMME FOR THE INTENSIVE MONITORING OF FOREST ECOSYSTEMS (LEVEL II<br />
OF EU/IPC FORESTS).............................................................................................................................................15<br />
T. Preuhsler<br />
GENERAL CONSIDERATIONS ABOUT PHENOLOGICAL OBSERVATIONS NETWORK IN<br />
ALBANIA AND THE ACTUAL PROBLEMS.......................................................................................................16<br />
P. Zorba<br />
THE STRUCTURE OF THE CZECH PHENOLOGICAL DATABASE............................................................17<br />
J. Nekovár<br />
PHENOLOGICAL MAPS OF EUROPE ................................................................................................................18<br />
Th. Roetzer, F.-M. Chmielewski<br />
HOW TO MEASURE SEASONALITY - METHODS FOR PHENOLOGICAL CALENDARS AND<br />
ANALYSIS OF EXTREME YEARS .......................................................................................................................19<br />
R. Ahas, J. Jaagus, A. Aasa<br />
NUMERICAL DATA ANALYSIS, QUALITY CONTROL AND MODELLING OF<br />
PHENOLOGICAL OBSERVATIONS ON COMMERCIAL FRUIT TREES IN THE COLOGNE -<br />
BONN - KOBLENZ AREA.......................................................................................................................................20<br />
M. Müller, P. Braun, A. Hense, R. Glowienka-Hense<br />
POLLEN SOURCES DETERMINING THE AEROBIOLOGICAL SITUATION IN ESTONIA AND<br />
FLOWERING PHENOPHASES INFLUENCING THIS SITUATION...............................................................21<br />
M. Saar<br />
DIFFERENCES IN SEASONAL DYNAMICS BETWEEN CANOPY AND LOWER TRUNK<br />
SPIDERS ON PINE TREES.....................................................................................................................................22<br />
U. Simon<br />
SESSION 2A ANIMAL PHENOLOGY AND GLOBAL CHANGE ............................................................. 23<br />
MUSEUM EGG COLLECTIONS AS STORES OF LONG-TERM PHENOLOGICAL DATA ......................23<br />
J.P.W. Scharlemann<br />
THE EFFECTS OF TEMPERATURE, ALTITUDE AND LATITUDE ON THE ARRIVAL DATES<br />
OF THE SWALLOW HIRUNDO RUSTICA IN THE SLOVAK REPUBLIC ....................................................24<br />
T. H. Sparks, O. Braslavska<br />
3
THE CHANGE OF MIGRATION TIME OF THE ORDINARY BIRDS OF LAPLAND<br />
ZAPOVEDNIK (KOLA PENINSULA, RUSSIA) OVER THE PERIOD OF 1931-1999 ...................................25<br />
A. Gilyazov<br />
ARRIVAL DATES OF BIRDS IN SW FINLAND 1748-1998 – DATA AND THE MESSAGE ........................26<br />
E. Lehiko<strong>in</strong>en<br />
PHENOLOGY OF BRITISH BUTTERFLIES AND CLIMATE CHANGE.......................................................27<br />
D. Roy, T. Sparks<br />
SESSION 1 PHENOLOGICAL MONITORING AND NETWORKS ........................................................... 28<br />
CANADA PLANTWATCH: TRENDS TO EARLIER SPRING DEVELOPMENT..........................................28<br />
E.G. Beaubien<br />
EUROPEAN PHENOLOGY NETWORK – A NETWORK FOR INCREASING EFFICIENCY,<br />
ADDED VALUE AND USE OF PHENOLOGICAL MONITORING RESEARCH, AND DATA IN<br />
EUROPE.....................................................................................................................................................................29<br />
A. J.H. van Vliet, R. S. de Groot<br />
SESSION 2B PLANT PHENOLOGY AND GLOBAL CHANGE ............................................................... 30<br />
PHYTOPHENOLOGICAL TRENDS IN SWITZERLAND.................................................................................30<br />
C. Defila<br />
LONG-TERM DEVELOPMENT OF CLIMATE AND PHENOLOGY OF BEECHES IN SOUTH-<br />
WESTERN GERMANY ...........................................................................................................................................31<br />
A. Kirchgäßner , H. Mayer<br />
TRENDS IN PHENOLOGICAL STUDIES IN ARGENTINA .............................................................................32<br />
A. Faggi, O. Scarpati <strong>and</strong> L. Spescha<br />
OLIVE PHENOLOGY: INDICATOR OF GLOBAL WARMING IN THE MEDITERRANEAN ..................33<br />
C. Osborne, I. Chu<strong>in</strong>e, D. V<strong>in</strong>er & F.I. Woodward<br />
REGIONAL TRENDS OF THE BEGINNING OF GROWING SEASON IN EUROPE AND<br />
POSSIBLE CLIMATIC CAUSES ...........................................................................................................................34<br />
F.-M. Chmielewski, Th. Rötzer<br />
SESSION 3 PHENOLOGY AND REMOTE SENSING .............................................................................. 35<br />
NORTHERN PHOTOSYNTHETIC AND GROWING SEASON TRENDS FROM 1981 TO 1999.................35<br />
C. J. Tucker, D. Slayback, J. P<strong>in</strong>zon, S. Los, R. Myneni, M. Paris<br />
ASSESSING SATELLITE-DERIVED PHENOLOGY IN NORTH AMERICA ................................................36<br />
M. D. Schwartz<br />
4
AN ANALYSIS OF TEMPORAL RELATIONSHIPS BETWEEN PLANT COMMUNITY<br />
PHENOLOGY AND SEASONAL NDVI METRICS IN NORTHERN CHINA .................................................37<br />
X. Chen<br />
EUROPEAN GREEN WAVE OBSERVED IN NOAA/AVHRR NDVI DATA AND IN THE<br />
INTERNATIONAL PHENOLOGICAL GARDENS.............................................................................................38<br />
M.M. Hirschberg, A. Menzel <strong>and</strong> C.J. Tucker<br />
THE IMPACT OF VEGETATION SEASONALITY ON GLOBAL CARBON BUDGETS: A<br />
COMPARISON OF LPJ MODEL RESULTS WITH SATELLITE OBSERVATIONS....................................39<br />
W. Lucht, A. Bondeau, S. Sitch <strong>and</strong> W. Cramer<br />
TRENDS IN NOAA/AVHRR NDVI AND PHENOLOGICAL RECORDS IN GERMANY FROM<br />
1981-1998....................................................................................................................................................................40<br />
A. Menzel <strong>and</strong> C.J. Tucker<br />
INTERANNUAL VARIATIONS OF BUDBURST OF DECIDUOUS FORESTS IN CENTRAL AND<br />
WESTERN EUROPE DERIVED FROM A 10 YEARS DAILY NOAA/AVHRR 1KM ARCHIVE,<br />
GROUND-BASED PHENOLOGICAL OBSERVATIONS AND ECOSYSTEM MODEL<br />
SIMULATIONS.........................................................................................................................................................41<br />
A. Bondeau, K. Böttcher, W. Lucht, E. Dufrêne, J. Schaber<br />
EFFECTS OF URBANIZATION ON GROWING SEASON DYNAMICS AND GROSS PRIMARY<br />
PRODUCTION IN MAJOR METROPOLITAN AREAS IN THE UNITED STATES. ....................................42<br />
M.A. White, R.R. Nemani<br />
SESSION 4 MODELLING PHENOLOGY .................................................................................................. 43<br />
TESTING TEMPERATURE DATA FOR PHENOLOGICAL MODELS ..........................................................43<br />
R. Snyder, D. Spano, C. Cesaraccio, P. Duce<br />
AN IMPROVED MODEL FOR DEGREE DAYS FROM DAILY TEMPERATURE DATA...........................44<br />
C. Cesaraccio, D. Spano, P. Duce, R. L. Snyder, <strong>and</strong> P. Deidda<br />
IMPORTANCE OF PHENOLOGY AND PHENOLOGICAL MODELS ON AN INTEGRATED<br />
EVALUATION OF FOREST ECOSYSTEM MONITORING DATA ................................................................45<br />
S. Raspe<br />
A BARLEY ONTHOGENIC MODEL AS A TIME-BASE FOR MONITORING ADVERSE<br />
AGROMETEOROLOGICAL FACTORS..............................................................................................................46<br />
J. Valter<br />
FORECASTING AIRBORNE POLLEN CONCENTRATIONS: DEVELOPMENT OF LOCAL<br />
MODELS....................................................................................................................................................................47<br />
A.Ranzi, P. Lauriola, F. Z<strong>in</strong>oni, L.Botarelli<br />
MODELLING THE PROBABILITY OF GYPSY MOTH ESTABLISHMENT IN NEW AREAS OF<br />
NORTH AMERICA ON THE BASIS OF PHENOLOGY ....................................................................................48<br />
J. Régnière, V.G. Nealis<br />
ON MODELLING OF PHENOLOGICAL AU<strong>TUM</strong>N PHASES .........................................................................49<br />
N. Estrella<br />
ANALYSIS OF PHENOLOGICAL MODELS USING STATISTICAL RESAMPLING METHODS ............50<br />
R. Häkk<strong>in</strong>en<br />
5
SESSION 5A APPLICATIONS OF PHENOLOGY IN AGRICULTURE AND FORESTRY....................... 51<br />
REALISM IN PHENOLOGICAL MODELS FOR THE ANNUAL CYCLE OF TREES:<br />
IMPORTANT FOR CLIMATE CHANGE IMPACT ASSESSMENT! ...............................................................51<br />
K. Kramer, I. Le<strong>in</strong>onen, H. Hänn<strong>in</strong>en<br />
APPLICATION OF PHENOLOGY IN AGRICULTURAL PRODUCTION PLANNING IN<br />
SLOVENIA ................................................................................................................................................................52<br />
A.Sušnik<br />
USE OF BIOCLIMATIC INDEXES TO CHARACTERIZE PHENOLOGICAL PHASES OF APPLE<br />
VARIETIES IN NORTHERN ITALY ....................................................................................................................53<br />
N. Valent<strong>in</strong>i, G. Me, R. Ferrero, F. Spanna<br />
PHENOLOGICAL PREDICTIONS IN PLANTS..................................................................................................54<br />
F.E. Wielgolaski<br />
GROWTH AND PHENOLOGY OF A SEMINATURAL GRASSLAND SUBMITTED TO<br />
ELEVATED ATMOSPHERIC CARBON DIOXIDE CONCENTRATION .......................................................55<br />
A.Raschi, F.Selvi, S. Marchi, S. Sforzi<br />
SESSION 5B APPLICATIONS OF PHENOLOGY IN ECOLOGY ............................................................ 56<br />
PHENOLOGICAL MONITORING OF INDIVIDUAL TREES ..........................................................................56<br />
R. Brügger, A. Vassella, F. Jeanneret<br />
INCREASING FROST DAMAGE RISK OF EARLY FLOWERING BOREAL TREE SPECIES:<br />
WILL CLIMATE CHANGE MAKE THEM DECLINE? ....................................................................................57<br />
T. L<strong>in</strong>kosalo<br />
EVALUATING THE POTENTIAL FOR CLIMATE CHANGE INDUCED BARK BEETLE<br />
INVASION OF HIGH ELEVATION ECOSYSTEMS ..........................................................................................58<br />
J. A. Logan, J. A. Powell, B. J. Bentz<br />
LOSS OF SYNCHRONY BETWEEN HIGH- AND LOW- ALTITUDE FLOWERING PHENOLOGY<br />
DUE TO CLIMATE CHANGE................................................................................................................................59<br />
D. W. Inouye<br />
POSTERS................................................................................................................................................... 60<br />
GIS ANALYSES FOR PHENOLOGICAL DATABASES IN ESTONIA............................................................60<br />
A. Aasa, R. Ahas<br />
PHENOLOGICAL PROGRAMS IN RUSSIAN NATURE ZAPOVEDNIKS.....................................................61<br />
V.Barcan<br />
PLANTWATCH: BIOMONITOR FOR CLIMATE CHANGE ...........................................................................62<br />
E.G. Beaubien, T.C. Lantz<br />
PLANTWATCH: CANADIANS TRACK THE ARRIVAL OF SPRING ...........................................................62<br />
E.G. Beaubien, T.C. Lantz<br />
6
REMOTE ASSESSMENT OF PHENOLOGICAL EVENTS USING DIGITAL CAMERAS ..........................63<br />
E. Beuker<br />
PRINCIPAL PHENOLOGICAL GROWTH STAGES OF POME, STONE FRUIT AND<br />
CURRANTS: CODING AND DESCRIPTION ACCORDING TO THE BBCH SCALE..................................64<br />
E. Bruns<br />
EXPERIENCE OF THE DENDROPHENOLOGICAL INDICATION OF SHORT-TERM CLIMATE<br />
CHANGES AND OF CURRENT WARMING IN EASTERN EUROPE ............................................................66<br />
N.E. Bulyg<strong>in</strong><br />
FORECAST OF FULL FLOWERING DATES OF PEAR TREE (PYRUS COMMUNIS L.), APPLE<br />
TREE (MALUS DOMESTICA BORKH) AND PLUM TREE (PRUNUS DOMESTICA L.) –<br />
SIMILARITIES AND DIFFERENCES...................................................................................................................67<br />
K. Bergant, Z. Crep<strong>in</strong>sek, L. Kajfez-Bogataj<br />
CLIMATE AND APHID PHENOLOGY ................................................................................................................68<br />
R. Harr<strong>in</strong>gton, M. Else, C. Denholm, J. Pickup, M. Hullé<br />
RUSSIAN PHENOLOGY: HISTORY AND PRESENT DAY..............................................................................69<br />
V.G. Fedotova<br />
LARGE SCALE CLIMATE VARIABILITY AND ITS EFFECTS ON MEAN TEMPERATURE AND<br />
FLOWERING TIME OF PRUNUS AND BETULA...............................................................................................70<br />
A.K. Gormsen, T.B. Toldam-Andersen <strong>and</strong> P. Braun<br />
LOSS OF SYNCHRONY BETWEEN HIGH- AND LOW- ALTITUDE FLOWERING PHENOLOGY<br />
DUE TO CLIMATE CHANGE................................................................................................................................70<br />
D. W. Inouye<br />
ALPINE LONG TIME DATA SETS.......................................................................................................................71<br />
E. Koch<br />
A COMMON PHENOLOGICAL DATA BASE FOR THE EU PROJECT ‘POSITIVE’ .................................72<br />
H. Scheif<strong>in</strong>ger, W. Lipa<br />
THE USE OF MODIS NADIR BRDF-ADJUSTED REFLECTANCES TO MONITOR<br />
PHENOLOGICAL ACTIVITY................................................................................................................................73<br />
A. H. Strahler, C. B. Schaaf, M. Friedl, W. Lucht, F. Gao, X. Zhang, D. McIver, <strong>and</strong> J. F. C. Hodges<br />
PHENOLOGY AS GLOBAL CHANGE BIO-INDICATOR ................................................................................74<br />
A.Menzel<br />
EU-PROJECT POSITIVE: PHENOLOGICAL OBSERVATIONS AND SATELLITE DATA (NDVI):<br />
TRENDS IN THE VEGETATION CYCLE IN EUROPE.....................................................................................76<br />
A.Menzel, R. Ahas, I. Chu<strong>in</strong>e, M. Hirschberg, E. Koch, C. Tucker<br />
LIGHT AS A FACTOR AFFECTING THE FRUIT PHENOLOGY OF ATLANTIC RAIN FOREST<br />
TREES: A CASE STUDY OF CRYPTOCARYA MOSCHATA (LAURACEAE) .................................................77<br />
P. Moraes <strong>and</strong> L.P.C. Morellato<br />
FLOWERING AND FRUITING PHENOLOGY IN ATLANTIC RAIN FOREST MYRTACEAE OF<br />
BRAZIL: CLIMATIC AND PHYLOGENETIC CONSTRAINTS ......................................................................77<br />
L.P.C. Morellato<br />
ESTONIAN ICHTYOPHENOLOGICAL CALENDAR AS SOURCE FOR CLIMATE CHANGE<br />
STUDIES ....................................................................................................................................................................78<br />
V. Palm<br />
7
USE OF PHENOLOGY IN AGRICULTURE........................................................................................................79<br />
Th. Roetzer, H. Häckel, R. Würländer<br />
DETECTING OUTLIERS IN LARGE PHENOLOGICAL DATA SETS...........................................................80<br />
J. Schaber <strong>and</strong> F. Badeck<br />
ANALYSIS AND APPLICATION OF PHENOLOGY MODELS TO DATA OF THE GERMAN<br />
WEATHER SERVICE (DWD) ................................................................................................................................80<br />
J. Schaber<br />
INTERACTION BETWEEN AGROMETEOROLOGICAL PATTERN AND PHENOLOGY IN<br />
BAROLO WINE AREA............................................................................................................................................81<br />
F. Spanna, C. Lovisolo<br />
WINTER CLIMATE AND FLOWER BUD MORTALITY OF SOUR CHERRY (PRUNUS<br />
CERASUS)..................................................................................................................................................................82<br />
T.B. Toldam-Andersen, I. Dencker, P. Braun<br />
DETECTION OF THE ARRIVAL DATE OF MIGRATING BIRDS IS DENSITY-DEPENDENT: A<br />
CASE STUDY OF THE RED-BACKED SHRIKE LANIUS COLLURIO ...........................................................83<br />
P. Tryjanowski<br />
RECENT CHANGES IN NEST TIMING OF THE RED-BACKED SHRIKE LANIUS COLLURIO IN<br />
POLAND ....................................................................................................................................................................83<br />
P. Tryjanowski, S. Kuzniak, T.H. Sparks<br />
EUROPEAN PHENOLOGY NETWORK – A NETWORK FOR INCREASING EFFICIENCY,<br />
ADDED VALUE AND USE OF PHENOLOGICAL MONITORING RESEARCH, AND DATA IN<br />
EUROPE.....................................................................................................................................................................83<br />
A. J.H. van Vliet, R. S. de Groot<br />
PHENOLOGICAL MODIFICATION IN PLANTS BY SOIL FACTORS .........................................................84<br />
F.E. Wielgolaski<br />
LIST OF PARTICIPANTS .......................................................................................................................... 87<br />
8
WELCOME<br />
On behalf of the programme committee, it gives me great pleasure to welcome you to<br />
the International Conference “<strong>Progress</strong> <strong>in</strong> <strong>Phenology</strong> – Monitor<strong>in</strong>g, <strong>Data</strong> <strong>Analysis</strong> <strong>and</strong><br />
<strong>Global</strong> Change Impacts”, held at Freis<strong>in</strong>g, Germany, October 4-6 2000. This conference<br />
is organized <strong>in</strong> conjunction with the first workshop of the 5 th framework EU project<br />
POSITIVE <strong>and</strong> represents at the same time the yearly meet<strong>in</strong>g of phenologists work<strong>in</strong>g<br />
at several central European national weather services, the last meet<strong>in</strong>g be<strong>in</strong>g at Prague<br />
<strong>in</strong> 1999. It follows sessions of the <strong>Phenology</strong> Study Group of the ISB at the 14 th<br />
International Congress of Biometeorology at Ljubljana (1996), a phenology session at<br />
the meet<strong>in</strong>g of the Association of American Geographers at Boston (1998) <strong>and</strong> a<br />
phenology session at the 13 th International Botanical Congress at St. Louis (1999) as<br />
well as at the 15 th International Congress of Biometeorology at Sydney (1999).<br />
We are honoured by the presence of many dist<strong>in</strong>guished participants here <strong>in</strong> Germany,<br />
some of whom have travelled far to be with us for this meet<strong>in</strong>g. We thank the persons<br />
<strong>and</strong> <strong>in</strong>stitutions whose contributions <strong>and</strong> efforts have made this conference possible,<br />
especially we wish to acknowledge the f<strong>in</strong>ancial support of the organizations listed on<br />
the front page <strong>and</strong> to express our gratitude to them.<br />
The scientific programme of the conference reflects the excitement, great diversity <strong>and</strong><br />
application of phenology. It will address all aspects of plant <strong>and</strong> animal phenology with<br />
a focus on monitor<strong>in</strong>g <strong>and</strong> modell<strong>in</strong>g phenology, <strong>and</strong> the assessment of future impacts<br />
as well as applications of phenology <strong>in</strong> the context of global climate change. This<br />
abstract booklet consists of 3 keynote lectures <strong>in</strong>troduc<strong>in</strong>g the ma<strong>in</strong> topics, 43<br />
presentations exp<strong>and</strong><strong>in</strong>g these topics, <strong>and</strong> more than 30 posters represent<strong>in</strong>g a wide<br />
range of themes <strong>and</strong> scientific studies. They are prepared <strong>and</strong> discussed by over 70<br />
participants from countries all over the world.<br />
We hope that students <strong>and</strong> scientists work<strong>in</strong>g <strong>in</strong> the field of phenology will benefit from<br />
this abstract booklet. Manuscripts of several presentations will be published, under the<br />
normal review process, <strong>in</strong> the International Journal of Biometeorology.<br />
We have made great efforts to br<strong>in</strong>g together phenologists from a wide range of<br />
countries <strong>in</strong> order to present <strong>and</strong> share recent f<strong>in</strong>d<strong>in</strong>gs <strong>and</strong> to discuss the present state<br />
<strong>and</strong> future contributions of phenology. We hope you will take the opportunity not only<br />
to greet old friends, but also establish new collaborations <strong>and</strong> make the phenology<br />
community “closer”.<br />
Once aga<strong>in</strong>, welcome to you all!<br />
Many thanks<br />
Annette Menzel<br />
9
SCHEDULE<br />
<strong>Progress</strong> <strong>in</strong> <strong>Phenology</strong> - Monitor<strong>in</strong>g, <strong>Data</strong> <strong>Analysis</strong> <strong>and</strong> <strong>Global</strong> Change<br />
Impacts<br />
Start<strong>in</strong>g time 04.10.00<br />
10:30 Registration (11:30 Meet<strong>in</strong>g of the chairs )<br />
12:00 Lunch<br />
12:45 Welcome addresses<br />
Prof. Peter Fabian, Department of Ecology, TU Munich<br />
Prof. Mark D. Schwartz, Commission 1 Vegetation Dynamics, Climate <strong>and</strong> Biodiversity of ISB<br />
Session 1 Phenological Monitor<strong>in</strong>g <strong>and</strong> Networks Arnold Van Vliet Chairperson<br />
13:00 Meteorological <strong>and</strong> phenological observations with<strong>in</strong> the Pan-European Programme for Teja Preuhsler<br />
<strong>in</strong>tensive monitor<strong>in</strong>g of forest ecosystems (Level II of EU/IPC Forests)<br />
Keynote speaker<br />
13:40 General Considerations about phenological observations network <strong>in</strong> Albania <strong>and</strong> the actual Zorba<br />
problems<br />
14:00 The structure of the Czech phenological database Nekovar<br />
14:20 Phenological maps of Europe Rötzer, Chmielewski<br />
14:40 How to measure seasonality - methods for phenological calendars<br />
<strong>and</strong> analysis of extreme years<br />
Ahas, Jaagus, Aasa<br />
15:00 Numerical data analysis, quality control <strong>and</strong> modell<strong>in</strong>g of phenological observations on Müller, Braun, Hense, Glowienka-Hense<br />
commercial fruit trees <strong>in</strong> the Cologne-Bonn-Koblenz area<br />
15:20 Pollen sources determ<strong>in</strong><strong>in</strong>g the aerobiological situation <strong>in</strong> Estonia <strong>and</strong> flower<strong>in</strong>g Saar<br />
phenophases <strong>in</strong>fluenc<strong>in</strong>g this situation<br />
15:40 Differences <strong>in</strong> seasonal dynamics between canopy <strong>and</strong> lower trunk spiders on p<strong>in</strong>e trees Simon<br />
16:00 Coffee & Poster Presentation<br />
Session 2 A Animal <strong>Phenology</strong> <strong>and</strong> <strong>Global</strong> Change Elisabeth Beaubien Chairperson<br />
16:30 Museum egg collections as stores of long-term phenological data Scharlemann<br />
16:50 The effects of temperature, altitude <strong>and</strong> latitude on the arrival dates of the swallow Hirundo Sparks, Braslavska<br />
rustica <strong>in</strong> the Slovak Republic<br />
17:10 Changes of migration time of hte ord<strong>in</strong>ary birds of Lapl<strong>and</strong> Zapovednik (Kola Pen<strong>in</strong>sula, Gilyazov<br />
Russia) over the period of 1931-1999<br />
17:30 Arrival dates of birds <strong>in</strong> SW F<strong>in</strong>l<strong>and</strong> 1748-1998 - data <strong>and</strong> the message Lehiko<strong>in</strong>en
12<br />
17:50 <strong>Phenology</strong> of British butterflies <strong>and</strong> climate change Roy, Sparks<br />
18:15 D<strong>in</strong>ner<br />
Session 1 (cont.) Phenological Monitor<strong>in</strong>g <strong>and</strong> Networks Peter Fabian Chairperson<br />
19:20 Canada Plantwatch: trends to earlier spr<strong>in</strong>g development Beaubien<br />
19:40 The European Phenological Network Van Vliet, de Groot<br />
20:00 Discussion Phenological Monitor<strong>in</strong>g <strong>and</strong> Networks<br />
05.10.00<br />
7:45 Breakfast<br />
Session 2 B Plant <strong>Phenology</strong> <strong>and</strong> <strong>Global</strong> Change Annette Menzel Chairperson<br />
8:30 Phytophenological trends <strong>in</strong> Switzerl<strong>and</strong> Defila<br />
8:50 Long-term Development of Climate <strong>and</strong> <strong>Phenology</strong> of Beeches <strong>in</strong> South-western Germany Kirchgäßner, Mayer<br />
9:10 Trends <strong>in</strong> phenological studies <strong>in</strong> Argent<strong>in</strong>a Faggi, Scarpati, Spescha<br />
9:30 Olive phenology: <strong>in</strong>dicator of global warm<strong>in</strong>g <strong>in</strong> the Mediterranean Osborne, Chu<strong>in</strong>e, V<strong>in</strong>er, Woodward<br />
9:50 Regional trends of the grow<strong>in</strong>g season <strong>in</strong> Europe <strong>and</strong> their possible climatological causes Chmielewski, Rötzer<br />
10:10 Coffee & Poster Presentation<br />
Session 3 <strong>Phenology</strong> <strong>and</strong> Remote Sens<strong>in</strong>g Tim Sparks Chairperson<br />
10:40 Northern photosynthetic <strong>and</strong> grow<strong>in</strong>g season trends from 1981-1999 Compton Tucker Keynote speaker<br />
11:20 Assess<strong>in</strong>g Satellite-derived <strong>Phenology</strong> <strong>in</strong> North America Schwartz<br />
11:40 An analysis of temporal relationships between plant community phenology <strong>and</strong> seasonal Chen<br />
NDVI metrics <strong>in</strong> Northern Ch<strong>in</strong>a<br />
12:00 Lunch<br />
13:00 European green wave observed <strong>in</strong> NOAA/AVHRR NDVI data <strong>and</strong> <strong>in</strong> the International Hirschberg, Menzel<br />
Phenological Gardens<br />
13:20 The Impact of Vegetation Seasonality on <strong>Global</strong> Carbon Budgets: A Comparison of LPJ Lucht, Bondeau, Sitch, Cramer<br />
Model Results with Satellite Observations<br />
13:40 Trends <strong>in</strong> NOAA/AVHRR NDVI <strong>and</strong> phenological records <strong>in</strong> Germany from 1981-1998 Menzel<br />
14:00 Interannual variations of the budburst day of deciduous forests <strong>in</strong> central <strong>and</strong> western Bondeau, Böttcher, Lucht, Dufrêne, Schaber<br />
Europe derived from a 10 years daily NOAA/AVHRR 1km archive, ground-based<br />
phenological observations <strong>and</strong> ecosystem model simulations<br />
14:20 Effects of urbanization on grow<strong>in</strong>g season dynamics <strong>and</strong> gross primary production <strong>in</strong> major<br />
metropolitan areas <strong>in</strong> the United States<br />
White, Nemani
14:40 Coffee & Poster Presentation<br />
Session 4 Modell<strong>in</strong>g <strong>Phenology</strong> Koen Kramer Chairperson<br />
15:10 Test<strong>in</strong>g temperature data for phenological models Snyder, Spano, Cesaraccio, Duce<br />
15:30 An improved model for degree days from daily temperature data Cesaraccio, Spano, Duce, Snyder, Deidda<br />
15:50 Importance of <strong>Phenology</strong> <strong>and</strong> Phenological Models on an Integrated Evaluation of Forest Raspe<br />
Ecosystem Monitor<strong>in</strong>g <strong>Data</strong><br />
16:10 A barley onthogenic model as a time-base for monitor<strong>in</strong>g adverse agrometeorological factors Valter<br />
16:30 Guided Tour through Freis<strong>in</strong>g<br />
18:00 D<strong>in</strong>ner<br />
Session 4 Modell<strong>in</strong>g <strong>Phenology</strong> Koen Kramer Chairperson<br />
19:00 Forecast<strong>in</strong>g airborne pollen concentrations: development of local models Ranzi, Lauriola, Z<strong>in</strong>oni, Botarelli<br />
19:20 Model<strong>in</strong>g the probability of Gypsy moth establishment <strong>in</strong> new areas of North America on the Régnière, Nealis<br />
basis of phenology<br />
19:40 About modell<strong>in</strong>g of phenological autumn phases Estrella<br />
20:00 <strong>Analysis</strong> of phenological models us<strong>in</strong>g statistical resampl<strong>in</strong>g methods Häkk<strong>in</strong>en<br />
06.10.00<br />
7:45 Breakfast<br />
Session 5 A Applications of <strong>Phenology</strong> <strong>in</strong> Agriculture <strong>and</strong> Forestry Mark Schwartz Chairperson<br />
8:30 Realism <strong>in</strong> phenological models for the annual cycles of trees: important for climate change Koen Kramer<br />
impact assessment!<br />
Keynote speaker<br />
9:10 Application of phenology <strong>in</strong> agricultural production plann<strong>in</strong>g <strong>in</strong> Slovenia Susnik<br />
9:30 Use of bioclimatic <strong>in</strong>dexes to characterize phenological phases of apple varieties <strong>in</strong> Northern Valent<strong>in</strong>i, Me, Ferrero, Spanna<br />
Italy<br />
9:50 Phenological prediction <strong>in</strong> plants Wielgolaski<br />
10:10 Growth <strong>and</strong> phenology of a sem<strong>in</strong>atural grassl<strong>and</strong> submitted to elevated atmospheric carbon Raschi, Selvi, Marchi, Sforzi<br />
dioxide concentration<br />
13
14<br />
10:30 Coffee & Poster Presentation<br />
Session 5 B Applications of <strong>Phenology</strong> <strong>in</strong> Ecology Teja Preuhsler Chairperson<br />
10:50 Phenological Monitor<strong>in</strong>g of Individual Trees Brügger, Vassella, Jeanneret<br />
11:10 Increas<strong>in</strong>g frost damage risk of the early flower<strong>in</strong>g boreal tree species: will climate change L<strong>in</strong>kosalo<br />
make them decl<strong>in</strong>e ?<br />
11:30 Evaluat<strong>in</strong>g the potential for climate change <strong>in</strong>duced bark beetle <strong>in</strong>vasion of high elevation Logan, Powell, Bentz<br />
ecosystems<br />
11:50 Loss of synchrony between high- <strong>and</strong> low-altitude flower<strong>in</strong>g phenology due to climate Inouye<br />
change<br />
12:10 Statement at the clos<strong>in</strong>g of the conference Prof. Dr. H. Meyer, TU München, Dean of the<br />
Life Science Center Weihenstephan<br />
Dr. Peter Höppe, President of ISB<br />
12:20 Conclud<strong>in</strong>g Remarks Dr. Annette Menzel<br />
12:30 Lunch
ABSTRACTS<br />
SESSION 1 PHENOLOGICAL MONITORING AND NETWORKS<br />
METEOROLOGICAL AND PHENOLOGICAL OBSERVATIONS WITHIN THE<br />
PAN-EUROPEAN PROGRAMME FOR THE INTENSIVE MONITORING OF<br />
FOREST ECOSYSTEMS (LEVEL II OF EU/IPC FORESTS)<br />
T. Preuhsler<br />
Bavarian State Institute of Forestry, Freis<strong>in</strong>g, Germany<br />
pre@lwf.uni-muenchen.de/Fax: +49-8161-714971<br />
In order to ga<strong>in</strong> a better underst<strong>and</strong><strong>in</strong>g of the effects of air pollution <strong>and</strong> other stress factors on forests, a<br />
Pan-European Programme for Intensive <strong>and</strong> Cont<strong>in</strong>uous Monitor<strong>in</strong>g of Forest Ecosystems has been<br />
implemented with<strong>in</strong> the last 8 years (the so-called "Level II programme"). In this context 861 permanent<br />
observation plots for Intensive Monitor<strong>in</strong>g have been <strong>in</strong>stalled - 512 <strong>in</strong> the European Union <strong>and</strong> 351 <strong>in</strong><br />
several non-EU European countries.<br />
The Intensive Monitor<strong>in</strong>g Programme aims at the assessment of crown condition, <strong>in</strong>crement <strong>and</strong> the<br />
chemical composition of foliage <strong>and</strong> soil on all plots over a period of at least 15 to 20 years. On a limited<br />
number of these plots additional measurements are foreseen or already carried out, like atmospheric<br />
deposition, soil solution chemistry, ground vegetation <strong>and</strong> meteorological parameters, as well as<br />
observations concern<strong>in</strong>g phenology, phytopathology <strong>and</strong> litterfall.<br />
Meteorological variables comprise the most decisive <strong>and</strong> variable parameters affect<strong>in</strong>g structur, growth,<br />
health <strong>and</strong> stability of forest ecosystems. They also conta<strong>in</strong> the ma<strong>in</strong> factors guid<strong>in</strong>g deposition <strong>in</strong>to forest.<br />
With<strong>in</strong> the aims of the Level II monitor<strong>in</strong>g program, Forest <strong>Phenology</strong> is def<strong>in</strong>ed as the systematic<br />
observation <strong>and</strong> record<strong>in</strong>g of the biotic <strong>and</strong> abiotic (e.g. damag<strong>in</strong>g) events <strong>and</strong> phenomena <strong>and</strong> of the yearly<br />
development stages of forest trees. Ma<strong>in</strong> objective of phenological observation at the level II plots is to<br />
provide supplementary <strong>and</strong> complementary <strong>in</strong>formation on the status <strong>and</strong> development of forest tree<br />
condition dur<strong>in</strong>g the year.<br />
The meteorological <strong>and</strong> phenological programme parts started with<strong>in</strong> the last few years, which was late<br />
<strong>in</strong>side of the monitor<strong>in</strong>g programme on Level II plots. The phase of <strong>in</strong>stallation or beg<strong>in</strong>n<strong>in</strong>g of the<br />
monitor<strong>in</strong>g is not completed yet. The European Expert Group for Meteorology <strong>and</strong> <strong>Phenology</strong> for this<br />
programme is still busy with the def<strong>in</strong>ition <strong>and</strong> formulation of their part of the programme <strong>and</strong> the gather<strong>in</strong>g<br />
<strong>and</strong> excange of experience <strong>in</strong> techniques <strong>and</strong> basic evaluations.<br />
An overwiev of the objectives, sampl<strong>in</strong>g design, methods <strong>and</strong> parameters of both parts of the level II<br />
programme will be given <strong>in</strong> this keynote lecture.
GENERAL CONSIDERATIONS ABOUT PHENOLOGICAL OBSERVATIONS<br />
NETWORK IN ALBANIA AND THE ACTUAL PROBLEMS<br />
P. Zorba<br />
Hydrometeorological Institute, Tirana, Albania<br />
aspetalb@yahoo.com/ Fax: ++355 4 238 214<br />
The phenological observations network of Albania is created dur<strong>in</strong>g the year 1958-1960. At that time started<br />
the first work related to the collection of phenological data about some pr<strong>in</strong>cipal agricultural plants as wheat,<br />
maize, etc. Actually, the phenological data <strong>in</strong> the archive of our <strong>in</strong>stitute <strong>in</strong>cludes the period from 1971 until<br />
today, with data for 13 most important agricultural plants cultivated <strong>in</strong> Albania, which come from 17<br />
observation stations. In each station (po<strong>in</strong>t of observation), generally the data are collected for 4 agricultural<br />
plants, the most representative of the respective area. Every 2 days, the observed phenological data are<br />
collected from the observers <strong>in</strong> some appropriate tables <strong>and</strong> send at the end of each month to the<br />
agrometeorological section of Hydrometeorological Institute <strong>in</strong> Tirana. There are carried out regular<br />
controls, the necessary selection <strong>and</strong> the archive process. The digitalization has started <strong>in</strong> the last years.<br />
The phenological data are used to evaluate <strong>and</strong> forecast the period of maturity of wheat, sunflower or as <strong>in</strong><br />
many cases for different phenological phases of plant development, to determ<strong>in</strong>e the coefficient of biological<br />
m<strong>in</strong>imum for the potato, sunflower, etc, <strong>and</strong> for other agrometeorological estimations.<br />
Look<strong>in</strong>g at the data series, dur<strong>in</strong>g the years are noted that only few stations (7) have rema<strong>in</strong>ed the same<br />
po<strong>in</strong>ts of observation. Furthermore, the plants <strong>and</strong> their varieties have changed many times dur<strong>in</strong>g the years.<br />
The same variety rema<strong>in</strong>s for 3-4 years <strong>and</strong> after that is replaced with another variety of the same plant. At<br />
least only 3 or 4 plants (the same variety) like wheat, maize, potato <strong>and</strong> sunflower can offer data for a long<br />
time <strong>and</strong> that is for about half of phenological stations.<br />
Dur<strong>in</strong>g the period of transition <strong>and</strong> system changes (regard<strong>in</strong>g the last 10 years) there are noted a series of<br />
difficulties for different reasons, that are reflected <strong>in</strong> a non-cont<strong>in</strong>uity of observations at some stations. The<br />
change of agriculture orientation has brought new foreign plants <strong>and</strong> variety <strong>in</strong> agricultural economy that <strong>in</strong><br />
a lot of cases are not adequate for the agrometeorological conditions of Albania <strong>and</strong> the f<strong>in</strong>al product<br />
failures.<br />
The actual problems consist <strong>in</strong> the impossibility to realize frequent controls at the phenological stations, to<br />
establish a list with plants that can not be changed for at least 6 years as a m<strong>in</strong>imum request for some<br />
agrometeorological studies <strong>and</strong> to assure an adequate m<strong>in</strong>imum stipend for the observers of phenological<br />
stations. Another problem is related to the digitalization of phenological data that needs a computer <strong>and</strong> an<br />
established methodology for this process.<br />
16
THE STRUCTURE OF THE CZECH PHENOLOGICAL DATABASE<br />
J. Nekovár<br />
Czech Hydrometeorological Institute, Prag, Czech Republic<br />
jiri.nekovar@chmi.cz<br />
CHMI Prague has ma<strong>in</strong>ta<strong>in</strong>ed three phenological sub-networks:<br />
Region Area Number of phenological stations Density<br />
km 2 Field Fruit Forest Total km 2 /station<br />
Middle Bohemia 11.428 11 5 10 26 440<br />
South Bohemia 11.400 8 2 5 15 760<br />
West Bohemia 10.370 9 1 8 18 576<br />
North Bohemia 8.710 7 5 3 15 581<br />
East Bohemia 9.979 12 4 8 24 416<br />
South Moravia 15.548 23 7 9 39 399<br />
North Moravia 11.427 14 4 3 21 544<br />
Czech Republic 78.862 84 28 46 158 499<br />
CHMI has issued the phenological guidebooks that determ<strong>in</strong>e observational methods. This paper allows to<br />
describe only the specification of observed species <strong>and</strong> phenophases. Actually, guidebooks <strong>in</strong>clude detailed<br />
def<strong>in</strong>itions of phenophases, directions for the choice of plants <strong>and</strong> their localities, description of localities,<br />
report<strong>in</strong>g supplementary k<strong>in</strong>ds of <strong>in</strong>formation, fill<strong>in</strong>g <strong>in</strong> forms, terms of reports plus many classification <strong>and</strong><br />
code tables.<br />
Station of field crops phenology observes 15 species or their varieties from the list of 19 species:<br />
Wheat (w<strong>in</strong>ter&spr<strong>in</strong>g), Rye, Barley (w<strong>in</strong>ter&spr<strong>in</strong>g), Oats, Sugar beet, Turnip, Potato, Maize, Peas, Horsebean,<br />
Bean, Flax, Rape, Poppy, Alfalfa, Clover, Hops. The list of observed phenophases is as follows:<br />
Sow<strong>in</strong>g <strong>and</strong> Emergence (all species except hops, alfalfa, clover), Bud-break<strong>in</strong>g (hops), First leaves (rape,<br />
alfalfa, clover, hops), Tiller<strong>in</strong>g (cereals), Stem elongation (cereals, rape, poppy), First <strong>and</strong> Second node<br />
(cereals), Head<strong>in</strong>g (cereals, maize), Axial branches visible (hops), Decortication as first ruptures on the<br />
surface of roots (sugar beet, turnip), First button visible (horse-bean, bean, peas, flax, alfalfa, clover),<br />
Flower<strong>in</strong>g (all species except sugar beet, turnip), Flower<strong>in</strong>g of male <strong>and</strong> female flowers (maize), Full<br />
flower<strong>in</strong>g (horse-bean, bean, peas, poppy, rape, flax, potato), End of flower<strong>in</strong>g (cereals, poppy, rape, flax,<br />
potato), Green ripeness (horse-bean, peas), Milky ripeness (cereals, maize), Waxy ripeness (maize), Yellow<br />
ripeness (cereals, horse-bean, peas, rape, flax), Full ripeness (cereals, maize, horse-bean, bean, peas, poppy),<br />
Harvest ripeness (sugar beet, turnip), Leaf&stem degradation (potato), Harvest (all species except alfalfa,<br />
clover), 1 st +2 nd +3 rd cutt<strong>in</strong>g (alfalfa,clover).<br />
Fruit trees phenology observes 15 species or their varieties from the list: Apple, Pear, Greengage (plum),<br />
Cherry, Morello, Apricot, Peach, Red <strong>and</strong> white currants, Black currant, Gooseberry, Walnut, Hazelnut,<br />
V<strong>in</strong>e. The list of observed phenophases is follow<strong>in</strong>g: Bud-break of leaves (all species except apple, pear),<br />
Bud-break of flowers (plum, cherry, morello, apricot, peach, hazelnut), Bud-break of mixed buds (apple,<br />
pear), First leaves (all species), First button visible (apple, pear, plum, cherry, morello, apricot, peach),<br />
Beg<strong>in</strong>n<strong>in</strong>g of flower<strong>in</strong>g (all species except walnut, hazelnut), Beg<strong>in</strong>n<strong>in</strong>g of flower<strong>in</strong>g of male flowers<br />
(walnut, hazelnut), Beg<strong>in</strong>n<strong>in</strong>g of flower<strong>in</strong>g of female flowers (hazelnut), Full flower<strong>in</strong>g (all species except<br />
hazelnut), Petals start to fall (apple, pear, plum, cherry, morello), End of flower<strong>in</strong>g (all species except<br />
currants, gooseberry), Buds formation (apple, pear, plum, cherry, morello, apricot, peach), End of growth of<br />
annual shoots (apple, pear), Harvest ripeness (all species), Harvest (apple, pear, plum, cherry, morello,<br />
apricot, peach), End of fall of leaves (all species except currants, gooseberry, v<strong>in</strong>e), Grapes start to hook <strong>and</strong><br />
to soften (v<strong>in</strong>e).<br />
The list of observed wild plants consists of fixed 45 species: Common Spruce, Larch, P<strong>in</strong>e, Dwarf p<strong>in</strong>e,<br />
Wild cherry, Blackthorn, Mounta<strong>in</strong> ash, Hawthorn, False acacia, Hornbeam, Hazelnut, Birch, Black <strong>and</strong><br />
Gray Alder, Beech, Summer oak, Sallow, Mounta<strong>in</strong> <strong>and</strong> Common Maple, Lime tree, Red dogwood, Wild<br />
cornel, Golden <strong>and</strong> Red Elder, Marshmarigold, W<strong>in</strong>dflower, Liverwort, Buttercup, Wild strawberry, Trail<strong>in</strong>g<br />
clover, St.John‘s wort, Narrow-leaved willowherb, Heather, Bilberry, White dead-nettle, Chrysanthemum,<br />
Coltsfoot, Common <strong>and</strong> White Butterbur, Meadow saffron, Lily of the valley, Snowdrop, Orchard grass,<br />
Meadow foxtail, Reed. There are observed these phenophases: Sprout<strong>in</strong>g, First leaves, Full-leaf area<br />
reached, Flowers buttons visible, Flower<strong>in</strong>g, End of flower<strong>in</strong>g, Buds formation, Start of fructification, May<br />
sprouts, Summer leaves yellow<strong>in</strong>g, Turn<strong>in</strong>g of sprouts to wood, Autumn leaves yellow<strong>in</strong>g, Defoliation,<br />
Ripeness of fruits.<br />
17
PHENOLOGICAL MAPS OF EUROPE<br />
Th. Roetzer, F.-M. Chmielewski<br />
Section of Agricultural Meteorology, Humboldt-University, Berl<strong>in</strong>, Germany<br />
thomas.roetzer@rz.hu-berl<strong>in</strong>.de / Fax: +49-30-31471211<br />
The annual courses of the seasons are reflected by the regularity of the start<strong>in</strong>g dates of phenological phases<br />
of plants, like e.g. the unfold<strong>in</strong>g of leaves or the beg<strong>in</strong>n<strong>in</strong>g of flower<strong>in</strong>g. Phenological maps show the<br />
geographical distribution of the start<strong>in</strong>g dates of phenophases, thus reflect<strong>in</strong>g the dynamics of seasons.<br />
The International Phenological Gardens (IPG) were the data base of the phenological maps of Europe. The<br />
IPG-net ranges across 28 latitudes from Sc<strong>and</strong><strong>in</strong>avia to Macedonia <strong>and</strong> across 37 longitudes from Irel<strong>and</strong> to<br />
F<strong>in</strong>l<strong>and</strong> <strong>in</strong> the North <strong>and</strong> from Portugal to Macedonia <strong>in</strong> the South. S<strong>in</strong>ce 1961 the phenophases of 26<br />
genetically identical trees <strong>and</strong> shrubs planted <strong>in</strong> 74 IPGs across Europe have been observed. After check<strong>in</strong>g<br />
the data <strong>and</strong> supplement<strong>in</strong>g miss<strong>in</strong>g values <strong>in</strong> the time series the phenophases can be analysed <strong>and</strong> mapped.<br />
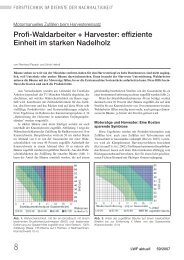
Us<strong>in</strong>g multiple regression models the dependencies of the beg<strong>in</strong>n<strong>in</strong>g of leaf unfold<strong>in</strong>g, beg<strong>in</strong>n<strong>in</strong>g of<br />
flower<strong>in</strong>g, first ripe fruits etc. on altitude, longitude <strong>and</strong> latitude were determ<strong>in</strong>ed. The factors of the<br />
regression models for some phenophases are shown <strong>in</strong> figure 1.<br />
5.0<br />
4.5<br />
4.0<br />
3.5<br />
3.0<br />
2.5<br />
2.0<br />
1.5<br />
1.0<br />
0.5<br />
0.0<br />
18<br />
���������<br />
���������<br />
����������<br />
����������<br />
����������<br />
����������<br />
����������<br />
����������<br />
����������<br />
����������<br />
����������<br />
����������<br />
����������<br />
����������<br />
����������<br />
����������<br />
����������<br />
����������<br />
����������<br />
����������<br />
����������<br />
����������<br />
����������<br />
����������<br />
����������<br />
����������<br />
����������<br />
����������<br />
����������<br />
����������<br />
����������<br />
����������<br />
����������<br />
����������<br />
����������<br />
����������<br />
���������<br />
����������<br />
����������<br />
����������<br />
����������<br />
����������<br />
����������<br />
���������� ����������<br />
����������<br />
����������<br />
����������<br />
����������<br />
����������<br />
����������<br />
����������<br />
����������<br />
�����������<br />
����������<br />
����������<br />
����������<br />
����������<br />
���������<br />
BO Fagus<br />
1961-98<br />
BO Betula<br />
1961-98<br />
BO Prunus<br />
1961-98<br />
BO Prunus<br />
1970<br />
����������<br />
����������<br />
����������<br />
����������<br />
����������<br />
����������<br />
����������<br />
����������<br />
����������<br />
����������<br />
����������<br />
����������<br />
�����������<br />
���������<br />
����<br />
altitude <strong>in</strong> d/100m latitude <strong>in</strong> d/degree<br />
����<br />
BO Prunus<br />
1990<br />
B Rob<strong>in</strong>ia<br />
1961-98<br />
M Picea<br />
1961-98<br />
�������<br />
longitude <strong>in</strong> d/degree<br />
�������<br />
Fig.1: Dependencies of different<br />
phenophases on altitude,<br />
longitude <strong>and</strong> latitude<br />
(BO: beg<strong>in</strong>n<strong>in</strong>g of leaf<br />
unfold<strong>in</strong>g;<br />
B: beg<strong>in</strong>n<strong>in</strong>g of flower<strong>in</strong>g;<br />
M: May shoot)<br />
While the factor of altitude ranges from 2.0 d/100m (BO Fagus silvatica H -1961-98) to 4.56 d/100m (B<br />
Rob<strong>in</strong>ia pseudoacaccia - 1961-98), the latitude-factors were with<strong>in</strong> 1.81 d/°latitude (BO Fagus silvatica H -<br />
1961-98) <strong>and</strong> 4.53 d/°latitude (BO Prunus avium L – 1970) <strong>and</strong> the longitude-factors with<strong>in</strong> 0.23<br />
d/°longitude (BO Fagus silvatica H -1961-98) <strong>and</strong> 0.83 d/°longitude (BO Prunus avium L – 1970).<br />
Us<strong>in</strong>g a digital elevation model (DEM) with a horizontal grid spac<strong>in</strong>g of 30 arc-seconds (approximately 1<br />
km) <strong>and</strong> the results of the regression analysis phenological phases were mapped. Phenological maps<br />
show<strong>in</strong>g means, trends <strong>and</strong> start<strong>in</strong>g dates of extreme years as well as maps of the beg<strong>in</strong>n<strong>in</strong>g, the end <strong>and</strong> the<br />
length of the grow<strong>in</strong>g season were created. For a better orientation national borders, cities <strong>and</strong> rivers were<br />
added to the maps. The quality of the maps was checked by compar<strong>in</strong>g the data of the maps with observed<br />
data of the IPGs.<br />
Averaged over the years 1961 – 1998 the grow<strong>in</strong>g season starts <strong>in</strong> most regions of Europe between the 15 th<br />
<strong>and</strong> 20 th of April, whereas the British Isles - with the exception of Scotl<strong>and</strong> - show a beg<strong>in</strong>n<strong>in</strong>g of the<br />
grow<strong>in</strong>g season between the 5 th <strong>and</strong> the 15 th of April. An earlier beg<strong>in</strong>n<strong>in</strong>g of the grow<strong>in</strong>g season before the<br />
5 th of April was calculated for France <strong>and</strong> South Europe. A later beg<strong>in</strong>n<strong>in</strong>g of the grow<strong>in</strong>g season after the<br />
20 th of April can be seen <strong>in</strong> Northern Europe <strong>and</strong> <strong>in</strong> mounta<strong>in</strong>ous regions like the Alps or the Dalmatian<br />
Mounta<strong>in</strong>s.
HOW TO MEASURE SEASONALITY - METHODS FOR PHENOLOGICAL<br />
CALENDARS AND ANALYSIS OF EXTREME YEARS<br />
R. Ahas, J. Jaagus, A. Aasa<br />
Institute of Geography, University of Tartu, Estonia<br />
re<strong>in</strong>a@ut.ee / Fax 372-7-375825<br />
Objectives of our study were to 1) Compose phenological calendars for different parts of the Northern<br />
hemisphere. 2) Develop <strong>and</strong> test methods for analysis of those calendars. 3) Apply methods for analysis of<br />
extreme years of phenological calendars. 4) To group studied years <strong>and</strong> locations by types of seasonal<br />
patterns. 5) Compare seasonality <strong>and</strong> detect possible effects of climate change for different regions of the<br />
Northern hemisphere.<br />
Measur<strong>in</strong>g of the seasonality <strong>and</strong> modell<strong>in</strong>g seasonal sequence of natural processes is an important part of<br />
the modell<strong>in</strong>g ecological processes. Seasonality has many measures <strong>and</strong> parameters as phenological dates,<br />
<strong>in</strong>tervals <strong>and</strong> duration or meteorological parameters such as air <strong>and</strong> soil temperature, moisture, radiation etc.<br />
The phenological calendars, which are lists of annual sequences of phenological phases <strong>and</strong> duration or<br />
<strong>in</strong>tervals between them, are normally a comb<strong>in</strong>ation of both: phenological <strong>and</strong> meteorological data.<br />
Phenological calendars help to describe or compare seasonality of every <strong>in</strong>dividual year, ecosystem,<br />
organism or region. There are different methods <strong>and</strong> historical schools for composition of phenological<br />
calendars. Today, phenology has an important source for the measur<strong>in</strong>g of seasonal aspects of global change<br />
<strong>and</strong> recorded calendars are very important databases for this purpose.<br />
The analysis of extreme years of phenological calendars shows the effects of natural variation <strong>and</strong><br />
fluctuations, climate change impact, <strong>and</strong> ecological or physiological limits of the studied objects. In some<br />
cases, the upper or lower quartile is used for the determ<strong>in</strong>ation of extreme events. In the current study, we<br />
use the term extreme years only for absolute m<strong>in</strong>imum or maximum values <strong>in</strong> the calendar. The analysis of<br />
extreme years can be very important for climatic trend analyses. The <strong>in</strong>fluence of extreme years on the<br />
regression <strong>and</strong> slope of the l<strong>in</strong>ear trend is very high <strong>and</strong> it also has an <strong>in</strong>fluence on the confidence level of<br />
statistics. Also, the <strong>in</strong>fluence of extreme events on the follow<strong>in</strong>g periods <strong>and</strong> phases was studied.<br />
The data was used from different observation networks between 1948-1999: A local phenological calendar<br />
with up to 50 species <strong>and</strong> a daily mean air temperature for the same site. The phenological calendars were<br />
composed with all beg<strong>in</strong>n<strong>in</strong>g dates <strong>and</strong> duration (<strong>in</strong>tervals) <strong>in</strong>cluded. Climatic seasons were determ<strong>in</strong>ed<br />
similar to ord<strong>in</strong>ary phenological phases, determ<strong>in</strong>ed <strong>and</strong> recorded accord<strong>in</strong>g to start<strong>in</strong>g dates. Dates when the<br />
daily mean air temperature crosses certa<strong>in</strong> thresholds (0, +5°C <strong>and</strong> +13° <strong>in</strong> this study) are determ<strong>in</strong>ed,<br />
follow<strong>in</strong>g procedures used by meteorological services for many decades. Once the temperature threshold has<br />
been reached positive <strong>and</strong> negative differences of daily temperature m<strong>in</strong>us the threshold value are summed<br />
separately. As soon as the absolute value of the sum of negative differences is higher than the sum of the<br />
positive differences, the first cross over of the temperature threshold is not taken as the start of the respective<br />
season <strong>and</strong> the search for the season’s start is cont<strong>in</strong>ued from this day.<br />
19
NUMERICAL DATA ANALYSIS, QUALITY CONTROL AND MODELLING OF<br />
PHENOLOGICAL OBSERVATIONS ON COMMERCIAL FRUIT TREES IN THE<br />
COLOGNE - BONN - KOBLENZ AREA<br />
M. Müller (1), P. Braun (2), A. Hense (3), R. Glowienka-Hense (3)<br />
(1) Institut für Obstbau und Gemüsebau, University of Bonn, Germany<br />
(2) Royal Veter<strong>in</strong>ary <strong>and</strong> Agricultural University, Dept. of Agric. Sci., Sct. Horticulture, Taastrup, Denmark<br />
(3) Meteorologisches Institut der Universität Bonn, Germany<br />
One of the prerequisites for study<strong>in</strong>g the impact of regional climate variability (e.g. such as the North<br />
Atlantic Oscillation <strong>in</strong> Mideurope) upon natural as well as agricultural systems are homogeneous data <strong>in</strong><br />
space <strong>and</strong> time. Phenological observations such as those collected by the German Weather Service (DWD)<br />
are obta<strong>in</strong>ed from volunteer networks with numerous problems concern<strong>in</strong>g data quality <strong>and</strong><br />
representativeness. We will describe a method based upon modern techniques from numerical weather<br />
analysis to produce gridded fields of phenological dates for the Cologne - Bonn - Koblenz area with a<br />
resolution of 1/12° x 1/12°. The method is done <strong>in</strong> two steps, each one supplemented with its own quality<br />
control . At first, the long term mean field is estimated from all data us<strong>in</strong>g external <strong>in</strong>formation such as<br />
height from a digital terra<strong>in</strong> model or longitude <strong>and</strong> latitude as predictors. In a second step, anomalies of a<br />
specific year from this long term mean are analysed <strong>in</strong>clud<strong>in</strong>g <strong>in</strong>formation from the spatial autocorrelation<br />
structure. With<strong>in</strong> this step a cross-validation method is embedded to perform the quality control between a<br />
selected station <strong>and</strong> the observations of the surround<strong>in</strong>g ones. The result of the analysis is (1) a time series of<br />
gridded phenological phases of various commercial fruit trees for the period 1951 - 1998 based on a quality<br />
controlled data set <strong>and</strong> (2) a list of observations flagged out as erroneous or unrepresentative.<br />
A second part of the studies <strong>in</strong> the Cologne - Bonn - Koblenz area is the development of a model for the<br />
phenological development of fruit trees until flower<strong>in</strong>g. This work is based on phenological <strong>and</strong><br />
climatological observations on two experimental farms from 1943 resp. 1957 to 1999.<br />
The phenological time series - if still available <strong>in</strong> full length - are of good quality with an exact<br />
documentation of cultivar <strong>and</strong> locality. The quality control of climatological observations has been more<br />
elaborate. Due to changes <strong>in</strong> equipment, observation sites, staff members <strong>and</strong> restricted work<strong>in</strong>g hours <strong>and</strong><br />
holidays <strong>and</strong> many other problems, time series of climatological observations have numerous faults. All data<br />
have been put <strong>in</strong> a database. Most of the faults have been extracted from the data by <strong>in</strong>tegrat<strong>in</strong>g several test<br />
rout<strong>in</strong>es <strong>in</strong>to the database.<br />
The validated observations are the base for phenological models. This models try to separate local <strong>and</strong> plantbased<br />
effects on plant development. Consequently, the tree-based part will be equal on both observation sites<br />
<strong>and</strong> the second part will describe the local deviations.<br />
It is planned to merge the spatial, gridded phenological fields with the description of the local part of the<br />
phenological model.<br />
20
POLLEN SOURCES DETERMINING THE AEROBIOLOGICAL SITUATION IN<br />
ESTONIA AND FLOWERING PHENOPHASES INFLUENCING THIS<br />
SITUATION<br />
M. Saar<br />
Institute of Zoology <strong>and</strong> Botany, Estonian Agricultural University, Estonia<br />
maret@zbi.ee<br />
All anemophilous <strong>and</strong> a part of entomophilous plants release pollen gra<strong>in</strong>s <strong>in</strong>to the air dur<strong>in</strong>g flower<strong>in</strong>g.<br />
They may be carried farther away from the plants by air fluxes. Therefore pollen can occur at a site of<br />
aerobiological monitor<strong>in</strong>g at a time when flower<strong>in</strong>g of local plants has not yet started, or when it has already<br />
been over. Whether one or both of these phenomena take place depends on the location of the monitor<strong>in</strong>g<br />
site with<strong>in</strong> the plant’s distribution area. When it is located on this boundary of the area where spread of the<br />
flower<strong>in</strong>g phase term<strong>in</strong>ates, only pre-flower<strong>in</strong>g long-range transport is possible. When the monitor<strong>in</strong>g site is<br />
located on the boundary where the flower<strong>in</strong>g phase started, only post-flower<strong>in</strong>g long-range transport can be<br />
observed. When, however, the monitor<strong>in</strong>g site is located with<strong>in</strong> the plants area far from the regions where<br />
the flower<strong>in</strong>g phase starts or term<strong>in</strong>ates, both pre-flower<strong>in</strong>g <strong>and</strong> post-flower<strong>in</strong>g long-range transport are<br />
possible. Besides with<strong>in</strong>-area long-range transport also extra-area long-range transport, i. e. transport of<br />
pollen <strong>in</strong>to areas where the plant does not grow, is possible.<br />
A survey is given of how the course of the season for pollen groups occurr<strong>in</strong>g <strong>in</strong> Estonia is <strong>in</strong>fluenced by<br />
long-range transport as well as by the flower<strong>in</strong>g of local plants. Pollen composition <strong>in</strong> Tartu at 14 m from<br />
the ground <strong>in</strong> 1990-1999 was as follows:<br />
47.92% Betula<br />
13.35% Alnus<br />
10.31% Urticaceae<br />
10.23% P<strong>in</strong>us<br />
5.07% Poaceae<br />
3.87% Artemisia<br />
1.07% Salix<br />
1.02% Populus<br />
0.99% Picea<br />
0.75% Corylus<br />
0.60% Querqus<br />
0.45% Chenopodiaceae-Amaranthaceae<br />
0.42% Cupressaceae<br />
0.31% Rumex<br />
0.29% Plantago<br />
0.27% Ulmus<br />
0.26% Cyperaceae<br />
0.18% Frax<strong>in</strong>us<br />
0.17% Rosaceae<br />
0.17% Cannabaceae<br />
0.13% Apiaceae<br />
0.10% Asteraceae<br />
0.33% others<br />
1.29% unidentified<br />
21
DIFFERENCES IN SEASONAL DYNAMICS BETWEEN CANOPY AND LOWER<br />
TRUNK SPIDERS ON PINE TREES<br />
U. Simon<br />
L<strong>and</strong>useplann<strong>in</strong>g <strong>and</strong> nature conservation, Faculty of Forestry Sciences, Technical University<br />
München, Germany<br />
Ulrich.Simon@lrz.tu-muenchen.de<br />
The canopy is the place where life <strong>in</strong> forests meets the atmosphere. Other than <strong>in</strong> the closed forest climatic<br />
factors like radiation, water loss by w<strong>in</strong>d <strong>and</strong> heat<strong>in</strong>g etc. are less buffered. Structure of <strong>and</strong> processes with<strong>in</strong><br />
animal communities of forest canopies are thus more immediately <strong>in</strong>fluenced by climatic factors. Hitherto,<br />
there has been only a little knowledge of forest organismic diversity <strong>and</strong> functions <strong>in</strong> particular <strong>in</strong> the high<br />
canopy of temperate forests.<br />
The first aspect of the presented results is that <strong>in</strong> an important group of predators <strong>in</strong> forests, the spiders,<br />
diversity (species composition) <strong>and</strong> function (seasonality, prey capture mode) is different between lower<br />
trunks <strong>and</strong> the canopy.<br />
The spider community structures of the canopy completely differ from those of the lower trunks <strong>in</strong> species<br />
number (lower), species composition (less <strong>in</strong>dividual-poor species), <strong>and</strong> prey capture mode (more hunters <strong>in</strong><br />
the canopy, many web-builders on the lower trunks).<br />
Patterns of the seasonality of the spiders on p<strong>in</strong>e tree trunks <strong>and</strong> p<strong>in</strong>e tree crowns were differed drastically.<br />
On the lower trunks adult spiders reveal a bimodal phenology with a peak of activity <strong>in</strong> spr<strong>in</strong>g/early<br />
summer, a subsequent decrease of activity dur<strong>in</strong>g summer, <strong>and</strong> another <strong>in</strong>crease <strong>in</strong> autumn. This is a normal<br />
<strong>and</strong> often described pattern. In the canopy, however, an autumn activity of adult spiders is lack<strong>in</strong>g. Juveniles<br />
on the lower parts of the trunk are ma<strong>in</strong>ly active dur<strong>in</strong>g summer months, whereas <strong>in</strong> the canopy juvenile<br />
spiders are ma<strong>in</strong>ly active <strong>in</strong> autumn <strong>and</strong> early spr<strong>in</strong>g.<br />
All this are not simple differences <strong>in</strong> patterns but fundamental differences <strong>in</strong> the function of a predator guild<br />
<strong>in</strong> forests. The results show that<br />
the knowledge of functions <strong>in</strong> forests needs the regard of all compartments of a forest<br />
functions <strong>and</strong> dynamics may differ between different compartments<br />
studies of the canopy may reveal <strong>in</strong>sights to the consequences of climate change to communities <strong>and</strong><br />
dynamics <strong>in</strong> ecosystems.<br />
22
SESSION 2A ANIMAL PHENOLOGY AND GLOBAL CHANGE<br />
MUSEUM EGG COLLECTIONS AS STORES OF LONG-TERM<br />
PHENOLOGICAL DATA<br />
J.P.W. Scharlemann<br />
Department of Zoology, University of Cambridge & Bird Group, The Natural History Museum, United<br />
K<strong>in</strong>gdom<br />
jpws2@cam.ac.uk<br />
Museum collections hold large amounts of data on collect<strong>in</strong>g dates <strong>and</strong> localities of eggs collected over the<br />
past 150 years. Egg collections hold the longest available time series for a wide range of Bird species on a<br />
large spatial scale.<br />
Us<strong>in</strong>g data for a suite of British species I <strong>in</strong>vestigate if egg collection data can be used <strong>in</strong> phenological<br />
research. I will highlight problems with the data <strong>and</strong> possible pitfalls: Can the actual lay<strong>in</strong>g date be derived<br />
from the <strong>in</strong>formation provided by the collectors? Could there be a bias <strong>in</strong> egg collect<strong>in</strong>g for certa<strong>in</strong> types of<br />
eggs? How does the data from egg collections compare with previous studies based on nest record cards.<br />
Further, I will present some analyses of long-term changes <strong>in</strong> a few species of British birds.<br />
23
THE EFFECTS OF TEMPERATURE, ALTITUDE AND LATITUDE ON THE<br />
ARRIVAL DATES OF THE SWALLOW HIRUNDO RUSTICA IN THE SLOVAK<br />
REPUBLIC<br />
T. H. Sparks (1), O. Braslavska (2)<br />
(1) Centre for Ecology <strong>and</strong> Hydrology, Monks Wood, UK<br />
(2) (2) Slovak Hydrometeorological Institute, Banska Bystrica, Slovak Republic.<br />
ths@ceh.ac.uk/Fax +44 1487 773467<br />
The (barn) swallow Hirundo rustica is a traditional harb<strong>in</strong>ger of spr<strong>in</strong>g <strong>in</strong> many Northern Hemisphere<br />
countries. Because of its widespread distribution <strong>and</strong> obvious appearance it has the potential to be an<br />
excellent phenological <strong>in</strong>dicator for <strong>in</strong>ternational research.<br />
This paper uses <strong>in</strong>formation on the arrival <strong>and</strong> departure dates of the swallow throughout the Slovak republic<br />
for the 30 years 1961-1985 <strong>and</strong> 1996-2000. Records were taken at 19 locations throughout the republic<br />
represent<strong>in</strong>g an altitude range from 105m to 760m. Monthly temperature data were constructed from 6<br />
meteorological stations. Us<strong>in</strong>g regression techniques, effects of latitude, altitude <strong>and</strong> temperature are all<br />
apparent. The follow<strong>in</strong>g graph shows the response of average arrival time on April temperature; the<br />
relationship is significant at p
THE CHANGE OF MIGRATION TIME OF THE ORDINARY BIRDS OF<br />
LAPLAND ZAPOVEDNIK (KOLA PENINSULA, RUSSIA) OVER THE PERIOD<br />
OF 1931-1999<br />
A. Gilyazov<br />
Lapl<strong>and</strong> State Natural Biosphere Zapovednik,Russia<br />
lapl<strong>and</strong>@monch.mels.ru\Tel\Fax (815 -36) 5-71-99<br />
Phenological observations has started dur<strong>in</strong>g the autumn of 1930 <strong>and</strong> are conducted up to now. The maximal<br />
period of observations is 65 years; the m<strong>in</strong>imal one is 51 years. 27 phenomena concern<strong>in</strong>g not only birds but<br />
also the data of thaw of ice at the surface of Chuna lake <strong>and</strong> freez<strong>in</strong>g of it. These parameters were taken as<br />
<strong>in</strong>dicators as they are the mostly easy registrated, reliable <strong>and</strong> demonstrative. These <strong>in</strong>dicators are complex<br />
for the weather of half year as the date of their occurrence depends not only from the temperature but also<br />
from the amount of precipitation, force <strong>and</strong> <strong>in</strong>tensity of w<strong>in</strong>ds dur<strong>in</strong>g the previous half year as well. The rest<br />
28 phenomena show the tendency of change. 15 spr<strong>in</strong>g phenomena from 19 <strong>in</strong>vestigated ones came <strong>in</strong> 2-13<br />
days before <strong>in</strong> 1931-1941; 4 spr<strong>in</strong>g phenomena came <strong>in</strong> 1-6 days later. 4 early autumn phenomena came <strong>in</strong><br />
3-11 days later; the latest four autumn phenomena occur <strong>in</strong> 1-31 days earlier (Table 2). Break<strong>in</strong>g of ice of<br />
lake Chuna is <strong>in</strong> 1 day later <strong>and</strong> freez<strong>in</strong>g is <strong>in</strong> 8 days earlier than before that means that ice covers the lake <strong>in</strong><br />
9 days longer (199 <strong>and</strong> 208 days). Changes that were mentioned more often co<strong>in</strong>cide with the change of the<br />
time of phenomena <strong>in</strong> the period 1931-1982 . It means that spr<strong>in</strong>g migrants arrive earlier from year to year<br />
<strong>and</strong> <strong>in</strong> autumn those migrants that usually leave earlier change the time of their leav<strong>in</strong>g for the later one <strong>and</strong><br />
those who leave later change the time of their leav<strong>in</strong>g for the earlier one. These changes can be expla<strong>in</strong>ed by<br />
the possibility to f<strong>in</strong>d food: warm long autumn keeps earlier migrants <strong>and</strong> earlier freez<strong>in</strong>g date of the lakes<br />
<strong>and</strong> establish<strong>in</strong>g of snow cover force the late migrants flow away. The period of stay has <strong>in</strong>creased dur<strong>in</strong>g 70<br />
years for the most part of the species that have data about both parameters: arrival <strong>and</strong> flow<strong>in</strong>g away (7<br />
ord<strong>in</strong>ary species): for B. clangula it is 5 days, for S. paradisaea, T. iliacus, M. alba it is 8-9 days, for F.<br />
montifrigilla it is 16 days. For late migrants this period has decreased: for C. cygnusit it is 12 days, for P.<br />
enucleator it is 31 days. Tak<strong>in</strong>g <strong>in</strong>to account only the parameter of fly<strong>in</strong>g away period of stay has also<br />
<strong>in</strong>creased by 5.1 day <strong>in</strong> average for 15 species from 20 <strong>in</strong>vestigated. As a whole dur<strong>in</strong>g 70 years of<br />
observations we can see the tendency of cool<strong>in</strong>g the climate that was mentioned earlier . Birds’ species<br />
reaction for change of climate conditions is different. Most of the species has <strong>in</strong>creased the period of their<br />
stay <strong>in</strong> Lapl<strong>and</strong> <strong>and</strong> two species that are late migrants has decreased the time of their stay <strong>in</strong> Lapl<strong>and</strong> dur<strong>in</strong>g<br />
the period under <strong>in</strong>vestigation.<br />
25
ARRIVAL DATES OF BIRDS IN SW FINLAND 1748-1998 – DATA AND THE<br />
MESSAGE<br />
E. Lehiko<strong>in</strong>en<br />
Section of Ecology, Department of Biology, University of Turku, F<strong>in</strong>l<strong>and</strong><br />
esalehi@utu.fi<br />
Phenological observations have been done nearly without <strong>in</strong>terruption <strong>in</strong> Turku from 1748. The <strong>in</strong>itiation of<br />
this work came orig<strong>in</strong>ally from Carl L<strong>in</strong>né <strong>and</strong> Anders Celsius <strong>in</strong> “mother”-Sweden. In Turku, L<strong>in</strong>né’s<br />
student <strong>and</strong> friend Johan Leche started the research accompanied with detailed weather observations. His<br />
major publication summarises the practical <strong>in</strong>formation of arrival dates as follows: “The White Wagtail is<br />
always observed at the break of the ice. If it is seen earlier, the ice will break immediately. Of all the<br />
Swallows, the Barn Swallow is the first to arrive. On average it arrives on 6 May. The House Mart<strong>in</strong> arrives<br />
on 10 May. On arrival of these species the water <strong>in</strong> coastal bays is 9 or 10 degrees (°C). He, who hasn’t<br />
started to take care of his herb garden, shall not postpone it any further. The Swift is the last to arrive,<br />
sometimes arriv<strong>in</strong>g before, sometimes after the 20 May. The real summer starts at the Swift’s arrival. You<br />
can sow the seeds of portulaca <strong>and</strong> plant cucumbers <strong>and</strong> Turkish beans at this time even if the soil is cold<br />
without a fear of frost. [Letters to the Royal Swedish Academy (Stockholm) 1763].<br />
Nearly a hundred years later G.G. Hällström (1844, unpublished lecture, reviewed by Johansson <strong>in</strong> 1911)<br />
made a detailed analysis of the phenological data collected dur<strong>in</strong>g the n<strong>in</strong>ety years elapsed s<strong>in</strong>ce Leche. He<br />
concluded e.g. that 1) arrival dates of migratory birds vary more than phenological events <strong>in</strong> plants, 2) larger<br />
species migrate faster than smaller species, 3) species that arrive later migrate faster, 4) variability of arrival<br />
dates is larger <strong>in</strong> early migrants, <strong>and</strong> 5) <strong>in</strong> autumn, cranes <strong>and</strong> geese of southern populations depart earlier<br />
than those of northern populations. He also made a geographical comparison of migration speeds (km/d),<br />
which are summarised below:<br />
Latitude (N)<br />
Species 50 60 70<br />
Spr<strong>in</strong>g skylark 18 21 25<br />
Spr<strong>in</strong>g swallow 36 45 56<br />
Spr<strong>in</strong>g cuckoo 50 56 75<br />
Autumn swallow 90 102 125<br />
We have to credit Hällström’s <strong>in</strong>spir<strong>in</strong>g lecture for the <strong>in</strong>itiation of the large real phenology network. Shortly<br />
after his death The F<strong>in</strong>nish Society of Science <strong>and</strong> Letters started it. The society distributed a detailed 70page<br />
booklet where c. 4000 (!)phenological events, whereof 1400 biological <strong>and</strong> <strong>in</strong>clud<strong>in</strong>g migration dates<br />
of 35 bird species, could be filled <strong>in</strong>. This <strong>in</strong>quiry to amateur nature observers is still go<strong>in</strong>g on, although<br />
much reduced. Local <strong>and</strong> national ornithological societies have taken over the ma<strong>in</strong> responsibility of<br />
collect<strong>in</strong>g the migration data on birds.<br />
I will present the F<strong>in</strong>nish history of phenological studies as far as arrival dates are concerned. I will also<br />
show prelim<strong>in</strong>ary results of correlative studies, which aim at reveal<strong>in</strong>g the relationships between weather<br />
variations <strong>and</strong> bird behaviour. In addition to arrival dates, a brief look at the effects of weather changes on<br />
tim<strong>in</strong>g of the complete summer schedule of a migratory passer<strong>in</strong>e, the Willow Warbler (Phylloscopus<br />
trochilus) is made.<br />
26
PHENOLOGY OF BRITISH BUTTERFLIES AND CLIMATE CHANGE<br />
D. Roy (1), T. Sparks (1)<br />
Centre for Ecology <strong>and</strong> Hydrology, Monks Wood, UK<br />
dbr@ceh.ac.uk, Fax - +44 (0) 1487 773467<br />
Butterflies are good organisms for study<strong>in</strong>g the effects of environmental change. Their activity is closely<br />
controlled by weather <strong>and</strong> many species are constra<strong>in</strong>ed by climate. Butterflies are also an ideal group for<br />
phenological record<strong>in</strong>g, as they are conspicuous <strong>and</strong> have a high public profile.<br />
In the British Butterfly Monitor<strong>in</strong>g Scheme (BMS), a national monitor<strong>in</strong>g network, there is a large amount<br />
of data on the flight periods of butterflies. <strong>Data</strong> from the BMS were analysed to test for relationships<br />
between temperature <strong>and</strong> three phenological measures - duration of flight period <strong>and</strong> tim<strong>in</strong>g of both first <strong>and</strong><br />
peak appearance. The BMS was established <strong>in</strong> 1976 to monitor the abundance of butterflies <strong>in</strong> the British<br />
Isles <strong>and</strong> there are currently over 120 sites <strong>in</strong> the scheme. <strong>Phenology</strong> parameters were calculated for almost<br />
31,000 <strong>in</strong>dividual flight periods for 35 species.<br />
First appearance of most British butterflies has advanced <strong>in</strong> the last two decades <strong>and</strong> is strongly related to<br />
earlier peak appearance <strong>and</strong>, for multibrooded species, longer flight period. Mean dates of first <strong>and</strong> peak<br />
appearance are exam<strong>in</strong>ed <strong>in</strong> relation to a temperature series for central Engl<strong>and</strong>, us<strong>in</strong>g regression techniques.<br />
For almost all species, there is a highly significant relationship with temperature of both first appearance <strong>and</strong><br />
peak flight date: warmer weather tended to produce earlier first <strong>and</strong> peak appearance. The most strik<strong>in</strong>g<br />
result is for earlier first <strong>and</strong> peak appearance with warm spr<strong>in</strong>g temperature, eg. the follow<strong>in</strong>g graph for<br />
Anthocharis cardam<strong>in</strong>es (Orange tip) suggests a response of 5 days per ºC.<br />
Record<strong>in</strong>g week<br />
10<br />
9<br />
8<br />
7<br />
6<br />
5<br />
3<br />
4<br />
5<br />
Mean February-April Temperature<br />
We predict that, <strong>in</strong> the absence of confound<strong>in</strong>g factors, such as <strong>in</strong>teractions with other organisms <strong>and</strong> l<strong>and</strong>use<br />
change, climate warm<strong>in</strong>g of the order of 1ºC could advance first <strong>and</strong> peak appearance of most butterflies<br />
by 2-10 days.<br />
6<br />
Peak appearance<br />
First appearance<br />
7<br />
8<br />
27
SESSION 1 PHENOLOGICAL MONITORING AND NETWORKS<br />
CANADA PLANTWATCH: TRENDS TO EARLIER SPRING DEVELOPMENT<br />
E.G. Beaubien<br />
Devonian Botanic Garden, University of Alberta, Canada<br />
e.beaubien@ualberta.ca/Fax 780.987.4141/Phone 780.987.5455<br />
Extensive phenology surveys began <strong>in</strong> Canada <strong>in</strong> the 1890's with an ambitious program launched by the<br />
Royal Society of Canada. The largest group of observers were students <strong>in</strong> Nova Scotia, who reported on up<br />
to 100 events up until the 1920's. Alberta has considerable current data with volunteer observers report<strong>in</strong>g<br />
on native species s<strong>in</strong>ce 1973. S<strong>in</strong>ce 1987, the Alberta Wildflower Survey has <strong>in</strong>volved about 200 volunteers<br />
report<strong>in</strong>g 3 flower<strong>in</strong>g stages for 15 native plants. Other prov<strong>in</strong>cial programs have started <strong>in</strong> the last 4 years<br />
(Nova Scotia <strong>and</strong> Newfoundl<strong>and</strong>).<br />
Plantwatch (www.devonian.ualberta.ca/pwatch) began <strong>in</strong> 1995 <strong>and</strong> now receives North American bloom<br />
dates for 7 native plant species plus <strong>in</strong>ternational data for common purple lilac (Syr<strong>in</strong>ga vulgaris). <strong>Data</strong><br />
tables <strong>and</strong> maps of bloom times are updated regularly on the Internet. Environment Canada's Ecological<br />
Monitor<strong>in</strong>g <strong>and</strong> Assessment Network now considers plant phenology as a core variable for monitor<strong>in</strong>g<br />
environmental change. The Plantwatch program will thus exp<strong>and</strong> <strong>in</strong> 2001, add<strong>in</strong>g more plant species<br />
suitable across wide areas of Canada, mov<strong>in</strong>g the website to Environment Canada, <strong>in</strong>volv<strong>in</strong>g representatives<br />
from all the prov<strong>in</strong>ces <strong>and</strong> territories, as well as gather<strong>in</strong>g promotional help from the Canadian Nature<br />
Federation. All the prov<strong>in</strong>ces <strong>and</strong> territories of Canada are be<strong>in</strong>g encouraged to start their own plant<br />
phenology surveys, us<strong>in</strong>g the selected Plantwatch species <strong>and</strong> add<strong>in</strong>g others suitable to their ecoregions.<br />
Western Canada has shown significant warm<strong>in</strong>g over the last decades, as opposed to parts of eastern Canada.<br />
Flower<strong>in</strong>g data reflects this change, with spr<strong>in</strong>g bloom times now occurr<strong>in</strong>g earlier. Tim<strong>in</strong>g of first bloom<br />
(10% pollen shed) of Populus tremuloides <strong>in</strong> Edmonton, Alberta now occurs almost a month earlier than it<br />
did a century ago. Major climatic events such as El N<strong>in</strong>o events which cause ocean warm<strong>in</strong>g, result <strong>in</strong> earlier<br />
bloom times <strong>in</strong> western Canada.<br />
28
EUROPEAN PHENOLOGY NETWORK – A NETWORK FOR INCREASING<br />
EFFICIENCY, ADDED VALUE AND USE OF PHENOLOGICAL MONITORING<br />
RESEARCH, AND DATA IN EUROPE<br />
A. J.H. van Vliet, R. S. de Groot<br />
Environmental Systems <strong>Analysis</strong> Group, Wagen<strong>in</strong>gen University, The Netherl<strong>and</strong>s<br />
arnold.vanvliet@algemeen.cmkw.wau.nl / Tel: +31 317 485091<br />
In February 2000 a proposal for a thematic network called European <strong>Phenology</strong> Monitor<strong>in</strong>g (EPN) was<br />
successfully submitted to subsection ‘Better exploitation of exist<strong>in</strong>g data <strong>and</strong> adaptation of exist<strong>in</strong>g<br />
observ<strong>in</strong>g systems’ of the Energy, Environment <strong>and</strong> Susta<strong>in</strong>able Development Theme of the Fifth<br />
Framework Programme.<br />
EPN aims to improve monitor<strong>in</strong>g, assessment <strong>and</strong> prediction of climate <strong>in</strong>duced phenological changes <strong>and</strong><br />
their effects <strong>in</strong> Europe. Its overall objective is to <strong>in</strong>crease the efficiency, added value <strong>and</strong> use of phenological<br />
monitor<strong>in</strong>g, phenological research <strong>and</strong> the practical application of phenological data <strong>in</strong> European member<br />
states <strong>in</strong> the context of global (climate) change. More specific objectives of the Phenological Thematic<br />
Network are:<br />
1. To facilitate <strong>in</strong>tegration <strong>and</strong> co-operation between exist<strong>in</strong>g phenological monitor<strong>in</strong>g networks <strong>and</strong> to<br />
actively stimulate expansion of exist<strong>in</strong>g <strong>and</strong> creation of new monitor<strong>in</strong>g networks.<br />
2. To improve the <strong>in</strong>tegration of, <strong>and</strong> access to phenological data <strong>in</strong> Europe <strong>in</strong> a systematic, structural <strong>and</strong><br />
user-friendly way.<br />
3. To exchange knowledge between phenologists of different scientific discipl<strong>in</strong>es (ecology, agriculture,<br />
human health) on tools <strong>and</strong> techniques used for phenological monitor<strong>in</strong>g, database development,<br />
(statistical) data analysis, model development, <strong>and</strong> impact assessment.<br />
4. To demonstrate the wide variety of possible applications of phenological research <strong>and</strong> its benefits for<br />
ecology, agriculture <strong>and</strong> society (human health <strong>and</strong> education) <strong>and</strong> realis<strong>in</strong>g a stronger <strong>in</strong>volvement of<br />
the end-users.<br />
The vision of the EPN-project is that of a cost-efficient, productive, <strong>and</strong> long last<strong>in</strong>g network that is easy<br />
accessible for everybody who is <strong>in</strong>terested.<br />
To realise the objectives <strong>and</strong> thus implement the Phenological Thematic Network the EPN-project will:<br />
A. Co-ord<strong>in</strong>ate the <strong>in</strong>tegration, co-operation, <strong>and</strong> further expansion of phenological networks <strong>in</strong> Europe<br />
(sub-tasks <strong>in</strong>clude (among others): network management, clarification of def<strong>in</strong>itions used, establishment<br />
of l<strong>in</strong>ks with educational programs, non-European networks, <strong>in</strong>ternational organisations, <strong>and</strong> potential<br />
fund<strong>in</strong>g organisations).<br />
B. Establish an on-l<strong>in</strong>e phenological metadatabase <strong>and</strong> a phenological bibliographical database (to improve<br />
acquisition, storage <strong>and</strong> accessibility).<br />
C. Organise two European conferences on phenology <strong>in</strong>volv<strong>in</strong>g data providers, scientists, (<strong>in</strong>ternational)<br />
organisations, commercial enterprises, policy makers <strong>and</strong> educational organisations.<br />
D. Organise six specialists workshops on essential topics (modell<strong>in</strong>g, use of earth observation data,<br />
phenology <strong>and</strong> human health, phenology <strong>and</strong> agriculture, bird migration <strong>and</strong> communication,<br />
dissem<strong>in</strong>ation <strong>and</strong> capacity build<strong>in</strong>g).<br />
EPN will result <strong>in</strong> <strong>in</strong>creased efficiency, added value <strong>and</strong> practical use of phenological research, monitor<strong>in</strong>g,<br />
<strong>and</strong> data-synthesis <strong>in</strong> Europe <strong>and</strong> will greatly enhance structural communication <strong>and</strong> co-operation between<br />
science <strong>and</strong> end-users of phenological data.<br />
29
SESSION 2B PLANT PHENOLOGY AND GLOBAL CHANGE<br />
PHYTOPHENOLOGICAL TRENDS IN SWITZERLAND<br />
C. Defila<br />
claudio.defila@meteoschweiz.ch<br />
S<strong>in</strong>ce 1951 there has been an observation network <strong>in</strong> Switzerl<strong>and</strong>. Today, at about 160 observation stations<br />
<strong>in</strong> different regions <strong>and</strong> at different levels of altitude, 69 phenological phases for 26 different plants are<br />
observed <strong>and</strong> their occurrences registered. S<strong>in</strong>ce 1986, 17 phytophenological phases have been reported<br />
from 40 stations. On the basis of these reports a weekly phenological bullet<strong>in</strong> is published dur<strong>in</strong>g the<br />
vegetation period <strong>and</strong> distributed via <strong>in</strong>ternet (www.meteoschweiz.ch).<br />
Connected with a possible climate change l<strong>in</strong>ear trend analyses have been carried out for 895 phenological<br />
time series at 68 stations <strong>and</strong> for 19 different phenological phases - this along with very old phenological<br />
time series <strong>in</strong> Switzerl<strong>and</strong> (emerg<strong>in</strong>g of the horse-chestnut <strong>in</strong> Geneva - 1808 until 2000 - <strong>and</strong> the full bloom<br />
of the cherry <strong>in</strong> Liestal - 1894 until 2000). The significance has been tested by an F-test (P>0.05). A<br />
significant l<strong>in</strong>ear trend could be found for 29,9 % of all the tested phenological phases. 11,1 % <strong>in</strong>dicate a<br />
positive trend (to later occurrences) <strong>and</strong> 18,9% a negative trend (to earlier occurrences). The average of the<br />
premature spr<strong>in</strong>g phases amounts to –8,9 days <strong>and</strong> the average delay of all autumn phases amounts to +1,2<br />
days. With<strong>in</strong> the 47 tested years a prolongation of the vegetation period of 10,1 days has been observed. At<br />
the phenological spr<strong>in</strong>g <strong>and</strong> summer phases the negative trends predom<strong>in</strong>ate strongly, whereas for the<br />
autumn phases the positive ones predom<strong>in</strong>ate slightly. By classify<strong>in</strong>g Switzerl<strong>and</strong> <strong>in</strong>to 7 different climatic<br />
regions, it is obvious to see that the ratio between the negative <strong>and</strong> the positive trends are different -<br />
depend<strong>in</strong>g on the region. Thus <strong>in</strong> the region of Rhe<strong>in</strong>bünden the negative trends predom<strong>in</strong>ate strongly<br />
whereas <strong>in</strong> the Valais the positive ones are predom<strong>in</strong>at<strong>in</strong>g. As far as the different levels of altitude are<br />
concerned, there are important differences. It is quite <strong>in</strong>terest<strong>in</strong>g that at altitudes of 900 m to 1100 m <strong>and</strong><br />
over 1300 m above sea level the negative trends predom<strong>in</strong>ate. It is conceivable that the alp<strong>in</strong>e plants, which<br />
live <strong>in</strong> a climatic frontier region, react stronger to the climate change than the plants <strong>in</strong> the lowl<strong>and</strong>, where<br />
the temperature is not a limit<strong>in</strong>g factor to the grow<strong>in</strong>g <strong>and</strong> develop<strong>in</strong>g of the plants.<br />
The time series of the horse-chestnut <strong>in</strong> Geneva (1808 – 2000) show from 1900 on a clear trend to earlier<br />
occurrences. This is due to the climate of the city of Geneva. For the full bloom of the cherry <strong>in</strong> Liestal,<br />
1894 – 2000 (a rural district) such a strong trend could not be noticed.<br />
Depend<strong>in</strong>g on the season, region, altitude <strong>and</strong> species of plants the phenological occurrences <strong>in</strong> Switzerl<strong>and</strong><br />
show different trends. Also <strong>in</strong> Switzerl<strong>and</strong> a tendency towards a prolonged vegetation period has been<br />
observed.<br />
30
LONG-TERM DEVELOPMENT OF CLIMATE AND PHENOLOGY OF BEECHES<br />
IN SOUTH-WESTERN GERMANY<br />
A. Kirchgäßner , H. Mayer<br />
Meteorological Institute, University of Freiburg, Germany<br />
kirchgam@uni-freiburg.de/ / Fax: +49-761-203 6922<br />
Prior to man's disruption, beech forests constituted about 75 percent of Europe's woodl<strong>and</strong>. Today, this<br />
proportion has decl<strong>in</strong>ed significantly. In Germany, there are now plans to partially reverse that trend. In spite<br />
of the importance of beech ecosystems to the l<strong>and</strong>scape of Central Europe, there is little <strong>in</strong>formation on the<br />
development of beech trees <strong>and</strong> the underly<strong>in</strong>g ecological <strong>and</strong> ecophysiological processes.<br />
Beech forests are generally characterised by high adaptability to different climatic conditions. However,<br />
knowledge of the various climatic factors that allow or foster the development of beech forests, their<br />
<strong>in</strong>teractions <strong>and</strong> their activities is still <strong>in</strong>sufficient. This <strong>in</strong>formation is however of great <strong>in</strong>terest <strong>in</strong> view of<br />
predicted climate change <strong>in</strong> Central Europe, where beeches are mostly circulated.<br />
With<strong>in</strong> the sub-project A1 of the collaborative research centre 433 (The <strong>in</strong>fluence of climate <strong>and</strong><br />
management on beech dom<strong>in</strong>ated deciduous forests) co-ord<strong>in</strong>ated by the Faculty of Forestry, University of<br />
Freiburg, the long-term <strong>in</strong>fluence of climate <strong>and</strong> weather on beech forests <strong>in</strong> a locally restricted area (app. 50<br />
km * 50 km) <strong>in</strong> south-western Germany is be<strong>in</strong>g exam<strong>in</strong>ed. The <strong>in</strong>vestigation is based on retrospective<br />
analysis of long-term climate data <strong>and</strong> phenological data (bud burst, flower<strong>in</strong>g, colour<strong>in</strong>g of the leafs, full<br />
ripe fruit, leaf fall). This data sets, cover<strong>in</strong>g the last 50 years, were obta<strong>in</strong>ed from German Weather Service<br />
Stations <strong>in</strong> the vic<strong>in</strong>ity of the ma<strong>in</strong> sample area. The sites are situated at an altitude rang<strong>in</strong>g from 500 m<br />
above sea level to 900 m above sea level.<br />
In the first place beeches' response to climate conditions <strong>and</strong> the occurrence of stress situations like late frost<br />
or dryness dur<strong>in</strong>g their grow<strong>in</strong>g season on the respective locations has now been analysed. Present results<br />
are as follows:<br />
** the tim<strong>in</strong>g of bud burst <strong>and</strong> leaf fall didn't change significantly, although locally different trends<br />
without statistical significance were observed<br />
** the grow<strong>in</strong>g season with respect to beech is neither prolonged, shortened nor altered with<strong>in</strong> the year<br />
with statistical significance<br />
** <strong>in</strong> most of the years with an extended grow<strong>in</strong>g season, the time span between bud burst <strong>and</strong><br />
flower<strong>in</strong>g is shortened<br />
** the sum of daily mean air temperature dur<strong>in</strong>g the four weeks preced<strong>in</strong>g the day of bud burst is<br />
essentially the same for all stations <strong>and</strong> adds up to approximately 340°C<br />
** the sum of daily mean air temperature below 0°C from 1 st of January till the day of the bud burst<br />
<strong>in</strong>creases with the elevation above sea level of the station. A comparable trend could not be<br />
observed with the sum of the daily mean air temperature <strong>and</strong> the sum of daily means of air<br />
temperature above 0°C.<br />
31
TRENDS IN PHENOLOGICAL STUDIES IN ARGENTINA<br />
A. Faggi (1), O. Scarpati (2) <strong>and</strong> L. Spescha (3)<br />
(1) Flores University, Camacúa 282, 1406 Buenos Aires, Argent<strong>in</strong>a<br />
(2) CEFYBO-CONICET, Serrano 669, 1414 Buenos Aires, Argent<strong>in</strong>a<br />
(3) Agronomy Faculty UBA<br />
Phenological studies <strong>in</strong> Argent<strong>in</strong>a began at the end of the 19. Century. The first studies were carried out <strong>in</strong><br />
the ma<strong>in</strong> cities of the country <strong>in</strong> order to f<strong>in</strong>d correlation between perennial ornamental species <strong>and</strong> local<br />
climate.<br />
In the middle of the 20. Century a systematic network has been built up at the Agriculture Department of the<br />
National Meteorological Service. The aim of this effort was to obta<strong>in</strong> the bioclimatic requirements of annual<br />
species such as the ma<strong>in</strong> crops <strong>and</strong> perennials like fruit trees.<br />
When this department was closed study groups with different scopes cont<strong>in</strong>ued the phenological studies.<br />
Each one focused different features like ecology, physiology <strong>and</strong> plant breed<strong>in</strong>g.<br />
Nowadays phenology is used <strong>in</strong> the election of cultivars <strong>and</strong> there is a revival of phenology regard<strong>in</strong>g urban<br />
ecology, <strong>in</strong> order to f<strong>in</strong>d biological <strong>in</strong>dicators for climate studies <strong>and</strong> urban plann<strong>in</strong>g.<br />
32
OLIVE PHENOLOGY: INDICATOR OF GLOBAL WARMING IN THE<br />
MEDITERRANEAN<br />
C. Osborne (2), I. Chu<strong>in</strong>e (1), D. V<strong>in</strong>er (3) & F.I. Woodward (2)<br />
(1) Institut des Sciences de l’Evolution de Montpellier, Université Montpellier II, France<br />
(2) Department of Animal <strong>and</strong> Plant Sciences, University of Sheffield, UK<br />
(3) Climatic Research Unit, University of East Anglia, Norwich, UK<br />
chu<strong>in</strong>e@isem.univ-montp2.fr/Fax: +33-4 67 04 20 32<br />
Olive flower<strong>in</strong>g phenology has been shown to be strongly <strong>in</strong>fluenced by Spr<strong>in</strong>g temperatures <strong>in</strong><br />
experimental <strong>and</strong> modell<strong>in</strong>g work, as illustrated by Fig. 1. S<strong>in</strong>ce airborne pollen concentrations reflect the<br />
flower<strong>in</strong>g phenology of olive populations with<strong>in</strong> a radius of 50 km, they may be a sensitive regional<br />
<strong>in</strong>dicator of climatic warm<strong>in</strong>g. We assessed this potential sensitivity with phenology models fitted to<br />
flower<strong>in</strong>g dates <strong>in</strong>ferred from maximum airborne pollen data. Of four models tested, a thermal time model<br />
gave the best fit for Montpellier, France, <strong>and</strong> was the most effective at the regional scale, provid<strong>in</strong>g<br />
reasonable predictions for 10 sites <strong>in</strong> the western Mediterranean. This model was forced with replicated<br />
future temperature simulations for the western Mediterranean from a coupled ocean-atmosphere general<br />
circulation model (GCM). The GCM temperatures rose by 4.5°C between 1990 <strong>and</strong> 2099 with a 1% per year<br />
<strong>in</strong>crease <strong>in</strong> greenhouse gases, <strong>and</strong> modelled flower<strong>in</strong>g date advanced at a rate of 6.2 d per °C. The results<br />
<strong>in</strong>dicated that this long-term regional trend <strong>in</strong> phenology might be statistically significant as early as 2030,<br />
but with marked spatial variation <strong>in</strong> magnitude, with the calculated flower<strong>in</strong>g date between the 1990s <strong>and</strong><br />
2030s advanc<strong>in</strong>g by 3–23 d (Fig.2). Future monitor<strong>in</strong>g of airborne olive pollen may therefore provide an<br />
early biological <strong>in</strong>dicator of climatic warm<strong>in</strong>g <strong>in</strong> the Mediterranean.<br />
Figure 2. Predicted change <strong>in</strong> olive flower<strong>in</strong>g date<br />
under <strong>Global</strong> Warm<strong>in</strong>g <strong>in</strong> the Mediterranean.<br />
Flower<strong>in</strong>g Date (DOY)<br />
Mean Temperature (°C)<br />
.<br />
170<br />
160<br />
150<br />
140<br />
13<br />
12<br />
11<br />
10<br />
1975 1980 1985 1990<br />
Year<br />
Figure 1. Variations of temperature <strong>and</strong> olive<br />
flower<strong>in</strong>g dates <strong>in</strong> Montpellier, France from<br />
1973.<br />
33
REGIONAL TRENDS OF THE BEGINNING OF GROWING SEASON IN<br />
EUROPE AND POSSIBLE CLIMATIC CAUSES<br />
F.-M. Chmielewski, Th. Rötzer<br />
Humboldt-University Berl<strong>in</strong>, Section of Agricultural Meteorology, Berl<strong>in</strong>, Germany<br />
chmielew@agrar.hu-berl<strong>in</strong>.de / Fax: +49-30-31471211<br />
In order to study relationships between climate changes <strong>and</strong> plant development phenological data from the<br />
International Phenological Gardens (IPG), gridded surface temperatures (NCEP/NCAR reanalysis data 1 ) <strong>and</strong><br />
the North Atlantic Oscillation (NAO) Index 2 for the period 1969-1998 were used. For the <strong>in</strong>vestigation of<br />
regional phenological trends <strong>in</strong> Europe twelve natural regions across Europe were def<strong>in</strong>ed 3 .<br />
The aim of this <strong>in</strong>vestigation was to show whether the observed regional or Europe-wide trends <strong>in</strong> the<br />
beg<strong>in</strong>n<strong>in</strong>g of grow<strong>in</strong>g season 4 correspond with climatic trends on the same scale. In most European regions<br />
the mean grow<strong>in</strong>g season a starts <strong>in</strong> April. In Sc<strong>and</strong><strong>in</strong>avia it is delayed up to one month <strong>and</strong> <strong>in</strong> Portugal it<br />
already starts <strong>in</strong> March. In Europe the beg<strong>in</strong>n<strong>in</strong>g of grow<strong>in</strong>g season has advanced 2.7 days per decade, for<br />
the 1969-98 period altogether by 8 days. Most of the European regions show significant negative trends<br />
which range between three <strong>and</strong> six days per decade. The strongest trends were observed <strong>in</strong> the natural<br />
regions ‘British Isles/Channel Coast’, ‘North Sea <strong>and</strong> European Lowl<strong>and</strong>s’, ‘Northern <strong>and</strong> Southern<br />
European Highl<strong>and</strong>s’ as well as <strong>in</strong> the ‘North Alp<strong>in</strong>e Forel<strong>and</strong>’. Only weak trends were found <strong>in</strong> ‘North<br />
Sc<strong>and</strong><strong>in</strong>avia’ <strong>and</strong> <strong>in</strong> southeast Europe. In the latter region even a positive trend has been noticed.<br />
80<br />
8 BGS = 149.4 - 6.68 T24<br />
80<br />
1965 1970 1975 1980 1985 1990 1995 2000 4 5 6 7 8<br />
The advanced Year<br />
Air temperature<br />
beg<strong>in</strong>n<strong>in</strong>g of<br />
grow<strong>in</strong>g season corresponds well with positive trends <strong>in</strong> surface air temperature <strong>in</strong> Central Europe.<br />
Significant correlation were calculated between average air temperature from February to April <strong>and</strong> the<br />
beg<strong>in</strong>n<strong>in</strong>g of grow<strong>in</strong>g season <strong>in</strong> nearly all natural regions. Depend<strong>in</strong>g on the region the temperature either <strong>in</strong><br />
February, March or April shows the highest correlation coefficient. The North Atlantic Oscillation<br />
<strong>in</strong>fluences the annual climate on the North Atlantic ocean <strong>and</strong> <strong>in</strong> Central-Europe to a great extend. Positive<br />
phases of the NAO from January to April tend to be associated with above-normal temperatures ma<strong>in</strong>ly <strong>in</strong><br />
northern Europe as well as below-normal temperatures <strong>in</strong> southeast Europe. The NAO-Index from January<br />
to April shows a remarkably positive trend with predom<strong>in</strong>ant positive phases ma<strong>in</strong>ly s<strong>in</strong>ce 1989. This can<br />
expla<strong>in</strong> the observed positive trends <strong>in</strong> air temperatures <strong>and</strong> as a result the premature beg<strong>in</strong>n<strong>in</strong>g of grow<strong>in</strong>g<br />
season <strong>in</strong> most natural regions.<br />
34<br />
BGS <strong>in</strong> Europe<br />
130<br />
130<br />
120<br />
110<br />
100<br />
90<br />
BGS Air temperature BGS<br />
°C)<br />
0<br />
2<br />
4<br />
120<br />
110<br />
)<br />
)<br />
)<br />
)<br />
) )<br />
) )<br />
)<br />
)<br />
)<br />
) )<br />
) )<br />
) ) )<br />
)<br />
) )<br />
)<br />
)<br />
r=-0.83<br />
Fig.1:<br />
Relationships<br />
between air<br />
temperature<br />
from February<br />
to April (T24 <strong>in</strong><br />
<strong>and</strong> the<br />
T24<br />
6<br />
100<br />
90<br />
)<br />
)<br />
beg<strong>in</strong>n<strong>in</strong>g of<br />
grow<strong>in</strong>g season<br />
<strong>in</strong> Europe (BGS<br />
<strong>in</strong> days).<br />
1 Kalnay et al. 1996: The NCEP/NCAR 40-Year Reanalysis Project. BAM, 437-471.<br />
2 Hurrel, J.W., 1995: Decadal trends <strong>in</strong> the North Atlantic Oscillation <strong>and</strong> relationships to regional<br />
temperature <strong>and</strong> precipitation. Science 269, 676-679.<br />
3 Rötzer, Th.; Chmielewski, F.-M.: Trends of grow<strong>in</strong>g season <strong>in</strong> Europe. In: Arboreta Phaenologica -<br />
Information of the IPG work<strong>in</strong>g group, 43, 2000, 3-13.<br />
4 Menzel, A., Fabian, P. 1999: Grow<strong>in</strong>g season extended <strong>in</strong> Europe. Nature 397, 659.<br />
a average date of leaf unfold<strong>in</strong>g of Betula pubescens, Prunus avium, Sorbus aucuparia <strong>and</strong> Ribes alp<strong>in</strong>um
SESSION 3 PHENOLOGY AND REMOTE SENSING<br />
NORTHERN PHOTOSYNTHETIC AND GROWING SEASON TRENDS FROM<br />
1981 TO 1999<br />
C. J. Tucker(1), D. Slayback(1), J. P<strong>in</strong>zon(1), S. Los(1), R. Myneni(2), M. Paris(1)<br />
(1)Laboratory for Terrestrial Physics, NASA/Goddard Space Flight Center, USA<br />
(2)Department of Geography, Boston Univeristy, USA<br />
Satellite data from 1981 to 1999 show <strong>in</strong>creases <strong>in</strong> l<strong>and</strong> photosynthesis <strong>and</strong> a lengthen<strong>in</strong>g of the grow<strong>in</strong>g<br />
season at northern latitudes. Two dist<strong>in</strong>ct periods of <strong>in</strong>creas<strong>in</strong>g plant growth were apparent: 1981 to 1991<br />
<strong>and</strong> 1992 to 1999, punctuated by a reduction <strong>in</strong> gross photosynthesis from 1991 to 1992 associated with<br />
global cool<strong>in</strong>g from the volcanic eruption of Mt. P<strong>in</strong>atubo <strong>in</strong> June 1991. May-September gross<br />
photosynthesis <strong>in</strong>creased ~8-14% from 1992 to 1999 from 55 - 75o N. An earlier start of the grow<strong>in</strong>g<br />
season of 6 ± 1 days from 55 - 75o N was also found. Our results show the response of northern vegetation<br />
to spr<strong>in</strong>g <strong>and</strong> summer temperatures from 1981-1999 where temperature limits plant growth.<br />
35
ASSESSING SATELLITE-DERIVED PHENOLOGY IN NORTH AMERICA<br />
M. D. Schwartz<br />
Department of Geography, University of Wiscons<strong>in</strong>-Milwaukee, USA<br />
mds@uwm.edu/Fax: 414-229-3981<br />
The renewal of vegetative growth dur<strong>in</strong>g the onset of mid-latitude spr<strong>in</strong>g is a critical aspect of atmospherebiosphere<br />
<strong>in</strong>teraction, with implications for global climate change. Spr<strong>in</strong>g’s onset can be observed through a<br />
variety of data <strong>in</strong>clud<strong>in</strong>g: native species phenology, <strong>in</strong>dicator phenology, satellite-derived metrics, <strong>and</strong><br />
observed variations <strong>in</strong> meteorological data. While each of these components describes portions of the<br />
“green wave,” none is sufficient alone to provide a comprehensive assessment of the phenomena. Thus, an<br />
<strong>in</strong>tegrated approach, which allows for constructive <strong>in</strong>teraction between the components, has the best<br />
prospects for accurately track<strong>in</strong>g the onset of spr<strong>in</strong>g at a global scale.<br />
Satellite-derived metrics provide global coverage capabilities, but are generally of limited temporal<br />
resolution due to cloud-cover <strong>in</strong>terference <strong>and</strong> other problems. In this paper, a new generation of start-ofseason<br />
(SOS, developed by Bradley Reed <strong>and</strong> associates at the EROS <strong>Data</strong> Center) satellite-derived metrics<br />
are evaluated at 627 surface weather station sites distributed across the cont<strong>in</strong>ental USA. At each site a<br />
10x10 w<strong>in</strong>dow (100 one km-sized pixels) centered on the station is extracted, with modal SOS dates<br />
developed for each l<strong>and</strong> cover type present (BATS 28 class scheme). They are then compared to surface<br />
phenological model output (spr<strong>in</strong>g <strong>in</strong>dices) at all locations, <strong>and</strong> native species phenological data at a few<br />
selected sites.<br />
The results show that the SOS metric dates are earlier on average (40 days) than surface phenological model<br />
output, but also more early <strong>in</strong> cooler northern regions (60 days) than <strong>in</strong> warmer southern areas (20 days).<br />
Despite these differences, the new SOS metrics appear to be captur<strong>in</strong>g part of the year-to-year departure<br />
signal over all sites (Fig. 1), <strong>and</strong> even more when compared with native species <strong>and</strong> spr<strong>in</strong>g <strong>in</strong>dex model<br />
output at a specific site (Fig. 2). Further comparative study, <strong>and</strong> the collection of native species<br />
phenological data <strong>in</strong> an exp<strong>and</strong><strong>in</strong>g world-wide network, will cont<strong>in</strong>ue to improve global assessment of the<br />
spr<strong>in</strong>g green wave phenomena.<br />
36
AN ANALYSIS OF TEMPORAL RELATIONSHIPS BETWEEN PLANT<br />
COMMUNITY PHENOLOGY AND SEASONAL NDVI METRICS IN NORTHERN<br />
CHINA<br />
X. Chen<br />
Department of Urban <strong>and</strong> Environmental Sciences, Pek<strong>in</strong>g University, Beij<strong>in</strong>g, Ch<strong>in</strong>a<br />
cxq@urban.pku.edu.cn /Fax: +86-10-62751187<br />
The objectives of this study are to reveal relationships between phenological development of local plant<br />
communities <strong>and</strong> seasonal metrics of satellite sensor-derived greenness at the representative stations <strong>and</strong> the<br />
pixels overly<strong>in</strong>g them, <strong>and</strong> to explore the reliability for determ<strong>in</strong><strong>in</strong>g the grow<strong>in</strong>g season of l<strong>and</strong> vegetation at<br />
a regional scale, us<strong>in</strong>g threshold values of greenness obta<strong>in</strong>ed by a surface-satellite analysis. The cumulative<br />
frequency of phenophases has been calculated for each plant community <strong>and</strong> each year <strong>in</strong> order to determ<strong>in</strong>e<br />
the grow<strong>in</strong>g season at the three sample stations dur<strong>in</strong>g 1982 <strong>and</strong> 1993. The precise thresholds were<br />
arbitrarily set as the dates on which the phenological cumulative frequency reaches 5% <strong>and</strong> 10% (for the<br />
beg<strong>in</strong>n<strong>in</strong>g date) <strong>and</strong> 90% <strong>and</strong> 95% (for the end date). The beg<strong>in</strong>n<strong>in</strong>g <strong>and</strong> end dates of the grow<strong>in</strong>g season<br />
were then applied each year as time thresholds to determ<strong>in</strong>e the correspond<strong>in</strong>g 10-day peak greenness values<br />
on the NDVI curves for 8km 2 pixels overly<strong>in</strong>g the phenological stations. The ma<strong>in</strong> relationships between the<br />
beg<strong>in</strong>n<strong>in</strong>g <strong>and</strong> end dates of the grow<strong>in</strong>g season <strong>and</strong> the correspond<strong>in</strong>g greenness values, <strong>and</strong> their potential<br />
applications <strong>in</strong> determ<strong>in</strong><strong>in</strong>g grow<strong>in</strong>g season are summarized as follows:<br />
(1) There is a high positive correlation between the beg<strong>in</strong>n<strong>in</strong>g dates (cumulative frequency of 5% <strong>and</strong> 10%)<br />
<strong>and</strong> between the end dates (cumulative frequency of 90% <strong>and</strong> 95%) of the grow<strong>in</strong>g seasons, which <strong>in</strong>dicates<br />
that the beg<strong>in</strong>n<strong>in</strong>g dates <strong>and</strong> end dates of the grow<strong>in</strong>g seasons have a consistent advance <strong>and</strong> delay trend,<br />
respectively. In addition, there is a high negative correlation between the beg<strong>in</strong>n<strong>in</strong>g <strong>and</strong> end dates of the<br />
grow<strong>in</strong>g seasons, i.e. the earlier the beg<strong>in</strong>n<strong>in</strong>g date occurs, the later the end date will appear. Accord<strong>in</strong>g to a<br />
trend analysis, a lengthen<strong>in</strong>g of the grow<strong>in</strong>g seasons has been detected <strong>in</strong> the north <strong>and</strong> middle parts of the<br />
research region dur<strong>in</strong>g 1982 <strong>and</strong> 1993.<br />
(2) The correlation between the beg<strong>in</strong>n<strong>in</strong>g date of the grow<strong>in</strong>g season <strong>and</strong> the correspond<strong>in</strong>g threshold value<br />
of greenness is very low, which means that the satellite sensor-derived greenness is <strong>in</strong>dependent of the<br />
beg<strong>in</strong>n<strong>in</strong>g date of the grow<strong>in</strong>g season. If the fluctuation of greenness value is <strong>in</strong>significant, we can assume<br />
that whenever the grow<strong>in</strong>g season beg<strong>in</strong>s <strong>in</strong> a year <strong>and</strong> at a given site of the research region, the<br />
correspond<strong>in</strong>g greenness value would reta<strong>in</strong> relative stable. In other words, we could use the average<br />
threshold value of greenness to roughly determ<strong>in</strong>e the onset of the grow<strong>in</strong>g season for each year. In order to<br />
estimate the onset of the grow<strong>in</strong>g season at sites without surface phenological data, the sample site <strong>and</strong> the<br />
extrapolation site should have similar vegetation <strong>and</strong> similar temporal NDVI profile. So, we could use the<br />
average threshold value of greenness obta<strong>in</strong>ed at the sample site to estimate the yearly onset of the grow<strong>in</strong>g<br />
season on the NDVI curve of the extrapolation site. However, if the fluctuation of greenness value is<br />
significant, the above extrapolation procedure could not be carried out.<br />
(3) Other than <strong>in</strong> spr<strong>in</strong>g, the correlation between the end date of the grow<strong>in</strong>g season <strong>and</strong> the correspond<strong>in</strong>g<br />
threshold value of greenness is very high. The negative correlation shows that the earlier the grow<strong>in</strong>g season<br />
term<strong>in</strong>ates, the larger the correspond<strong>in</strong>g threshold value of greenness would be. This result is probably due<br />
to the radiative properties of other vegetation <strong>and</strong> environmental factors <strong>in</strong> the research region dur<strong>in</strong>g the end<br />
of the grow<strong>in</strong>g season. On the basis of this relation, regression equations could be established between the<br />
end date of grow<strong>in</strong>g season <strong>and</strong> the correspond<strong>in</strong>g greenness value for the sample sites, so that the end date<br />
of the grow<strong>in</strong>g season could be estimated at other sites with similar vegetation, us<strong>in</strong>g the NDVI data. Under<br />
this circumstance, we assume that the statistical relationships described by the regression equations are not<br />
only suitable for the sample sites but also for other sites with<strong>in</strong> the research region.<br />
37
EUROPEAN GREEN WAVE OBSERVED IN NOAA/AVHRR NDVI DATA AND<br />
IN THE INTERNATIONAL PHENOLOGICAL GARDENS<br />
M.M. Hirschberg 1 , A. Menzel 1 <strong>and</strong> C.J. Tucker 2<br />
(1) Chair of Bioclimatology <strong>and</strong> Pollution Research, Technical University of Munich, Germany<br />
(2) Goddard Space Flight Center, NASA, USA<br />
hirschberg@met.forst.tu-muenchen.de // Fax: (+49) 8161 – 714753<br />
Europe has a very unique phenological net of ground stations (the International Phenological Gardens,<br />
IPG, founded <strong>in</strong> 1957), where genetically identical clones of trees <strong>and</strong> shrubs can act as an <strong>in</strong>dicator of<br />
various climatic <strong>in</strong>fluences. The network covers a large European area from 69°N to 42°N, <strong>and</strong> from 10°W<br />
to 27°E <strong>in</strong> all important climatic zones. Up to now more than 30 years of observations of phenological<br />
phases, such as the day of leaf unfold<strong>in</strong>g, May shoot, flower<strong>in</strong>g, leaf color<strong>in</strong>g <strong>and</strong> leaf fall can show the<br />
year-to-year variability of the seasonal active period <strong>in</strong> Europe. However, they are obta<strong>in</strong>ed only at s<strong>in</strong>gle<br />
sites.<br />
On the other h<strong>and</strong> satellite data observed from a space platform like the Normalized Difference Vegetation<br />
Index (NDVI) can also <strong>in</strong>dicate the length of the grow<strong>in</strong>g season <strong>in</strong> Europe on a spatial scale. Specially <strong>in</strong><br />
Central Europe, where l<strong>and</strong> cover is highly variable <strong>and</strong> large connected areas with the same vegetation type<br />
are rare, it is important to comb<strong>in</strong>e ground <strong>and</strong> space observations. Detect<strong>in</strong>g the real start, maximum <strong>and</strong><br />
the end of the grow<strong>in</strong>g period <strong>in</strong> the NDVI data is one aim of the <strong>in</strong>vestigation.<br />
This study will show a comparison of trends of the European green wave observed <strong>in</strong> ground <strong>and</strong> satellite<br />
data at different IPG sites. The calculated trends of the five observed phases of the IPG stations will be<br />
compared with trends of a new available NOAA/AVHRR maximum NDVI l<strong>and</strong> data set, produced by the<br />
NASA/GSFC, with a resolution of 8×8 km <strong>and</strong> a temporal frequency of 15 days from 1981 to 1998. From<br />
ground observations <strong>in</strong> southern Germany a mean entry day for the beg<strong>in</strong>n<strong>in</strong>g of the different phenological<br />
phases will be calculated <strong>and</strong> the correspond<strong>in</strong>g NDVI value determ<strong>in</strong>ed. We will discuss the beg<strong>in</strong>n<strong>in</strong>g of<br />
spr<strong>in</strong>g <strong>and</strong> autumn <strong>and</strong> the length of season <strong>in</strong> both data sets <strong>in</strong> Northern, Central <strong>and</strong> Southern Europe.<br />
38
THE IMPACT OF VEGETATION SEASONALITY ON GLOBAL CARBON<br />
BUDGETS: A COMPARISON OF LPJ MODEL RESULTS WITH SATELLITE<br />
OBSERVATIONS<br />
W. Lucht, A. Bondeau, S. Sitch <strong>and</strong> W. Cramer<br />
Potsdam Institute for Climate Impact Research, Potsdam, Germany<br />
Wolfgang.Lucht@pik-potsdam.de<br />
Phenological dates provide markers for the tim<strong>in</strong>g of key stages <strong>in</strong> the seasonal development of plants. They<br />
thus provide important constra<strong>in</strong>ts for models aim<strong>in</strong>g to correctly simulate the temporal development of<br />
vegetation throughout the year. One class of such models are biogeochemical models used to study the<br />
important contribution of the terrestrial biosphere to the global carbon cycle, <strong>and</strong> hence to the atmospheric<br />
concentrations of the greenhouse gas CO2.<br />
The amount of carbon stored <strong>in</strong> vegetation, the amount transferred from vegetation to soil pools, <strong>and</strong> the<br />
annual fluxes of carbon between the biosphere <strong>and</strong> the atmosphere depend on many variables. Most focus<br />
has been on the <strong>in</strong>fluences of precipitation, temperature <strong>and</strong> atmospheric CO2 concentration, all of which are<br />
subject to change under climate change. The importance of changes <strong>in</strong> available radiation, for example as a<br />
consequence of chang<strong>in</strong>g cloud<strong>in</strong>ess, has been studied much less. In this work, the emphasis is on the<br />
important <strong>in</strong>fluence of the length <strong>and</strong> tim<strong>in</strong>g of the seasonal cycle upon the yearly accumulated radiation<br />
available to plants for their photosynthesis, i.e. the <strong>in</strong>fluence of grow<strong>in</strong>g season length, tim<strong>in</strong>g of spr<strong>in</strong>g<br />
greenup, <strong>and</strong> the detailed evolution of the canopy through the year.<br />
Net primary productivity (NPP) is highly correlated with APAR, the absorbed photosynthetically active<br />
radiation. APAR is a function of PAR, depend<strong>in</strong>g of cloud<strong>in</strong>ess, latitude <strong>and</strong> time of year, <strong>and</strong> of fPAR, the<br />
fraction absorbed by plants <strong>and</strong> used for photosynthesis. fPAR is a function of canopy structure <strong>and</strong> leaf area<br />
<strong>in</strong>dex (LAI). The seasonal development of LAI determ<strong>in</strong>es at what times of the year PAR is effective for<br />
photosynthesis. PAR is lower <strong>in</strong> w<strong>in</strong>ter because of shorter days <strong>and</strong> lower sun angle, <strong>and</strong> higher <strong>in</strong> summer.<br />
The convolution of the temporal evolution of PAR <strong>and</strong> of the temporal evolution of fPAR, i.e., LAI, is<br />
therefore of primary importance to the value of NPP achieved over a year.<br />
The present research <strong>in</strong>vestigates the <strong>in</strong>fluence of seasonality upon the carbon stores <strong>and</strong> fluxes <strong>in</strong> the Lund-<br />
Potsdam-Jena Dynamic <strong>Global</strong> Vegetation Model (LPJ-DGVM). LPJ is a state-of-the-art process model of<br />
vegetation seasonal <strong>and</strong> annual dynamics, growth, mortality <strong>and</strong> establishment, soil dynamics <strong>and</strong><br />
disturbance that predicts the annual non-equilibrium productivity of the biosphere as a function of<br />
meteorological variables <strong>and</strong> soil type by simulat<strong>in</strong>g biospheric carbon uptake <strong>and</strong> release. In the course of<br />
the computation, the spatial <strong>and</strong> temporal patterns of vegetation activity of a few basic plant functional types<br />
are calculated. Currently, seasonality is represented <strong>in</strong> the model <strong>in</strong> a very simple form. All plants are<br />
assumed to beg<strong>in</strong> greenup when a 5 degree grow<strong>in</strong>g degree day requirement is met, <strong>and</strong> the greenup<br />
evolution is determ<strong>in</strong>ed by a fixed number of grow<strong>in</strong>g degree days (200) ramp<strong>in</strong>g up to full foliage. Fall or<br />
water stress senescense consists of an abrupt dropp<strong>in</strong>g of leaves. The sensitivity of the model to the<br />
parameters govern<strong>in</strong>g these phenological phases, <strong>and</strong> hence the sensitivity to vegetation seasonality, is<br />
exam<strong>in</strong>ed to demonstrate the importance of tim<strong>in</strong>g <strong>in</strong> the global carbon cycle.<br />
Long global time series of AVHRR satellite data are used to compare the seasonality achieved by the model<br />
with that observed from space. Geographic areas where the model fails to reproduce the observed<br />
phenological tim<strong>in</strong>g are identified. Improvements of the model can be achieved ma<strong>in</strong>ly for the Siberian larch<br />
forests <strong>and</strong> South American ra<strong>in</strong>green forests. The <strong>in</strong>terannual variability of phenological tim<strong>in</strong>g serves to<br />
assess the importance of seasonality on the <strong>in</strong>terannual variations of carbon fluxes between the biosphere<br />
<strong>and</strong> the atmosphere. The results emphasize the importance of underst<strong>and</strong><strong>in</strong>g the physiological basis, <strong>and</strong> of<br />
observ<strong>in</strong>g the actual tim<strong>in</strong>g of vegetation seasonality on the ground <strong>and</strong> with satellites.<br />
39
TRENDS IN NOAA/AVHRR NDVI AND PHENOLOGICAL RECORDS IN<br />
GERMANY FROM 1981-1998<br />
A. Menzel 1 <strong>and</strong> C.J. Tucker 2<br />
(1) Chair of Bioclimatology <strong>and</strong> Pollution Research, Technical University of Munich, Germany<br />
(2) Goddard Space Flight Center, NASA, USA<br />
menzel@met.forst.tu-muenchen.de // Fax: (+49) 8161 – 714753<br />
Plant <strong>and</strong> animal phenological observations as well as satellite data, analyses of yearly temperature<br />
variations <strong>and</strong> proxy data such as river <strong>and</strong> lake ice cover suggest changes <strong>in</strong> the tim<strong>in</strong>g of events <strong>in</strong> the<br />
seasonal cycle. This study compares results of trend analyses of phenological ground observations made<br />
with<strong>in</strong> the phenological network of the German Weather Service (DWD) to changes <strong>in</strong> the tim<strong>in</strong>g of start<br />
<strong>and</strong> end of the grow<strong>in</strong>g season derived from NDVI data for Germany.<br />
The NDVI (normalised difference vegetation <strong>in</strong>dex) data set used is the GIMMS st<strong>and</strong>ard 8-km cont<strong>in</strong>ental<br />
product, derived from AVHRR sensors on board of NOAA satellites, which extends from 1982-1998.<br />
Methods of spatial averag<strong>in</strong>g these bi-monthly NDVI maximum value composites for Germany <strong>and</strong> deriv<strong>in</strong>g<br />
parameters for start <strong>and</strong> end of the grow<strong>in</strong>g season are discussed <strong>and</strong> first results are presented.<br />
Spatial phenological averages for Germany are calculated by means of yearly anomalies for 16 phenological<br />
phases <strong>and</strong> for the length of the grow<strong>in</strong>g season (time span from leaf unfold<strong>in</strong>g to leaf colour<strong>in</strong>g) of 4<br />
deciduous tree species for the period 1951-1998. For these phenological key phases the trends of spatially<br />
averaged yearly anomalies are compared to mean l<strong>in</strong>ear trends of s<strong>in</strong>gle station records. The analysis of<br />
spatial variability of these trends, as shown <strong>in</strong> maps <strong>and</strong> analysed by multiple l<strong>in</strong>ear regressions, do not<br />
reveal any substantial regional differences.<br />
40
INTERANNUAL VARIATIONS OF BUDBURST OF DECIDUOUS FORESTS IN<br />
CENTRAL AND WESTERN EUROPE DERIVED FROM A 10 YEARS DAILY<br />
NOAA/AVHRR 1KM ARCHIVE, GROUND-BASED PHENOLOGICAL<br />
OBSERVATIONS AND ECOSYSTEM MODEL SIMULATIONS<br />
A. Bondeau(1), K. Böttcher(1), W. Lucht(1), E. Dufrêne(2), J. Schaber(1)<br />
(1) Potsdam Institute of Climate Impact Research, Potsdam, Germany<br />
(2) Laboratoire d’Ecologie Végétale, Paris-Orsay, France<br />
alberte@pik-potsdam.de/FAX: +49-331-288-2695<br />
The detection of budburst of temperate deciduous forests from satellite observations provides new<br />
opportunities for the study of regional variations <strong>in</strong> climatic variability, while simultaneously yield<strong>in</strong>g a<br />
powerful test of the ecosystem process models that are now used to predict the impacts of climatic changes.<br />
Across a broad range of climatic conditions <strong>in</strong> central <strong>and</strong> western Europe, six deciduous forests were<br />
selected that were i) homogeneous <strong>and</strong> large enough to be monitored us<strong>in</strong>g a 1km NOAA-AVHRR time<br />
series (1989-1998), <strong>and</strong> ii) close enough to phenological gardens where ground observations are available<br />
for this time period. We used a simple algorithm to retrieve a budburst date from the daily satellite data. For<br />
the different forests, the satellite retrieved budburst dates compared well with the observed budburst dates on<br />
the ground. These results add confidence to the potential use of satellite data of high spatial <strong>and</strong> temporal<br />
resolution <strong>in</strong> the cont<strong>in</strong>ental-scale monitor<strong>in</strong>g of the phenology of temperate deciduous forests, especially<br />
where no phenological observations are recorded.<br />
The algorithm is applied to the analysis of budburst dates of temperate deciduous forests over a south-west /<br />
north-east climatic gradient from Spa<strong>in</strong> to Pol<strong>and</strong>. A general trend does not appear over this area for the ten<br />
years period studied. Interannual variations are largely dependent upon temperature. The satellite-derived<br />
budburst date is used to check the ability of the vegetation model LPJ (Lund-Potsdam-Jena) to simulate a<br />
reasonable phenological behavior over temperate deciduous forests. The <strong>in</strong>terest of improv<strong>in</strong>g the modeled<br />
phenology <strong>in</strong> carbon balance models <strong>and</strong> the way how to do it is discussed.<br />
41
EFFECTS OF URBANIZATION ON GROWING SEASON DYNAMICS AND<br />
GROSS PRIMARY PRODUCTION IN MAJOR METROPOLITAN AREAS IN THE<br />
UNITED STATES.<br />
M.A. White, R.R. Nemani<br />
Numerical Terradynamic Simulation Group, University of Montana<br />
mike@ntsg.umt.edu/Fax: 702-924-9263<br />
Throughout the twentieth century, global populations have <strong>in</strong>creas<strong>in</strong>gly migrated to <strong>and</strong> concentrated <strong>in</strong><br />
urban areas. While many of the economic, social, <strong>and</strong> meteorological consequences of urbanization are well<br />
studied, the effects of urbanization on grow<strong>in</strong>g season dynamics <strong>and</strong> the carbon cycle are less understood.<br />
Here, us<strong>in</strong>g a ten-year satellite record from the Advanced Very High Resolution Radiometer (AVHRR), we<br />
explore the consequences of urbanization <strong>in</strong> major metropolitan areas of the United States. We selected the<br />
ten largest metropolitan areas <strong>and</strong> calculated average dates of onset <strong>and</strong> offset of greenness <strong>and</strong> gross<br />
primary production (GPP) for urban <strong>and</strong> rural areas (pixels with<strong>in</strong> a 50km radius <strong>and</strong> with no more than a<br />
100-meter elevation difference from the city). We found that <strong>in</strong> mesic climates, such as <strong>in</strong> Pittsburgh <strong>and</strong><br />
Atlanta, urban <strong>and</strong> rural areas showed little difference <strong>in</strong> the dates of onset <strong>and</strong> offset but that peak greenness<br />
<strong>and</strong> annual GPP were lower <strong>in</strong> urban than <strong>in</strong> rural areas by up to 20%. In more arid climates, metropolitan<br />
areas commonly had a longer grow<strong>in</strong>g season, higher peak greenness, <strong>and</strong> larger annual GPP, presumably<br />
due to irrigation <strong>and</strong> the plant<strong>in</strong>g of exotic species. Increases <strong>in</strong> arid climates were of a smaller magnitude<br />
(approach<strong>in</strong>g 10%) than were decreases <strong>in</strong> mesic climates. Our results suggest that the process of<br />
urbanization does not produce consistent impacts on grow<strong>in</strong>g season dynamics <strong>and</strong> GPP. Rather, the<br />
<strong>in</strong>teraction of climate <strong>and</strong> sociological <strong>in</strong>fluences regulat<strong>in</strong>g irrigation <strong>and</strong> plant<strong>in</strong>g preferences are strong<br />
controls.<br />
42
SESSION 4 MODELLING PHENOLOGY<br />
TESTING TEMPERATURE DATA FOR PHENOLOGICAL MODELS<br />
R. Snyder (1), D. Spano (2), C. Cesaraccio (3), P. Duce (3)<br />
(1) Atmospheric Science, University of California, Davis<br />
(2) Dip. di Produzione Vegetale, Universita’ della Basilicata, , Potenza, Italy<br />
(3) Consiglio Nazionale delle Ricerche, IMAes, Sassari, Italy<br />
rlsnyder@ucdavis.edu/Fax: +001-530-752-1552.<br />
It is well known that air temperature affects the phenological development of plants. However, errors <strong>in</strong> the<br />
collection of temperature data can lead to <strong>in</strong>accurate phenological predictions. This is especially true <strong>in</strong> a<br />
Mediterranean climate (e.g., California <strong>and</strong> Italy) where advection <strong>and</strong> surface wett<strong>in</strong>g (i.e., by ra<strong>in</strong>fall or<br />
irrigation) can affect the temperature measurements. In fact, model errors result<strong>in</strong>g from the use of bad<br />
temperature data can be as large as the differences result<strong>in</strong>g from climate change. Temperature differences<br />
near 2.0 o C have been observed between weather stations located over bare soil <strong>and</strong> over irrigated grass <strong>in</strong> the<br />
desert of California. Consequently, temperature data sets should be scrut<strong>in</strong>ized to <strong>in</strong>sure that the data are<br />
representative of the region <strong>and</strong> the application before us<strong>in</strong>g them to model phenology. Similarly, when the<br />
environment around the plants is not considered, mislead<strong>in</strong>g phenological observations can result. The<br />
environment surround<strong>in</strong>g the weather station <strong>and</strong> the plants be<strong>in</strong>g studied will affect the relationship<br />
between the model <strong>and</strong> observed phenological development, <strong>and</strong> therefore only results from good locations<br />
should be used. The choice of a "good" location depends on the purpose of the study. If the purpose is to<br />
model phenology of irrigated crops, then the temperature data should be collected from a station that is<br />
m<strong>in</strong>imally affected by irrigation or ra<strong>in</strong>fall. Plac<strong>in</strong>g a weather station with<strong>in</strong> the study crop will give good<br />
<strong>in</strong>formation for that particular crop <strong>in</strong> that year, but the results will not be useful for the same crop <strong>in</strong> other<br />
locations with<strong>in</strong> the region or <strong>in</strong> other years because of irrigation tim<strong>in</strong>g <strong>and</strong> amount differences. Collect<strong>in</strong>g<br />
the temperature data over an irrigated grass surface provides a reference value for the region that is little<br />
affected by ra<strong>in</strong>fall. This is true because the energy balance over well-watered grass is little affected by<br />
ra<strong>in</strong>fall frequency. If the purpose is to model the phenology of natural vegetation, then the temperature data<br />
should be collected <strong>in</strong> an environment similar to the plants be<strong>in</strong>g studied. For natural vegetation, because<br />
the temperature affect<strong>in</strong>g the plants is affected by ra<strong>in</strong>fall, the temperature data should be <strong>in</strong> an environment<br />
where ra<strong>in</strong>fall <strong>in</strong>fluences temperature. In this paper, weather station sit<strong>in</strong>g <strong>and</strong> the effects of evaporation on<br />
temperatures used <strong>in</strong> phenological models <strong>in</strong> a Mediterranean climate will be discussed. Examples of edge<br />
effects <strong>and</strong> weather station sit<strong>in</strong>g on temperature measurements will be presented. For example, us<strong>in</strong>g<br />
temperature measured 180 m from the edge <strong>and</strong> on the edge of an irrigated grass field <strong>in</strong> the desert resulted<br />
<strong>in</strong> about three days difference over 40 days <strong>in</strong> predict<strong>in</strong>g 900 degree days. In the Central Valley of<br />
California, measur<strong>in</strong>g temperature over irrigated grass gives the same mean annual temperature as over bare<br />
ground <strong>in</strong> some years but as much as 1.0 o C lower <strong>in</strong> other years. When measur<strong>in</strong>g over bare soil, stage-1<br />
evaporation is affected by evaporative dem<strong>and</strong> <strong>and</strong> stage-2 soil evaporation rates are affected by soil type as<br />
well as by the evaporative dem<strong>and</strong>. Because difference <strong>in</strong> evaporation rate affect sensible heat flux density,<br />
it is likely that soil differences will affect temperatures measured over bare soil. There are also soil effects<br />
on the temperature around natural vegetation <strong>and</strong> hence phenology. Temperature measurements over bare<br />
soil may provide good data for phenological models of natural vegetation grow<strong>in</strong>g similar soils but not<br />
grow<strong>in</strong>g on soils with different surface evaporation properties. This is another reason for us<strong>in</strong>g temperature<br />
data collected only over irrigated grass for long term assessment of climate change.<br />
43
AN IMPROVED MODEL FOR DEGREE DAYS FROM DAILY TEMPERATURE<br />
DATA<br />
C. Cesaraccio (1), D. Spano (2), P. Duce (1), R. L. Snyder (3), <strong>and</strong> P. Deidda (4)<br />
(1) Istituto per il Monitoraggio degli Agroecosistemi, CNR-IMAes, Sassari, Italy<br />
(2) Dipartimento di Produzione Vegetale, Università della Basilicata, Potenza, Italy<br />
(3) University of California, Department of L<strong>and</strong>, Air, <strong>and</strong> Water Resources Davis, CA, USA<br />
(4) Dipartimento di Economia e Sistemi Arborei, Sassari, Italy<br />
spano@unibas.it<br />
S<strong>in</strong>ce biological response to temperature is nonl<strong>in</strong>ear <strong>and</strong> temperature has a clear daily cycle, it is<br />
fundamental to <strong>in</strong>clude this systematic temperature variation <strong>in</strong> the <strong>in</strong>put to agricultural models, such as<br />
those describ<strong>in</strong>g crop phenology <strong>and</strong> development based on the accumulation of grow<strong>in</strong>g degree days (°D).<br />
Degree days (oD) are determ<strong>in</strong>ed by first calculat<strong>in</strong>g degree hours (oH) for each hour of the day. The<br />
number of °H for any given hour is calculated as the mean hourly temperature or the upper threshold,<br />
whichever is smaller, m<strong>in</strong>us the lower threshold. To calculate oD, the oH are summed over the 24-hour day<br />
<strong>and</strong> the sum is divided by 24 hours per day.<br />
Although us<strong>in</strong>g hourly weather data offers the greatest accuracy for estimat<strong>in</strong>g °D, daily maximum (Tx) <strong>and</strong><br />
m<strong>in</strong>imum (Tn) temperature data are often used to estimate °D by approximat<strong>in</strong>g the diurnal temperature<br />
trends. This paper presents a new empirical model (TM) for estimat<strong>in</strong>g hourly mean temperature us<strong>in</strong>g the<br />
date, latitude, Tx <strong>and</strong> Tn recorded on the date, <strong>and</strong> the m<strong>in</strong>imum temperature on the next day (Tp). The TM<br />
model describes the diurnal variation us<strong>in</strong>g a s<strong>in</strong>e function from Tn at sunrise until reach<strong>in</strong>g Tx, another s<strong>in</strong>e<br />
function from Tx until sunset, <strong>and</strong> square root function from then until sunrise the next morn<strong>in</strong>g. The model<br />
was developed <strong>and</strong> calibrated us<strong>in</strong>g several years of hourly data from five automated weather stations<br />
located <strong>in</strong> California <strong>and</strong> represent<strong>in</strong>g a wide range of climate conditions. The model was tested versus an<br />
additional data-set at each location. The temperature model gave good results with the root mean square<br />
error less than 2.0°C for most years <strong>and</strong> locations.<br />
The TM model was used to estimated hourly temperature <strong>and</strong> calculated degree-day values. A comparison<br />
between °D calculations from TM, s<strong>in</strong>gle-s<strong>in</strong>e <strong>and</strong> s<strong>in</strong>gle-triangle methods is presented. The oD estimates<br />
calculated with hourly temperature were considerably better than the s<strong>in</strong>gle-s<strong>in</strong>e <strong>and</strong> s<strong>in</strong>gle triangle methods<br />
dur<strong>in</strong>g periods when the threshold temperature was above the daily m<strong>in</strong>imum temperature. The results were<br />
similar for all oD calculation methods when the m<strong>in</strong>imum was above the threshold temperature. In all cases,<br />
the °D calculation showed a limited accuracy on overcast days.<br />
44
IMPORTANCE OF PHENOLOGY AND PHENOLOGICAL MODELS ON AN<br />
INTEGRATED EVALUATION OF FOREST ECOSYSTEM MONITORING DATA<br />
S. Raspe<br />
Bavarian Sate Institute of Forestry, Department of Forest Site <strong>and</strong> Environment, Freis<strong>in</strong>g, Germany<br />
Ras@lwf.uni-muenchen.de / Fax: ++8161-714971<br />
For an <strong>in</strong>tensive <strong>and</strong> cont<strong>in</strong>uous observation <strong>and</strong> documentation of complex physical/chemical <strong>and</strong><br />
biological processes <strong>in</strong> forest ecosystems a network of 22 Forest Ecosystem Monitor<strong>in</strong>g Stations were<br />
established all over Bavaria. The program encompasses measurement of meteorological parameters <strong>and</strong> soil<br />
temperature at an open field stations as well as surveys of throughfall, soil moisture, soil solution chemistry,<br />
deposition of pollutants <strong>and</strong> nutrients, chemical <strong>and</strong> physical soil parameters, nutritional status <strong>and</strong> health<br />
condition of trees, litterfall, ground vegetation, growth <strong>and</strong> phenological observation of tree species at forest<br />
st<strong>and</strong> plots. Moreover, phenological observations of trees <strong>and</strong> shrub clones accord<strong>in</strong>g to the criteria of<br />
“International Phenological Gardens” are done <strong>in</strong> a small phenological garden near to the meteorological<br />
measurements.<br />
This comprehensive data basis offers the possibility for an <strong>in</strong>tegrated evaluation of the condition <strong>and</strong><br />
dynamic of forest st<strong>and</strong>, soil <strong>and</strong> water respectively. As many impact factors show seasonal variations, <strong>and</strong><br />
as the sensitivity of biological processes to different stress factors depend on the physiological status of the<br />
systems, the def<strong>in</strong>ition of physiological seasons seams to be necessary. It is convenient that such a<br />
distribution is not constant <strong>in</strong> different years <strong>and</strong> at different sites, because the physiological status of<br />
different forest ecosystems are not constant <strong>in</strong> space <strong>and</strong> time.<br />
Visible symptoms of those physiological processes are the phenological phases as be<strong>in</strong>g observed <strong>in</strong> the<br />
Forest Ecosystem Monitor<strong>in</strong>g Station program. On the other h<strong>and</strong> several models exists to calculate grow<strong>in</strong>g<br />
season or the appearance of phenological phases from meteorological <strong>and</strong> some times hydrological data. An<br />
application of such models at the Forest Ecosystem Monitor<strong>in</strong>g Stations allows their validation with data<br />
from the same forest areas. Moreover, evaluation of phenological observations <strong>and</strong> model<strong>in</strong>g of grow<strong>in</strong>g<br />
season could be used for a physiological distribution of sensitive time periods to different impact factors on<br />
the ecological status of forest sites.<br />
The paper compares phenological observation data <strong>and</strong> model<strong>in</strong>g results from the Bavarian Forest<br />
Ecosystem Monitor<strong>in</strong>g Station program. The impact of the grow<strong>in</strong>g season on the response of ecosystem to<br />
stress factors will be shown by some examples with<strong>in</strong> the scope of water <strong>and</strong> nutrient availability <strong>and</strong> forest<br />
growth or forest health. The results will be discussed with respect to the importance of phenology <strong>and</strong><br />
phenological models on an <strong>in</strong>tegrated evaluation of forest ecosystem monitor<strong>in</strong>g data.<br />
45
A BARLEY ONTHOGENIC MODEL AS A TIME-BASE FOR MONITORING<br />
ADVERSE AGROMETEOROLOGICAL FACTORS<br />
J. Valter<br />
CHMI, Prag, Czech Republic<br />
Valter@chmi.cz<br />
The paper presents the model of the development of the spr<strong>in</strong>g barley <strong>in</strong> terms of its phenological stages.<br />
The model, the name of which is ONTHO_SB, has been built as practical tools of the agrometeorological<br />
service of CHMI <strong>in</strong> Prag. The attention is focussed to logical plan of the development simulation <strong>and</strong><br />
phenological tim<strong>in</strong>g, whereas problems of the code, meteorological <strong>in</strong>put data, experience with the<br />
ma<strong>in</strong>tenance of the model <strong>and</strong> other agrometeorological aspects are only briefly mentioned. The pr<strong>in</strong>ciple of<br />
development-simulation st<strong>and</strong>s generally on a slight1y adapted logistic function, applied <strong>in</strong>dividually on<br />
each phenological stage of the crop, where temperature is the <strong>in</strong>dependent variable. The <strong>in</strong>fluence of soil<br />
moisture on development of plants is <strong>in</strong>volved, too. The model is designed to give three different types of<br />
operational <strong>in</strong>formation : rate of seasonal development; leaf area estimates; soil moisture estimates;<br />
occurrence of adverse agrometeorological events such as drought, lodg<strong>in</strong>g (plants lie down), irregular<br />
emergence, waterlogg<strong>in</strong>g, floods etc. Us<strong>in</strong>g a predicted meteorological or climatological data to prolong real<br />
rows of data, the system is able to give forecasts of plant development, too. An important attachment of this<br />
paper ssems to be The Comparative Table of Phenological Scales that conta<strong>in</strong>s def<strong>in</strong>itions of phases <strong>and</strong><br />
correspond<strong>in</strong>g codes of three st<strong>and</strong>ard macro-phenological scales for cereals ( FEEKES - ZADOKS - CHMI<br />
model). A relatively easy adjustment for oats <strong>and</strong> spr<strong>in</strong>g wheat is posssible. An analogue for w<strong>in</strong>ter wheat is<br />
now under preparation.<br />
46
FORECASTING AIRBORNE POLLEN CONCENTRATIONS: DEVELOPMENT<br />
OF LOCAL MODELS<br />
A.Ranzi (1), P. Lauriola (1), F. Z<strong>in</strong>oni (2), L.Botarelli (2)<br />
(1) ARPA Emilia Romagna - Direzione Tecnica<br />
(2) ARPA Emilia Romagna-Servizio Meteorologico<br />
e-mail:f.z<strong>in</strong>oni@smr.arpa.emr.it<br />
People's sensitivity to allergies may represent one of the most important sanitary factors of the next century.<br />
Attention must be paid to this issue <strong>in</strong> order to reduce its <strong>in</strong>cidence on social costs <strong>and</strong> improve the quality<br />
of life.<br />
A regional monitor<strong>in</strong>g network has been established s<strong>in</strong>ce the beg<strong>in</strong>n<strong>in</strong>g of the 1980's. At the present ARPA<br />
Emilia-Romagna (Regional Agency for Prevention <strong>and</strong> Environment) leads this network with the support of<br />
the Italian Society of Aerobiology. The activities of the monitor<strong>in</strong>g service <strong>in</strong>clude: monitor<strong>in</strong>g of airspreaded<br />
pollens, data management, forecasts, development of dedicated software <strong>and</strong> publication of a<br />
weekly bullet<strong>in</strong> with results on monitor<strong>in</strong>g <strong>and</strong> forecast. Pollen spread<strong>in</strong>g forecast is developed us<strong>in</strong>g past<br />
<strong>and</strong> present years data related with agrometeorological models.<br />
Reliable predictive models of pollen concentrations are useful for allergists <strong>and</strong> physicians <strong>in</strong>volved <strong>in</strong><br />
cl<strong>in</strong>ical trials. Our ma<strong>in</strong> goals are to improve seasonal forecasts <strong>and</strong> to analyse anomalous years.<br />
Two statistical approaches have been used to develop models on gram<strong>in</strong>eae pollen spread<strong>in</strong>g, <strong>in</strong>clud<strong>in</strong>g<br />
regression methods <strong>and</strong> neural networks. Input variables are the ma<strong>in</strong> meteorological data, i.e. daily<br />
temperature (max., m<strong>in</strong>. <strong>and</strong> average) <strong>and</strong> ra<strong>in</strong>fall, <strong>in</strong> addition with some agrometeorological variables (i.e.<br />
hydrological balance). The output of the first model is the day on which a pollen threshold (50 pollen/mc) is<br />
reached. The output of the second model is the daily pollen concentration. Both models were able to identify<br />
<strong>and</strong> predict anomalous years.<br />
47
MODELLING THE PROBABILITY OF GYPSY MOTH ESTABLISHMENT IN<br />
NEW AREAS OF NORTH AMERICA ON THE BASIS OF PHENOLOGY<br />
J. Régnière (1), V.G. Nealis (2)<br />
(1) Canadian Forest Service, Quebec City, Quebec, Canada<br />
(2) Canadian Forest Service, Victoria, British Columbia, Canada<br />
jregniere@cfl.forestry.ca<br />
Gypsy moth is constantly be<strong>in</strong>g <strong>in</strong>troduced <strong>in</strong>to western North America. The extent of its possible range <strong>in</strong><br />
that part of the cont<strong>in</strong>ent is not well known. A temperature-driven, multiple-generation simulation model of<br />
Gypsy moth seasonality was used to determ<strong>in</strong>e the probability of establishment of persistent populations,<br />
based strictly on the <strong>in</strong>sect's ability to reach a feasible, stable seasonality. Southern British Columbia is used<br />
as the area for this study. Maps of establishment probabilities can be generated by tak<strong>in</strong>g <strong>in</strong>to account<br />
regional climate, vertical thermal gradients <strong>and</strong> topography. Such maps can be used for pest-management<br />
(e.g. eradication) decision support but also to address such ecological questions as the potential effect of<br />
climate change on the <strong>in</strong>sect's range. The approach can be easily applied to most poikilotherms for which a<br />
suitable developmental model is available. A public-doma<strong>in</strong> computer program called BioSIM was been<br />
used to conduct this analysis (see Régnière, J. 1996. A generalized approach to l<strong>and</strong>scape-wide seasonal<br />
forecast<strong>in</strong>g with temperature-driven simulation models. Environmental Entomology 25: 869-881). This<br />
program is available upon request from JR.<br />
48
ON MODELLING OF PHENOLOGICAL AU<strong>TUM</strong>N PHASES<br />
N. Estrella<br />
Technical University of Munich, Department of Ecology, Freis<strong>in</strong>g, Germany<br />
Estrella@met.forst.tu-muenchen.de // Fax. (+49) 8161 714753<br />
Phenological models try<strong>in</strong>g to forecast the beg<strong>in</strong>n<strong>in</strong>g of spr<strong>in</strong>g phases are common, but, up to now there are<br />
no models that enable the prediction of autumn phases of deciduous trees. Ma<strong>in</strong>ly because for the modell<strong>in</strong>g<br />
of the length of the vegetation period there is a need to determ<strong>in</strong>e the beg<strong>in</strong>n<strong>in</strong>g of the leaf colour<strong>in</strong>g.<br />
By the time be<strong>in</strong>g, there are attempts to predict the end of the vegetation period, for example the<br />
photosynthesis rate is used <strong>in</strong> some Biosphere models. These models assume a sole dependence on<br />
temperature <strong>and</strong> are not specific<br />
There are numerous problems modell<strong>in</strong>g autumn phases of deciduous trees:<br />
autumn phases are harder to observe correctly, the data might have many mistakes<br />
the scatter<strong>in</strong>g range is very broad<br />
there is hardly to f<strong>in</strong>d any useful literature on the release of leaf colour<strong>in</strong>g <strong>in</strong> nature<br />
there are several hypotheses, most of them us<strong>in</strong>g as primary parameter the temperature<br />
The hypotheses found <strong>in</strong> the literature for the end of the vegetation period are normally used to determ<strong>in</strong>e<br />
the end of the grow<strong>in</strong>g season not only for one species, but for all the different plants of a region. It is<br />
difficult to use these hypotheses as parameters for modell<strong>in</strong>g. Then, to f<strong>in</strong>d the relevant factors for the<br />
beg<strong>in</strong>n<strong>in</strong>g of leaf colour<strong>in</strong>g all the eligible parameters have to be proofed for local correctness<br />
Analyses of phenological data supplied by the German weather service for the autumn phases of deciduous<br />
trees cover<strong>in</strong>g time series with at least 30 years between 1951-1996 of observation show positive trends. The<br />
leaf colour<strong>in</strong>g postpone to a later date. Calculations of the data show shifts ly<strong>in</strong>g <strong>in</strong> the range of 0,03<br />
Days/year for beech <strong>and</strong> 0,04 Days/year for birch.<br />
49
ANALYSIS OF PHENOLOGICAL MODELS USING STATISTICAL<br />
RESAMPLING METHODS<br />
R. Häkk<strong>in</strong>en<br />
F<strong>in</strong>nish Forest Research Institute, Hels<strong>in</strong>ki, F<strong>in</strong>l<strong>and</strong><br />
risto.hakk<strong>in</strong>en@metla.fi / Fax: +358 9 625308<br />
Many phenological models describ<strong>in</strong>g the annual cycle of trees <strong>in</strong>clude components for the rate of<br />
development. For example, accord<strong>in</strong>g to one model the Spr<strong>in</strong>g bud burst takes place when the observed<br />
value of ord<strong>in</strong>ary temperature sum exceeds a critical threshold value. No st<strong>and</strong>ard statistical methods are<br />
available for the analysis of the models because the sampl<strong>in</strong>g distributions of the parameters, <strong>and</strong> those of<br />
the mean square errors of such dynamic models, are not known. Thus the evaluation of such models has<br />
been ma<strong>in</strong>ly based on the numeric comparison of residual errors of the models only. However, modern<br />
computers are so efficient that it is possible to use statistical <strong>in</strong>ference based on resampl<strong>in</strong>g methods.<br />
The underly<strong>in</strong>g idea <strong>in</strong> obta<strong>in</strong><strong>in</strong>g the unknown sampl<strong>in</strong>g distributions with resampl<strong>in</strong>g is to treat the orig<strong>in</strong>al<br />
data set as a population <strong>and</strong> to draw samples from it repeatedly. The statistical null-hypothesis, that the mean<br />
square errors (MSE) of two models are equal, for example, can be tested utilis<strong>in</strong>g the bootstrap-method. The<br />
bootstrap-sample is formed by draw<strong>in</strong>g items from the orig<strong>in</strong>al sample (the ‘population’) at r<strong>and</strong>om, one at a<br />
time with replacement, until the orig<strong>in</strong>al sample size is reached. This procedure of draw<strong>in</strong>g bootstrapsamples<br />
is repeated many times. For every sample the two models are fitted <strong>and</strong> the difference of their MSEs<br />
is calculated. The differences represent the bootstrap sampl<strong>in</strong>g distribution on which the <strong>in</strong>ference is based.<br />
The properties of the model parameters can also be studied us<strong>in</strong>g the bootstrap method <strong>and</strong> prediction errors<br />
can be estimated us<strong>in</strong>g cross-validation.<br />
-2<br />
0<br />
2<br />
50<br />
4<br />
6<br />
8<br />
10<br />
12<br />
14<br />
16<br />
18<br />
MSE2 - MSE1<br />
mean=11.2<br />
std.dev. = 3.7<br />
n = 7000<br />
20<br />
22<br />
24<br />
26<br />
28<br />
In one example of this application the models predict<strong>in</strong>g the bud burst tim<strong>in</strong>g of birch leaves were compared.<br />
The data comprised a 55-year-long bud burst time series <strong>and</strong> daily temperature records. The bootstrap<br />
sampl<strong>in</strong>g distribution, i.e. the distribution of differences of mean square errors of two models calculated<br />
from 7.000 bootstrap-samples were used to test the statistical significance of the equality of MSEs (see<br />
Figure). In the first model the ontogenetic bud development began on a fixed calendar date <strong>in</strong> the Spr<strong>in</strong>g,<br />
<strong>and</strong> <strong>in</strong> the second model the beg<strong>in</strong>n<strong>in</strong>g of bud development was dependent on the state of dormancy. In the<br />
Figure the vertical l<strong>in</strong>es at 2.5 % <strong>and</strong> 97.5 % percentile give the 95 % bootstrap confidence <strong>in</strong>terval of MSE<br />
difference. The zero does not belong to the confidence <strong>in</strong>terval <strong>and</strong> this implies that the difference of the<br />
mean square errors is statistically significant.
SESSION 5A APPLICATIONS OF PHENOLOGY IN AGRICULTURE AND<br />
FORESTRY<br />
REALISM IN PHENOLOGICAL MODELS FOR THE ANNUAL CYCLE OF<br />
TREES: IMPORTANT FOR CLIMATE CHANGE IMPACT ASSESSMENT!<br />
K. Kramer, I. Le<strong>in</strong>onen, H. Hänn<strong>in</strong>en<br />
K.Kramer@Alterra.wag-ur.nl<br />
� If phenological models are to be used to assess the impacts of global warm<strong>in</strong>g then the modeller should<br />
focus on the realism <strong>and</strong> generality of the model. The lowest error only is not a good criterium for<br />
model selection. The pr<strong>in</strong>ciples of generality, realism <strong>and</strong> precision for the def<strong>in</strong>ition of modell<strong>in</strong>g<br />
concepts will be outl<strong>in</strong>ed.<br />
� Much confusion <strong>in</strong> phenology modell<strong>in</strong>g is still due to a wide array of sub-models, <strong>and</strong> differ<strong>in</strong>g<br />
def<strong>in</strong>itions make it difficult to communicate. A common notation of phenological concepts is now<br />
emerg<strong>in</strong>g <strong>in</strong> the phenological literature. This will be used to give an outl<strong>in</strong>e for the pr<strong>in</strong>ciples for the<br />
modell<strong>in</strong>g of the annual cycle of trees.<br />
� Good methodologies of data process<strong>in</strong>g <strong>and</strong> parameter estimation are available <strong>and</strong> should be used to<br />
avoid unneccesary bias between authors. These appoaches will be brought to attention <strong>and</strong> shortly<br />
discussed.<br />
� Future research should focus on both modell<strong>in</strong>g <strong>and</strong> experiments. A realistic model cannot be selected<br />
only because it works well on <strong>in</strong>dependent observed data. Orig<strong>in</strong>al controlled experiments l<strong>in</strong>k<strong>in</strong>g<br />
theory to practice are urgently needed.<br />
51
APPLICATION OF PHENOLOGY IN AGRICULTURAL PRODUCTION<br />
PLANNING IN SLOVENIA<br />
A.Sušnik<br />
Hydrometeorological Institute of Slovenia, Ljubljana, Slovenia<br />
<strong>and</strong>reja.susnik@rzs-hm.si<br />
The majority of the models for the management <strong>and</strong> agricultural operations plann<strong>in</strong>g <strong>in</strong>clude a phenology<br />
component which qualitatively <strong>in</strong>dicates the development stages of crops. The set of phenological data are as<br />
important as all the other <strong>in</strong>put parameters for comput<strong>in</strong>g water balance <strong>and</strong> irrigation schedul<strong>in</strong>g, prepar<strong>in</strong>g<br />
warn<strong>in</strong>gs for various diseases <strong>and</strong> pests <strong>and</strong> optimal use of pesticides, for risk assessments (droughts), l<strong>and</strong><br />
use evaluations <strong>and</strong> others. In the first part of the paper the phenological data for v<strong>in</strong>e <strong>and</strong> some vegetables<br />
were used as <strong>in</strong>put data for operat<strong>in</strong>g agrometeorological models for irrigation <strong>and</strong> pest protection <strong>in</strong> the<br />
vegetation periods 1999 <strong>and</strong> 2000 <strong>in</strong> two agricultural regions <strong>in</strong> Slovenia. The second part of the paper<br />
describes the assessment of agricultural drought <strong>in</strong> the spr<strong>in</strong>g 2000 us<strong>in</strong>g phenological data for w<strong>in</strong>ter wheat<br />
<strong>and</strong> water balance for 36 stations <strong>in</strong> Slovenia. The analyses are based on phenological data collected <strong>in</strong> the<br />
phenological network of Hydrometeorological Institute. For the survey two types of agrometeorological<br />
models were used: model for water balance (IRRFIB-2) <strong>and</strong> models for plant protection (AGROEXPERT<br />
<strong>and</strong> PLASMO). Beside phenological data daily climatological data for 46 climatological stations were used.<br />
The paper describes the practical use of <strong>in</strong>formation on crop development by verification <strong>and</strong> calculations of<br />
agrometeorological models <strong>and</strong> drought risk assessments. The correctness <strong>and</strong> timel<strong>in</strong>ess of phenological<br />
data is of great importance <strong>in</strong> this k<strong>in</strong>d of production plann<strong>in</strong>g.<br />
52
USE OF BIOCLIMATIC INDEXES TO CHARACTERIZE PHENOLOGICAL<br />
PHASES OF APPLE VARIETIES IN NORTHERN ITALY<br />
N. Valent<strong>in</strong>i (1), G. Me (1), R. Ferrero (1), F. Spanna (2)<br />
(1) Dipartimento di Colture Arboree, Università di Tor<strong>in</strong>o<br />
(2) Regione Piemonte - Settore Fitosanitario regionale<br />
(1) me@agraria.unito.it (2) ufficio.agrometeo@regione.piemonte.it<br />
The research was addressed to characterize the phenological behaviour of different apple varieties <strong>and</strong> to<br />
compare different bioclimatic <strong>in</strong>dexes <strong>in</strong> order to evaluate their adaptability <strong>in</strong> describ<strong>in</strong>g the phenological<br />
phases of fruit species.<br />
A field study on chill<strong>in</strong>g units requirement (W<strong>in</strong>ter Chill<strong>in</strong>g Requirement) <strong>and</strong> grow<strong>in</strong>g degree hours<br />
accumulation (G.D. H.°C) of 15 native apple cultivars adapted to climatic conditions was carried out <strong>in</strong> a<br />
fruit area <strong>in</strong> northern-western Italy (Cuneo Prov<strong>in</strong>ce, Piedmont).<br />
From 1991 to 1993, climatic data were measured us<strong>in</strong>g meteorological stations <strong>in</strong>stalled <strong>in</strong> an experimental<br />
orchard (Verzuolo, Cuneo).<br />
The temperature data were measured as hourly temperature from the end of the summer till fulll bloom.<br />
Phenological data were determ<strong>in</strong>ed <strong>in</strong> the orchard by weekly observations follow<strong>in</strong>g Fleck<strong>in</strong>ger stages<br />
(INRA).<br />
Four methods were compared to determ<strong>in</strong>e chill<strong>in</strong>g units requirement (WCR): Hutch<strong>in</strong>s, We<strong>in</strong>berger-Eggert,<br />
Utah e North Carol<strong>in</strong>a. The grow<strong>in</strong>g degrees hour requirement (GDH) was estimated us<strong>in</strong>g only one method<br />
with 2 different base temperatures: 4.4 <strong>and</strong> 6.1 °C.<br />
The Utah method was applied to determ<strong>in</strong>e the time when accumulated chill units become effective <strong>in</strong> rest<br />
requirements.Positive chill-units began to be accumulated just after the day <strong>in</strong> the fall when the first negative<br />
accumulation is experienced.<br />
The comparison among the different methods po<strong>in</strong>ted out that Weimberger-Eggert is the best method: <strong>in</strong> fact<br />
it shows the lowest statistical variability dur<strong>in</strong>g the 3 years of observations.<br />
More difficulties were found to determ<strong>in</strong>e the date of rest completion data <strong>and</strong> the beg<strong>in</strong> of GDH<br />
accumulation. The best base temperature to estimate GDH is 4.4°C .<br />
Phenological <strong>and</strong> climatic characterizations are two basic tools that can give to farmers <strong>and</strong> agricultural<br />
advisors, important <strong>in</strong>dications about the varieties choice <strong>and</strong> the applications of the best <strong>and</strong> the most<br />
correct cultivation practices.<br />
53
PHENOLOGICAL PREDICTIONS IN PLANTS<br />
F.E. Wielgolaski<br />
Department of Biology, University of Oslo, Norway<br />
f.e.wielgolaski@bio.uio.no /Fax: +47-22854664<br />
In the present study correlations were carried out between tim<strong>in</strong>g of earlier <strong>and</strong> later phenophases <strong>in</strong> m plant<br />
species studied at several sites through three years, ma<strong>in</strong>ly along a coastal-<strong>in</strong>l<strong>and</strong> gradient <strong>in</strong> western<br />
Norway. At all sites climatological observations were carried out, <strong>and</strong> detailed soil analyses were available<br />
from all sites. If there were short periods (less than 3-4 weeks) between the phenophases compared, even<br />
quite strong, significant correlations were found to be of limited <strong>in</strong>terest, because it might just <strong>in</strong>dicate some<br />
sort of a persist<strong>in</strong>g climatic trend. The earl<strong>in</strong>ess of spr<strong>in</strong>g phenophases <strong>in</strong> one species, however, generally<br />
strongly <strong>in</strong>fluenced the tim<strong>in</strong>g of later stages <strong>in</strong> the same species, even when it was a relatively long period<br />
between the phases (up to four months). In woody plants dates of the early flower<strong>in</strong>g Salix caprea seemed to<br />
be more important for later phenophases of many other woody plant species than the normally even earlier<br />
flower<strong>in</strong>g of Corylus avellana. The tim<strong>in</strong>g of many of the summer <strong>and</strong> autumn phenophases observed, were<br />
also highly significantly correlated with tim<strong>in</strong>g of other, somewhat later spr<strong>in</strong>g phases, some with the time of<br />
flower<strong>in</strong>g <strong>in</strong> Prunus padus, others with for <strong>in</strong>stance budbreak <strong>in</strong> Betula or apples. Possible reasons for this<br />
are discussed us<strong>in</strong>g the available data on environmental factors. Similar dependencies were found between<br />
early <strong>and</strong> late develop<strong>in</strong>g species of herbaceous plants. Regression coefficients <strong>in</strong>dicated that one day earlier<br />
or later <strong>in</strong> the spr<strong>in</strong>g phases, ma<strong>in</strong>ly changed the later summer phases between about 0.5 <strong>and</strong> nearly 1.5 days,<br />
both <strong>in</strong> woody <strong>and</strong> herbaceous plants. The tim<strong>in</strong>g of some autumn phenophases also seemed to be of<br />
importance for the time of various spr<strong>in</strong>g phases next year <strong>in</strong> perennial plants. In the present study this is<br />
shown e.g. by the highly significant correlations often found between the flower<strong>in</strong>g time of Aster novi-belgii<br />
<strong>in</strong> the autumn (on an average at the end of September) <strong>and</strong> many phenophases the next spr<strong>in</strong>g, particularly<br />
the flower<strong>in</strong>g time of apple <strong>and</strong> Syr<strong>in</strong>ga vulgaris. Autumn phases tak<strong>in</strong>g place one month earlier showed<br />
less importance for the phenology next year. It is suggested that one reason for this, may have been that<br />
differentiation of many of the new organs was not really started at the time of the early autumn phenophases.<br />
54
GROWTH AND PHENOLOGY OF A SEMINATURAL GRASSLAND<br />
SUBMITTED TO ELEVATED ATMOSPHERIC CARBON DIOXIDE<br />
CONCENTRATION<br />
A.Raschi (1), F.Selvi (2), S. Marchi (3), S. Sforzi (3)<br />
(1) C.N.R. - I.A.T.A., Firenze, Italy, (2) Dip. Biologia Vegetale, Università di Firenze, Italy,<br />
(3) Ce.S.I.A. - Accademia dei Georgofili, Firenze, Italy.<br />
raschi@sunserver.iata.fi.cnr.it/Fax +39055308910<br />
The reported work is part of an ongo<strong>in</strong>g research project aim<strong>in</strong>g to assess the long term impacts of elevated<br />
atmospheric carbon dioxide concentrations, on a semi-natural grassl<strong>and</strong> community, analys<strong>in</strong>g its effects on<br />
the structure, the ecophysiology <strong>and</strong> the botanical composition of the grassl<strong>and</strong>.<br />
A grassl<strong>and</strong> representative of long term ab<strong>and</strong>oned hill cropl<strong>and</strong>, or regraz<strong>in</strong>g olive plantations, that<br />
constitue now a relevant part of agricultural l<strong>and</strong> <strong>in</strong> Central Italy, was exposed to elevated carbon dioxide<br />
concentrations by means of a free-air CO2 enrichment facility (FACE system). The species composition<br />
<strong>in</strong>cludes clovers together with C3 <strong>and</strong> C4 grasses.<br />
Both LAI <strong>and</strong> dry matter values were <strong>in</strong>creased under elevated carbon dioxide; the variability was high.<br />
Both alive biomass <strong>and</strong> litter were <strong>in</strong>cresed <strong>in</strong> the fumigated plots; the LAI values were rather low, yet<br />
similar to what found by other authors on poor soils of the Mediterranean bas<strong>in</strong>. Some species appeared <strong>in</strong> a<br />
slightly more advanced phenological phase <strong>in</strong> the control r<strong>in</strong>gs, while, on the contrary, <strong>in</strong> some others the<br />
phenological development appeared to have been speed up by elevated carbon dioxide. At the same time,<br />
relative species abundance seems to have been affected by carbon dioxide concentration.<br />
Stomatal conductance was significantly reduced only <strong>in</strong> some species (Avena barbata <strong>and</strong> Medicago<br />
arabica), but not <strong>in</strong> others. In contrast with most of previous research, stomatal density of the abaxial leaf<br />
surface was unaffected <strong>in</strong> all the species, while, on adaxial surfaces, it was reduced <strong>in</strong> clovers. The results<br />
are discussed <strong>in</strong> the perspective of the possible effects of global change on Mediterranean ecosystems.<br />
55
SESSION 5B APPLICATIONS OF PHENOLOGY IN ECOLOGY<br />
PHENOLOGICAL MONITORING OF INDIVIDUAL TREES<br />
R. Brügger, A. Vassella, F. Jeanneret<br />
Geographical Institute, University of Berne, Hallerstr. 12, 3012 Bern<br />
bruegger@giub.unibe.ch / Fax: +41-31-631 85 11<br />
Phenological observations are a tool to get <strong>in</strong>formation about the seasonal development of the above ground<br />
parts of the trees (especially leaf unfold<strong>in</strong>g, flower<strong>in</strong>g <strong>and</strong> colour<strong>in</strong>g) <strong>in</strong> relation to climatic parameters. In<br />
Switzerl<strong>and</strong> the exist<strong>in</strong>g phenological networks have provided <strong>in</strong>formation for agricultural areas so far ( by<br />
MeteoSwiss s<strong>in</strong>ce 1951). In 1997, the Geographical Institute at the University of Berne, supported by the<br />
Swiss Agency for Environment, Forests <strong>and</strong> L<strong>and</strong>scape, started a campaign with the goal to <strong>in</strong>stall an<br />
observation network also <strong>in</strong> forests to improve the underst<strong>and</strong><strong>in</strong>g of forest ecosystems. The campaign lasts<br />
till the end of the year 2000.<br />
An observation manual, which had been worked out earlier (Vassella 1997, unpublished), has been used for<br />
the observations. Foresters <strong>and</strong> <strong>in</strong>terested non-professionals have tested the manual <strong>and</strong> have given us<br />
feedback with regard to the underst<strong>and</strong><strong>in</strong>g of the description of the phenophases. The phenological<br />
observations have been based on s<strong>in</strong>gle trees or st<strong>and</strong>s consider<strong>in</strong>g different tree species. Until summer 2000<br />
we have observations from eighteen persons at forty-two stations ( totally 631 trees <strong>and</strong> 41 st<strong>and</strong>s). Some<br />
volunteers have started the observations <strong>in</strong> 1998, others <strong>in</strong> 1999.<br />
At some stations the phenological development dur<strong>in</strong>g the year will be compared with growth measurements<br />
of the trees (shootlength <strong>and</strong> girth). The observations of s<strong>in</strong>gle trees give us the possibility to compare the<br />
<strong>in</strong>dividual phenological behaviour of the trees <strong>and</strong> to show the variability between them.<br />
56
INCREASING FROST DAMAGE RISK OF EARLY FLOWERING BOREAL<br />
TREE SPECIES: WILL CLIMATE CHANGE MAKE THEM DECLINE?<br />
T. L<strong>in</strong>kosalo<br />
University of Hels<strong>in</strong>ki, Department of Forest Ecology, Hels<strong>in</strong>ki, F<strong>in</strong>l<strong>and</strong><br />
Tapio.L<strong>in</strong>kosalo@Hels<strong>in</strong>ki.Fi, Fax. +358 9 191 7605<br />
The boreal climate zone provides trees with several signals (like temperature, variations <strong>in</strong> light conditions,<br />
changes <strong>in</strong> moisture, etc.) that they can utilise <strong>in</strong> tim<strong>in</strong>g their phenological events. So far it is unclear which<br />
signals different species use <strong>and</strong> <strong>in</strong> what manner. There are several different models presented <strong>in</strong> the<br />
literature describ<strong>in</strong>g phenological tim<strong>in</strong>g. Many of these perform satis-factorily <strong>in</strong> describ<strong>in</strong>g phenological<br />
events <strong>in</strong> the prevail<strong>in</strong>g climatic conditions, but give divergent results when extrapolated with simulated<br />
climate change conditions.<br />
In this study I tested three rather different phenological<br />
models to predict the changes <strong>in</strong> the flower<strong>in</strong>g date <strong>and</strong> frost<br />
damage risk of Alnus glut<strong>in</strong>osa, Alnus <strong>in</strong>cana, Betula sp. <strong>and</strong><br />
Populus tremula. The first model, as presented by Sarvas,<br />
describes the dormancy that the trees fall <strong>in</strong>to <strong>in</strong> the autumn,<br />
<strong>and</strong> assumes that ontogenetic development <strong>in</strong> spr<strong>in</strong>g starts as<br />
soon as dormancy is released. The second model, called the<br />
light-climate-triggered model, assumes that the plants utilise<br />
an additional signal from the light climate to start their<br />
ontogenetic development later <strong>in</strong> spr<strong>in</strong>g, well after dormancy<br />
is released. The third model, as presented by Cannell <strong>and</strong><br />
Smith, describes simultaneous ontogenetic <strong>and</strong> dormancy<br />
development, with the threshold for the occurrence of<br />
phenological events decreas<strong>in</strong>g as dormancy proceeds.<br />
The climate change was simulated by fitt<strong>in</strong>g the models to<br />
historical phenological data from central F<strong>in</strong>l<strong>and</strong> from 1896<br />
to 1955 <strong>and</strong> temperature records (four per day) for 1883-<br />
1981, <strong>and</strong> us<strong>in</strong>g the model parameters together with modified<br />
temperature records to estimate the change <strong>in</strong> flower<strong>in</strong>g<br />
dates. The frost damage risk was estimated as the ratio of<br />
years <strong>in</strong> which temperatures below a specific threshold were<br />
recorded with<strong>in</strong> the two weeks follow<strong>in</strong>g the flower<strong>in</strong>g date.<br />
Although the predicted frost damage risk varies between the<br />
three models, they all show considerable <strong>in</strong>crease <strong>in</strong> risk with<br />
a mean annual warm<strong>in</strong>g of 4 to 5 o C, especially for the two<br />
species of Alnus. The results are more variable for the later<br />
flower<strong>in</strong>g species. Warm<strong>in</strong>g of 4 to 5 o C is expected to take<br />
place with<strong>in</strong> the next century <strong>in</strong> F<strong>in</strong>l<strong>and</strong>. The simulations<br />
suggest that a great decrease <strong>in</strong> the success rate of sexual<br />
reproduction of early flower<strong>in</strong>g tree species <strong>in</strong> the boreal<br />
zone is possible. Although Alnus <strong>and</strong> Populus reproduce to<br />
Fig. 1. The frost damage risk of Alnus<br />
glut<strong>in</strong>osa (A), A. <strong>in</strong>cana (B) <strong>and</strong> Populus<br />
tremula (C) as a function of temperature<br />
<strong>in</strong>crease, accord<strong>in</strong>g to Sarvas model<br />
(open), light-climate-triggered model<br />
(dotted) <strong>and</strong> Cannell model (solid).<br />
great extent by sucker<strong>in</strong>g, <strong>in</strong> natural, unmanaged forests they are also pioneer species that first occupy the<br />
bare woodl<strong>and</strong>s exposed by forest fires or storms. As climate change proceeds, it may considerably change<br />
the natural succession <strong>and</strong> ecology of boreal trees.<br />
57
EVALUATING THE POTENTIAL FOR CLIMATE CHANGE INDUCED BARK<br />
BEETLE INVASION OF HIGH ELEVATION ECOSYSTEMS<br />
J. A. Logan (1), J. A. Powell (2), B. J. Bentz (1)<br />
(1) USDA Forest Service, Logan UT, (2) Department of Mathematics, Utah State University, USA<br />
jlogan@cc.usu.edu/FAX:435-755-3563<br />
Some western US p<strong>in</strong>e forests have evolved with bark beetle disturbance as an <strong>in</strong>tegral part of an adapted<br />
system. Lodgepole p<strong>in</strong>e (P<strong>in</strong>us contorta), for example, has co-evolved a relationship with fire <strong>and</strong> mounta<strong>in</strong><br />
p<strong>in</strong>e beetle (Dendroctonus ponderosae) disturbances that serve to ma<strong>in</strong>ta<strong>in</strong> it as a seral component of<br />
spruce/fir climax forests. Without the <strong>in</strong>teraction of these two disturbance agents, lodgepole p<strong>in</strong>e would be<br />
lost from much of its distribution. In contrast, other p<strong>in</strong>e ecosystems have not evolved <strong>in</strong> consort with bark<br />
beetle disturbance. The high-elevation, 5-needle p<strong>in</strong>es, e.g. whitebark p<strong>in</strong>e (P<strong>in</strong>us albicaulis), are typically<br />
found <strong>in</strong> environments lack<strong>in</strong>g sufficient thermal <strong>in</strong>put for ma<strong>in</strong>ta<strong>in</strong><strong>in</strong>g synchronized, adaptive volt<strong>in</strong>ism for<br />
mounta<strong>in</strong> p<strong>in</strong>e beetle populations. <strong>Global</strong> warm<strong>in</strong>g of the magnitude projected by current global circulation<br />
models has the potential to significantly impact the geographic distribution of many species. In this talk we<br />
explore the potential consequence of global warm<strong>in</strong>g on the distribution <strong>and</strong> outbreak status of mounta<strong>in</strong><br />
p<strong>in</strong>e beetle with respect to high-elevation habitats. We beg<strong>in</strong> this <strong>in</strong>vestigation by explor<strong>in</strong>g the dynamical<br />
properties of an exist<strong>in</strong>g model of mounta<strong>in</strong> p<strong>in</strong>e beetle phenology <strong>and</strong> seasonality. The dynamical<br />
properties of the thermal habitat are characterized by regions of adaptive, synchronous seasonality separated<br />
by regions of maladaptive, asynchronous seasonality. <strong>Global</strong> warm<strong>in</strong>g, by even conservative estimates of a<br />
CO2 doubl<strong>in</strong>g scenario, is great enough to move high elevation habitats from a maladaptive thermal regime<br />
to an adaptive regime, with potentially deviat<strong>in</strong>g consequences for whitebark p<strong>in</strong>e. Climate change<br />
translates to a latitud<strong>in</strong>al as well as an elevational shift <strong>in</strong> thermal habitat. A latitud<strong>in</strong>al shift by an amount<br />
consistent with CO2 doubl<strong>in</strong>g would not only allow mounta<strong>in</strong> p<strong>in</strong>e beetles to occupy previously unoccupied<br />
lodgepole p<strong>in</strong>e habitat (range expansion), but would also allow <strong>in</strong>vasion of previously unattacked jack p<strong>in</strong>e<br />
(P<strong>in</strong>us banksiana), a commercial valuable species <strong>in</strong> Canada. Although model simulations of future<br />
scenarios must be considered speculative, currently observed phonological adaptations by mounta<strong>in</strong> p<strong>in</strong>e<br />
beetle populations are consistent with model predictions. (1) A well documented outbreak that occurred<br />
dur<strong>in</strong>g the 1930s <strong>in</strong> high elevation whitebark p<strong>in</strong>e accompanied 10 years of exceptionally high temperature,<br />
on the order of those predicted by CO2 doubl<strong>in</strong>g. (2) Mounta<strong>in</strong> p<strong>in</strong>e beetle activity is currently be<strong>in</strong>g<br />
observed further north <strong>in</strong> Canada than previously recorded. This observation is concurrent with record<br />
sett<strong>in</strong>g warm temperatures of the past several years. (3) Model simulations predicted regional populations<br />
adapted to the prevail<strong>in</strong>g regional climate. Laboratory experiments with beetles collected <strong>in</strong> central Idaho<br />
(44ºN) <strong>and</strong> southern Utah (37ºN) resulted <strong>in</strong> f<strong>in</strong>d<strong>in</strong>g differences consistent with those predicted by the<br />
model.<br />
F<strong>in</strong>ally, we discuss implications of this analysis for exotic as well as native <strong>in</strong>vasive species. In particular,<br />
the model<strong>in</strong>g approaches we discuss can be applied for assess<strong>in</strong>g the potential distribution of an exotic<br />
<strong>in</strong>troduction. Additionally, theoretical analysis of the model has provided <strong>in</strong>sights <strong>in</strong>to experimental<br />
protocols for characteriz<strong>in</strong>g the potential geographical limits <strong>and</strong> seasonality of a new or hypothetical<br />
<strong>in</strong>troduction.<br />
58
LOSS OF SYNCHRONY BETWEEN HIGH- AND LOW- ALTITUDE<br />
FLOWERING PHENOLOGY DUE TO CLIMATE CHANGE<br />
D. W. Inouye<br />
Depart of Biology, University of Maryl<strong>and</strong>, USA,<br />
di5@umail.umd.edu, 301-405-6946; FAX 301-314-9358<br />
A grow<strong>in</strong>g number of papers from both North America <strong>and</strong> Europe are report<strong>in</strong>g changes <strong>in</strong> the tim<strong>in</strong>g of<br />
grow<strong>in</strong>g seasons <strong>and</strong> events such as the break<strong>in</strong>g of buds, flower<strong>in</strong>g, bird migrations <strong>and</strong> nest<strong>in</strong>g, etc. Most<br />
of these reports are from low altitudes, <strong>and</strong> most of them have found evidence for earlier tim<strong>in</strong>g of<br />
phenological events <strong>in</strong> recent decades. In contrast, my long-term study of flower<strong>in</strong>g phenology (1973 -<br />
present) at the Rocky Mounta<strong>in</strong> Biological Laboratory (2,800 m) <strong>in</strong> Colorado, USA, <strong>in</strong>dicates that there is<br />
no evidence for earlier tim<strong>in</strong>g of the grow<strong>in</strong>g season or of flower<strong>in</strong>g by many species of herbaceous or<br />
shrubby wildflowers.<br />
As is predicted by some models of global climate change, there is evidence of <strong>in</strong>creas<strong>in</strong>g w<strong>in</strong>ter<br />
precipitation at the Rocky Mounta<strong>in</strong> Biological Laboratory s<strong>in</strong>ce 1975. Total w<strong>in</strong>ter snowfall averages<br />
1,129 cm (range = 474-1,641 cm), <strong>and</strong> while the change s<strong>in</strong>ce 1975 is not statistically significant, it may be<br />
biologically significant because it has kept the first date of bare ground (which marks the beg<strong>in</strong>n<strong>in</strong>g of the<br />
grow<strong>in</strong>g season) from chang<strong>in</strong>g over this same period despite some evidence of warm<strong>in</strong>g temperatures.<br />
First date of bare ground has ranged from 26 April to 19 June (mean = 24 May), <strong>and</strong> May temperatures have<br />
been <strong>in</strong>creas<strong>in</strong>g (as measured at a weather station <strong>in</strong> Crested Butte, 9 km away <strong>and</strong> about 500 m lower). The<br />
first date of flower<strong>in</strong>g for all species that have been exam<strong>in</strong>ed so far from my data is significantly correlated<br />
with the date of bare ground. There do not appear to be any species whose tim<strong>in</strong>g of flower<strong>in</strong>g is tied to<br />
other environmental cues, such as day length or summer precipitation.<br />
A long-term study of flower<strong>in</strong>g phenology <strong>in</strong> the Wash<strong>in</strong>gton D.C. area (by botanists from the Smithsonian<br />
Institution; unpublished data) has found significantly earlier flower<strong>in</strong>g s<strong>in</strong>ce 1970 by many species of<br />
wildflowers, <strong>in</strong>clud<strong>in</strong>g some congeners of species of I am study<strong>in</strong>g. For example, Mertensia virg<strong>in</strong>iana is<br />
flower<strong>in</strong>g 21 days earlier now than it did <strong>in</strong> 1970 near Wash<strong>in</strong>gton, D.C. In contrast, the congener<br />
Mertensia ciliata at my site has not changed flower<strong>in</strong>g date significantly. Similarly, Aquilegia canadensis is<br />
flower<strong>in</strong>g 17 days earlier <strong>in</strong> the Wash<strong>in</strong>gton, D.C. area but there is no trend for change <strong>in</strong> flower<strong>in</strong>g by<br />
Aquilegia coerulea at my site.<br />
The lack of phenological change at high altitudes appears to be affect<strong>in</strong>g some altitud<strong>in</strong>al migrants (e.g., see<br />
Inouye et al. 2000. Proceed<strong>in</strong>gs of the National Academy of Sciences 97(4): 1630-1633). The grow<strong>in</strong>g<br />
divergence <strong>in</strong> environmental cues such as temperature <strong>and</strong> snowpack that are no longer correlated the way<br />
they have been historically may cause future changes <strong>in</strong> phenological events, <strong>and</strong> <strong>in</strong> migration <strong>and</strong><br />
hibernation behavior.<br />
These data po<strong>in</strong>t out the value of long-term datasets for study<strong>in</strong>g phenological events <strong>in</strong> the face of climate<br />
change. Such data are relatively easy to collect, <strong>and</strong> although only one datum can be collected per year, it<br />
may take as few as 7 - 8 years to <strong>in</strong>dicate a significant trend if one exists. The uniform lack of change that I<br />
have found at high altitude <strong>in</strong> flower<strong>in</strong>g phenology contrasts with other temperate-region studies at lower<br />
altitudes, <strong>and</strong> bioclimatic rules suggest that it would be <strong>in</strong>terest<strong>in</strong>g to look for latitud<strong>in</strong>al differences that<br />
might mirror the altitud<strong>in</strong>al differences reported here.<br />
59
POSTERS<br />
GIS ANALYSES FOR PHENOLOGICAL DATABASES IN ESTONIA<br />
A. Aasa, R. Ahas<br />
Institute of Geography, University of Tartu, Estonia<br />
antoa@ut.ee / Fax 372-7-375825<br />
The ma<strong>in</strong> objective of the current study was to analyse the follow<strong>in</strong>g aspects of the spatial distribution of<br />
spr<strong>in</strong>g phenological phases <strong>in</strong> Estonia: 1) spatial pattern of phenological phases; 2) direction <strong>and</strong> speed of<br />
the spread of phenological phases on the Estonian l<strong>and</strong>scape; 3) spatial differences between different<br />
phenological phases <strong>and</strong> years. We analysed the spatial distribution of the poll<strong>in</strong>ation of maple (Acer<br />
platanoides L.) <strong>and</strong> bird cherry (Prunus padus L.) <strong>in</strong> Estonia.<br />
The 46 observation po<strong>in</strong>ts of the l<strong>and</strong>scape phenological observation programme (1995-1999) were located<br />
<strong>in</strong> cont<strong>in</strong>ental Estonia (Figure 1). The objective of the observation programme was to study how the<br />
phenological phases are distributed, <strong>and</strong> how they move, <strong>in</strong> the l<strong>and</strong>scape. Therefore, the observation<br />
programme has specific methodology <strong>and</strong> it does not describe many specific aspects of phenology - the<br />
observers do not record dates of phenological phases, they only record the appearance of a phase, or not, <strong>in</strong><br />
the observation po<strong>in</strong>t. All together, the observation table st<strong>and</strong>ard <strong>in</strong>cluded 6 development phases of 15<br />
natural tree species for spr<strong>in</strong>g observations <strong>and</strong> 5 development phases of 8 natural tree species for autumn<br />
observations <strong>in</strong> Estonia. The observation sites were selected on the basis of the follow<strong>in</strong>g parameters:<br />
l<strong>and</strong>scape diversity <strong>and</strong> spatial coverage; visual distance from a road (b<strong>in</strong>oculars were used); appearance of<br />
more than 2 adult species of the studied tree species; exposition of the observation site. An additional time<br />
series of the studied tree species for 1948-1996 came from the Estonian Meteorological <strong>and</strong> Hydrological<br />
Institute (EMHI) <strong>and</strong> from the Estonian Naturalists Society (ENS) <strong>and</strong> these were used for analysis.<br />
Figure 1. Location <strong>and</strong> numbers of field observation sites <strong>in</strong> Estonia <strong>and</strong> <strong>in</strong>terpolation ellipses for SURFER<br />
5.01<br />
The <strong>in</strong>terpolation of phenological data collected with a route method observation series had some specific<br />
aspects. As the map of observation sites (Figure 1) shows, sited locations are aligned on three ma<strong>in</strong> axes:<br />
North to South, East to West <strong>and</strong> Northwest to Southeast. This creates the need to use a special <strong>in</strong>terpolation<br />
model for spatial <strong>in</strong>terpolation of data. For <strong>in</strong>terpolation of data from filed observations, the Surfer 5.01 was<br />
used, <strong>and</strong> the three <strong>in</strong>terpolation ellipse model was used (Figure 2). The data was <strong>in</strong>terpolated separately<br />
with every three ellipses <strong>and</strong> the mean value of all three <strong>in</strong>terpolations was used for the design of maps of 50<br />
rows <strong>and</strong> 45 columns. Parameters of the three <strong>in</strong>terpolation ellips: 1) R1=52000, R2=152000, A= -45º; 2)<br />
R1=52000, R2=152000, A= 45º; 3) R1=52000, R2=152000, A= 90º. The distance between the northernmost<br />
(No 20) <strong>and</strong> southernmost (No 4) observation po<strong>in</strong>ts is 200 km, <strong>and</strong> between the westernmost (No 61) <strong>and</strong><br />
easternmost (No 21), 220 km.<br />
The data was analysed by us<strong>in</strong>g st<strong>and</strong>ard modules of IDRISI, MGE <strong>and</strong> Surfer. For additional analyses <strong>and</strong><br />
bioclimatological mapp<strong>in</strong>g, the database of Estonian square kilometers was used. The statistical analyses of<br />
phenological, climatic, l<strong>and</strong>scape <strong>and</strong> vegetation parameters was made with this database.<br />
60<br />
R1=52000<br />
R2=152000<br />
A=-45°<br />
R1=52000<br />
R2=152000<br />
A=90°<br />
R1=52000<br />
R2=152000<br />
A=45°
PHENOLOGICAL PROGRAMS IN RUSSIAN NATURE ZAPOVEDNIKS<br />
V.Barcan<br />
Lapl<strong>and</strong> State Natural Biosphere Reserve, Russia<br />
lapl<strong>and</strong>@monch.mels.ru\ Tel-fax (81536)5-71-99<br />
The former Soviet Union has accumulated the rich experience of scientific <strong>in</strong>vestigations <strong>and</strong> permanent<br />
observations <strong>in</strong> reserves. Observation series of Russian reserves number 70-80 <strong>and</strong> even 90 years. “Nature<br />
Chronicle” is the document accumulat<strong>in</strong>g all orig<strong>in</strong>al <strong>in</strong>formation about monitor<strong>in</strong>g of ecosystem conditions.<br />
It <strong>in</strong>cludes the results of collect<strong>in</strong>g <strong>and</strong> primary treatment of the observed data. Accumulated fact material<br />
must meet the follow<strong>in</strong>g requirements: 1) to be reliable, 2) to be mass, 3) to be representative, 4) to keep the<br />
many years cont<strong>in</strong>uity. Nature Calendar, i.e. division of one year's nature circle <strong>in</strong>to periods, is the <strong>in</strong>tegrate<br />
part of Nature Chronicle. Nature Calendar unites the materials of all other sections <strong>in</strong> the way to reflect the<br />
typical biologic traits of given year <strong>and</strong> seasons. The ma<strong>in</strong> objects <strong>and</strong> phenomena were recommended for<br />
observations <strong>in</strong> 60-s by common zonal phenological programs developed by phenological sector of<br />
Geographical Society of USSR It is important for Nature Calendar not to use very many objects but to<br />
select the typical ones <strong>in</strong> order to use them as phenological <strong>in</strong>dicators. Last<strong>in</strong>g many years series of<br />
observations are the <strong>in</strong>itial material for the analysis of a year's <strong>and</strong> of many years dynamics of natural<br />
seasonal phenomena <strong>and</strong> for prediction. The seasonal development of nature of given locality is the form of<br />
display of phenological climate. An <strong>in</strong>herent ecological “chord”, i.e. complex of specific <strong>and</strong> <strong>in</strong>terrelated<br />
(causally or synchronously only) seasonal phenomena <strong>and</strong> processes, is unique to each phenological stage.<br />
This gives the possibility to judge about latent phenomena by visual, easily observed ones.<br />
Phytophenological phenomena are more reliable <strong>in</strong>dicators of seasonal limits than temperature ones. About<br />
230-240 phenological phenomena are fixed <strong>in</strong> Lapl<strong>and</strong> zapovednik yearly. Phenological observations<br />
occupy an important place <strong>in</strong> the process of education of conscious <strong>and</strong> careful consideration for nature. The<br />
majority of Russian schools <strong>in</strong>clude the collect<strong>in</strong>g of phenological <strong>in</strong>formation as the optional subject <strong>in</strong><br />
natural history programs. Elementary phenological observations are the first <strong>and</strong> major stage of activity <strong>in</strong><br />
nature protection.<br />
61
PLANTWATCH: BIOMONITOR FOR CLIMATE CHANGE<br />
E.G. Beaubien (1), T.C. Lantz(2)<br />
(1) Devonian Botanic Garden, University of Alberta, AB, (2) University of Victoria, BC<br />
e.beaubien@ualberta.ca/Fax 780.987.4141/Phone 780.987.5455<br />
Spr<strong>in</strong>g flower<strong>in</strong>g of perennials occurs primarily <strong>in</strong> response to accumulated temperature. Consequently,<br />
global warm<strong>in</strong>g should be reflected by trends to earlier spr<strong>in</strong>g development. First flower<strong>in</strong>g of Populus<br />
tremuloides shows a dramatic trend to earl<strong>in</strong>ess <strong>in</strong> Edmonton, Alberta, Canada. Plantwatch<br />
(www.devonian.ualberta.ca/pwatch) <strong>in</strong>volves observers <strong>in</strong> track<strong>in</strong>g global change by report<strong>in</strong>g bloom times<br />
for eight plant species.<br />
Historical phenology records provide an essential basel<strong>in</strong>e with which more recent records can be compared.<br />
In Canada, observations 1893-1922 were published annually by the Royal Society of Canada, <strong>in</strong>clud<strong>in</strong>g 177<br />
unique seasonal events made at 297 observation stations. This data has been used to rank 9 ecozones with<br />
respect to earl<strong>in</strong>ess of development.<br />
With Dr. Mryka Hall-Beyer, University of Calgary, we compared phenology data for five plant species with<br />
satellite data for 1992 <strong>and</strong> 1995. Early flower<strong>in</strong>g matched early green up as detected by satellite.<br />
PLANTWATCH: CANADIANS TRACK THE ARRIVAL OF SPRING<br />
(1) E.G. Beaubien, (2) T.C. Lantz<br />
(1) Devonian Botanic Garden, University of Alberta, AB, (2) University of Victoria, BC<br />
e.beaubien@ualberta.ca/Fax 780.987.4141/Phone 780.987.5455<br />
Launched <strong>in</strong> 1995, Plantwatch (www.devonian.ualberta.ca/pwatch) is an Internet program based at the<br />
University of Alberta Devonian Botanic Garden that l<strong>in</strong>ks North American students <strong>and</strong> others as the „eyes<br />
of science“. Interested observers track the spr<strong>in</strong>g bloom<strong>in</strong>g of eight key <strong>in</strong>dicator species <strong>and</strong> report bloom<br />
times over the Internet. Plantwatch also seeks observers <strong>in</strong>ternationally to report on lilac flower<strong>in</strong>g.<br />
<strong>Phenology</strong> (the seasonal tim<strong>in</strong>g of life cycle events) is an effective means of monitor<strong>in</strong>g the onset of many<br />
spr<strong>in</strong>g events that have important economic impacts. Historical records illustrate trends <strong>in</strong> response to<br />
climate change.<br />
Applications: <strong>Phenology</strong> can be used as a valuable predictive tool <strong>in</strong> a variety of contexts. It can assist<br />
foresters <strong>and</strong> farmers <strong>in</strong> predict<strong>in</strong>g the optimum tim<strong>in</strong>g of operations such as plant<strong>in</strong>g, fertiliz<strong>in</strong>g, crop<br />
protection <strong>and</strong> harvest. In wildlife management, such data can assist <strong>in</strong> predict<strong>in</strong>g deer population changes,<br />
s<strong>in</strong>ce the number of deer fawns that are successful is dependent on the relative earl<strong>in</strong>ess of spr<strong>in</strong>g. Other<br />
applications <strong>in</strong>clude human health <strong>and</strong> tourism.<br />
62
REMOTE ASSESSMENT OF PHENOLOGICAL EVENTS USING DIGITAL<br />
CAMERAS<br />
E. Beuker<br />
egbert.beuker@metla.fi // Fax. + 358 15 644 333<br />
In order to enable a high frequency of phenological observations without hav<strong>in</strong>g to visit the plot on a daily<br />
basis, a prototype of a remote system us<strong>in</strong>g digital cameras was tested at a Norway spruce Level II plot <strong>in</strong><br />
Punkaharju, F<strong>in</strong>l<strong>and</strong>. Three digital surveillance cameras, each with a different angle or zoom<strong>in</strong>g rate, were<br />
<strong>in</strong>stalled at the weather tower on the plot. The cameras were connected to a PC, which saved one picture<br />
from each camera once a day at a fixed time. Dur<strong>in</strong>g spr<strong>in</strong>g 2000 it was found that such system is suitable to<br />
assess phenological events. Tim<strong>in</strong>g of bud burst <strong>and</strong> flower<strong>in</strong>g could be assessed from the pictures.<br />
However, the technique used should be further ref<strong>in</strong>ed to improve the quality of the pictures <strong>and</strong> to get a<br />
better overview from the whole plot. Further developments are planned dur<strong>in</strong>g the near future.<br />
63
PRINCIPAL PHENOLOGICAL GROWTH STAGES OF POME, STONE FRUIT<br />
AND CURRANTS: CODING AND DESCRIPTION ACCORDING TO THE BBCH<br />
SCALE<br />
E. Bruns<br />
Deutscher Wetterdienst, Dept. Observ<strong>in</strong>g Network <strong>and</strong> <strong>Data</strong>, Offenbach/Ma<strong>in</strong>, Germany<br />
ekko.bruns@dwd.de<br />
The purpose of the detailed specific culture descriptions of the pr<strong>in</strong>cipal growth stages of fruit plants is to<br />
provide national <strong>and</strong> <strong>in</strong>ternational fruit cultivation as well as fruit grow<strong>in</strong>g experimentation with an<br />
<strong>in</strong>strument for st<strong>and</strong>ardization. This numerical f<strong>in</strong>e classification is not least required by science <strong>and</strong> <strong>in</strong><br />
practice when us<strong>in</strong>g electronic data process<strong>in</strong>g. The pr<strong>in</strong>cipal phenological growth stages are therefore<br />
presented <strong>in</strong> the form of a decimal code. The complete plant development is divided up <strong>in</strong>to the “macro<br />
stages” 0-9, from bud dormancy up to the end of leaf fall (e.g. 5: flower bud development). The micro stages<br />
(accord<strong>in</strong>g to the phenological phases) are represented by the 2 nd number of the code (0-9).<br />
Comparable stages of different fruit plants are occupied by the same codes, the differences are expressed <strong>in</strong><br />
the descriptions of the phases/stages.<br />
The BBCH scale has only <strong>in</strong>direct significance for traditional phenological observations. The phenological<br />
phases were determ<strong>in</strong>ed for the most part decades ago <strong>and</strong> it would be detrimental from a professional po<strong>in</strong>t<br />
of view to “adjust” the phases to the newer decimal scale; this would cause artificial <strong>in</strong>homogeneities <strong>in</strong> the<br />
series.<br />
In the table below the phenological phases of fruits are compared to the descriptions of the micro stages of<br />
the BBCH scale, i.e. how near the phenological phases come to the code.<br />
A further poster compares, <strong>in</strong> a similar manner, the phenological phases of <strong>in</strong>digenous cereals.<br />
Phenological phase (observation programme of the DWD) <strong>and</strong> comments<br />
Beg<strong>in</strong>n<strong>in</strong>g of bud burst (A); apple. Two BBCH codes for bud burst. Accord<strong>in</strong>g to the underst<strong>and</strong><strong>in</strong>g <strong>in</strong> the<br />
DWD <strong>and</strong> the <strong>in</strong>structions, “A” is comparable to BBCH 53<br />
Beg<strong>in</strong>n<strong>in</strong>g of flower<strong>in</strong>g, first flowers open (B); apple, pear, cherry, red currant.<br />
Full flower<strong>in</strong>g general flower<strong>in</strong>g (AB); apple, pear, cherry. Virtual concurrence <strong>in</strong> def<strong>in</strong>ition.<br />
End of flower<strong>in</strong>g (EB); apple, pear, cherry. Little concurrence <strong>in</strong> the def<strong>in</strong>ition. “EB” is, however, de facto<br />
very close to BBCH 69.<br />
Fruit ripe for pick<strong>in</strong>g (F); apple, pear, cherry.<br />
Concurrence <strong>in</strong> the description. De facto agreement can be assumed to a large extent.<br />
Fruit ripe for pick<strong>in</strong>g (F); red currant. Concurrence <strong>in</strong> the description. De facto agreement can be assumed<br />
to a large extent.<br />
Colour<strong>in</strong>g of leaves (BV); sweet cherry,<br />
Leaf fall (BF); apple.<br />
Differ<strong>in</strong>g def<strong>in</strong>itions.<br />
There ar no concurrent BBCH codes.<br />
BBCH codes for pome <strong>and</strong> stone fruit as well as currants<br />
BBCH 53 Bud burst: green leaves, which protect the cluster of blossoms, become visible. BBCH 07<br />
Beg<strong>in</strong>n<strong>in</strong>g of bud break: first green leaf tips just visible<br />
BBCH 60 First flowers open<br />
BBCH 61 Beg<strong>in</strong>n<strong>in</strong>g of flower<strong>in</strong>g: about<br />
10 % of flowers open.<br />
BBCH 65 At least 50 % of flowers open, first petals fall<strong>in</strong>g.<br />
BBCH 69 End of flower<strong>in</strong>g: all petals fallen.<br />
64
BBCH 87 Fruit ripe for pick<strong>in</strong>g: fruits have developed sufficiently <strong>and</strong> have good keep<strong>in</strong>g quality.<br />
BBCH 87 Fruit ripe for pick<strong>in</strong>g: <strong>in</strong><br />
80 % of the bunches all berries are ripe; berries at base of racemes are soft.<br />
BBCH 93 Beg<strong>in</strong>n<strong>in</strong>g of leaf fall.<br />
BBCH 95 50 % of leaves discoloured or fallen.<br />
BBCH 97 All leaves fallen.<br />
========== Agreement <strong>in</strong> the def<strong>in</strong>itions<br />
----------------- Agreement to a large extent<br />
65
EXPERIENCE OF THE DENDROPHENOLOGICAL INDICATION OF SHORT-<br />
TERM CLIMATE CHANGES AND OF CURRENT WARMING IN EASTERN<br />
EUROPE<br />
N.E. Bulyg<strong>in</strong><br />
National Forest Management Academy, St-Petersburg, Russia<br />
The Department of Botany <strong>and</strong> Dendrology of the St-Petersburg Forest Management Academy, the lead<strong>in</strong>g<br />
Russian research centre <strong>in</strong> the area of phenology, has for more than 30 years studied the problem of the<br />
dendrophenological <strong>in</strong>dication of short-term climate changes. Us<strong>in</strong>g dendrophenological time-series<br />
collected <strong>in</strong> St-Petersburg s<strong>in</strong>ce 1841 (the flower<strong>in</strong>g of Alnus <strong>in</strong>cana, Padus avium, Syr<strong>in</strong>ga vulgaris, Tilia<br />
cordata, etc.), it has been found that the powerful 19 th century temperature fall objectively reflects the<br />
phenological trend described by a parabolic equation <strong>and</strong> the climate warm<strong>in</strong>g <strong>in</strong> the 20 th century refers to<br />
the trend described by a straight equation. With the grow<strong>in</strong>g of the average temperature of the grow<strong>in</strong>gseason<br />
by 0,08°C the season becomes a day longer. Ecologically, under the <strong>in</strong>fluence of the climate<br />
warm<strong>in</strong>g the region of St-Petersburg has “moved” 200-250 km to the south. However, its has been found<br />
that dendrophenological time-series have synchronous cycles manifest<strong>in</strong>g themselves from early spr<strong>in</strong>g till<br />
midsummer. The cycles last on average 2, 3.5, 7-8 <strong>and</strong> 31 years <strong>and</strong> have climatic analogies. The analysis of<br />
century-long dendrophenological time-series collected <strong>in</strong> Moscow, Vologda, Kirov, Yekater<strong>in</strong>burg <strong>and</strong><br />
Ukra<strong>in</strong>e has shown that phenological cycles established <strong>in</strong> St-Petersburg can manifest themselves<br />
simultaneously on the vast territories of the Russian Pla<strong>in</strong>. The mathematical modell<strong>in</strong>g of phenologytemperature<br />
connections us<strong>in</strong>g the material of 200 phenological support units <strong>in</strong> the European part of the<br />
former Soviet Union has allowed the researchers to work out an effective method of long-term weather<br />
forecast for the territory stretch<strong>in</strong>g from forest tundra to the Ciscaucasian steppes. Dendrophenological<br />
cycles are to some extent associated with solar activity cycles: statistically, early phenodates are observed<br />
on average <strong>in</strong> the third year after the solar maximum <strong>and</strong> late ones <strong>in</strong> the second year after it. Ecological<br />
adaptation <strong>and</strong> productivity of arboreal plants are greatly affected by bioclimatic cycles: a complicated set<br />
of plants’ age reactions to short-term climate changes <strong>and</strong> phenological biorhythm changes caused by them.<br />
The ma<strong>in</strong> pheno<strong>in</strong>dicators of the arrival of various types of bioclimatic cycles (early-warm <strong>and</strong> late-cold)<br />
are the flower<strong>in</strong>g dates of Alnus <strong>in</strong>cana or Corylus avellana.<br />
66
FORECAST OF FULL FLOWERING DATES OF PEAR TREE (PYRUS<br />
COMMUNIS L.), APPLE TREE (MALUS DOMESTICA BORKH) AND PLUM<br />
TREE (PRUNUS DOMESTICA L.) – SIMILARITIES AND DIFFERENCES<br />
K. Bergant, Z. Crep<strong>in</strong>sek, L. Kajfez-Bogataj<br />
Center of Biometeorology, University of Ljubljana, Slovenia<br />
zalika.crep<strong>in</strong>sek@bf.uni-lj.si / Fax:+386-61-1231088<br />
Paper discusses the similarities <strong>and</strong> differences <strong>in</strong> predict<strong>in</strong>g the full flower<strong>in</strong>g of apple tree (cv. 'Bobovec'),<br />
pear tree (cv.'Pastorjevka') <strong>and</strong> domestic plum tree. The study was conducted at University of Ljubljana<br />
based on climatological <strong>and</strong> phenological observations of Hydrometeorological <strong>in</strong>stitute of Slovenia. First<br />
average monthly air temperature <strong>and</strong> average monthly amount of precipitation from January to April were<br />
used as predictors for flower<strong>in</strong>g of fruit trees dur<strong>in</strong>g the time period 1967-1996 <strong>and</strong> <strong>in</strong> second case <strong>in</strong>put data<br />
for models were phenological data of autochthon plants: first leaves unfolded of Betula pendula ROTH,<br />
Fagus sylvatica L. <strong>and</strong> Tilia platyphyllos Scop. Two different approaches were employed for predict<strong>in</strong>g of<br />
full flower<strong>in</strong>g of apple tree, pear tree <strong>and</strong> plum tree: the l<strong>in</strong>ear multiple regression <strong>and</strong> correlation analysis.<br />
The date of full flower<strong>in</strong>g for all tree species is strongly correlated with the first leaves unfold<strong>in</strong>g of birch<br />
(R2 is from 0.61 to 0.91) <strong>and</strong> <strong>in</strong> case of pear tree <strong>and</strong> apple tree also with first leaves unfold<strong>in</strong>g of beech (R2<br />
is from 0.62 to 0.66). Also strong correlation with comb<strong>in</strong>ation of average March <strong>and</strong> April air temperature<br />
was found for flower<strong>in</strong>g of apple tree <strong>and</strong> plum tree, for pear tree the full flower<strong>in</strong>g was correlated with<br />
comb<strong>in</strong>ation of average February <strong>and</strong> March air temperatures. In case of apple tree 76% of total variance<br />
was expla<strong>in</strong>ed by l<strong>in</strong>ear multiple regression model between fullflower<strong>in</strong>g <strong>and</strong> air temperatures, for plum tree<br />
55% <strong>and</strong> for pear tree even 91%. The multiple regression model for predict<strong>in</strong>g the full flower<strong>in</strong>g on the base<br />
of March <strong>and</strong> April temperatures have great disadvantage, because the predictions can be made <strong>in</strong> case of<br />
apple tree only 2 days ahead <strong>and</strong> <strong>in</strong> case of plum tree not even that. On the other h<strong>and</strong>, the prediction for<br />
pear tree can be made 22 days ahead. The full flower<strong>in</strong>g for apple tree <strong>and</strong> plum tree <strong>in</strong> our case were not<br />
correlated to average monthly amount of precipitation at all. This could be expected s<strong>in</strong>ce <strong>in</strong> Slovenia, water<br />
availability <strong>in</strong> the spr<strong>in</strong>g<br />
is sufficient for plant needs.<br />
67
CLIMATE AND APHID PHENOLOGY<br />
R. Harr<strong>in</strong>gton (1), M. Else (1), C. Denholm (1), J. Pickup (2), M. Hullé (3)<br />
(1) IACR Rothamsted, Harpenden, Herts, UK. (2) SASA, East Craigs, Ed<strong>in</strong>burgh. (3) INRA Laboratoire de<br />
Zoologie, Doma<strong>in</strong>e de la Motte au Vicomte, Le Rheu, France.<br />
melissa.else@bbsrc.ac.uk<br />
About 500 species of aphid have been monitored on a daily basis us<strong>in</strong>g a st<strong>and</strong>ardised trapp<strong>in</strong>g system s<strong>in</strong>ce<br />
1965. There is now a network of about 70 suction traps throughout Europe. Studies of selected species <strong>in</strong> the<br />
UK <strong>and</strong> France reveal that migratory phenologies are advanced as a result of warmer w<strong>in</strong>ters. For example,<br />
the economically important peach-potato aphid beg<strong>in</strong>s fly<strong>in</strong>g about 2 weeks earlier for every degree<br />
centigrade rise <strong>in</strong> January-February mean temperature. The effect is consistent at most sites exam<strong>in</strong>ed, but<br />
there is a further effect (not related to temperature) that delays migration further north. The relationship<br />
between phenology <strong>and</strong> temperature holds for many species which pass the w<strong>in</strong>ter as parthenogenetic<br />
<strong>in</strong>dividuals, but not for most of those which overw<strong>in</strong>ter <strong>in</strong> the more cold tolerant egg stage. Extension of the<br />
analysis throughout Europe will be possible <strong>in</strong> the EU-funded project `EXAMINE' (2000-2003). This will<br />
provide deeper <strong>in</strong>sight <strong>in</strong>to the <strong>in</strong>fluence of climate of aphid dynamics <strong>and</strong> allows <strong>in</strong>ferences to be made on<br />
the potential impacts of climate change.<br />
68
RUSSIAN PHENOLOGY: HISTORY AND PRESENT DAY<br />
V.G. Fedotova<br />
V.L. Komarov Botanical Institute of the Russian Academy of Sciences, Museum Department, St-<br />
Petersburg, Russia<br />
The first phenological data collected <strong>in</strong> Russia can be found <strong>in</strong> medieval annals <strong>and</strong> chronicles.<br />
Subsequent observations go<strong>in</strong>g on for many years resulted <strong>in</strong> the development of the so-called people’s<br />
phenology based on people’s say<strong>in</strong>gs about weather signs used s<strong>in</strong>ce olden times by Russian peasants to<br />
determ<strong>in</strong>e the best time for agricultural works. In the second half of the 18 th century systematic<br />
observations were carried out by some enthusiast scientists (P.S. Pallas, I.P. Falk, A.T. Bolotov, P.<br />
Kraft, F.E. Gerder et al.).<br />
It is known that the Belgian A. Ketle worked out the first <strong>in</strong>ternational programme for mass<br />
phenological observations <strong>in</strong> Central <strong>and</strong> Eastern Europe. In 1848 the Russian Geographic Society<br />
developed a similar programme for mass observations <strong>in</strong> Eastern Europe. The first summary of<br />
phenological observations carried out by 120 correspondents <strong>in</strong> 1851 was published <strong>in</strong> Russia <strong>in</strong> 1854<br />
under the name of Selskaya Letopis (“Countryside Annals”). In 1855 A.F. Middendorf published the<br />
world’s first work provid<strong>in</strong>g an isophene map. A lot of material was also published <strong>in</strong> the collections of<br />
the Geographic Society (N.Y. Danilevsky, 1858, V.I. Kovalevsky, 1884, et al.). In 1885 the climate<br />
scientist L.I. Voyeikov created the first small network of phenological units <strong>in</strong> European Russia, <strong>and</strong><br />
from 1886 till 1924 a network of voluntary phenological correspondents worked on a vast territory<br />
under the guidance of the scientist D.N. Kaigorodov. At present the network bears his name.<br />
In the 1940s scientific phenology began to establish itself. The publications <strong>in</strong>cluded phenological maps<br />
of the USSR <strong>and</strong> Europe (Smirnov, 1937, 198, 1938) <strong>and</strong> the first article about the connection between<br />
the seasonal dynamics of the atmosphere <strong>and</strong> phenological phenomena on the Earth (Vutakova, 1945).<br />
These topics are also actively studied now (N.E. Bulyg<strong>in</strong>, 1986, 1998 et al.). S<strong>in</strong>ce 1960, 4,000<br />
phenological correspondents have been carry<strong>in</strong>g out observations under 9 unified complex programmes<br />
worked out (G.Z. Shchultz et al.) for all areas <strong>and</strong> prov<strong>in</strong>ces from the Russian Pla<strong>in</strong> to the Pacific Ocean<br />
<strong>in</strong>clud<strong>in</strong>g the territory of the former USSR. There are separate observation programmes for<br />
hydrometeorological stations, agricultural stations <strong>and</strong> nature reserves. In some units observation timeseries<br />
have been taken for more than 50 years. 600 units have been tak<strong>in</strong>g them for more that 25 years<br />
<strong>and</strong> St-Petersburg for more than 150 years (LTA). S<strong>in</strong>ce 1939 long-term phenological observations<br />
have been summarised <strong>in</strong> regular collections called Kalendari Prirody (“Weather Calendars”) provid<strong>in</strong>g<br />
phenological <strong>in</strong>formation for St-Petersburg <strong>and</strong> the regions. Hundreds of such calendars have been<br />
published. Phenological maps have also been <strong>in</strong>cluded <strong>in</strong> the “Forest Atlas of the USSR” <strong>and</strong> regional<br />
agroclimatic reference books.<br />
The phenological science has been develop<strong>in</strong>g <strong>in</strong> several directions. These are general <strong>and</strong> particular<br />
phenology <strong>and</strong> theoretical <strong>and</strong> applied phenology. General phenology studies space-time relations <strong>in</strong> the<br />
seasonal development of natural habitats <strong>in</strong> Russia <strong>and</strong> neighbour<strong>in</strong>g countries. Space-time relations<br />
between seasonal atmospheric changes <strong>and</strong> phytosphere have been analysed <strong>and</strong> a method of<br />
forecast<strong>in</strong>g short-term climate changes on the basis of phytophenological <strong>in</strong>formation has been worked<br />
out (N.E. Bulyg<strong>in</strong> et al., 1986). Particular aspects of phenology <strong>in</strong>volve the work<strong>in</strong>g out of regional<br />
weather calendars based on <strong>in</strong>dicational phenology <strong>in</strong> order to optimise economic activities. The least<br />
studied territories <strong>in</strong> terms of phenology are the former Soviet Central Asia <strong>and</strong> Caucasus which have<br />
not provided any observations for the past 10 years. Other neighbour<strong>in</strong>g countries keep send<strong>in</strong>g their<br />
material to the Russian Geographic Society where data collected over a number of years are<br />
concentrated <strong>in</strong> a special archive.<br />
In Russia phenology is taught <strong>in</strong> some universities <strong>and</strong> colleges. Phenologists’ meet<strong>in</strong>gs <strong>and</strong> thematic<br />
conferences are held regularly. Unfortunately, for certa<strong>in</strong> reasons Russians phenologists practically do<br />
not participate <strong>in</strong> <strong>in</strong>ternational co-operation but we are prepared to support any <strong>in</strong>itiative <strong>in</strong> phenology<br />
<strong>and</strong> make a substantial contribution to the common cause.<br />
69
LARGE SCALE CLIMATE VARIABILITY AND ITS EFFECTS ON MEAN<br />
TEMPERATURE AND FLOWERING TIME OF PRUNUS AND BETULA<br />
A.K. Gormsen, T.B. Toldam-Andersen <strong>and</strong> P. Braun<br />
KVL, Inst. Agric. Sci, Sect. Horticulture, Copenhagen, Denmark<br />
akg@kvl.dk / Fax: +45-35 28 34 78<br />
Large scale climate variability greatly effects average climatic conditions <strong>and</strong> therefore is likely to <strong>in</strong>fluence<br />
the phenology of plants as well. In NW-Europe, the North Atlantic Oscillation (NAO) particularly <strong>in</strong>fluences<br />
w<strong>in</strong>ter climate <strong>and</strong>, through its effects on plants, flower<strong>in</strong>g time of all tree species.<br />
In Denmark, like <strong>in</strong> many other NW-European countries, flower<strong>in</strong>g of most tree species appears to start<br />
earlier s<strong>in</strong>ce the beg<strong>in</strong>n<strong>in</strong>g of the 1990`s compared to the time before. To quantify a possible relation<br />
between NAO <strong>and</strong> flower<strong>in</strong>g time of tree species, two sources of phenological <strong>in</strong>formation from the<br />
Copenhagen area (Denmark)were analysed , i.e. pollen counts of the genus Betula for Copenhagen (data<br />
from 1977-1994) <strong>and</strong> observed first bloom dates of Prunus avium ‘Bov’ from Taastrup west of Copenhagen<br />
(data from the International phenological garden for the period 1980 - 1994). Both places have a climatic<br />
station nearby, <strong>and</strong> temperature data was obta<strong>in</strong>ed from these station. Furthermore, air temperature data from<br />
a weather station <strong>in</strong> Copenhagen were used for the period from 1955 - 1994. The NAO-Index, an <strong>in</strong>dex<br />
describ<strong>in</strong>g the state of the NAO, was obta<strong>in</strong>ed from Bonn University. Simple correlation techniques were<br />
employed us<strong>in</strong>g mean monthly or whole w<strong>in</strong>ter (Jan - April) data.<br />
The <strong>in</strong>fluence of temperature on flower<strong>in</strong>g time varied <strong>in</strong> this study from 30% to 56% depend<strong>in</strong>g on genus,<br />
location <strong>and</strong> month. The NAO’s <strong>in</strong>fluence on temperatures was <strong>in</strong> Taastrup found to decrease from 48% <strong>in</strong><br />
January to 13% <strong>in</strong> April, with an <strong>in</strong>fluence on the whole period of 51%. In Copenhagen the correlation<br />
coefficient decreases from 56% <strong>in</strong> January across 20% <strong>in</strong> March to 31% <strong>in</strong> April with an r 2 of 0.37 for the<br />
whole period. These f<strong>in</strong>d<strong>in</strong>gs correspond well with the NAO hav<strong>in</strong>g a decreas<strong>in</strong>g <strong>in</strong>fluence on mean climatic<br />
conditions from w<strong>in</strong>ter to spr<strong>in</strong>g. The direct correlation of NAO-<strong>in</strong>dex <strong>and</strong> flower<strong>in</strong>g time also revealed a<br />
decrease from Jan - April but with more noise (values from 52 down to 19% for the s<strong>in</strong>gle months).<br />
However, us<strong>in</strong>g whole period means (January-April) the correlation coefficient <strong>in</strong>creased to 72% <strong>in</strong> Taastrup<br />
(flower<strong>in</strong>g time of Prunus) <strong>and</strong> 79% <strong>in</strong> Copenhagen (pollen counts for Betula).<br />
This <strong>in</strong>dicates a close relationship between natural climate variability, i.e. the NAO, <strong>and</strong> flower<strong>in</strong>g time of<br />
tree species for the eastern part of Denmark. This study also <strong>in</strong>dicates that both sources of data, pollen<br />
counts <strong>and</strong> observations of flower<strong>in</strong>g time, were equally useful for analys<strong>in</strong>g mean climate effects on plants.<br />
LOSS OF SYNCHRONY BETWEEN HIGH- AND LOW- ALTITUDE<br />
FLOWERING PHENOLOGY DUE TO CLIMATE CHANGE<br />
D. W. Inouye<br />
Depart of Biology, University of Maryl<strong>and</strong>, USA<br />
di5@umail.umd.edu, 301-405-6946; FAX 301-314-9358<br />
(see page 59)<br />
70
ALPINE LONG TIME DATA SETS<br />
E. Koch<br />
Central Institute for Meteorology <strong>and</strong> Geodynamics, Vienna, Austria<br />
elisabeth.koch@zamg.ac.at / Fax: +43 1 3602672<br />
Introduction<br />
Plants <strong>in</strong> the moderate <strong>and</strong> cool climate zones have a dormancy period dur<strong>in</strong>g w<strong>in</strong>ter. At the beg<strong>in</strong>n<strong>in</strong>g of<br />
spr<strong>in</strong>g the onset of vegetation is mostly triggered by temperature <strong>and</strong> daylight. Therefore the spr<strong>in</strong>g phases<br />
can be looked as an <strong>in</strong>dicator of chang<strong>in</strong>g environmental conditions be<strong>in</strong>g particularly sensitive to<br />
temperature.<br />
This paper deals with phenological spr<strong>in</strong>g phases of plants <strong>in</strong> the Swiss, Austrian <strong>and</strong> Slovenian alp<strong>in</strong>e<br />
regions dur<strong>in</strong>g the period spann<strong>in</strong>g <strong>in</strong> some observation sites from as early as1951 to 1999.<br />
We regarded early spr<strong>in</strong>g phases as e.g. blossom<strong>in</strong>g of Anemone hepatica, Galanthus nivalis, Tussilago<br />
farfara etc. The spr<strong>in</strong>g phases are subdivided <strong>in</strong>to blossom<strong>in</strong>g <strong>and</strong> leaf unfold<strong>in</strong>g. The observed plants are<br />
e.g. Acer platanoides, Aesculus hippocastanus, Betula (pendula), Fagus sylvatica, Larix decidua, Malus<br />
domestica, Prunus avium, Quercus, Syr<strong>in</strong>ga vulgaris <strong>and</strong> so on. For each plant <strong>and</strong> observations site the<br />
deviations (days) from the correspond<strong>in</strong>g mean value of the period 1975 to 1994 were calculated. The<br />
negative values of the deviations were smoothed with a Gaussian low pass filter (filter width 10 years)<br />
result<strong>in</strong>g <strong>in</strong> positive values for phases start<strong>in</strong>g earlier than the mean <strong>and</strong> negative values for delayed phases.<br />
In order to get complete time series miss<strong>in</strong>g values were calculated us<strong>in</strong>g l<strong>in</strong>ear regression-models either<br />
with the same phenophase of the closest station or a similar term<strong>in</strong>ated phenophase of the same location<br />
(Rötzer, 2000).<br />
The early spr<strong>in</strong>g phases have the greatest variability from one year to the other. Some warm days with high<br />
<strong>in</strong>sulation can trigger the blossom<strong>in</strong>g of Galanthus nivalis, Anemona etc. The beg<strong>in</strong>n<strong>in</strong>g of blossom<strong>in</strong>g can<br />
be as early as January or as late as April <strong>in</strong> higher altitudes with snow cover. These first signs of spr<strong>in</strong>g are<br />
often followed by cold spells <strong>and</strong> thus are not real <strong>in</strong>dicators for the beg<strong>in</strong>n<strong>in</strong>g of the grow<strong>in</strong>g season<br />
(Defila, 1991).<br />
Despite the large differences even between the same phases <strong>in</strong> one region a general trend can be detected.<br />
Dur<strong>in</strong>g the fifties <strong>and</strong> the late eighties <strong>and</strong> early n<strong>in</strong>eties leaf unfold<strong>in</strong>g <strong>and</strong> blossom<strong>in</strong>g reached the earliest<br />
values of the whole period. This fact shows good correlation with the temperature time series <strong>in</strong> the Alps for<br />
the summer half year. Böhm et al. (2000) showed that temperature <strong>in</strong> the Alps reached its first 20th century<br />
maximum near 1950 <strong>and</strong> after a cool<strong>in</strong>g to the relative m<strong>in</strong>imum <strong>in</strong> the 1970s summer temperature quickly<br />
<strong>in</strong>creased to the recent maximum. When regard<strong>in</strong>g only the period 1960 to 1999 a tendency to an earlier start<br />
of plant development can be found (Koch, 1999, Menzel 1999, Rötzer)<br />
Switzerl<strong>and</strong> Central: 10 years low passed filtered phenological time series relative to the mean 1975-1994;<br />
positive values are earlier, negative values are delayed.<br />
20<br />
15<br />
10<br />
5<br />
0<br />
-5<br />
-10<br />
-15<br />
-20<br />
-25<br />
-30<br />
days<br />
1951<br />
1956<br />
1961<br />
1966<br />
1971<br />
1976<br />
1981<br />
1986<br />
1991<br />
1996<br />
30<br />
25<br />
20<br />
15<br />
10<br />
5<br />
0<br />
-5<br />
-10<br />
-15<br />
-20<br />
days<br />
1951<br />
1956<br />
1961<br />
1966<br />
1971<br />
1976<br />
1981<br />
early spr<strong>in</strong>g phases leaf unfold<strong>in</strong>g blossom<strong>in</strong>g<br />
Acknowledgement: I have to thank the Swiss Meteorological Institute, esp. Claudio Defila <strong>and</strong> the<br />
Hydrometeorological Institute of Slovenia esp. Ana ust <strong>and</strong> Andreja Sušnik provid<strong>in</strong>g the data from<br />
Switzer-l<strong>and</strong> <strong>and</strong> Slovenia. This work is part of the EU project POSITIVE (5 th Framework Programme RTD<br />
/ EESD, EVK2-CT-1999-00012).<br />
1986<br />
1991<br />
1996<br />
days<br />
20<br />
15<br />
10<br />
5<br />
0<br />
-5<br />
-10<br />
-15<br />
1951<br />
1956<br />
1961<br />
1966<br />
1971<br />
1976<br />
1981<br />
1986<br />
1991<br />
1996<br />
71
A COMMON PHENOLOGICAL DATA BASE FOR THE EU PROJECT<br />
‘POSITIVE’<br />
H. Scheif<strong>in</strong>ger, W. Lipa<br />
Central Institute for Meteorology <strong>and</strong> Geodynamics, Vienna, Austria<br />
Wolfgang.Lipa@zamg.ac.at / Fax: +43 1 3602672<br />
One of the ma<strong>in</strong> problems when compil<strong>in</strong>g the common phenological data base consists <strong>in</strong> a reasonable<br />
selection of phenological variables. To some extent this procedure is subjective <strong>and</strong> determ<strong>in</strong>ed by the f<strong>in</strong>al<br />
purpose. Follow<strong>in</strong>g steps were applied:<br />
Phase def<strong>in</strong>itions of the different countries are compared <strong>and</strong> identical or similar phases are identified.<br />
All observed species of all countries are compiled <strong>and</strong> species, which seem important enough <strong>and</strong> are<br />
observed at least <strong>in</strong> two or more countries are selected.<br />
Select phenological phases of the selected species <strong>and</strong> summarise them with a common cod<strong>in</strong>g system for<br />
the data base.<br />
Another very important aspect of the phenological data base concerns data quality. With an automated data<br />
check<strong>in</strong>g procedure most unreasonable data can be identified. The variation <strong>in</strong> temporal <strong>and</strong> spatial density<br />
of the phenological data turned out to be very high. In some European regions this special feature could<br />
pose restrictions to analysis procedures.<br />
72
THE USE OF MODIS NADIR BRDF-ADJUSTED REFLECTANCES TO<br />
MONITOR PHENOLOGICAL ACTIVITY<br />
A. H. Strahler (1), C. B. Schaaf (1), M. Friedl (1), W. Lucht (2), F. Gao (1), X. Zhang (1), D. McIver (1),<br />
<strong>and</strong> J. F. C. Hodges (1)<br />
(1) Department of Geography <strong>and</strong> Center for Remote Sens<strong>in</strong>g, Boston University, Boston MA, USA<br />
(2) Potsdam Institute fur Klimafolgenforschung (PIK), Potsdam, Germany<br />
schaaf@bu.edu/ Fax 617-353-3200<br />
MODIS St<strong>and</strong>ard <strong>Data</strong> L<strong>and</strong> Products began production <strong>in</strong> March 2000 <strong>in</strong> time to capture the spr<strong>in</strong>g<br />
grow<strong>in</strong>g season <strong>in</strong> the northern hemisphere. Nadir BRDF-Adjusted Reflectances (one of the outputs of the<br />
MODIS BRDF/Albedo Product -- MOD43B) are be<strong>in</strong>g evaluated for their utility <strong>in</strong> monitor<strong>in</strong>g global<br />
phenology. The MODIS BRDF/Albedo algorithm relies on multidate atmospherically corrected <strong>and</strong> cloudcleared<br />
data <strong>and</strong> a semiempirical kernel-driven bidirectional reflectance model to determ<strong>in</strong>e a global set of<br />
parameters describ<strong>in</strong>g the BRDF of the l<strong>and</strong> surface for each 16 day period. These one kilometer gridded<br />
parameters are then used to determ<strong>in</strong>e both albedo quantities <strong>and</strong> the Nadir BRDF-Adjusted Reflectance<br />
(NBAR) for seven spectral b<strong>and</strong>s. S<strong>in</strong>ce these surface reflectances have had view angle effects removed,<br />
they can serve as uniform representations of the nadir reflectance for each 16 day period. Therefore they are<br />
ideal for l<strong>and</strong> cover classification <strong>and</strong> phenological studies <strong>and</strong> are be<strong>in</strong>g used as the primary <strong>in</strong>put to the<br />
MODIS L<strong>and</strong> Cover <strong>and</strong> L<strong>and</strong> Cover Change (MOD12Q) Products. These products will <strong>in</strong>clude parameters<br />
to describe the phenological activity that occurs at a 16 day temporal resolution dur<strong>in</strong>g each quarter of the<br />
year. Imagery of the North American NBAR for the spr<strong>in</strong>g <strong>and</strong> summer of 2000 will be presented <strong>and</strong><br />
discussed.<br />
73
PHENOLOGY AS GLOBAL CHANGE BIO-INDICATOR<br />
A.Menzel<br />
Department of Ecology, Technical University of Munich, Germany<br />
Menzel@met.forst.tu-meunchen.de // Fax (+49) 8161 714753<br />
The <strong>in</strong>creases <strong>in</strong> air temperature due to the anthropogenic greenhouse effect can be detected easily <strong>in</strong> the<br />
phenological data of Europe <strong>and</strong> Germany with<strong>in</strong> the last four decades.<br />
Dur<strong>in</strong>g the past 30 years of observation <strong>in</strong> the International Phenological Gardens <strong>in</strong> Europe with genetically<br />
identical clones phase shifts are clearly noticeable. Spr<strong>in</strong>g events, such as leaf unfold<strong>in</strong>g, have advanced by<br />
6 days whereas autumn events, such as leaf colour<strong>in</strong>g, have been delayed by 4.8 days – lengthen<strong>in</strong>g the<br />
annual grow<strong>in</strong>g season by 10.8 days s<strong>in</strong>ce the early 1960s. More than 70% of the variance can be attributed<br />
ma<strong>in</strong>ly to changes <strong>in</strong> air temperature (Menzel 1999, 2000).<br />
For Germany a comprehensive analysis of the ma<strong>in</strong> phenological seasons, represented by 16 phenological<br />
key phases, such as flower<strong>in</strong>g of snow drops <strong>in</strong>dicat<strong>in</strong>g the start of the earliest spr<strong>in</strong>g, <strong>and</strong> an analysis of the<br />
grow<strong>in</strong>g season, determ<strong>in</strong>ed as the time span between leaf unfold<strong>in</strong>g <strong>and</strong> leaf colour<strong>in</strong>g of 4 deciduous tree<br />
species, was made us<strong>in</strong>g phenological data of the network of the German Weather Service. This study<br />
equally revealed an earlier beg<strong>in</strong>n<strong>in</strong>g of spr<strong>in</strong>g <strong>in</strong> the last decades, whereas the key phases of late autumn<br />
tend to be delayed <strong>in</strong> the past few decades. The whole grow<strong>in</strong>g season is also lengthened, but less than it was<br />
revealed for the International Phenological Gardens.<br />
Fig. 1: L<strong>in</strong>ear trends of leaf unfold<strong>in</strong>g of birch (Betula pendula Roth) <strong>in</strong> Germany. <strong>Data</strong> taken from the<br />
phenological network of the German Weather Service are for long observational series (20 yeras <strong>and</strong> more)<br />
dur<strong>in</strong>g the 1061 to 1996 period.<br />
Literature:<br />
Menzel, A., Fabian, P. (1999) Grow<strong>in</strong>g season extended <strong>in</strong> Europe. Nature 397: 659<br />
74
Menzel, A. (2000) Trends <strong>in</strong> phenological phases <strong>in</strong> Europe between 1951 <strong>and</strong> 1996. Int. J. Biomet. 44 (2)<br />
76-81<br />
75
EU-PROJECT POSITIVE: PHENOLOGICAL OBSERVATIONS AND<br />
SATELLITE DATA (NDVI): TRENDS IN THE VEGETATION CYCLE IN<br />
EUROPE<br />
A.Menzel 1 , R. Ahas 2 , I. Chu<strong>in</strong>e 3 , M. Hirschberg 1 , E. Koch 4 , C. Tucker 5<br />
(1) Technical University of Munich, Germany (2) University of Tartu. Estonia (3) University of Montpellier<br />
II, France (4) ZAMG, Austria (5) GSFC, NASA, USA<br />
Menzel@met.forst.tu-meunchen.de // Fax. (+49) 8161 714753<br />
POSITIVE is a 5th framework EU project funded by the European Commission which will last 2 years (Feb<br />
1 2000 - Jan 31 2002). Further <strong>in</strong>formation can be found at<br />
http://www.fw.tum.de/EXT/LST/METEO/positive/.<br />
The idea<br />
Phenological changes affect ecology, agriculture, forestry, human health <strong>and</strong> via feedback mechanism the<br />
climate system. POSITIVE will study exist<strong>in</strong>g data sets of phenological observations <strong>in</strong> Europe <strong>and</strong> their<br />
relationship with climate <strong>and</strong> AVHRR NDVI satellite data. Phenological monitor<strong>in</strong>g has a long tradition <strong>in</strong><br />
many European countries <strong>and</strong> many long-term data sets exist. This makes Europe a particularly suitable<br />
region for <strong>in</strong>vestigat<strong>in</strong>g phenology <strong>and</strong> phenological trends provid<strong>in</strong>g important ‘ground truth’ to earth<br />
observation programmes <strong>and</strong> global change research.<br />
The consortium<br />
<strong>TUM</strong> Technical University Munich, Germany<br />
GSFC Goddard Space Flight Center, NASA, USA<br />
UMII Université Montpellier II, France<br />
UT University of Tartu, Estonia<br />
ZAMG Zentralanstalt f. Meteorologie u. Geodynamik, Vienna, Austria<br />
Co-ord<strong>in</strong>ation Annette Menzel, <strong>TUM</strong><br />
The ma<strong>in</strong> objective<br />
Ma<strong>in</strong> objective is to develop tools, such as phenological models, as well as techniques for <strong>in</strong>tegrat<strong>in</strong>g these<br />
data for multi-purpose use <strong>in</strong> the field of global change research: Detection of climate change impacts with<br />
phenological <strong>and</strong> satellite data, modell<strong>in</strong>g phenology under GCM future scenarios, describ<strong>in</strong>g the present<br />
<strong>and</strong> future temporal <strong>and</strong> spatial variability of phenological phases, <strong>and</strong> provid<strong>in</strong>g maps thereof, <strong>in</strong> order to<br />
assess consequences for human health, biodiversity <strong>and</strong> natural systems.<br />
The objectives<br />
� to describe the geographical <strong>and</strong> temporal variability <strong>and</strong> trends of phenological phases <strong>in</strong> Europe<br />
(1951-1998)<br />
� to analyse the temporal <strong>and</strong> spatial variability of the green wave <strong>in</strong> Europe (AVHRR NDVI data 1981-<br />
2000)<br />
� to quantify large-scale grow<strong>in</strong>g season duration for the northern hemisphere<br />
� to determ<strong>in</strong>e changes <strong>in</strong> the photosynthetic capacity.<br />
� to develop <strong>and</strong> test autumn phenological models, to test spr<strong>in</strong>gtime models found to be effective on a<br />
regional scale<br />
� to fit a new unified model for European temperate tree species<br />
� to develop a new pollen shedd<strong>in</strong>g model for the ma<strong>in</strong> allergenic taxa <strong>in</strong> different European regions<br />
� to study phenological shifts <strong>and</strong> changed gradients <strong>in</strong> the Alps<br />
76
LIGHT AS A FACTOR AFFECTING THE FRUIT PHENOLOGY OF ATLANTIC<br />
RAIN FOREST TREES: A CASE STUDY OF CRYPTOCARYA MOSCHATA<br />
(LAURACEAE)<br />
(1) P. Moraes <strong>and</strong> (2) L.P.C. Morellato<br />
(1) Centro de Energia Nuclear na Agricultura – CENA, Piracicaba, SP – BRAZIL; (2) Departamento de<br />
Botânica, Universidade Estadual Paulista, Rio Claro, SP – BRAZIL.<br />
pmorella@rc.unesp.br<br />
Fruit<strong>in</strong>g patterns of animal-dispersed tropical forest trees have been regarded as aseasonal or not very<br />
seasonal <strong>and</strong> closely related to the presence of seed dispersers, although some factors as high humidity <strong>and</strong><br />
mild temperatures would enhance fruit development <strong>and</strong> maturation. Recent studies have presented some<br />
evidence support<strong>in</strong>g the importance of light for regulat<strong>in</strong>g phenological patterns of tropical plants, specially<br />
flower<strong>in</strong>g. We performed a the time series analysis of 8 years of fruit<strong>in</strong>g phenological data from an animaldispersed<br />
tropical tree characteristic from Brazilian Atlantic ra<strong>in</strong> forest (ARF), Cryptocaria moschata<br />
(Lauraceae). So far, this is the longest data series for ARF trees we know. The analyses revealed that the<br />
model with day length is the best fit <strong>and</strong> expla<strong>in</strong> about 79% of the variability of ripe fruit data, while unripe<br />
fruit is l<strong>in</strong>early related to mean temperature. We demonstrate the <strong>in</strong>fluence of climatic variables, specially<br />
light, determ<strong>in</strong><strong>in</strong>g the fruit<strong>in</strong>g pattern of an animal-dispersed tree under a ratter aseasonal climate. The<br />
regularity of fruit<strong>in</strong>g patterns is important to def<strong>in</strong>e a species as predicted food resource to frugivores <strong>and</strong><br />
seed dispersers. [F<strong>in</strong>ancial Support by FAPESP – CNPq Research fellowship]<br />
FLOWERING AND FRUITING PHENOLOGY IN ATLANTIC RAIN FOREST<br />
MYRTACEAE OF BRAZIL: CLIMATIC AND PHYLOGENETIC CONSTRAINTS<br />
L.P.C. Morellato (1)<br />
(1) Departamento de Botânica, Universidade Estadual Paulista, Rio Claro, SP - BRAZIL<br />
pmorella@rc.unesp.br<br />
Phenological studies on tropical forests have traditionally focused on diverse taxonomic groups of species,<br />
try<strong>in</strong>g to <strong>in</strong>vestigate biotic <strong>and</strong> abiotic factors affect<strong>in</strong>g the phenological patterns observed. Few studies have<br />
tried to exam<strong>in</strong>e the evolutionary <strong>and</strong> ecological constra<strong>in</strong>ts on the phenological patterns of species with<strong>in</strong> a<br />
s<strong>in</strong>gle family or genus. The Myrtaceae is one of the most important families <strong>in</strong> Brazil, <strong>and</strong> often the<br />
dom<strong>in</strong>ant family <strong>in</strong> the Atlantic forest. We analyze <strong>and</strong> discuss the phenology of Myrtaceae species from<br />
two different sites of Atlantic ra<strong>in</strong> forest <strong>in</strong> the light of the current hypothesis that have been proposed to<br />
expla<strong>in</strong> flower<strong>in</strong>g <strong>and</strong> fruit<strong>in</strong>g pattern of taxonomically-related species. We explore these hypotheses as<br />
explanations for flower<strong>in</strong>g <strong>and</strong> fruit<strong>in</strong>g phenology of Myrtaceae species from Atlantic ra<strong>in</strong> forest, where<br />
climatic constra<strong>in</strong>ts would not seem to impose restrictions to their phenological behavior. [F<strong>in</strong>ancial Support<br />
by FAPESP – CNPq Research fellowship]<br />
77
ESTONIAN ICHTYOPHENOLOGICAL CALENDAR AS SOURCE FOR<br />
CLIMATE CHANGE STUDIES<br />
V. Palm<br />
Institute of Geography, University of Tartu, Estonia<br />
vellop@ut.ee<br />
Ichtyophenology <strong>in</strong>vestigates seasonal changes <strong>in</strong> behaviour of fishes – arrival to spawn, spawn<strong>in</strong>g,<br />
migrations etc. In Estonia, the ichtyophenological observations are carried out from the 1951. The observers<br />
are trustees of Estonian Naturalists’ Society. Over 500 phenophases (about 60 fish species) are observed <strong>in</strong><br />
368 observation posts (on rivers, lakes <strong>and</strong> the Baltic Sea, part of Estonia). <strong>Data</strong> have very many gaps,<br />
therefore the data analysis is very difficult. There are only 113 long time-series (over 20 years), mostly<br />
consist<strong>in</strong>g of hydrological characteristics (ice drift, flood).<br />
There are three observation posts with long time-series of ichtyophenophases - Tori (river Pärnu, south-west<br />
of Estonia), the small lake Vagula (south of Estonia) <strong>and</strong> the great lake Peipsi (east of Estonia). In rivers, the<br />
first phases are the beg<strong>in</strong> <strong>and</strong> the end of ice drift (<strong>in</strong> March or April). The another phases become evident<br />
after ice drift. In lakes, on the contrary, often the first phases are ichtyophenophases. The ice drift beg<strong>in</strong>s<br />
later. Fishes spawn speeder <strong>in</strong> rivers as <strong>in</strong> lakes. For example, <strong>in</strong> Tori the first spawn<strong>in</strong>g of pike cont<strong>in</strong>ues 3,<br />
<strong>in</strong> Vagula 10 <strong>and</strong> <strong>in</strong> Vilusi 15 days. Differences are caused by greatness <strong>and</strong> depth of lakes. Great <strong>and</strong> deep<br />
lakes become warm slower. The first spawn of pike beg<strong>in</strong>s on 9 th April <strong>in</strong> Vagula <strong>and</strong> on 14 th April <strong>in</strong> Vilusi.<br />
Differences <strong>in</strong> territorial variability are determ<strong>in</strong>ed by conditions of nature. In the early spr<strong>in</strong>g (March,<br />
April), the sea is warmer as the l<strong>and</strong> <strong>and</strong> phenophases are the earliest at the sea (west of Estonia). In April,<br />
May <strong>and</strong> June the l<strong>and</strong> becomes warm speeder as the sea, <strong>and</strong> phenophases are the latest at the sea. The<br />
phenophases are the earliest <strong>in</strong> south-east of Estonia. For example, the two regions with the earliest arrival of<br />
phenophases are exist<strong>in</strong>g by beg<strong>in</strong> of the first spawn<strong>in</strong>g of pike. It is that the pike spawns on the boundary of<br />
two seasons. The spawn<strong>in</strong>g of thermophilic bream is more homogenous - on the diagonal from south-east of<br />
Estonia to north-west (to the sea).<br />
The effect of climate changes to phenophases is different. The phenophases can become evident yearly very<br />
differently. Trends of the observation period (<strong>in</strong> Tori, Vagula <strong>and</strong> Vilusi) <strong>in</strong>digate that phenophases of early<br />
spr<strong>in</strong>g (ice drift, the first spawn<strong>in</strong>g of pike) go to earlier, <strong>and</strong> phenophases of later spr<strong>in</strong>g (the first spawn<strong>in</strong>g<br />
of bream) go to later. There is also an effect of the last ten warm w<strong>in</strong>ters <strong>in</strong> Estonia. Changes <strong>in</strong> appearance<br />
of phenophases <strong>in</strong> the observation period stretch to two weeks. Lakes (Tori) have greater changes as rivers<br />
(Vagula, Vilusi).<br />
78
USE OF PHENOLOGY IN AGRICULTURE<br />
Th. Roetzer (1,2), H. Häckel, R (2), Würländer (3)<br />
(1) Humboldt-University Berl<strong>in</strong>, Section of Agricultural Meteorology, Berl<strong>in</strong>,Germany<br />
(2) German Weather Service, Weihenstephan, Germany<br />
(3) TU Munich, Chair of Photogrammetry <strong>and</strong> Remote Sens<strong>in</strong>g, Germany<br />
thomas.roetzer@rz.hu-berl<strong>in</strong>.de / Fax: +49-30-31471211<br />
The Environmental <strong>and</strong> Agroclimatological atlas of Bavaria forms a base for plan<strong>in</strong>g, consult<strong>in</strong>g <strong>and</strong><br />
research <strong>in</strong> agriculture, forestry, l<strong>and</strong>scap<strong>in</strong>g <strong>and</strong> ecology. In 25 tables, 157 illustrations <strong>and</strong> 103 maps the<br />
atlas treats the themes phenology, water balance, grassl<strong>and</strong> grow<strong>in</strong>g, risk of late frost damage, climatological<br />
suitability for grow<strong>in</strong>g crops, plant diseases <strong>and</strong> pests as well as production <strong>and</strong> yield. Expla<strong>in</strong><strong>in</strong>g<br />
commentaries for every chapter <strong>and</strong> methods of <strong>in</strong>vestigation complete the atlas.<br />
<strong>Phenology</strong> is one of the ma<strong>in</strong> subjects <strong>in</strong> the atlas. In addition, phenological data are needed for most of the<br />
other themes:<br />
• For calculat<strong>in</strong>g the water balance of crops phenology is needed because crops require specific water<br />
amounts accord<strong>in</strong>g to their phenological phases.<br />
• The risk of late frost damages of crops or fruit trees can be determ<strong>in</strong>ed with the help of phenology.<br />
• In order to map climatological suitability for grow<strong>in</strong>g crops, phenological data are often needed.<br />
Depend<strong>in</strong>g on the phenological phases crops have specific climatic requirements.<br />
• Phenological data are also usesful when comput<strong>in</strong>g climatic risks of plant diseases <strong>and</strong> pests affect<strong>in</strong>g<br />
crops.<br />
These are a few examples where <strong>and</strong> how phenological data are needed <strong>in</strong> agriculture. At the conference<br />
examples of the use of phenology <strong>in</strong> agriculture will be presented for every subject mentioned above.<br />
E.g. figure 1 shows the risk of a late frost damage of the flowers of different fruit trees.<br />
Fig.1: Percentage of frost<br />
damage of peach, apple <strong>and</strong><br />
cherry <strong>in</strong> 4 South German<br />
sites averaged over the years<br />
1961-1990<br />
Depend<strong>in</strong>g on site <strong>and</strong> plant species the percentage of a late frost damage of the flowers ranges from 0% for<br />
apple <strong>in</strong> München-Riem <strong>and</strong> Metten up to 47 % for peach <strong>in</strong> München-Riem<br />
79
DETECTING OUTLIERS IN LARGE PHENOLOGICAL DATA SETS<br />
J. Schaber <strong>and</strong> F. Badeck<br />
Potsdam Institute of Climate Impact Research, Potsdam, Germany<br />
schaber@pik-potsdam.de / FAX: ++49-331-288-2695<br />
A method is proposed to detect month-mistakes <strong>in</strong> large phenological datasets over a wide geographical<br />
region. It is based on the theory that the superposition of <strong>in</strong>terstational <strong>and</strong> <strong>in</strong>terannual variablility can<br />
expla<strong>in</strong> a substantial fraction of the deviation of an observation from the overall average. The procedure is<br />
stable with respect to the vary<strong>in</strong>g number of observations at the stations <strong>and</strong> non normal distributions<br />
compared to classical outliers tests. The procedure def<strong>in</strong>es an objective theory-based reference po<strong>in</strong>t <strong>and</strong><br />
plausability range of phenological observations rather than an arbitrary statistical threshold. It is applied to<br />
time series of the German Weather Service (DWD) for beech (Fagus sylavtica), birch (Betula pendula) <strong>and</strong><br />
spruce (Picea abies). The results are compared with the orig<strong>in</strong>al observer’s report sheets. The <strong>in</strong>fluence of<br />
outlier omitt<strong>in</strong>g strategies on phenological model validation <strong>and</strong> fitt<strong>in</strong>g is demonstrated.<br />
ANALYSIS AND APPLICATION OF PHENOLOGY MODELS TO DATA OF THE<br />
GERMAN WEATHER SERVICE (DWD)<br />
J. Schaber<br />
Potsdam Institute of Climate Impact Research, Potsdam, Germany<br />
schaber@pik-potsdam.de / FAX: ++49-331-288-2695<br />
Phenological models consider<strong>in</strong>g temperature sums <strong>and</strong> chill<strong>in</strong>g requirements were applied to bud burst<br />
observations of beech (Fagus sylvatica), horse chestnut (Aesculus hippocastanum) <strong>and</strong> p<strong>in</strong>e (P<strong>in</strong>us<br />
sylvestris) at 115 stations of the DWD all over Germany where weather <strong>in</strong>formation was available. The<br />
temperature sum analysis shows that the period around one month before bud burst strongly <strong>in</strong>fluences the<br />
day of bud burst but does not suffice to expla<strong>in</strong> its large variation. The temperature sum models comb<strong>in</strong>ed<br />
with chill<strong>in</strong>g tend to overestimate early observations <strong>and</strong> underestimate late observations, i.e. are not able to<br />
cover the whole range of observed bud burst. The results obta<strong>in</strong>ed differ from the application of the same<br />
models to other phenological data sets <strong>in</strong> earlier studies. This shows the difficulty of f<strong>in</strong>d<strong>in</strong>g robust generally<br />
applicable phenological models for European tree species.<br />
80
INTERACTION BETWEEN AGROMETEOROLOGICAL PATTERN AND<br />
PHENOLOGY IN BAROLO WINE AREA<br />
F. Spanna (1) C. Lovisolo (2),<br />
(1) Regione Piemonte - Settore Fitosanitario regionale, (2) Dipartimento di Colture Arboree, Università di<br />
Tor<strong>in</strong>o<br />
ufficio.agrometeo@regione.piemonte.it<br />
The research was addressed to characterize the phenological behaviour of Nebbiolo grapev<strong>in</strong>e <strong>in</strong> a w<strong>in</strong>e<br />
area located <strong>in</strong> northern-western Italy (Cuneo Prov<strong>in</strong>ce, Piedmont). The w<strong>in</strong>e produced is named Barolo, as<br />
the zone of provenience, <strong>and</strong> is one of the most appreciated w<strong>in</strong>es of Piedmont <strong>in</strong> the world.<br />
A project of characterization of grapev<strong>in</strong>e <strong>and</strong> w<strong>in</strong>e productions <strong>in</strong> the Barolo area was carried out dur<strong>in</strong>g<br />
the period 1994-1996; dur<strong>in</strong>g these three years field studies on the aspects of climate, phenology <strong>and</strong> quality<br />
<strong>and</strong> quantity of the production were assessed. Afterwards, all these aspects were correlated to underst<strong>and</strong><br />
the v<strong>in</strong>e behaviour <strong>and</strong> to identify, eventually, some sub-areas or significant differences among the w<strong>in</strong>es.<br />
From 1994 to 1996, climatic data were measured us<strong>in</strong>g meteorological stations <strong>in</strong>stalled <strong>in</strong> experimental<br />
v<strong>in</strong>eyards <strong>and</strong>, <strong>in</strong> the meantime phenological data were determ<strong>in</strong>ed follow<strong>in</strong>g Baggiol<strong>in</strong>i stages. On<br />
September <strong>and</strong> October the must analysis (pH, total acidity, sugar content) <strong>and</strong> the productive parameters<br />
(number <strong>and</strong> weight of clusters per v<strong>in</strong>e) were carried out.<br />
To correlate climatic <strong>and</strong> phenological <strong>and</strong> productive data some bio-climatic <strong>in</strong>dexes were used with<br />
different base temperatures <strong>and</strong> us<strong>in</strong>g different start<strong>in</strong>g dates.<br />
A set of bio-climatic <strong>in</strong>dexes to characterize vegetative v<strong>in</strong>e growth <strong>and</strong> productive performances <strong>in</strong> Barolo<br />
area is proposed.<br />
81
WINTER CLIMATE AND FLOWER BUD MORTALITY OF SOUR CHERRY<br />
(PRUNUS CERASUS)<br />
T.B. Toldam-Andersen, I. Dencker, P. Braun<br />
Royal Veter<strong>in</strong>ary <strong>and</strong> Agricultural University, Dept. of Agric. Sci., Agrovej 10, 2630 Taastrup, Denmark,<br />
id@kvl.dk<br />
Sour cherry for <strong>in</strong>dustrial use is an important tree fruit crop <strong>in</strong> Denmark, <strong>and</strong> clonal selections of the old<br />
Danish sour cherry cultivar called ‘Stevnsbær’ strongly dom<strong>in</strong>ate the commercial orchards. Dur<strong>in</strong>g the last<br />
decade a reduced fruit-set ability <strong>and</strong> low total yields have been observed for this cultivar. The reasons for<br />
the yield decl<strong>in</strong>e are not known, but the negative effects of fluctuat<strong>in</strong>g w<strong>in</strong>ter temperatures on flower bud<br />
survival are suspected to have a major role. Bud dissections were set out <strong>in</strong> the early 1990s to <strong>in</strong>vestigate the<br />
floral mortality rates, the development of flower necrosis <strong>and</strong> their relations with frost periods dur<strong>in</strong>g endo<strong>and</strong><br />
ecodormancy. In this study data are reported from the w<strong>in</strong>ters 1994-95 <strong>and</strong> 1999-2000. Buds were<br />
collected from five years old ‘Stevnsbær’ populations <strong>and</strong> from three year old potted trees. The potted trees<br />
were w<strong>in</strong>tered at either +4 o C or <strong>in</strong> the field on the same location as the old populations. Buds were dissected<br />
under a stereo-microscope <strong>and</strong> the necrosis of different flower parts were recorded. Both of the w<strong>in</strong>ters<br />
1994-95 <strong>and</strong> 1999-2000 had high average temperatures <strong>and</strong> brief freez<strong>in</strong>g periods. The lowest recorded<br />
m<strong>in</strong>imum temperature was –12,1 °C (hourly means). Still, major bud damages occurred. In February-March<br />
1995, flower mortality was close to only 10 per cent, but after a 4,7 freeze <strong>in</strong> late March, more than six<br />
weeks before anthesis, stigma damages <strong>in</strong>creased the mortality percentage to 40. In 1999, a cold night with a<br />
m<strong>in</strong>imum temperature of –9,0 °C was recorded <strong>in</strong> the middle of December. On January 10, a flower bud<br />
mortality of 44 per cent had developed <strong>in</strong> the 5-year-old trees. In the potted trees, the flower mortality was<br />
86 per cent <strong>in</strong> a sample from January 20, whereas potted trees w<strong>in</strong>tered at +4 only had 8 per cent damaged<br />
flowers. It is concluded, that Prunus cerasus cv ‘Stevnsbær’ suffers severely from floral bud <strong>in</strong>juries dur<strong>in</strong>g<br />
mild w<strong>in</strong>ters. It is suggested that frost damage is the pr<strong>in</strong>cipal cause of the observed floral mortality, <strong>and</strong><br />
especially low temperatures occurr<strong>in</strong>g after warm w<strong>in</strong>ter periods may be critical.<br />
82
DETECTION OF THE ARRIVAL DATE OF MIGRATING BIRDS IS DENSITY-<br />
DEPENDENT: A CASE STUDY OF THE RED-BACKED SHRIKE LANIUS<br />
COLLURIO<br />
P. Tryjanowski<br />
Department of Avian Biology & Ecology, Poznañ, Pol<strong>and</strong><br />
ptasiek@ma<strong>in</strong>.amu.edu.pl/Fax: +48-61-8523615<br />
The tim<strong>in</strong>g of when birds return to their breed<strong>in</strong>g area is a key factor <strong>in</strong> studies of the impact of climate<br />
change upon bird populations. However, many current analyses do not consider the problems associated<br />
with density-dependent processes. These should impact on the detection of bird arrival time through (1)<br />
higher probability of observ<strong>in</strong>g earlier arrival when population size is bigger, (2) <strong>in</strong>creased song activity of<br />
birds relative to population size <strong>and</strong> hence earlier observation.<br />
As a case study, I have analysed data from 1983-2000 of the Red-backed Shrike collected <strong>in</strong> Western<br />
Pol<strong>and</strong>. Dur<strong>in</strong>g this period the Red-backed Shrike’s return to breed<strong>in</strong>g sites was significantly earlier (r=-<br />
0.614, p=0.007), <strong>and</strong> contemporary population size <strong>in</strong>creased significantly (r=0.750, p=0.001). I obta<strong>in</strong>ed a<br />
significant negative correlation between arrival date <strong>and</strong> population size (r=-0.723, p=0.001). To give greater<br />
confidence <strong>in</strong> the validity of this correlation, I also worked on st<strong>and</strong>ardised residuals of arrival time <strong>and</strong><br />
population size on years, after elim<strong>in</strong>at<strong>in</strong>g a l<strong>in</strong>ear trend. Correlation between residuals was still significantly<br />
negative (r=-0.503, p=0.033), further support<strong>in</strong>g the l<strong>in</strong>k between arrival detection <strong>and</strong> population size.<br />
This f<strong>in</strong>d<strong>in</strong>g suggests that, <strong>in</strong> studies of avian migration <strong>and</strong> its changes over time, the relationship between<br />
arrival date <strong>and</strong> population size should be considered <strong>in</strong> analyses.<br />
This study was f<strong>in</strong>ancially supported by UAM grant no. 517 00 001.<br />
RECENT CHANGES IN NEST TIMING OF THE RED-BACKED SHRIKE<br />
LANIUS COLLURIO IN POLAND<br />
P. Tryjanowski (1), S. Kuzniak (1), T.H. Sparks (2)<br />
(1) Department of Avian Biology & Ecology, Adam Mickiewicz University, Poznañ, Pol<strong>and</strong>, (2) Centre<br />
for Ecology <strong>and</strong> Hydrology, Monks Wood, UK<br />
ptasiek@ma<strong>in</strong>.amu.edu.pl/Fax: +48-61-8523615<br />
Over a 29 year observation period (1971-1999) the tim<strong>in</strong>g <strong>and</strong> performance of 289 nests of the red-backed<br />
shrike Lanius collurio was recorded <strong>in</strong> western Pol<strong>and</strong>. Nest tim<strong>in</strong>g was recorded <strong>in</strong> 5 day periods (pentads),<br />
<strong>and</strong> the number of eggs, egg dimensions, number of hatchl<strong>in</strong>gs <strong>and</strong> number of fledgl<strong>in</strong>gs were recorded.<br />
Separat<strong>in</strong>g the effects of trends through time <strong>and</strong> changes <strong>in</strong> number of nests (record<strong>in</strong>g <strong>in</strong>tensity) <strong>in</strong> each<br />
year are difficult to achieve but some trends <strong>and</strong> patterns are apparent. Dur<strong>in</strong>g this period there was a<br />
tendency for earlier nest<strong>in</strong>g <strong>and</strong> this pattern was associated with larger clutches with smaller eggs <strong>and</strong> lower<br />
fledgl<strong>in</strong>g success.<br />
The implications of earlier nest<strong>in</strong>g as a consequence of climate warm<strong>in</strong>g on the population of this decl<strong>in</strong><strong>in</strong>g<br />
species are discussed.<br />
This study was f<strong>in</strong>ancially supported by UAM grant no. 517 00 001.<br />
EUROPEAN PHENOLOGY NETWORK – A NETWORK FOR INCREASING<br />
EFFICIENCY, ADDED VALUE AND USE OF PHENOLOGICAL MONITORING<br />
RESEARCH, AND DATA IN EUROPE<br />
A. J.H. van Vliet, R. S. de Groot<br />
Environmental Systems <strong>Analysis</strong> Group, Wagen<strong>in</strong>gen University, The Netherl<strong>and</strong>s<br />
83
arnold.vanvliet@algemeen.cmkw.wau.nl / Tel: +31 317 485091<br />
(see page 29)<br />
PHENOLOGICAL MODIFICATION IN PLANTS BY SOIL FACTORS<br />
F.E. Wielgolaski<br />
Department of Biology, Division of Botany <strong>and</strong> Plant Physiology, University of Oslo, Norway<br />
f.e.wielgolaski@bio.uio.no /Fax: +47-22854664<br />
Various mechanical <strong>and</strong> physical soil analyses are carried out <strong>in</strong> addition to weather observations through<br />
three years at severals sites along an oceanic-cont<strong>in</strong>ental gradient <strong>in</strong> a fjord district <strong>in</strong> western Norway. All<br />
the environmental factors observed are correlated with earlier <strong>and</strong> a few late season phenophases of many<br />
native <strong>and</strong> cultivated woody plants <strong>and</strong> some herbs by simple, l<strong>in</strong>ear correlations <strong>and</strong> by stepwise multiple<br />
<strong>and</strong> partial analyses. It is tried to elim<strong>in</strong>ate many <strong>in</strong>tercorrelations between various environmental factors by<br />
different techniques.<br />
As expected air temperature measurements <strong>in</strong> nearly all analyses from these temperate region districts gave<br />
the most significant correlations with phenology of the plants; the temperature dur<strong>in</strong>g night generally be<strong>in</strong>g<br />
the most important <strong>in</strong> ma<strong>in</strong>ly vegetative periods, e.g. to budbreak <strong>in</strong> spr<strong>in</strong>g, <strong>and</strong> the temperature dur<strong>in</strong>g day<br />
<strong>in</strong> more generative phases, as e.g. the period between budbreak <strong>and</strong> flower<strong>in</strong>g. The other environmental<br />
factors, however, showed strong variation <strong>in</strong> correlation significance with the various species studied <strong>and</strong><br />
also with different phenophases of the same species. Various hypotheses are put forward as reasons for such<br />
variation. Air humidity (<strong>in</strong>clud<strong>in</strong>g precipitation) <strong>and</strong> /or soil moisture (<strong>in</strong>clud<strong>in</strong>g parameters <strong>in</strong>tercorrelated<br />
with it, e.g. soil gra<strong>in</strong> size <strong>and</strong> bulk density) seemed to be factors relatively often found to be of importance.<br />
In the stepwise multiple analyses for budbreak of birch (Betula pubescens, for <strong>in</strong>stance the amount of<br />
precipitation was the second factor to enter the analyses by a positive correlation with the developmental<br />
rate, after the most important factor, the night temperature. Positive correlations with a high clay content <strong>and</strong><br />
bulk density <strong>in</strong> the soil <strong>in</strong>dicated that also a high soil moisture is favourable for early bud break <strong>in</strong> birch.<br />
Other phenophases that seemed to be favoured by a good water supply were leaf budbreak of bird cherry<br />
(Prunus padus) <strong>and</strong> rowan (Sorbus aucuparia), <strong>and</strong> flower<strong>in</strong>g of hazel (Corylus avellana), common lilac<br />
(Syr<strong>in</strong>ga vulgaris), plum (’Victoria’) <strong>and</strong> currant (’Red Dutch’), to some degree also of goat willow (Salix<br />
caprea). Chemical soil analyses (both P, K. Mg <strong>and</strong> Ca) often showed negative correlations with the<br />
developmental rate, particularly of earlier phenophases of both native <strong>and</strong> cultivated plants (except for apple<br />
’Gravenste<strong>in</strong>’ <strong>and</strong> pear ’Moltke’), may be <strong>in</strong>dicat<strong>in</strong>g that a high nutrient level delayed the plant<br />
development. Similar explanation might be given for the observation that high pH <strong>in</strong> the soil often seemed to<br />
delay the plant development (leaf budbreak of Betula, Sorbus, Syr<strong>in</strong>ga <strong>and</strong> plum, <strong>and</strong> flower<strong>in</strong>g of Corylus,<br />
bluebell (Campanula rotundifolia) <strong>and</strong> red currant). There seemed to be a tendency that plants be<strong>in</strong>g<br />
particularly dependent of warm weather for leaf budbreak, e.g. ash (Frax<strong>in</strong>us excelsior, <strong>and</strong> flower<strong>in</strong>g, e.g.<br />
Prunus, pear, apple <strong>and</strong> to some degree also raspberry (’Preussen’), accord<strong>in</strong>g to the analyses, were less<br />
dependent of other environmental factors for their development. For <strong>in</strong>stance, if there were any effects of<br />
water for these plants, they were negative for moisture <strong>and</strong> soil factors <strong>in</strong>tercorrelated with water.<br />
84
LIST OF PARTICIPANTS<br />
Anto Aasa<br />
University of Tartu<br />
Institute of Geography,<br />
Vanemuise st. 46, Tartu, Estonia, 51014<br />
antoa@ut.ee<br />
Re<strong>in</strong> Ahas<br />
University of Tartu<br />
Institute of Geography<br />
Vanemuise st. 46, Tartu, Estonia, 51014<br />
re<strong>in</strong>a@ut.ee<br />
Valery Barcan<br />
Lapl<strong>and</strong> Biosphere Reserve<br />
Zeleny, 8, 184505 Monchegorsk,<br />
Murmansk prov<strong>in</strong>ce, Russia<br />
lapl<strong>and</strong>@monch.mels.ru<br />
Elisabeth G. Beaubien<br />
University of Alberta,<br />
Devonian Botanic Garden, Edmonton,<br />
Alberta, Canada, T6J 1Z1<br />
e.beaubien@ualberta.ca<br />
Egbert Beuker<br />
F<strong>in</strong>nish Forest Research Institute<br />
Punkaharju Research Station<br />
F<strong>in</strong>l<strong>and</strong>iantie 18, FIN-58450 Punkaharju,<br />
F<strong>in</strong>l<strong>and</strong><br />
egbert.beuker@metla.fi<br />
Alberte Bondeau<br />
Potsdam-Institut für<br />
Klimafolgenforschung<br />
Postfach 60 12 03, 14412 Potsdam,<br />
Germany<br />
alberte.bondeau@pik-potsdam.de<br />
Lucio Botarelli<br />
S.M.R. - ARPA<br />
Emilia Romagna Viale Silvani 6, 40122<br />
Bologna, Italy<br />
L.Botarelli@smr.arpa.emr.it<br />
Olga Braslavska<br />
Slovak Hydrometeorological Institute<br />
Zelena 5, 97590 Banska Bystrica, Slovak<br />
Repubic<br />
olga@hmubbsco.shmu.sk<br />
Peter Braun<br />
Royal Veter<strong>in</strong>ary <strong>and</strong> Agricultural<br />
University<br />
Dept. of Agric. Sci., Sect. Horticulture,<br />
Agrovej 10, DK-2630 Taastrup, Denmark<br />
PBR@KVL.DK<br />
Robert Brügger<br />
University of Bern<br />
Department of Geography<br />
Hallerstrasse 12, 3012 Bern, Switzerl<strong>and</strong><br />
bruegger@giub.unibe.ch<br />
Ekko Bruns<br />
Deutscher Wetterdienst<br />
Kaiserleistrasse 42, 63067 Offenbach,<br />
Germany<br />
ekko.bruns@dwd.de<br />
N. Bulyg<strong>in</strong><br />
Forestry Academy of St Petersburg<br />
PO Box 64, St Petersburg, Russia 194295<br />
Xiaoqiu Chen<br />
Pek<strong>in</strong>g University<br />
Dept. of Urban <strong>and</strong> Environmental<br />
Science Dept. of Urban <strong>and</strong><br />
Environmental Science<br />
Beij<strong>in</strong>g 100871, P.R. Ch<strong>in</strong>a<br />
cxq@urban.pku.edu.cn<br />
Frank-M. Chmielewski<br />
Humboldt-University Berl<strong>in</strong><br />
Institute of Crop Sciences, Section of<br />
Agricultural Meteorology<br />
Albrecht-Thaer-Weg 5, 14195 Berl<strong>in</strong>,<br />
Germany<br />
chmielew@agrar.hu-berl<strong>in</strong>.de<br />
87
Isabelle Chu<strong>in</strong>e<br />
Université Montpellier 2<br />
ISEM<br />
case 61, place E. Bataillon, 34095<br />
Montpellier cedex 5, France<br />
chu<strong>in</strong>e@isem.univ-montp2.fr<br />
Zalika Crep<strong>in</strong>sek<br />
University of Ljubljana<br />
Biotechnical Faculty, Agronomy<br />
Department<br />
Jamnikarjeva 101, 1000 Ljubljana,<br />
Slovenia<br />
zalika.crep<strong>in</strong>sek@bf.uni-lj.si<br />
Claudio Defila<br />
MeteoSchweiz<br />
Krähbühlstr. 58, 8044 Zürich, Switzerl<strong>and</strong><br />
claudio.defila@meteoschweiz.ch<br />
Noranne Ellis<br />
Scottish Natural Heritage<br />
Anderson Place, Ed<strong>in</strong>burgh, EH6 5NP,<br />
UK<br />
noranne.ellis@snh.gov.uk<br />
Melissa J. Else<br />
IACR Rothamsted<br />
Entomology Dept.<br />
West Common, Harpenden, Herts AL5<br />
2JQ, UK<br />
melissa.else@bbsrc.ac.uk<br />
Nicole Estrella<br />
TU Munich<br />
Department of Ecology<br />
Am Hochanger 13, D-85 354 Freis<strong>in</strong>g,<br />
Germany<br />
estrella@met.forst.tu-muenchen.de<br />
Peter Fabian<br />
TU Munich<br />
Department of Ecology<br />
Am Hochanger 13, D-85 354 Freis<strong>in</strong>g,<br />
Germany<br />
fabian@met.forst.tu-muenchen.de<br />
88<br />
Ana Maria Faggi<br />
Centro de Estudios Farmacologicos y<br />
Bonaticos<br />
Serrano 669, 1414 Buenos Aires,<br />
Argent<strong>in</strong>ia<br />
amfaggi@mpero.cyt.edu.ar OR<br />
afaggi@uflo.edu.ar<br />
Violeta G Fedotova<br />
Russian Academy of Sciences<br />
Phenological Commission<br />
Botanical Institue, , Russian Geographical<br />
Society,<br />
Preul. Grivtsova 10, 190 000 St.<br />
Petersburg, Russia<br />
Alex Gilyazov<br />
Lapl<strong>and</strong> Biosphere Reserve<br />
Zeleny, 8 , 184505 Monchegorsk,<br />
Murmansk prov<strong>in</strong>ce, Russia<br />
lapl<strong>and</strong>@monch.mels.ru<br />
Anders Kay Gormsen<br />
The Royal Veter<strong>in</strong>ary <strong>and</strong> Agricultural<br />
University<br />
Department of Agricultural Sciences,<br />
Sect. Horticulture,<br />
Agrovej 10, DK-2630 Taastrup, Denmark<br />
akg@kvl.dk<br />
Risto Häkk<strong>in</strong>en<br />
F<strong>in</strong>nish Forest Research Institute<br />
Union<strong>in</strong>katu 40 A, FIN-00170 Hels<strong>in</strong>ki,<br />
F<strong>in</strong>l<strong>and</strong><br />
risto.hakk<strong>in</strong>en@metla.fi<br />
Michaela-Maria Hirschberg<br />
TU Munich<br />
Department of Ecology<br />
Am Hochanger 13, D-85 354 Freis<strong>in</strong>g,<br />
Germany<br />
hirschberg@met.forst.tu-muenchen.de<br />
David W. Inouye<br />
University of Maryl<strong>and</strong><br />
Department of Biology<br />
College Park, MD 20742 USA<br />
di5@umail.umd.edu
François Jeanneret<br />
University of Bern<br />
Department of Geography<br />
Hallerstrasse 12, 3012 Bern, Switzerl<strong>and</strong><br />
jeanneret@sis.unibe.ch<br />
Amélie CR Kirchgäßner<br />
University of Freiburg<br />
Meteorological Institute<br />
Werderr<strong>in</strong>g 10, 79085 Freiburg, Germany<br />
kirchgam@uni-freiburg.de<br />
Dag Klaveness<br />
University of Oslo<br />
Department of Biology<br />
P. P. Box 1066 Bl<strong>in</strong>dern, 0316 Oslo,<br />
Norway<br />
dag.klaveness@bio.uio.no<br />
Elisabeth Koch<br />
Zentralanstalt für Meteorologie und<br />
Geodynamik<br />
Hohe Warte 38, 1190 Wien, Austria<br />
e.koch@zamg.ac.at<br />
Koen Kramer<br />
Alterra Institute<br />
Department of Ecology <strong>and</strong> Environment<br />
P.O.Box 23, NL-6700 AA Wagen<strong>in</strong>gen,<br />
The Netherl<strong>and</strong>s<br />
k.kramer@alterra.wag-ur.nl<br />
Esa L Lehiko<strong>in</strong>en<br />
University of Turku<br />
Department of Biology<br />
FIN 20014 Turku, F<strong>in</strong>l<strong>and</strong><br />
esalehi@utu.fi<br />
Tapio L<strong>in</strong>kosalo<br />
University of Hels<strong>in</strong>ki<br />
Department of Forest Ecology<br />
P.O. Box 24, FIN-00014 Hels<strong>in</strong>ki, F<strong>in</strong>l<strong>and</strong><br />
tapio.l<strong>in</strong>kosalo@hels<strong>in</strong>ki.fi<br />
Wolfgang J. Lipa<br />
Zentralanstalt für Meteorologie und<br />
Geodynamik<br />
Hohe Warte 38, 1190 Wien, Austria<br />
lipa@zamg.ac.at<br />
Jesse A. Logan<br />
USDA Forest Service<br />
Logan Forestry Sciences Laboratory<br />
860 N 1200 East, Logan, UT 84321, USA<br />
jlogan@cc.usu.edu<br />
Wolfgang Lucht<br />
Potsdam-Institut für<br />
Klimafolgenforschung<br />
Postfach 60 12 03, D-14412 Potsdam,<br />
Germany<br />
Wolfgang.Lucht@pik-potsdam.de<br />
Annette Menzel<br />
TU Munich<br />
Department of Ecology<br />
Am Hochanger 13, D-85 354 Freis<strong>in</strong>g,<br />
Germany<br />
menzel@met.forst.tu-muenchen.de<br />
Patricia Morellato<br />
Universidade Estadual Paulista - UNESP<br />
Departamento de Botanica<br />
C. P. 199, 13506-900 Rio Clara, SP,<br />
Brazil<br />
pmorella@rc.unesp.br<br />
Markus Müller<br />
University of Bonn<br />
Institut für Obstbau und Gemüsebau<br />
Auf dem Hügel 6, 53121 Bonn, Germany<br />
GefaG@t-onl<strong>in</strong>e.de<br />
Gerhard Müller-Westermeier<br />
Deutscher Wetterdienst<br />
Abteilung Klima und Umwelt<br />
Kaiserleistrasse 44, 63067 Offenbach,<br />
Germany<br />
gerhard.mueller-westermeier@dwd.de<br />
Jiri Nekovar<br />
Czech Hdyrometeorological Institute<br />
Na Sabatce 17, 14306 Prag 4, Czech<br />
Republic<br />
jiri.nekovar@chmi.cz<br />
89
Vello Palm<br />
University of Tartu<br />
Institute of Geography<br />
Vanemuise 46, Tartu 51014, Estonia<br />
vellop@ut.ee<br />
Teja Preuhsler<br />
Bavarian State Institute of Forestry<br />
Am Hochanger 11, 85354 Freis<strong>in</strong>g,<br />
Germany<br />
pre@lwf.uni-muenchen.de<br />
Antonio Raschi<br />
C.N.R.-I.A.T.A.<br />
Piazzale dell Casc<strong>in</strong>e 18, 50144 Firenze,<br />
Italy<br />
raschi@sunserver.iata.fi.cnr.it<br />
Stephan Raspe<br />
Bavarian State Institute of Forestry<br />
Am Hochanger 11, 85354 Freis<strong>in</strong>g,<br />
Germany<br />
ras@lwf.uni-muenchen.de<br />
Jacques Régnière<br />
Canadian Forest Service<br />
1055 rue du P.E.P.S, (P.O. Box 3800),<br />
Sa<strong>in</strong>te Foy, Quebec, Canada, G1V 4C7<br />
jregniere@cfl.forestry.ca<br />
Thomas Rötzer<br />
Humboldt-University Berl<strong>in</strong><br />
Institute of Crop Sciences, Section of<br />
Agricultural Meteorology<br />
Albrecht-Thaer-Weg 5, 14195 Berl<strong>in</strong>,<br />
Germany<br />
thomas.roetzer@rz.hu-berl<strong>in</strong>.de<br />
David B. Roy<br />
Centre for Ecology <strong>and</strong> Hydrology CEH<br />
Monks Wood, Abbots Ripton,<br />
Hunt<strong>in</strong>gdon, Cambridgeshire PE28 2LS,<br />
UK<br />
dbr@ceh.ac.uk<br />
90<br />
Maret Saar<br />
Estonian Agricultural University<br />
Institute of Zoology <strong>and</strong> Botany<br />
181 Riia St.,Tartu 51014, Estonia<br />
maret@zbi.ee<br />
Crystal Barker Schaaf<br />
Dept of Geography / Center for Remote<br />
Sens<strong>in</strong>g<br />
Boston University, 675 Commonwealth<br />
Avenue, Boston, MA 02215 USA<br />
Jörg Schaber<br />
PIK Potsdam<br />
Institute of Climate Impact Research<br />
PO Box 601203, 14412 Potsdam,<br />
Germany<br />
schaber@pik-potsdam.de<br />
Jörn P.W. Scharlemann<br />
University of Cambridge<br />
Conservation Biology Group, Department<br />
of Zoology,<br />
Dowm<strong>in</strong>g Street, Cambridge, CB2 3EJ,<br />
UK<br />
jpws2@cam.ac.uk<br />
Helfried Scheif<strong>in</strong>ger<br />
Zentralanstalt für Meteorologie und<br />
Geodynamik<br />
Hohe Warte 38, 1190 Wien, Austria<br />
Helfried.Scheif<strong>in</strong>ger@zamg.ac.at<br />
Mark D. Schwartz<br />
University of Wiscons<strong>in</strong>-Milwaukee<br />
Department of Geography<br />
P.O. Box 413, Milwaukee, WI 53201-<br />
0413<br />
mds@uwm.edu<br />
Ulrich Simon<br />
TU Munich<br />
Chair of L<strong>and</strong> Use Plann<strong>in</strong>g <strong>and</strong> Nature<br />
Conservation<br />
Am Hochanger 13, 85354 Freis<strong>in</strong>g,<br />
Germany<br />
Ulrich.Simon@lrz.tu-muenchen.de
Richard L. Snyder<br />
University of California<br />
Dept. Of L<strong>and</strong>, Air <strong>and</strong> Water Resources<br />
Davis, CA 956161, USA<br />
RLSNYDER@UCDAVIS.EDU<br />
Frederico Spanna<br />
Regione Piemonte - Settore Fitosanitario<br />
Regionale<br />
Corso Grosseto, 71/6, 10100 Tor<strong>in</strong>o, Italy<br />
ufficio.agrometeo@regione.piemonte.it<br />
Donatella Spano<br />
University of Basilicata<br />
Dip. Di Produzione Vegetale<br />
Via n. Sauro,75, Potenza 85100, Italy<br />
spano@unibas.it<br />
Tim H. Sparks<br />
Centre for Ecology <strong>and</strong> Hydrology CEH<br />
Monks Wood, Abbots Ripton,<br />
Hunt<strong>in</strong>gdon, Cambridgeshire PE28 2LS,<br />
UK<br />
ths@ceh.ac.uk<br />
Andreja Sušnik<br />
Hydrometeorological Institute of Slovenia<br />
Vojkova 1b, 1001 Ljubljana, Slovenia<br />
<strong>and</strong>reja.susnik@rzs-hm.si<br />
Piotr Tryjanowski<br />
Adam Mickiewicz University<br />
Department of Avian Biology<br />
Fredry 10 PL 61 - 701 Poznan, Pol<strong>and</strong><br />
ptasiek@ma<strong>in</strong>.amu.edu.pl<br />
Compton J Tucker<br />
NASA / Goddard Space Flight Center<br />
Biospheric Sciences Branch, Code 923,<br />
Laboratory for Terrestrial Physics<br />
Greenbelt Maryl<strong>and</strong>, 20 771USA<br />
compton@kratmos.gsfc.nasa.gov<br />
Nadia Valent<strong>in</strong>i<br />
Arboree-Universita di Tor<strong>in</strong>o<br />
Dipartimento di Colture<br />
Via Leonardo da V<strong>in</strong>ci, 44; 10095<br />
Grugliasco (Tor<strong>in</strong>o), Italy<br />
valent<strong>in</strong>@agraria.unito.it<br />
Jarvoslav Valter<br />
Czech Hdyrometeorological Institute<br />
Na Sabatce 17, 14306 Prag 4, Czech<br />
Republic<br />
valter@chmi.cz<br />
Arnold JH Van Vliet<br />
Wagen<strong>in</strong>gen University<br />
P.O. Box 9101, 6700 HB Wagen<strong>in</strong>gen,<br />
The Netherl<strong>and</strong>s<br />
arnold.vanvliet@algemeen.cmkw.wau.nl<br />
Frans-Emil Wielgolaski<br />
Univerity of Oslo<br />
Department of Biology<br />
POB 1045 Bl<strong>in</strong>dern, N-0316 Oslo,<br />
Norway<br />
f.e.wielgolaski@bio.uio.no<br />
Mike A White<br />
University of Montana<br />
NTSG, School of Forestry<br />
Missoula, MT 59812, USA<br />
mike@ntsg.umt.edu<br />
Petrit Zorba<br />
Academy of Science<br />
Hydrometeorological Institute<br />
Rr.Durresit, K.P.219,Tirana - Albania<br />
aspetalb@yahoo.com<br />
91