The 13 April 2006 Severe Thunderstorm and Large Hail Event in ...
The 13 April 2006 Severe Thunderstorm and Large Hail Event in ...
The 13 April 2006 Severe Thunderstorm and Large Hail Event in ...

You also want an ePaper? Increase the reach of your titles
YUMPU automatically turns print PDFs into web optimized ePapers that Google loves.
<strong>The</strong> <strong>13</strong> <strong>April</strong> <strong>2006</strong> <strong>Severe</strong> <strong>Thunderstorm</strong> <strong>and</strong> <strong>Large</strong> <strong>Hail</strong> <strong>Event</strong> <strong>in</strong><br />
Iowa & Wiscons<strong>in</strong>:A Case Study<br />
David M. DeMeuse<br />
Undergraduate<br />
University of Wiscons<strong>in</strong> – Department of Atmospheric & Oceanic Science<br />
Mesoscale Meteorology – AOS 453<br />
ABSTRACT<br />
One of the most spectacular severe weather events witnessed is large-hail events. <strong>The</strong>se ice<br />
stones can cause millions of dollars <strong>in</strong> damage <strong>in</strong> a very short time <strong>and</strong> turn an otherwise<br />
green pasture <strong>in</strong>to a look<strong>in</strong>g like a January-esque snow event. <strong>The</strong> oddity of white<br />
precipitation fall<strong>in</strong>g dur<strong>in</strong>g the warm spr<strong>in</strong>g <strong>and</strong> summer months coupled with the loud,<br />
om<strong>in</strong>ous sounds of hail hitt<strong>in</strong>g roofs can leave last<strong>in</strong>g impressions on many people. Such<br />
was case <strong>in</strong> the late even<strong>in</strong>g hours <strong>in</strong> southwest Wiscons<strong>in</strong>. After a devastat<strong>in</strong>g tornado<br />
outbreak <strong>in</strong> eastern Iowa, a supercell thunderstorm had migrated from Iowa <strong>and</strong> as it<br />
moved across the central counties of Wiscons<strong>in</strong>, dozens of reports of hail <strong>and</strong> high-w<strong>in</strong>d<br />
events were filed. <strong>Hail</strong> <strong>in</strong> excess of softball-size were reported <strong>in</strong> Iowa <strong>and</strong> Jefferson<br />
(Wiscons<strong>in</strong>) counties with the largest be<strong>in</strong>g a 4.25” ice rock near Lake Mills, Wiscons<strong>in</strong>.<br />
Radar analysis of hail has grown tremendously with the addition of WSR-88D radar <strong>and</strong><br />
certa<strong>in</strong> signatures become apparent on reflectivities when hail is present <strong>in</strong> severe<br />
thunderstorms. Three-body scatter spikes (TBSS) <strong>and</strong> flare echoes are two of the ways<br />
meteorologists can detect large hail before it reaches the ground. In this is case study,<br />
careful exam<strong>in</strong>ation will attempt to expla<strong>in</strong> the mesoscale dynamics of the <strong>in</strong>itiation of<br />
these supercell thunderstorms <strong>in</strong> Iowa, their advancement eastward, <strong>and</strong> hail<br />
production/observations as they moved through southern Wiscons<strong>in</strong>. Focus shall rema<strong>in</strong> on<br />
the largest severe thunderstorm <strong>in</strong> southern Wiscons<strong>in</strong> (~0140Z – 400Z) with only slight<br />
reference to the tornadic event <strong>in</strong> Iowa.<br />
__________________________________________<br />
I. Introduction.<br />
University of Iowa suffered<br />
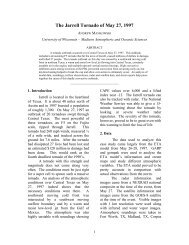
Dur<strong>in</strong>g the late even<strong>in</strong>g, early night hours of<br />
<strong>13</strong> <strong>April</strong> <strong>2006</strong>, several supercell storms were<br />
push<strong>in</strong>g through eastern Iowa <strong>and</strong> <strong>in</strong>to<br />
southwest Wiscons<strong>in</strong>. Earlier, the severe<br />
storms began around 2300Z <strong>13</strong> <strong>April</strong> <strong>2006</strong><br />
<strong>in</strong> Central Iowa with numerous hail reports.<br />
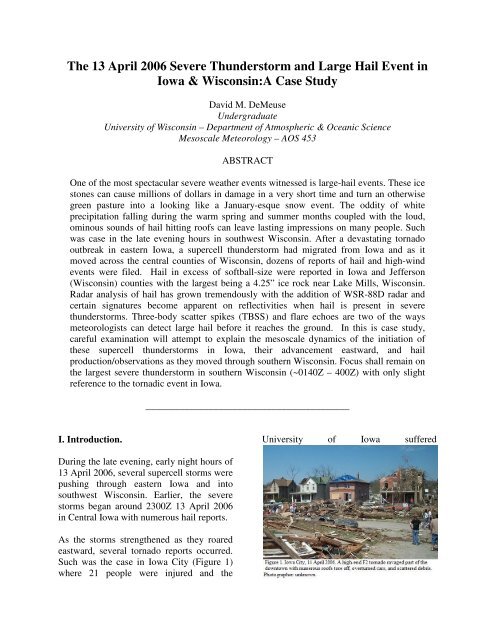
As the storms strengthened as they roared<br />
eastward, several tornado reports occurred.<br />
Such was the case <strong>in</strong> Iowa City (Figure 1)<br />
where 21 people were <strong>in</strong>jured <strong>and</strong> the
significant damage to dormitories <strong>and</strong> other<br />
university build<strong>in</strong>gs.<br />
This mesoscale convective complex began<br />
to reform <strong>and</strong> the multicellular pattern began<br />
to take shape. Before the ma<strong>in</strong> complex<br />
moved southeast <strong>in</strong>to northern Ill<strong>in</strong>ois, one<br />
cell broke left <strong>and</strong> took aim on southern<br />
Wiscons<strong>in</strong>. <strong>The</strong> very nature of supercells<br />
be<strong>in</strong>g attracted to certa<strong>in</strong>, localized regions<br />
(hence, their otherwise erratic movements)<br />
could have many possible reasons.<br />
<strong>The</strong>se <strong>in</strong>clude but are not limited to moisture<br />
convergences, the ability to follow any mean<br />
w<strong>in</strong>ds, strong deep-layer vertical w<strong>in</strong>d shear<br />
with weaker mid-level storm-relative w<strong>in</strong>ds,<br />
<strong>and</strong> a stronger cold pool.<br />
<strong>The</strong> complexities arise by the very nature of<br />
supercells. <strong>The</strong> <strong>in</strong>ternal dynamics of the<br />
storms themselves create mesoscale<br />
circulations that can drive these storms to<br />
move <strong>in</strong> unpredictable ways. However,<br />
<strong>in</strong>itiation of such storms under the right<br />
atmospheric conditions are well known.<br />
It is the hypothesis of the researcher that the<br />
supercells developed from these classically<br />
understood dynamics <strong>and</strong> the extraord<strong>in</strong>ary<br />
hail event was the result of shear from the<br />
surface to mid-levels to the upper-air, the<br />
remnants of the already <strong>in</strong>tense updraft, <strong>and</strong><br />
cross<strong>in</strong>g the warm frontal boundary.<br />
II. Data.<br />
<strong>The</strong> National Weather Service (NWS), the<br />
National <strong>Severe</strong> Storms Laboratory (NSSL),<br />
<strong>and</strong> the Storm Prediction Center (SPC)<br />
contributed to the comprehensive damage<br />
<strong>and</strong> storm reports. In addition, the National<br />
Climate Data Center served to provide radar<br />
data. <strong>The</strong> Cooperative Institute for<br />
Meteorological Satellite Studies (CIMSS)<br />
<strong>and</strong> Space Science <strong>and</strong> Eng<strong>in</strong>eer<strong>in</strong>g Center<br />
(SSEC) supplied an extensive array of<br />
products.<br />
Data analysis was synthesized by graphicaluser<br />
<strong>in</strong>terface software programs such as<br />
Integrated Data Viewer (IDV), General<br />
Meteorological Package (GEMPAK),<br />
GEMPAK Analysis <strong>and</strong> Render<strong>in</strong>g Program<br />
(GARP), Java NEXRAD Viewer, GrLevel2,<br />
<strong>and</strong> GrLevel2Analysis.<br />
Satellite retrievals were taken from GOES-8<br />
archives us<strong>in</strong>g the <strong>in</strong>frared spectrums as<br />
evidence <strong>in</strong> this <strong>in</strong>vestigation.<br />
Radar data was provided by the NCDC with<br />
scans at multiple elevation angles us<strong>in</strong>g both<br />
WSR-88D’s base <strong>and</strong> composite reflectives.<br />
Convective Outlooks, <strong>and</strong> Forecast <strong>and</strong><br />
Mesoscale Discussions were provided by the<br />
SPC’s archives as well as previous case<br />
study synopsizes provided by the NWS <strong>and</strong><br />
CIMSS.<br />
Model results <strong>and</strong> forecasts were taken from<br />
the Rapid Update Cycle (RUC) <strong>and</strong> North<br />
American Model (NAM, or ETA) model set.<br />
<strong>The</strong> date <strong>and</strong> times were as of 14 <strong>April</strong> <strong>2006</strong><br />
from approximately 0000Z to 0400Z 14<br />
<strong>April</strong> <strong>2006</strong>. Upper air <strong>and</strong> surface plots were<br />
provided by Unisys Weather Image <strong>and</strong> Map<br />
Archive.<br />
Regional analysis for the mesoscale<br />
<strong>in</strong>vestigation <strong>in</strong>cludes the Midwest; namely,<br />
eastern Iowa, southwest Wiscons<strong>in</strong>, <strong>and</strong><br />
northern Ill<strong>in</strong>ois. <strong>The</strong> synoptic overview<br />
spans the entire contiguous United States<br />
focus<strong>in</strong>g on the states <strong>in</strong> the upper<br />
Mississippi Valley.<br />
III. Synoptic Overview.<br />
A surface plot of CONUS is shown <strong>in</strong><br />
Figure 2 0000Z 14 <strong>April</strong> <strong>2006</strong>. <strong>The</strong> storms
Figure 2: Surface Data Plot 0000Z 14 <strong>April</strong> <strong>2006</strong>.<br />
Courtesy: Unisys Data.<br />
<strong>in</strong> eastern Iowa had already formed <strong>in</strong>to a<br />
mesoscale convective complex just below a<br />
warm frontal boundary stretch<strong>in</strong>g from<br />
southern Manitoba southeastward <strong>in</strong>to<br />
northwestern Indiana.<br />
Connected to this warm front was a surface<br />
anticyclone situated north of North Dakota<br />
<strong>and</strong> an associated cold front draped across<br />
the Dakotas <strong>and</strong> <strong>in</strong>to Montana. <strong>The</strong> warm<br />
moist air (Figure 3) over the Mid-<br />
Mississippi Valley is be<strong>in</strong>g advected north<br />
to northwestward by the lower level w<strong>in</strong>d<br />
field. Dewpo<strong>in</strong>ts across Iowa ranged from<br />
the upper 50s C to mid 60s throughout the<br />
better part of the day.<br />
of high <strong>in</strong>stability. As the atmosphere began<br />
to destabilize <strong>in</strong> the early even<strong>in</strong>g hours, the<br />
lifted <strong>in</strong>dices peaked (with a bull’s eye<br />
centered on south central Iowa, Figure 4) of<br />
negative values.<br />
A surface trough <strong>in</strong> western Iowa created<br />
another area of lower-level convergence<br />
separat<strong>in</strong>g drier westerly w<strong>in</strong>ds with the<br />
w<strong>in</strong>ds feed<strong>in</strong>g moisture <strong>in</strong>to Iowa.<br />
IV. Mesoscale Analysis.<br />
In Figure 3, we see a moist tongue (green)<br />
with dewpo<strong>in</strong>ts greater than or equal to 60<br />
C. Accompany<strong>in</strong>g the moist tongue is a<br />
thermal ridge (red dots). Usher<strong>in</strong>g <strong>in</strong> this<br />
warm, Gulf moisture northward is the<br />
850mb low-level jet (green arrow).<br />
Coupled with converg<strong>in</strong>g surface w<strong>in</strong>ds <strong>and</strong><br />
strong daytime heat<strong>in</strong>g this created an area
As these lower-level southerly w<strong>in</strong>ds slide<br />
under the zonally oriented jet streak (purple<br />
arrow), a strong vertical w<strong>in</strong>d shear<br />
component is created.<br />
Figure 3: Miller Diagram. 2100Z <strong>13</strong> <strong>April</strong> <strong>2006</strong>.<br />
Features Depicted: Cold Front, Warm Front, 300mb<br />
Jet Streak (Purple Arrow), 850mb <strong>The</strong>rmal Ridge<br />
(Red Dots), Surface Isobars (Black L<strong>in</strong>es), Moist<br />
Tongue (Green), Lower-Level Jet (Green Arrow).<br />
Not only are they w<strong>in</strong>ds veer<strong>in</strong>g with height<br />
(turn<strong>in</strong>g clockwise), but the speed of these<br />
w<strong>in</strong>ds are also <strong>in</strong>creas<strong>in</strong>g. Although the jet<br />
streak was not oriented to produce any<br />
upper-level divergence (<strong>and</strong> thus surface<br />
convergence) over southern<br />
M<strong>in</strong>nesota/Iowa/southwestern Wiscons<strong>in</strong> to<br />
<strong>in</strong>itiate the convection, the streak did have<br />
w<strong>in</strong>d speeds greater than 100 knots.<br />
<strong>The</strong> <strong>in</strong>itiation was most likely the result of<br />
the small short wave mov<strong>in</strong>g eastward<br />
converg<strong>in</strong>g with the warm, moist w<strong>in</strong>d field<br />
Figure 4: 850mb <strong>The</strong>rmal Field, 300mb, Surface<br />
Plot, <strong>and</strong> Humidity/Lifted Index. Courtesy: Unisys.
(as discussed <strong>in</strong> the Synoptic Overview).<br />
Interactions between the warm front are also<br />
likely. <strong>The</strong> relatively strong southerly w<strong>in</strong>ds<br />
at the surface cont<strong>in</strong>ually warmed while the<br />
upper-levels stayed near the same<br />
temperature. This caused an <strong>in</strong>crease <strong>in</strong><br />
<strong>in</strong>stability (see Figure 5).<br />
Figure 5: Cross Section. 0100Z 14 <strong>April</strong> <strong>2006</strong>. Des<br />
Mo<strong>in</strong>es, Iowa to Madison, Wiscons<strong>in</strong>. Mean W<strong>in</strong>d<br />
Vectors (Black), Equivalent Potential Temperature<br />
(Blue), Potential Temperature (Red).<br />
thunderstorms.<br />
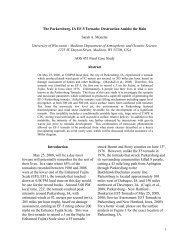
An analysis of the nearest sound<strong>in</strong>g (Figure<br />
6), Davenport, Iowa, at 0000Z 14 <strong>April</strong> <strong>2006</strong><br />
shows how unstable the atmosphere was just<br />
prior to the convection mov<strong>in</strong>g through<br />
eastern Iowa.<br />
Unfortunately, with the balloon<br />
experienc<strong>in</strong>g technical difficulties at 400mb,<br />
a true sound<strong>in</strong>g was not able to be taken.<br />
Thus the <strong>in</strong>dices generated are prone to<br />
error.<br />
<strong>The</strong> convective available potential energy<br />
(CAPE) is just over 700 J/kg <strong>and</strong> the veer<strong>in</strong>g<br />
w<strong>in</strong>ds can also be shown (the susta<strong>in</strong>ed<br />
southwesterly w<strong>in</strong>ds below 700mb are<br />
between 15-35 knots which confirm the<br />
necessary horizontal w<strong>in</strong>d shear that<br />
supercells need to develop).<br />
Figure 6: Sound<strong>in</strong>g for Davenport (DVN), Iowa.<br />
1200Z 14 <strong>April</strong> <strong>2006</strong>. Courtesy: University of<br />
Wyom<strong>in</strong>g<br />
Supercells are<br />
conducive when<br />
there is strong<br />
veer<strong>in</strong>g <strong>in</strong> the low<br />
levels (warm air<br />
advection) with<br />
w<strong>in</strong>d speeds greater<br />
than 20 knots <strong>and</strong><br />
greater than 100<br />
knots up to 300mb<br />
(NWS-LSX).<br />
<strong>The</strong> veer<strong>in</strong>g with<br />
height creates<br />
positive helicity<br />
values which have<br />
been known to be a<br />
highly contribut<strong>in</strong>g<br />
factor <strong>in</strong> the<br />
generation <strong>and</strong><br />
lifetime of supercell
As the system moved southeasterly, new<br />
cells formed on the northeast side <strong>and</strong> began<br />
mov<strong>in</strong>g to the north-northeast. <strong>The</strong>se are the<br />
cells that would eventually impact southern<br />
Wiscons<strong>in</strong>. <strong>The</strong> thunderstorms here are not<br />
try<strong>in</strong>g to use the moist boundary layer as a<br />
mechanism of propagation, but <strong>in</strong>stead are<br />
caught <strong>in</strong> the mean mid-level w<strong>in</strong>d pattern.<br />
<strong>The</strong>se storms did not necessarily split from<br />
the ma<strong>in</strong> complex, but <strong>in</strong>stead grew as a<br />
result of the complex <strong>and</strong> propagated on<br />
their own accord (as the mean w<strong>in</strong>d would<br />
allow).<br />
<strong>The</strong> air <strong>in</strong> southern Wiscons<strong>in</strong>, while<br />
unstable, is however, less moist <strong>and</strong> closer<br />
to the warm front. This <strong>in</strong>troduces a unique<br />
set of conditions. S<strong>in</strong>ce these storms are<br />
mov<strong>in</strong>g <strong>in</strong>to an area with less horizontal<br />
w<strong>in</strong>d shear, rotation with<strong>in</strong> the storm itself<br />
will be noticeably weaker. Furthermore, the<br />
upper atmosphere will become much colder<br />
on the other side of the warm front. This is<br />
why it is not unusual that the large hail<br />
reports began at about 0104Z just as the<br />
thunderstorms neared the warm frontal<br />
boundary across northwest Iowa/southwest<br />
Wiscons<strong>in</strong> (Figure 7).<br />
This allowed for the large-hail event to take<br />
place. <strong>The</strong> thunderstorms already conta<strong>in</strong>ed<br />
a strong updraft, but with little mesocyclonic<br />
rotations, tornadoes would not be expected.<br />
<strong>Hail</strong>stones grow <strong>in</strong> the mid-levels <strong>in</strong> <strong>and</strong><br />
around an updraft where there is an<br />
abundance of super-cooled water (Lemon,<br />
1997). <strong>The</strong> updrafts associated with large<br />
hail are most often <strong>in</strong>tense, large, <strong>and</strong> rarely<br />
mix with environmental air aloft.<br />
Figure 7: SPC’s Storm Reports for <strong>13</strong> <strong>April</strong> <strong>2006</strong>.<br />
Take note of the large hail reports (black triangles)<br />
<strong>in</strong> southern Wiscons<strong>in</strong> <strong>and</strong> the tornado reports<br />
angled to the right.
Figure 8: UW-AOS generated NEXRAD radar image<br />
of southern Wiscons<strong>in</strong>. 0212Z 14 <strong>April</strong> <strong>2006</strong>. Special<br />
importance to the TBSS.<br />
Study<strong>in</strong>g a radar image at 0212Z 14 <strong>April</strong><br />
<strong>2006</strong> (Figure 8), we see the <strong>in</strong>tense storm on<br />
the southern border of Dane <strong>and</strong> Iowa<br />
counties (Wiscons<strong>in</strong>). <strong>The</strong> obvious feature<br />
that clearly st<strong>and</strong>s out is the strange spike<br />
protrud<strong>in</strong>g from the ma<strong>in</strong> supercell<br />
thunderstorm: the three body scatter<br />
signature (spike).<br />
<strong>The</strong> three-body scatter signature or flare<br />
echo is produced on radar by non-Rayleigh<br />
radar microwave scatter<strong>in</strong>g most likely due<br />
from ‘dry’ or wet hail on scales greater than<br />
1/16 the diameter to wavelength ratio<br />
(Lemon, 1997). <strong>The</strong> triple reflection is the<br />
result of<br />
1) scatter<strong>in</strong>g by the hail onto the<br />
ground<br />
2) backscatter<strong>in</strong>g by the ground to<br />
the same hail region aloft <strong>and</strong> f<strong>in</strong>ally<br />
3) backscatter<strong>in</strong>g by the hail to the<br />
radar<br />
A visualization of this is shown <strong>in</strong> the<br />
conceptual figure Figure 9 (top right, with<br />
acknowledgments to Lemon, 2007). <strong>The</strong><br />
signature of the three-body scatter<strong>in</strong>g is the<br />
2D representation of the flare. Remember,<br />
that this flare does not actually exist, it is a<br />
false reflectivity with no precipitation<br />
associated with it. To see an actual 3D<br />
image of this storm, refer back to Figure 9.<br />
Typically, the TBSS is caused by<br />
reflectivities greater than 63 dBz <strong>and</strong><br />
conta<strong>in</strong>s false echoes of 20 dBz or less.
Figure 9: 3D Cross Section of the radar reflectivity<br />
(NWS-LOT) of the large hail produc<strong>in</strong>g thunderstorm<br />
over southwest Dane County, Wiscons<strong>in</strong>. (0211Z 14<br />
<strong>April</strong> <strong>2006</strong>). Top Right: Conceptual Schematic of the<br />
TBSS as viewed from the side. Take note of the ‘flare’<br />
<strong>in</strong> each image.<br />
Figure 10: Radar<br />
Reflectivity from the<br />
NWS-LOT (Chicago,<br />
IL) 0211Z 14 <strong>April</strong><br />
<strong>2006</strong>.
overhead jet streak allowed for the flow of<br />
the storms to prosper <strong>and</strong> move, although<br />
not contribut<strong>in</strong>g to the <strong>in</strong>itiation.<br />
Figure 11: Actual hailstones from the severe<br />
thunderstorm that struck Madison, Wiscons<strong>in</strong>.<br />
Photography: David M. DeMeuse<br />
<strong>The</strong> length scale of such spikes are usually<br />
on the order on 15 km (Lemon, 1997). In<br />
Figure 9 or Figure 10, the greatest<br />
reflectivities are upwards of 65dBz, false<br />
echoes of ~25 dBz, <strong>and</strong> length scales of 30<br />
km. While these numbers are rough <strong>and</strong><br />
rudimentary, they can vary. And, as <strong>in</strong> this<br />
case, very large hail was confirmed (Figure<br />
11); the scatter spike is a real phenomenon.<br />
Because of their long lifetime, <strong>in</strong>ertial<br />
oscillations began to take the storms<br />
southeastward (to the right of the mean<br />
w<strong>in</strong>d). It was dur<strong>in</strong>g this time that two cells<br />
developed <strong>and</strong> began their march through<br />
southern Wiscons<strong>in</strong>. <strong>The</strong>se storms followed<br />
the mean w<strong>in</strong>d (separated from the complex)<br />
<strong>and</strong> were the major hail producers. Because<br />
of their strong updrafts <strong>and</strong> <strong>in</strong>teractions<br />
between the warm frontal boundary, hail<br />
was able to grow to enormous sizes.<br />
Future research <strong>in</strong>to this event might <strong>in</strong>clude<br />
a more detailed synopsis of the structure of<br />
the tornadic supercells themselves <strong>and</strong> the<br />
apparent disorganization of the multicellular<br />
system <strong>and</strong> their movements.<br />
V. Conclusion.<br />
Although the SPC did issue a severe<br />
thunderstorm watch for the even<strong>in</strong>g with<br />
special regard to “large, damag<strong>in</strong>g hail”, the<br />
sometimes sporadic behavior of supercell<br />
thunderstorms makes forecast<strong>in</strong>g hail for a<br />
localized area extremely difficult. <strong>The</strong><br />
tornadic mesoscale convective complex<br />
correspond<strong>in</strong>g to this event was especially<br />
powerful leav<strong>in</strong>g millions of dollars of<br />
damage <strong>and</strong> one person dead.<br />
<strong>The</strong> storms orig<strong>in</strong>ally formed as a result of a<br />
converg<strong>in</strong>g w<strong>in</strong>d field carry<strong>in</strong>g a warm,<br />
moist air mass aga<strong>in</strong>st a warm front. <strong>The</strong>
REFERENCES<br />
Brown<strong>in</strong>g, K.A. 1978: <strong>The</strong> structure <strong>and</strong><br />
mechanisms of hailstorms . <strong>Hail</strong> : A Review<br />
of <strong>Hail</strong> Science <strong>and</strong> <strong>Hail</strong> Suppression,<br />
Meteor. Monogr., No. 38, Amer. Meteor.<br />
Soc ., 1-43.<br />
Cooperative Institute for Meteorological<br />
Satellite Studies (CIMSS), <strong>2006</strong>: CIMSS<br />
Regional Assimilation System (CRAS): In<br />
<strong>The</strong> News.<br />
Miller L.J, et al. 1983: Radar Echo<br />
Structure, Air Motion <strong>and</strong> <strong>Hail</strong> Formation <strong>in</strong><br />
a <strong>Large</strong> Stationary Multicellular<br />
<strong>Thunderstorm</strong>. Amer. Meteor. Soc. 40, 2399-<br />
2418<br />
Lemon, L.R., 1998: <strong>The</strong> Radar “Three-Body<br />
Scatter Spike”: An Operational <strong>Large</strong>-hail<br />
Signature. Amer. Meteor. Soc. <strong>13</strong>. 327-340.<br />
Marwitz, J. D., 1972: <strong>The</strong> Structure <strong>and</strong><br />
Motion of <strong>Severe</strong> <strong>Hail</strong>storms, Part III:<br />
<strong>Severe</strong>ly Sheared Storms. Journ. App.<br />
Meteor. 11. 189-201.<br />
National <strong>Severe</strong> Storms Laboratory (NSSL).<br />
National Weather Service – Sullivan,<br />
Wiscons<strong>in</strong> (NWS-MKX), <strong>2006</strong>: <strong>April</strong> <strong>13</strong>,<br />
<strong>2006</strong> Southern Wiscons<strong>in</strong> <strong>Hail</strong>storm.<br />
Documented Extreme Weather <strong>Event</strong>s:<br />
Southeast <strong>and</strong> South Central Wiscons<strong>in</strong>.<br />
_____ - St. Louis, Missouri (NWS-LSX),<br />
2005: Forecast<strong>in</strong>g Convective Mode <strong>and</strong><br />
Severity.<br />
Storm Prediction Center (SPC) <strong>2006</strong>:<br />
Archived Storm Reports, Mesoscale<br />
Discussion, <strong>and</strong> Weather Watches.<br />
Unisys, <strong>2006</strong>: Weather: Surface Data. Image<br />
& Map Archive: Surface Plots & Upper Air.