PHY 221 LAB 04-4: Standing Waves on a String
PHY 221 LAB 04-4: Standing Waves on a String
PHY 221 LAB 04-4: Standing Waves on a String

You also want an ePaper? Increase the reach of your titles
YUMPU automatically turns print PDFs into web optimized ePapers that Google loves.
<str<strong>on</strong>g>PHY</str<strong>on</strong>g> <str<strong>on</strong>g>221</str<strong>on</strong>g> <str<strong>on</strong>g>LAB</str<strong>on</strong>g> <str<strong>on</strong>g>04</str<strong>on</strong>g>-4: <str<strong>on</strong>g>Standing</str<strong>on</strong>g> <str<strong>on</strong>g>Waves</str<strong>on</strong>g> <strong>on</strong> a <strong>String</strong><br />
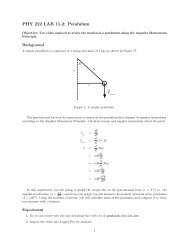
In this experiment, standing waves will be produced by an oscillator that moves a string up and down<br />
sinusoidally. The resulting wave travels down the string and reflects off a fixed node at the end. The<br />
traveling waves interfere. If the tensi<strong>on</strong> in the string is just right so that the speed of the wave has a<br />
wavelength that is a half-integer multiple of the length of the string, then a standing wave will result.<br />
Harm<strong>on</strong>ics<br />
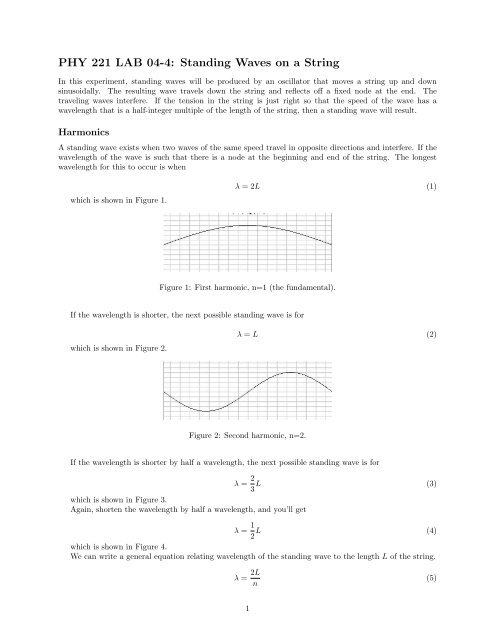
A standing wave exists when two waves of the same speed travel in opposite directi<strong>on</strong>s and interfere. If the<br />
wavelength of the wave is such that there is a node at the beginning and end of the string. The l<strong>on</strong>gest<br />
wavelength for this to occur is when<br />
which is shown in Figure 1.<br />
λ = 2L (1)<br />
Figure 1: First harm<strong>on</strong>ic, n=1 (the fundamental).<br />
If the wavelength is shorter, the next possible standing wave is for<br />
which is shown in Figure 2.<br />
λ = L (2)<br />
Figure 2: Sec<strong>on</strong>d harm<strong>on</strong>ic, n=2.<br />
If the wavelength is shorter by half a wavelength, the next possible standing wave is for<br />
which is shown in Figure 3.<br />
Again, shorten the wavelength by half a wavelength, and you’ll get<br />
λ = 2 3 L (3)<br />
λ = 1 2 L (4)<br />
which is shown in Figure 4.<br />
We can write a general equati<strong>on</strong> relating wavelength of the standing wave to the length L of the string.<br />
λ = 2L n<br />
(5)<br />
1
Figure 3: Third harm<strong>on</strong>ic, n=3.<br />
Figure 4: Fourth harm<strong>on</strong>ic, n=4.<br />
where n = 1, 2, 3, 4, ... and each integer is referred to as a harm<strong>on</strong>ic. The l<strong>on</strong>gest wavelength occurs for<br />
n = 1, the first harm<strong>on</strong>ic which is called the fundamental. Higher harm<strong>on</strong>ics are referred to as overt<strong>on</strong>es.<br />
The sec<strong>on</strong>d harm<strong>on</strong>ic is called the first overt<strong>on</strong>e.<br />
Note that the number of nodes in each case is<br />
Speed of a wave <strong>on</strong> a string<br />
For any wave, its speed is related to its wavelength and frequency.<br />
# of nodes = n + 1 (6)<br />
v = λf (7)<br />
The wave speed also depends <strong>on</strong> the medium it travels in. For a wave <strong>on</strong> a string, its speed depends <strong>on</strong><br />
the tensi<strong>on</strong> in the string and the linear density of the string µ. (Linear density is its mass per unit length,<br />
so µ = m/L). The speed of a wave <strong>on</strong> a string is<br />
√<br />
T<br />
v =<br />
(8)<br />
µ<br />
<strong>String</strong>ed Instruments<br />
Equating the above two equati<strong>on</strong>s, then<br />
λf =<br />
√<br />
T<br />
µ<br />
(9)<br />
For a standing wave <strong>on</strong> a string, substitute λ = 2L n<br />
and solve for the frequency of the standing wave in<br />
terms of tensi<strong>on</strong> and linear density of the string, as well as the harm<strong>on</strong>ic n.<br />
( ) √<br />
2L T<br />
f =<br />
(10)<br />
n µ<br />
2
√<br />
f = n T<br />
2L µ<br />
(11)<br />
Suppose that a standing wave <strong>on</strong> a string <strong>on</strong> an instrument (like piano or violin or guitar, etc.) vibrates<br />
with the fundamental frequency (n = 1). Then,<br />
√<br />
f 1 = 1 T<br />
(12)<br />
2L µ<br />
To increase the frequency, you can:<br />
• decrease the length of the string (by pressing down <strong>on</strong> the string).<br />
• increase the tensi<strong>on</strong> (by tightening a screw, or “key”).<br />
• decrease the mass per unit length (by using a less dense string, typically a thinner string or <strong>on</strong>e made<br />
of a different material)<br />
What can you do to decrease the fundamental frequency <strong>on</strong> a string<br />
Sound from stringed instruments<br />
Any periodic waveform can be written as a sum of cosine and sine functi<strong>on</strong>s. This is called a Fourier Series.<br />
f(t) = a ∞ 0<br />
2 + ∑<br />
a n cos( 2πn<br />
T<br />
n=1<br />
t) + ∞ ∑<br />
The c<strong>on</strong>stants a 0 , a n and b n are found by integrating the functi<strong>on</strong>s below.<br />
n=1<br />
b n sin( 2πn t) (13)<br />
T<br />
a 0 = 2 T<br />
∫T/2<br />
f(t)dt (14)<br />
a n = 2 T<br />
b n = 2 T<br />
−T/2<br />
∫T/2<br />
−T/2<br />
∫T/2<br />
−T/2<br />
f(t) cos( 2πn t)dt (15)<br />
T<br />
f(t) sin( 2πn t)dt (16)<br />
T<br />
Some examples are shown in Figures 5 – 7. In all cases, a period T = 2π is used.<br />
The important idea to remember is that any periodic wave can be approximated as a Fourier Series.<br />
When a sound is played <strong>on</strong> an instrument, perhaps by plucking a string (e.g. guitar) or hammering the<br />
string (e.g. piano), a wave is produced that is not a simple sine wave. But rather, it is made up of many<br />
(17)<br />
3
Figure 5: A square wave approximated as a Fourier Series.<br />
Figure 6: A triangle wave approximated as a Fourier Series.<br />
Figure 7: A sawtooth wave approximated as a Fourier Series.<br />
sine waves (i.e. a Fourier Series). Some of the sine waves have large amplitude (the fundamental) and other<br />
sine waves have lower amplitude (the overt<strong>on</strong>es).<br />
A middle C <strong>on</strong> piano and the same note <strong>on</strong> a guitar have the same fundamental, but they have overt<strong>on</strong>es<br />
with different amplitudes. As a result, the “mixture” of sine waves is different for the two instruments even<br />
though the fundamental frequencies are the same.<br />
By doing a Fourier transform using a computer, you can determine the amplitudes (a n and b n ) of the<br />
harm<strong>on</strong>ics for the wave that produced the sound for the instrument. The image below shows the amplitudes<br />
of the harm<strong>on</strong>ics that make up the square wave in Figure 5. Notice that the fundamental (n=1) is the<br />
str<strong>on</strong>gest. The <strong>on</strong>ly harm<strong>on</strong>ics are the odd harm<strong>on</strong>ics, and they decrease in amplitude.<br />
Experiment–<str<strong>on</strong>g>Standing</str<strong>on</strong>g> <str<strong>on</strong>g>Waves</str<strong>on</strong>g> <strong>on</strong> a <strong>String</strong><br />
1. Set up an oscillator using a ringstand attached to <strong>on</strong>e end of the table.<br />
2. On the other end of the table, set up a ringstand with a pulley.<br />
3. Attach <strong>on</strong>e end of a l<strong>on</strong>g string to the oscillator and run the other end of the string over the pulley.<br />
Be sure that the pulley can freely rotate.<br />
4. Hang a bucket <strong>on</strong> the end of the string.<br />
4
Figure 8: The amplitudes of the harm<strong>on</strong>ics that make up the Fourier Series for the square wave.<br />
5. Measure the length L of the string from the oscillator to the top edge of the pulley, above the axle.<br />
6. Plug in the oscillator and begin to add BBs to the bucket.<br />
7. Add BBs at a slow rate until you begin to see what looks like a standing wave. Add BBs <strong>on</strong>e at a time<br />
until the standing wave has its greatest amplitude and is very stable (meaning that it doesn’t appear<br />
and disappear or change amplitude). An example of a standing wave is shown below.<br />
Figure 9:<br />
8. Record the number of nodes that you see for the standing wave (including the endpoints). Calculate<br />
the wavelength of the wave.<br />
Create a datatable for your data and calculati<strong>on</strong>s, similar to the <strong>on</strong>e shown below.<br />
n # of nodes λ (m) mass (m) Tensi<strong>on</strong> (N)<br />
9. Measure the mass of the bucket and BBs. Calculate the gravitati<strong>on</strong>al force <strong>on</strong> the bucket. This is the<br />
tensi<strong>on</strong> in the string.<br />
10. Add additi<strong>on</strong>al BBs until you see a different wavelength standing wave. Record the data for this<br />
standing wave.<br />
11. Repeat these measurements for a total of 5 harm<strong>on</strong>ics. Be sure to get <strong>on</strong>e data point for the sec<strong>on</strong>d<br />
harm<strong>on</strong>ic. It is best not to try for the first harm<strong>on</strong>ic since the apparatus may not be str<strong>on</strong>g enough<br />
for the high tensi<strong>on</strong> required.<br />
5
Sketch a picture of each of the standing waves that you saw. Write the wavelength of the standing wave in<br />
each case.<br />
12. The frequency of the oscillator is 120 Hz. Calculate the speed of the wave for each of the standing<br />
waves that you studied. (Just add a new column to your data table.)<br />
Graph the speed of the wave v vs. the tensi<strong>on</strong> T . Use Equati<strong>on</strong> (7) to identify a functi<strong>on</strong> for the best-fit<br />
curve. Fit the curve to your data. Record the functi<strong>on</strong> for the best-fit curve.<br />
The c<strong>on</strong>stant of your best-fit curve to v vs. T is equal to 1/ √ µ where µ is the linear density, or mass per<br />
unit length, of the string. Using your equati<strong>on</strong>, calculate the linear mass density of the string.<br />
Experiment–Fourier Transform of Sound<br />
In this experiment, you are going to measure the harm<strong>on</strong>ics of a sound wave using a Fourier Transform.<br />
1. C<strong>on</strong>nect a microph<strong>on</strong>e to the LabPro data acquisiti<strong>on</strong> interface.<br />
2. Open Logger Pro.<br />
3. You will see a graph of sound intensity vs. time. The sound intensity is proporti<strong>on</strong>al to the square of<br />
the amplitude of the sound wave.<br />
6
4. Say a c<strong>on</strong>tinuous sound like “oooooooooooo” into the microph<strong>on</strong>e while your lab partner clicks the<br />
Collect butt<strong>on</strong>. C<strong>on</strong>tinue saying the sound until you see a graph.<br />
5. Go to the menu Insert→Additi<strong>on</strong>al Graph→FFT.<br />
6. The resulting graph shows the amplitudes (y-axis) of various frequencies (x-axis) of the sine and cosine<br />
waves that make up the sound that you produced. These frequencies are called harm<strong>on</strong>ics.<br />
7. Using your mouse, measure the frequency of the greatest amplitude harm<strong>on</strong>ic. (You can go to the menu<br />
Analyze→Examine or click the Examine ic<strong>on</strong> <strong>on</strong> the toolbar to more easily make your measurement.)<br />
Record your result.<br />
8. Also, measure and record the sec<strong>on</strong>d and third greatest amplitude harm<strong>on</strong>ics.<br />
9. Now, make a different sound, like “ahhhhhhhhh” for example. Again, measure the frequencies of the<br />
top three greatest amplitude harm<strong>on</strong>ics.<br />
10. Ask a guitar player in the class to play a note for you. Measure the frequencies for the top three<br />
harm<strong>on</strong>ics of the note that he plays.<br />
11. Measure and record the top three harm<strong>on</strong>ics for a different note.<br />
Applicati<strong>on</strong><br />
1. In the experiment <strong>on</strong> standing waves <strong>on</strong> a string, the frequency of the oscillator stayed the same.<br />
As you increased the tensi<strong>on</strong>, did the harm<strong>on</strong>ic (n) increase or decrease Did the wavelength of the<br />
standing waves increase or decrease Did the speed of a wave <strong>on</strong> the string increase or decrease<br />
2. On a guitar string (or piano string or violin string), the predominant frequency that you hear is due<br />
to the fundamental (n=1). So, this stays c<strong>on</strong>stant. As you change the tensi<strong>on</strong>, does the wavelength<br />
increase or decrease Does the frequency increase or decrease Does the speed of a wave <strong>on</strong> the string<br />
increase or decrease<br />
3. Suppose that the “top” string <strong>on</strong> a guitar and the “bottom” string <strong>on</strong> a guitar have the same tensi<strong>on</strong>.<br />
Which string has a greater linear density (mass/length) Which string will have the greater<br />
fundamental frequency<br />
4. Sketch the first four harm<strong>on</strong>ics for a standing wave <strong>on</strong> a string that is fixed at both ends. Label each<br />
graph with the harm<strong>on</strong>ic (n). If the length of the string is 1 m, write the wavelength for each harm<strong>on</strong>ic.<br />
7