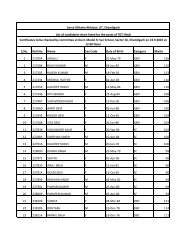
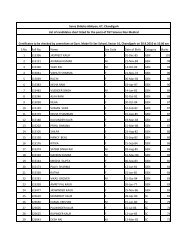
School Related Indicators. Enrollment Related ... - SSA Chandigarh
School Related Indicators. Enrollment Related ... - SSA Chandigarh
School Related Indicators. Enrollment Related ... - SSA Chandigarh

You also want an ePaper? Increase the reach of your titles
YUMPU automatically turns print PDFs into web optimized ePapers that Google loves.
DISE - INDEX<br />
Educational <strong>Indicators</strong> at Glance<br />
Infrastructure <strong>Related</strong> <strong>Indicators</strong><br />
Teacher <strong>Related</strong> <strong>Indicators</strong><br />
<strong>School</strong> <strong>Related</strong> <strong>Indicators</strong><br />
<strong>School</strong> <strong>Related</strong> <strong>Indicators</strong>.<br />
S2 : Management Wise and Level Wise <strong>School</strong>ing Facilities<br />
S3 : Number of <strong>School</strong>s : Time Series<br />
S4 : Avg Number of Working Days in Year.<br />
S5 :Management Wise Number of <strong>School</strong>s Attached with Pre – Primary Sections<br />
<strong>Enrollment</strong> <strong>Related</strong> <strong>Indicators</strong><br />
E1 : Level – Wise <strong>Enrollment</strong><br />
E2 : <strong>Enrollment</strong> in Govt. <strong>School</strong>s<br />
E3 : Share of Govt Private and Aided <strong>School</strong>s in Total <strong>Enrollment</strong> at<br />
elementary level<br />
E4 : <strong>Enrollment</strong> in Govt. <strong>School</strong> and Aied : Classwise<br />
E5 : <strong>Enrollment</strong> in Govt. <strong>School</strong> and Aied : Classwise<br />
E6 : Gross <strong>Enrollment</strong> Ratio for Boys : Level Wise<br />
E7 : Gross <strong>Enrollment</strong> Ratio : Level Wise<br />
E8: <strong>Enrollment</strong> in Pvt. Recognized & Misc. incl K.V and N.V<br />
E9 : Age-Wise Distribution of Population in all <strong>School</strong>s<br />
E10: Distribution of Ideal Age Class Combination : Level Wise<br />
E11: Overage & Under Age Children : Level Wise<br />
E12 :Net <strong>Enrollment</strong> Ratio : Level Wise.<br />
E13 : Net <strong>Enrollment</strong> Ratio for Boys : Level Wise<br />
E14 : Net <strong>Enrollment</strong> Ratio for Girls : Level Wise<br />
E15 : Gender Parity Index : Level –Wise in All <strong>School</strong>s<br />
E16 : <strong>Enrollment</strong> In Govt. Sr. Sec <strong>School</strong>s (Model + Non Model ) 2007-08<br />
E17 : <strong>Enrollment</strong> In Govt. High <strong>School</strong>s (Model + Non Model ) 2007-08<br />
E18 : <strong>Enrollment</strong> In Govt. High <strong>School</strong>s (Model + Non Model ) 2007-08<br />
E19 : <strong>Enrollment</strong> In Govt. Pry. <strong>School</strong>s (Model + Non Model ) 2007-08<br />
E20 : Gender Parity Index in Govt. <strong>School</strong>s<br />
E21: Gender Parity Index : Level Wise : Govt <strong>School</strong>s.<br />
E22: Ward Wise <strong>Enrollment</strong> in Govt. <strong>School</strong>s<br />
E23 : Ward Wise SC <strong>Enrollment</strong> in Govt. <strong>School</strong>s
Teacher <strong>Related</strong> <strong>Indicators</strong><br />
T1: Percentage of Female Teachers Level Wise<br />
T2 : Percentage of Female Teachers at U.pry Level<br />
T3 : Percentage of Female teachers at Elementary level<br />
T4 : Pupil Teacher Ratio<br />
T6 Profession Qualification of Teachers :Management Wise<br />
T7 : Professional Qualification Wise Share in Different Management of<br />
<strong>School</strong>.<br />
T8 : Share of Various types of Professional Qualification in different<br />
Management of <strong>School</strong><br />
Outcome/ Performance <strong>Related</strong> <strong>Indicators</strong><br />
O1 : Transition Rate : Management Wise.<br />
O2: Transition Rate : Location Wise<br />
O3: Pass Percentage in Pry. Sections<br />
O4: Pass %age at Pry. Level 2007-08<br />
O5: Pass %age at Upper Pry. Level 2007-08<br />
O6: %age of Children Getting more than 60% Marks at Primary Level<br />
O7: %age of Children Getting more than 60% Marks at U.Primary Level<br />
O8: Pass %age at Upper Pry. Level 2007-08<br />
O9: Pass %age in Govt. <strong>School</strong>s at Primary & U.pry Level :Model& Non<br />
Model <strong>School</strong>s.<br />
Q10 :%age of Children Getting more than 60% marks at Pry. & U.pry level in<br />
Govt <strong>School</strong>s : Model & Non Model.<br />
O11: Class Wise No. of Repeaters & Failures<br />
O12: No. of Repeaters at Pry. Level : All Management<br />
O13: Repeation Rate at Pry L:evel : Location Wise<br />
O14 : Repeaters at U.pry Level : Location Wise<br />
O15: Repeatetion Rate at Upper Primary Level<br />
016: Repeaters at Elementary Level<br />
********************
Educational <strong>Indicators</strong> At a Glance<br />
Infrastructure :<br />
• All <strong>School</strong>s have Electricity ,Drinking Water , Sanitation facilities.<br />
• 35 out of 103 Govt. <strong>School</strong>s have Ramps<br />
• 96 out of 103 Govt. <strong>School</strong>s have Play Ground.<br />
• 85% of Classrooms are in Good Conditions ,14 % requires minor<br />
repairs and 1% requires major repairs.<br />
• 27% of Govt. <strong>School</strong>s have Book Bank Facilities.<br />
• 95% of Govt. <strong>School</strong>s have separate toilets for Girls.<br />
• Student Classroom Ratio in Govt. <strong>School</strong>s is 45:1 at Primary Level &<br />
48:1 at Upper Primary Level.<br />
• 99% <strong>School</strong>s have Boundary Wall<br />
• 100% Classrooms are Pucca out of which 84% are in Good condition ,<br />
16 % requires minor and major repairs,<br />
• 98% <strong>School</strong>s conducted medical checkups of students<br />
Teachers:<br />
• All Teachers are Trained Teachers<br />
• 75 % of teachers are Female teachers in Govt. <strong>School</strong>s<br />
• 47% of teachers are Post Graduates<br />
• 56% of teachers are B.Ed , 3.4% are M.Ed and 31% are JBT<br />
• 13% and 8% of Teachers belongs to SC, and OBC group respectively<br />
while 79% are of General Category<br />
• Pupil Teacher ratio is 35:1 at elementary level for Govt. <strong>School</strong>s.<br />
Performance <strong>Indicators</strong><br />
• The <strong>Enrollment</strong> in Govt. <strong>School</strong>s has risen from 666810 in 2004-05 to<br />
88133 for Elementary Classes ( increase of over 32% in 4 Yrs)<br />
average Annual Growth rate of 8%.<br />
• Repetition Rate has reduced from 11.1 % to 9.9 % at Upper Primary<br />
Level<br />
• Transition Rate from Pry. to U.pry has increased from 104.7 in year<br />
2006-07 to 109.0 in year 2007-08. (It is above 100 because of Lateral<br />
Entry at Upper Primary)<br />
• Pass Percentage of Boys and Girls in Class V is 91% 94% while it is<br />
76% for boys and 75% for Girls in Class VIII<br />
• 29% Boys and 38 % of Girls got more than 60% in Class V<br />
• 37% Boys and 45% of Girls got more than 60% in Class VIII
<strong>School</strong> <strong>Related</strong> <strong>Indicators</strong><br />
Table : S1 %Age of Girls with respect to total<br />
Level Govt. <strong>School</strong>s Govt. Aided <strong>School</strong>s<br />
Primary Level 45.18% 60.16%<br />
Upper Primary Level 45.72% 47.25%<br />
Elementary Level 45.37% 53.2%<br />
Table : S2 MANAGEMENT WISE AND LEVEL WISE SCHOOLING<br />
FACILITIES<br />
Year 2007-08 :5<br />
Primary<br />
Upper<br />
Primary<br />
Sections<br />
Secondary<br />
sections<br />
Sr. Secondary<br />
sections<br />
Govt. 102 84 78 29<br />
<strong>School</strong>s<br />
Govt. 6 7 7 6<br />
Aided<br />
Private 59 51 40 22<br />
schools<br />
Others 6 7 7 6<br />
Total 173 149 132 63<br />
TABLE : S3 Number of <strong>School</strong>s : Time series<br />
Management 2007-08 2006-07 2005-06 2004-05<br />
GOVT 103 104 103 103<br />
Aided 7 7 7 6<br />
Pvt. 59 61 64 61<br />
Others 7 6 12 9<br />
All 176 178 186 179<br />
Table :S4 Average Number of Working Days in the year<br />
Management 2007-08 2006-07 2005-06 2004-05<br />
All 228 194 206 208<br />
Govt 235 241 221 222<br />
The schools managed by Department of Education and Govt. aided schools function<br />
for more number of days in comparison of private schools and K.Vs , Airforce , N.V<br />
etc.
Table S5 :Management Wise Number of <strong>School</strong>s Attached with Pre Primary<br />
Sections.<br />
<strong>School</strong> Management<br />
Total Number of<br />
<strong>School</strong>s<br />
No. of <strong>School</strong>s with<br />
Pre- Primary<br />
Attached<br />
Department of Education 103 96<br />
Govt. Aided <strong>School</strong>s 7 2<br />
Private ( Unaided ) 59 53<br />
Others ( K.V , Airforce , N.V etc ) 7 2<br />
Table : S6<br />
Ward Wise Distribution of <strong>School</strong>s<br />
Number of U.pry<br />
<strong>School</strong>s<br />
Census Ward Number of Pry <strong>School</strong>s<br />
Total Number of <strong>School</strong>s<br />
1 9 10 10<br />
2 7 6 7<br />
3 5 5 5<br />
4 5 6 6<br />
5 7 8 8<br />
6 14 14 15<br />
7 11 8 11<br />
8 12 9 12<br />
9 9 9 9<br />
10 6 3 6<br />
11 7 6 7<br />
12 7 6 7<br />
13 8 8 9<br />
14 11 8 11<br />
15 7 7 7<br />
16 14 12 14<br />
17 8 8 8<br />
18 9 7 9<br />
19 7 4 7<br />
20 8 5 8<br />
Total 171 149 176
<strong>Enrollment</strong> <strong>Related</strong> <strong>Indicators</strong><br />
Table :E1<br />
Level – Wise <strong>Enrollment</strong> : All Management<br />
LEVEL 2004-05 2005-06 2006-07 2007-08<br />
Pry 65436 76279 81146 86250<br />
U.Pry 38680 42777 43977 48461<br />
Elem. 104116 119056 125123 134711<br />
Source : Dise 2004-2008 :<br />
Year<br />
<strong>Enrollment</strong> in Pry. and U.pry<br />
Level<br />
2007-08<br />
2006-07<br />
2005-06<br />
2004-05<br />
0 50000 100000 150000<br />
Enrollm e nt<br />
Pry<br />
U.Pry<br />
The table clearly shows a sizeable<br />
and persistent increase in students<br />
both at primary and upper<br />
primary level. This is because of<br />
the intensive enrollment drive<br />
initiated by Sarv Shiksha Abhiyan<br />
as well as due to closure of unrecognized<br />
schools in residential<br />
areas and shifting of students<br />
from unrecognized to Govt.<br />
<strong>School</strong>s. Rise of 23% rise in<br />
<strong>Enrollment</strong> has been observe<br />
during 2004-05 and 2007-08 at<br />
elementary level.<br />
Table : E2 <strong>Enrollment</strong> in Govt <strong>School</strong>s.<br />
LEVEL 2004-05 2005-06 2006-07 2007-08<br />
Pry 42495 48719 50669 57518<br />
U.Pry 24186 25622 26136 30615<br />
Elem. 66681 74341 76805 88133<br />
Growth of <strong>Enrollment</strong> in Govt <strong>School</strong>s<br />
Pry<br />
U.Pry<br />
Elem.<br />
100000<br />
80000<br />
60000<br />
40000<br />
20000<br />
0<br />
2004-05 2005-06 2006-07 2007-08
Table : E3 Share of Govt. , Private and Aided schools in Total <strong>Enrollment</strong> At<br />
Elementary Level.<br />
Enr. At Elem. Level<br />
.Pvt<br />
28%<br />
Aided<br />
2%<br />
Others<br />
4%<br />
Govt<br />
66%<br />
Enr. At<br />
Elem. Level<br />
%age<br />
Share<br />
Govt 88133 65.42<br />
Aided 3236 2.40<br />
Pvt. 37679 27.97<br />
Others 5663 4.20<br />
Total 134711 100.00<br />
Govt schools have a sizable share of 65.4 % in total. Private Recognized <strong>School</strong>s<br />
have a significant share of 28% of the total.Others ( K.V N.V and Airforce schools<br />
have only 4.2% share while the share of Aided schools is only 2.4%.<br />
TABLE :E4 <strong>Enrollment</strong> in Govt. and Govt Aided <strong>School</strong> : Class Wise<br />
Year : 2007-08<br />
GOVT<br />
GOVT Aided<br />
Cls Boys Girls Total %Girls Boys Girls Total %Girls<br />
1 6453 5412 11865 45.61 92 206 298 69.13<br />
2 6561 5317 11878 44.76 118 165 283 58.3<br />
3 6402 5321 11723 45.39 121 150 271 55.35<br />
4 6077 4991 11068 45.09 143 185 328 56.4<br />
5 6039 4945 10984 45.02 128 203 331 61.33<br />
6 6075 4992 11067 45.11 281 269 550 48.91<br />
7 5522 4610 10132 45.5 273 263 536 49.07<br />
8 5022 4394 9416 46.67 356 283 639 44.29<br />
P 31532 25986 57518 45.18 602 909 1511 60.16<br />
U.P 16619 13996 30615 45.72 910 815 1725 47.25<br />
E 48151 39982 88133 45.37 1512 1724 3236 53.28<br />
<strong>Enrollment</strong><br />
Classwise <strong>Enrollment</strong> in Govt <strong>School</strong>s<br />
15000<br />
10000<br />
5000<br />
0<br />
Boys<br />
Girls<br />
Total<br />
12345678<br />
Class<br />
800<br />
600<br />
400<br />
200<br />
Boys<br />
0<br />
1 2 3 4 5 6 7 8<br />
Girls<br />
Total<br />
Class<br />
<strong>Enrollment</strong><br />
<strong>Enrollment</strong> in Aided <strong>School</strong>s
TABLE :E5 <strong>Enrollment</strong> in Pvt. and Others <strong>School</strong>(K.V,N.V,A.F) : Class Wise<br />
Year : 2007-08<br />
Private Other ( K.V , N.V,Airforce )<br />
Cls Boys Girls Total %Girls Boys Girls Total %Girls<br />
1 2733 2182 4915 44.39 355 284 639 44.44<br />
2 2788 2137 4925 43.39 363 272 635 42.83<br />
3 2734 2019 4753 42.48 393 280 673 41.60<br />
4 2680 2001 4681 42.75 428 281 709 39.63<br />
5 2693 1927 4620 41.71 381 290 671 43.22<br />
6 2703 1922 4625 41.56 477 325 802 40.52<br />
7 2631 1953 4584 42.60 456 331 787 42.06<br />
8 2609 1967 4576 42.99 428 319 747 42.70<br />
P 13628 10266 23894 42.96 1920 1407 3327 42.29<br />
U.P 7943 5842 13785 42.38 1361 975 2336 41.74<br />
E 21571 16108 37679 42.75 3281 2382 5663 42.06<br />
<strong>Enrollment</strong><br />
Boys<br />
Girls<br />
Total<br />
<strong>Enrollment</strong> in Pvt <strong>School</strong>s<br />
5000<br />
4000<br />
3000<br />
2000<br />
1000<br />
0<br />
1 2 3 4 5 6 7 8<br />
Class<br />
<strong>Enrollment</strong><br />
Boys<br />
Girls<br />
Total<br />
<strong>Enrollment</strong> in Other (K.V, N.V , A.F)<br />
1000<br />
800<br />
600<br />
400<br />
200<br />
0<br />
1 2 3 4 5 6 7 8<br />
Class<br />
The above analysis shows that the parents of the children prefer Govt. & Govt Aided<br />
<strong>School</strong> at upper Primary level , while for primary classes their preference is Pvt.<br />
<strong>School</strong>s<br />
Table : E6 Gross <strong>Enrollment</strong> Ratio : Level Wise – All Management<br />
LEVEL 2004-05 2005-06 2006-07 2007-08<br />
G.E.R (Pry.) 133.8 129.7 132.8 130.1<br />
G.E.R (U.Pry) 100.7 101.4 99 102.9<br />
G.E.R (Elem) 119.2 117.9 118.6 118.8
140<br />
120<br />
100<br />
80<br />
GER<br />
60<br />
40<br />
20<br />
(Pry.)<br />
0<br />
(U.Pry)<br />
(Elem)<br />
GER<br />
2004-05 2005-06 2006-07 2007-08<br />
Year<br />
GER at Primary level is very high at 130.1 meaning thereby that a large proportion of<br />
overage and underage children exists at primary level. The GER at Upper Primary is<br />
also high (102.9). During the year 2004-08 the GER at primary and Upper Primary<br />
level has not changed much.<br />
Table : E7 Gross <strong>Enrollment</strong> Ratio for Boys : Level Wise – All Management<br />
LEVEL 2004-05 2005-06 2006-07 2007-08<br />
G.E.R (Pry.) 133.8 129.8 132.5 130.5<br />
G.E.R (U.Pry) 99.7 101 98.9 102.6<br />
G.E.R (Elem) 118.8 117.9 118.4 118.9<br />
140<br />
120<br />
100<br />
80<br />
GER<br />
60<br />
40<br />
20<br />
(Pry.) 0<br />
(U.Pry)<br />
(Elem)<br />
GER for Boys<br />
2004-05 2005-06 2006-07 2007-08<br />
Year<br />
Table : E8 Gross <strong>Enrollment</strong> Ratio for Girls : Level Wise<br />
LEVEL 2004-05 2005-06 2006-07 2007-08<br />
G.E.R (Pry.) 133.8 129.6 133.1 129.5<br />
G.E.R (U.Pry) 102 101.8 99.3 103.2<br />
G.E.R (Elem) 119.8 117.9 118.8 118.7
140<br />
120<br />
100<br />
80<br />
GER<br />
60<br />
40<br />
20<br />
(Pry.) 0<br />
(U.Pry)<br />
(Elem)<br />
GER for Boys<br />
2004-05 2005-06 2006-07 2007-08<br />
Year<br />
No significant difference has been observed between GER of Boys and GER of Girls,<br />
meaning thereby that the problem of overage and underage children exist for both<br />
Girls as well as Boys.<br />
Table : E9 Age-Wise Distribution of Population in all <strong>School</strong>s All Management<br />
LEVEL 2007-08 2006-07 2005-06 2004-05<br />
Population (5-10) 42072 36040 35881 30423<br />
Population (10-12) 29978 27258 25570 24051<br />
Population (5-12) 72050 63298 61451 54474<br />
Child Population in Sc hool<br />
Population<br />
80000<br />
70000<br />
60000<br />
50000<br />
40000<br />
30000<br />
20000<br />
10000<br />
0<br />
2004-05 2005-06 2006-07 2007-08<br />
(5-10)<br />
(10-12)<br />
(5-12)<br />
Year<br />
`
Table : E10<br />
Management<br />
Distribution of Ideal Age Class Combination : Level Wise : All<br />
LEVEL 2004-05 2005-06 2006-07 2007-08<br />
Ideal Age Class (Pry.) 10432 12409 10999 13714<br />
Ideal Age Class (U.Pry) 5222 5397 5523 5610<br />
Ideal Age Class (Elem.) 15654 17806 16522 19324<br />
Table : E11 Overage & Under Age Children : Level Wise<br />
LEVEL 2004-05 2005-06 2006-07 2007-08<br />
Over/Under Age (5-9)Yrs 55004 63870 70147 72536<br />
Over/Under Age (9-12)Yrs 60214 70882 75623 80640<br />
Over/Under Age (5-12)Yrs 49782 58473 64624 66926<br />
It has been observed that a sizable number of children are overage and<br />
underage. The number of overage Children has increased at both primary and Upper<br />
primary level from 55004 in 2004-05 to 72536 in 2007-08 .<br />
Table : E12<br />
Net <strong>Enrollment</strong> Ratio : Level Wise. – All Management<br />
LEVEL 2004-05 2005-06 2006-07 2007-08<br />
N.E.R (Pry.) 34.2 34.5 30.5 32.6<br />
N.E.R (U.Pry) 21.7 21.1 20.2 18.7<br />
N.E.R (Elem) 28.7 28.9 26.1 26.8<br />
Table : E13 Net <strong>Enrollment</strong><br />
Ratio for Boys : Level Wise. – All Mangement<br />
LEVEL 2004-05 2005-06 2006-07 2007-08<br />
N.E.R (Pry.) 39.3 40.1 36.4 36.1<br />
N.E.R (U.Pry) 29.3 29.4 27.9 25.5<br />
N.E.R (Elem) 34.9 35.7 32.9 31.7
Table : E14 Net <strong>Enrollment</strong> Ratio for Girls : Level Wise – All Mangement<br />
LEVEL 2004-05 2005-06 2006-07 2007-08<br />
N.E.R (Pry.) 39.5 41.5 35.1 38.3<br />
N.E.R (U.Pry) 28.8 32.7 27 28.2<br />
N.E.R (Elem) 34.8 37.8 31.7 34.2<br />
The NER for girls is slightly better than the boys in the year 2007-08 with respect to<br />
previous year. But it is far away from 100.<br />
The table clearly shows that a larger proportion of students are either over age or<br />
under age.As a result of enrollment drive to mainstream children of AIE centres , the<br />
any are has declined over the past four years.<br />
Table : E15 Gender Parity Index : Level –Wise in All <strong>School</strong>s .<br />
LEVEL 2004-05 2005-06 2006-07 2007-08<br />
G.P.I (Pry.) 80.7 83.4 80.4 80.8<br />
G.P.I (U.Pry) 83.4 86.5 82.4 80.6<br />
G.P.I (Elem) 81.7 84.5 81.1 80.7<br />
Gender parity index at primary as well as upper primary level is low due to<br />
lower proportion of girl child in total population. The proportion has remained more<br />
or less constant at primary level but it has decreased at upper primary level.<br />
Table E16 : <strong>Enrollment</strong> in Govt. Senior Secondary <strong>School</strong>s ( Model + Non Model) :2007-08<br />
Cls Boys Girls Total<br />
1 2096 1693 3789<br />
2 2095 1617 3712<br />
3 2014 1617 3631<br />
4 1963 1636 3599<br />
5 2003 1591 3594<br />
6 2518 2148 4666<br />
7 2299 1948 4247<br />
8 2161 1884 4045<br />
Pry 10171 8154 18325<br />
UPry 6978 5980 12958<br />
Elem 17149 14134 31283
Table : E17 <strong>Enrollment</strong> in Govt High <strong>School</strong> ( Model + Non Model ) :2007-08<br />
Cls Boys Girls Total<br />
1 2811 2341 5152<br />
2 2946 2411 5357<br />
3 2936 2465 5401<br />
4 2733 2197 4930<br />
5 2762 2267 5029<br />
6 3344 2630 5974<br />
7 3024 2493 5517<br />
8 2694 2378 5072<br />
Pry 14188 11681 25869<br />
UPry 9062 7501 16563<br />
Elem 23250 19182 42432<br />
Table : E18 <strong>Enrollment</strong> in Govt Middle <strong>School</strong> ( Model + Non Model ) :2007-08<br />
Cls Boys Girls Total<br />
1 222 202 424<br />
2 234 204 438<br />
3 251 220 471<br />
4 256 169 425<br />
5 187 168 355<br />
6 176 180 356<br />
7 164 141 305<br />
8 146 111 257<br />
Pry 1150 963 2113<br />
UPry 486 432 918<br />
Elem 1636 1395 3031<br />
<strong>Enrollment</strong> in Middle <strong>School</strong>s<br />
500<br />
400<br />
Enr<br />
Boys<br />
Girls<br />
Total<br />
300<br />
200<br />
100<br />
0<br />
1 2 3 4 5 6 7 8<br />
Classes
Table : E19 <strong>Enrollment</strong> in Govt Pry .<strong>School</strong> ( Model + Non Model ) :2007-08<br />
Cls Boys Girls Total<br />
1 1324 1176 2500<br />
2 1286 1085 2371<br />
3 1201 1019 2220<br />
4 1125 989 2114<br />
5 1087 919 2006<br />
6 37 34 71<br />
7 35 28 63<br />
8 21 21 42<br />
Pry 6023 5188 11211<br />
UPry 93 83 176<br />
Elem 6116 5271 11387<br />
<strong>Enrollment</strong> in Govt Primary <strong>School</strong>s (Model + Non Model)<br />
Enr<br />
Boys<br />
Girls<br />
Total<br />
2500<br />
2000<br />
1500<br />
1000<br />
500<br />
0<br />
1 2 3 4 5 6 7 8<br />
Classes<br />
Table : E20: Gender Parity Index : Level Wise : Govt <strong>School</strong>s.<br />
LEVEL 2004-05 2005-06 2006-07 2007-08<br />
(Pry.) Rural 95.8 97.9 93.7 95.6<br />
(U.Pry) Rural 106.6 112.3 109 111.1<br />
(Elem) Rural 98.7 101.6 97.5 100<br />
(Pry.) Urban 77.4 80.5 79 78<br />
(U.Pry) Urban 80.4 83.5 80.4 76.5<br />
(Elem) Urban 78.6 81.6 79.5 77.4
Gender Parity Index<br />
120<br />
100<br />
80<br />
GPI<br />
60<br />
40<br />
20<br />
(Elem) Rural<br />
0<br />
(Elem) Urban<br />
2004-05 2005-06 2006-07 2007-08<br />
Year<br />
Gender Parity Index<br />
GPI<br />
120<br />
100<br />
80<br />
60<br />
40<br />
20<br />
0<br />
2004-05 2005-06 2006-07 2007-08<br />
Year<br />
(Pry.) Rural<br />
(U.Pry) Rural<br />
(Pry.) Urban<br />
(U.Pry) Urban<br />
The Gender Parity index at Upper Primary level is better in case of rural. The index<br />
has improved from 106.6 in 2004-05 to 109 in 2006-07 and further to 111.1 in 2007-<br />
08 as a result of rural being focus area of educational development<br />
Table : E21: Gender Parity Index : Level Wise : Govt <strong>School</strong>s.<br />
Particular Level 2007-08 2006-07 2005-06 2004-05<br />
S.C Primary 7619 8373 9145 8946<br />
S.C U.Pry. 4802 4569 4676 4659<br />
S.C Elementary 12421 12942 13821 13605<br />
S.C GIRLS Primary 3510 3849 4226 4168<br />
S.C GIRLS U.Pry. 2286 2185 2251 2207<br />
S.C GIRLS Elementary 5796 6034 6477 6375<br />
%AGE SC Primary 46 45.9 46.2 46.5<br />
%AGE SC U.Pry. 47.6 47.8 48.1 47.3<br />
%AGE SC Elementary 46.6 46.6 46.8 46.8<br />
%AGE SC(G) Primary 4167 4535 4625 4597<br />
%AGE SC(G) U.Pry. 689 2577 2467 2498<br />
%AGE SC(G) Govt Elementary 6856 7112 7092 7095<br />
Total SC Primary 8799 9613 10138 9926<br />
Total SC U.Pry. 5490 5202 5140 5257<br />
Total SC All Elementary 14289 14815 15278 15183<br />
%AGE SC ALL to TOTAL SC (P) 47.3 47.1 45.6 46.3<br />
%AGE SC ALL to Total Girls TOTAL SC(UP) 48.9 49.5 48 47.5<br />
%AGE SC ALL to<br />
TOTAL SC (E) 47.9 48 46.4 46.7
Table : E22 Ward Wise , Level Wise <strong>Enrollment</strong> in Govt. <strong>School</strong>s<br />
2007-08<br />
Ward<br />
Pry<br />
Girls<br />
Pry<br />
Boys<br />
Total(P)<br />
U.P<br />
Girls<br />
U.P<br />
Boys<br />
Tot<br />
(UP)<br />
Tot Boys<br />
(E)<br />
Tot<br />
Girls (E)<br />
Total(E)<br />
1 1295 1583 2878 923 1041 1964 2624 2218 4842<br />
2 706 951 1657 452 469 921 1420 1158 2578<br />
3 451 622 1073 395 572 967 1194 846 2040<br />
4 444 605 1049 347 386 733 991 791 1782<br />
5 1645 1907 3552 904 991 1895 2898 2549 5447<br />
6 1876 2198 4074 1142 1361 2503 3559 3018 6577<br />
7 2625 3172 5797 1309 1512 2821 4684 3934 8618<br />
8 1895 2271 4166 1038 1297 2335 3568 2933 6501<br />
9 679 906 1585 546 727 1273 1633 1225 2858<br />
10 1514 1682 3196 448 484 932 2166 1962 4128<br />
11 664 797 1461 504 542 1046 1339 1168 2507<br />
12 479 563 1042 516 461 977 1024 995 2019<br />
13 501 675 1176 378 463 841 1138 879 2017<br />
14 1363 1961 3324 585 721 1306 2682 1948 4630<br />
15 888 1035 1923 451 539 990 1574 1339 2913<br />
16 1591 2033 3624 1118 1295 2413 3328 2709 6037<br />
17 483 596 1079 294 421 715 1017 777 1794<br />
18 2112 2366 4478 873 843 1716 3209 2985 6194<br />
19 2851 3263 6114 1052 1264 2316 4527 3903 8430<br />
20 1924 2671 4595 721 1229 1950 3900 2645 6545<br />
Total 21211 25923 47134 12223 14125 26348 40048 33434 73482
Table E23 : Ward Wise SC <strong>Enrollment</strong> in Govt. <strong>School</strong>s<br />
Primary SC <strong>Enrollment</strong> U.Primary SC <strong>Enrollment</strong><br />
GPI<br />
(P) GPI(U.P)<br />
Ward Boys Girls Total Boys Girls Total<br />
1 111 102 213 152 111 263 0.92 0.73<br />
2 179 131 310 81 72 153 0.73 0.89<br />
3 73 60 133 70 44 114 0.82 0.63<br />
4 252 192 444 147 126 273 0.76 0.86<br />
5 529 476 1005 328 319 647 0.90 0.97<br />
6 613 534 1147 254 222 476 0.87 0.87<br />
7 344 339 683 274 287 561 0.99 1.05<br />
8 342 291 633 218 208 426 0.85 0.95<br />
9 39 40 79 39 22 61 1.03 0.56<br />
10 116 111 227 67 54 121 0.96 0.81<br />
11 62 67 129 55 52 107 1.08 0.95<br />
12 34 27 61 21 33 54 0.79 1.57<br />
13 85 56 141 80 68 148 0.66 0.85<br />
14 64 59 123 44 38 82 0.92 0.86<br />
15 123 77 200 58 53 111 0.63 0.91<br />
16 150 122 272 152 134 286 0.81 0.88<br />
17 74 78 152 63 40 103 1.05 0.63<br />
18 265 218 483 131 159 290 0.82 1.21<br />
19 401 355 756 208 197 405 0.89 0.95<br />
20 253 175 428 74 47 121 0.69 0.64<br />
Total 4109 3510 7619 2516 2286 4802 0.85 0.91
Ward Wise Distribution of General Category of Students<br />
Primary General<br />
<strong>Enrollment</strong><br />
U.Primary Gen<br />
<strong>Enrollment</strong><br />
GPI for General<br />
GPI<br />
Ward Boys Girls Total Boys Girls Total (P) GPI(UP)<br />
1 1193 2638 3831 858 784 1642 2.21 0.91<br />
2 565 1584 2149 386 379 765 2.80 0.98<br />
3 378 1056 1434 490 340 830 2.79 0.69<br />
4 237 1429 1666 233 220 453 6.03 0.94<br />
5 1143 4071 5214 658 576 1234 3.56 0.88<br />
6 1335 4553 5888 1097 917 2014 3.41 0.84<br />
7 2217 4998 7215 1219 1007 2226 2.25 0.83<br />
8 1576 3896 5472 1070 825 1895 2.47 0.77<br />
9 639 1358 1997 687 523 1210 2.13 0.76<br />
10 1403 2286 3689 417 394 811 1.63 0.94<br />
11 589 1377 1966 485 449 934 2.34 0.93<br />
12 447 1094 1541 440 483 923 2.45 1.10<br />
13 442 1130 1572 380 307 687 2.56 0.81<br />
14 1302 2136 3438 676 547 1223 1.64 0.81<br />
15 811 1628 2439 480 397 877 2.01 0.83<br />
16 1469 3217 4686 1143 984 2127 2.19 0.86<br />
17 403 1015 1418 357 253 610 2.52 0.71<br />
18 1869 3663 5532 709 708 1417 1.96 1.00<br />
19 2463 4964 7427 1039 839 1878 2.02 0.81<br />
20 1677 3096 4773 1153 673 1826 1.85 0.58<br />
Total 22158 51189 73347 13977 11605 25582 50.811 16.97
Teacher <strong>Related</strong> <strong>Indicators</strong><br />
Table : T1 Percentage of Female Teacher : Level Wise<br />
:<br />
LEVEL Management 2004-05 2005-06 2006-07 2007-08<br />
Total(P) Teachers 1005 1069 968 1198<br />
Total(P) (F) Teachers 790 825 746 879<br />
GOVERNMENT %AGE (P) (F) Teachers 78.6 77.1 77 73.3<br />
Total(P) Teachers 66 78 56 36<br />
Total(P) (F) Teachers 56 68 47 22<br />
AIDED %AGE (P) (F) Teachers 84.8 87.1 83.9 61.1<br />
Total(P) Teachers 685 695 728 1035<br />
Total(P) (F) Teachers 645 653 686 972<br />
PRIVATE %AGE (P) (F) Teachers 94.1 93.9 94.2 93.9<br />
%age of Female Teachers Pry.<br />
100<br />
80<br />
%age<br />
Govt<br />
Aided<br />
Pvt.<br />
60<br />
40<br />
20<br />
0<br />
2004-05 2005-06 2006-07 2007-08<br />
Year<br />
73.3 % of Total Teachers teaching primary classes are Female in Govt. <strong>School</strong>s<br />
Table : T2 Percentage of Female Teacher at Upper Primary Level<br />
LEVEL Management 2004-05 2005-06 2006-07 2007-08<br />
Total(UP) Teachers 1463 1602 1458 1335<br />
Total(UP) (F) Teachers 1158 1237 1132 1008<br />
GOVERNMENT<br />
%AGE<br />
(UP) (F) Teachers 79.1 77.2 77.6 75.5<br />
Total(UP) Teachers 99 144 127 98<br />
Total(UP) (F) Teachers 75 116 98 69<br />
AIDED<br />
%AGE<br />
(UP) (F) Teachers 75.7 80.5 77.1 70.4<br />
Total(UP) Teachers 603 668 680 764<br />
Total(UP) (F) Teachers 554 612 621 703<br />
PRIVATE<br />
%AGE<br />
(UP) (F) Teachers 91.8 91.6 91.3 92
%age of Female Teacher (U.pry)<br />
100<br />
%age<br />
50<br />
Govt<br />
Aided<br />
Pvt.<br />
0<br />
2004-05 2005-06 2006-07 2007-08<br />
Year<br />
Table : T3 Percentage of Female Teacher at Elementary Level<br />
LEVEL Management 2004-05 2005-06 2006-07 2007-08<br />
Total(E) Teacher 2468 2671 2426 2533<br />
Total(E) (F) Teachers 1948 2062 1878 1887<br />
GOVERNMENT<br />
%AGE<br />
(E) (F) Teachers 78.9 77.2 77.4 74.5<br />
Total(E) Teachers 165 222 183 134<br />
Total(E) (F) Teachers 131 184 145 91<br />
AIDED<br />
%AGE<br />
(E) (F) Teachers 79.3 82.8 79.2 67.9<br />
Total(E) Teachers 1288 1363 1408 1799<br />
Total(E) (F) Teachers 1199 1265 1307 1675<br />
`PRIVATE<br />
%AGE<br />
(E)<br />
(F)<br />
Teachers 93 92.8 92.8 93.1<br />
Govt<br />
Aided<br />
Pvt.<br />
%age<br />
100<br />
80<br />
60<br />
40<br />
20<br />
0<br />
%age of Female Teacher (Elem)<br />
2004-05 2005-06 2006-07 2007-08<br />
Year<br />
Teacher Pupil ratio at <strong>Chandigarh</strong> is significantly high for all the years and for<br />
all the management of school. Private schools ranks top in which 93.1 % of<br />
teachers are females in the year 2007-08.
Table :T4 Pupil Teacher Ratio<br />
2004-05 2005-06 2006-07 2007-08<br />
Primary 42.2 45.5 52.3 48<br />
U.Pry. 16.5 15.9 17.9 22.9<br />
Elementary 34.7 31.6 27.8 27<br />
PTR in Govt <strong>School</strong>s<br />
60<br />
50<br />
40<br />
PTR 30<br />
20<br />
10<br />
0<br />
Primary<br />
U.Pry.<br />
Elementary<br />
2004-05 2005-06 2006-07 2007-08<br />
Year<br />
The Pupil Teacher Ration at primary is high at 48. The PTR at Upper Primary is at<br />
22.9. The Gap exists because of state’s policy of having subject teachers in upper<br />
primary.<br />
T5 : Pupil Teacher Ratio : Ward Wise<br />
Teacher<br />
Teacher Enr PTR Teacher Enr PTR<br />
Wards (P+UP) Enr.(1..8) PTR (P) (1..5) (P) (UP) (6..8) (UP)<br />
1 136 4842 36 54 2878 53 82 1964 24<br />
2 78 2578 33 35 1657 47 43 921 21<br />
3 79 2040 26 28 1073 38 51 967 19<br />
4 76 1782 23 28 1049 37 48 733 15<br />
5 143 5447 38 84 3552 42 59 1895 32<br />
6 197 6577 33 88 4074 46 109 2503 23<br />
7 211 8618 41 116 5797 50 95 2821 30<br />
8 197 6501 33 88 4166 47 109 2335 21<br />
9 83 2858 34 31 1585 51 52 1273 24<br />
10 78 4128 53 72 3196 44 6 932 155<br />
11 103 2507 24 27 1461 54 76 1046 14<br />
12 97 2019 21 23 1042 45 74 977 13<br />
13 81 2017 25 18 1176 65 63 841 13<br />
14 132 4630 35 69 3324 48 63 1306 21<br />
15 80 2913 36 25 1923 77 55 990 18<br />
16 173 6037 35 80 3624 45 93 2413 26<br />
17 79 1794 23 25 1079 43 54 715 13<br />
18 132 6194 47 64 4478 70 68 1716 25<br />
19 232 8430 36 146 6114 42 86 2316 27<br />
20 146 6545 45 97 4595 47 49 1950 40<br />
Total 2533 88457 35 1198 57843 48 1335 30614 23
Table : T6<br />
Profession Qualification of Teachers :Management Wise<br />
J.B.T S.V/ B.Ed M.Ed Others Total<br />
C.T/ EQ. EQ. Eq.<br />
Government <strong>School</strong>s 810 57 1834 270 127 3098<br />
Govt. Aided <strong>School</strong>s 17 5 112 12 3 149<br />
Private <strong>School</strong>s 176 80 1624 93 57 2030<br />
Misc K.V,N.V,A.Force 5 7 183 38 4 237<br />
All Management 1008 149 3753 413 191 5514<br />
Table T7 : Professional Qualification Wise Share in Different Management of<br />
<strong>School</strong>.<br />
J.B.T S.V/ B.Ed M.Ed Others<br />
C.T/ EQ. EQ. Eq.<br />
Government <strong>School</strong>s 80.4 38.3 48.9 65.4 66.5<br />
Govt. Aided <strong>School</strong>s 1.7 3.4 3.0 2.9 1.6<br />
Private <strong>School</strong>s 17.5 53.7 43.3 22.5 29.8<br />
Misc K.V,N.V,A.Force 0.5 4.7 4.9 9.2 2.1<br />
Total 100.0 100.0 100.0 100.0 100.0<br />
A large proportion of JBT teachers are in Govt. <strong>School</strong>s.<br />
Table T8 : Share of Various types of Professional Qualification in different<br />
Management of <strong>School</strong><br />
J.B.T S.V/ B.Ed M.Ed Others Total<br />
C.T/ EQ. EQ. Eq.<br />
Government <strong>School</strong>s 26.1 1.8 59.2 8.7 4.1 100.0<br />
Govt. Aided <strong>School</strong>s 11.4 3.4 75.2 8.1 2.0 100.0<br />
Private <strong>School</strong>s 8.7 3.9 80.0 4.6 2.8 100.0<br />
Misc K.V,N.V,A.Force 2.1 3.0 77.2 16.0 1.7 100.0<br />
K.V , N.V and Airforce schools have the highest proportion (16.0 %) of their<br />
Teaching Work force at elementary level , having M.Ed Qualification.
Table T9 : Percentage of Female Teachers at <strong>Chandigarh</strong><br />
All Management<br />
Government <strong>School</strong>s<br />
Government<br />
Aided<strong>School</strong>s<br />
Total<br />
Teacher<br />
(P+UP)<br />
Female<br />
Teacher<br />
%age of<br />
Female<br />
Teacher<br />
Total<br />
Teacher<br />
(P+UP)<br />
Female<br />
Teacher<br />
%age of<br />
Female<br />
Teacher<br />
Total<br />
Teacher<br />
(P+UP)<br />
Female<br />
Teacher<br />
%age of<br />
Female<br />
Teacher<br />
Wards<br />
1 264 209 79% 134 100 75% 41 24 59%<br />
2 136 109 80% 89 66 74% 0 0 0%<br />
3 140 123 88% 74 61 82% 0 0 0%<br />
4 88 69 78% 70 55 79% 6 2 33%<br />
5 164 105 64% 148 95 64% 0 0 0%<br />
6 381 323 85% 204 157 77% 0 0 0%<br />
7 335 266 79% 204 141 69% 0 0 0%<br />
8 339 296 87% 200 163 82% 0 0 0%<br />
9 239 195 82% 85 71 84% 15 13 87%<br />
10 201 182 91% 49 42 86% 0 0 0%<br />
11 143 125 87% 98 83 85% 0 0 0%<br />
12 160 142 89% 93 79 85% 15 14 93%<br />
13 212 201 95% 81 73 90% 0 0 0%<br />
14 346 295 85% 133 106 80% 22 8 0%<br />
15 164 131 80% 80 58 73% 0 0 0%<br />
16 515 462 90% 188 158 84% 23 18 78%<br />
17 202 171 85% 75 62 83% 0 0 0%<br />
18 159 108 68% 123 75 61% 0 0 0%<br />
19 234 143 61% 234 143 61% 0 0 0%<br />
20 181 118 65% 149 89 60% 12 12 100%<br />
Total 4603 3773 82% 2511 1877 75% 134 91 68%<br />
82 % of all teachers are female teachers. 75% of all teachers of Government <strong>School</strong>s<br />
are Female Teachers while 68% of all teachers of Government aided schools are<br />
female teachers. Ward 12 scores top rank in ratio of female teachers in Government<br />
<strong>School</strong>, I,e 90% while in ward 20 it is only 60%.<br />
Male vs Female Teachers in All<br />
category of <strong>School</strong>s<br />
Male Vs Female Teachers in<br />
Govt. <strong>School</strong>s<br />
Male Female Teachers in Aided <strong>School</strong>s<br />
Female<br />
Teacher<br />
Male Teacher<br />
Female<br />
Teacher<br />
Male<br />
Teacher<br />
Female Teacher<br />
Male Teacher
Outcome <strong>Related</strong> <strong>Indicators</strong><br />
Table : O1 Transition Rate : Management Wise<br />
Management Gender 2005-06 2006-07 2007-08<br />
(Govt) 110.3 105.2 108.7<br />
(Aided) 145.1 78.6 193.7<br />
Boys<br />
(Pvt) 110.9 122.6 94.9<br />
(All)<br />
112.6 107.2 105.5<br />
(Govt) 107.9 104.1 109.3<br />
(Aided) 166 86.8 139.3<br />
Girls<br />
(Pvt) 127.3 112 93<br />
(All)<br />
116.7 104.1 104.7<br />
(Govt) 109.2 104.7 109<br />
(Aided) 154.9 82.3 162.7<br />
Total<br />
(Pvt) 117.7 117.9 94.1<br />
(All)<br />
114.4 105.8 105.1<br />
The Transition rate in private schools has decreased over past three years. As a result<br />
of switch over from private to govt. schools .The transition rate of govt. schools is<br />
above 100 which clearly shows that a sizeable no. of students prefer govt. schools<br />
after primary level. Also , at primary classes parents of students prefer private<br />
schools. Also a very strong and significant trend of preference.<br />
O2 :<br />
Transition Rate : Location Wise<br />
Management Location 2005-06 2006-07 2007-08<br />
(Govt) 72.4 101.8 69.4<br />
(Aided) 139.3 97.7 168.9<br />
(Pvt) 91.3 55.4 44.1<br />
(All)<br />
76.5 99.8 71.4<br />
(Govt) 122 105.6 128.7<br />
(Aided) 160.8 77.6 160.5<br />
(Pvt) 116.9 120.7 94.8<br />
(All)<br />
122.5 107.3 114.6<br />
(Govt) 109.2 104.7 109<br />
(Aided) 154.9 82.3 162.7<br />
(Pvt) 117.7 117.9 94.1<br />
(All)<br />
114.4 105.8 105.1<br />
Rural<br />
Urban<br />
Total
The transition rate in rural area is significantly lower than the transition rate in urban<br />
area showing that a large proportion of students prefer to get themselves enrolled in<br />
schools of urban area. <strong>Chandigarh</strong> is a small union territory surrounded by the<br />
boundaries of Punjab & Haryana , a large no. of migration take place from the above<br />
cited states to <strong>Chandigarh</strong>.<br />
Table O3 : Pass Percentage Percentage in Primary Sections<br />
Pry Sections in Sr.Sec Boys Girls Total<br />
Pass %age Pry. 93.17 96.03 94.43<br />
Pass %age U.Pry 84.13 84.5 88.43<br />
Pry Sections in High <strong>School</strong> Boys Girls Total<br />
Pass %age Pry. 89.89 94.37 91.89<br />
Pass %age U.Pry 79.22 77.23 83.4<br />
Pry Sections in primary <strong>School</strong> Boys Girls Total<br />
Pass %age Pry. 95.19 95.34 95.26<br />
Pass %age U.Pry 80.79 85.59 97.75<br />
Table : O4 Pass Percentage at Primary level in 2007-08<br />
Particular Boys Girls Total<br />
Pass %age Govt 91.61 94.99 93.15<br />
Pass %age Aided 91.26 94.51 92.85<br />
Pass %age Private 92.99 94.06 93.47<br />
Pass %age Others 92.98 93.4 93.17<br />
95<br />
Pass percentage at Primary Level<br />
%age<br />
Boys<br />
Girls<br />
Total<br />
94<br />
93<br />
92<br />
91<br />
90<br />
89<br />
Govt Aided Private Others<br />
Management
Pass percentage Private schools is marginally higher than pass percentage of<br />
Govt <strong>School</strong>s. The pass percentage of Girls is higher than the pass percentage of<br />
boys irrespective of management.<br />
Table : O5 Pass Percentage at Primary level in 2007-08<br />
Boys Girls Total<br />
Govt 81.36 80.53 84.51<br />
Aided 69.85 69.61 74.65<br />
Private 92.2 90.64 100.47<br />
Others 85.39 83.69 84.64<br />
%Age of Children getting More than 60% at<br />
Primary Level<br />
Boys<br />
Girls<br />
Total<br />
%age<br />
70<br />
60<br />
50<br />
40<br />
30<br />
20<br />
10<br />
0<br />
Govt Aided Private Others<br />
Management<br />
Table O6 : Percentage of Children Getting more than 60 % At<br />
Primary Level<br />
Boys Girls Total<br />
Govt 32.61 41.05 36.46<br />
Aided 35.53 46.34 40.81<br />
Private 57.44 60.26 58.69<br />
Others 45.21 49.71 47.17<br />
%Age of Children getting More than 60% at<br />
Primary Level<br />
Boys<br />
Girls<br />
Total<br />
%age<br />
70<br />
60<br />
50<br />
40<br />
30<br />
20<br />
10<br />
0<br />
Govt Aided Private Others<br />
Management<br />
Percentage of children gettim more than 60 % marks is much higher in Private<br />
schools as compared to Govt , Aided and others. This is because of the fact that<br />
the children of elicit class prefer private schools , while the Govt. and Aided<br />
support the lower income group. The parents of the higher income group are<br />
highly educated . They provide support at home.
Table : O7 Percentage of Children Getting more than 60 % At<br />
U.Primary Level 2007-08<br />
Boys Girls Total<br />
Govt 33.78 38.08 37.41<br />
Aided 15.01 21.55 19.34<br />
Private 51.33 57.77 59.59<br />
Others 36.1 35.12 35.65<br />
%age of Children Getting more than 60% at U.Pry<br />
%age<br />
60<br />
50<br />
40<br />
30<br />
20<br />
10<br />
0<br />
Govt Aided Private Others<br />
Managment<br />
Boys<br />
Girls<br />
Total<br />
Table :O8 Pass Percentage in Government <strong>School</strong> At Primary & U.Pry. Level :<br />
MODEL & NON Model<br />
Particular Level Boys Girls Total<br />
Pass %age Non Model 91.4 94.19 92.69<br />
Pass %age Model Pry. 91.83 95.9 93.65<br />
Pass %age Non Model 76.8 75.39 76.14<br />
Pass %age Model U.Pry 85.6 85.15 88.33<br />
Pass %age Urban 91.4 95.14 93.07<br />
Pass %age Rural Pry. 92.62 94.34 93.46<br />
Pass %age Urban 82.91 82.05 82.5<br />
Pass %age Rural U.Pry 70.88 72.34 71.66
Pass Percentage in Model and Non Model<br />
<strong>School</strong>s<br />
%age<br />
96<br />
95<br />
94<br />
93<br />
92<br />
91<br />
90<br />
89<br />
Boys Girls Total<br />
Non Model<br />
Model<br />
Gender<br />
Note : The analysis is based on Supplementary Variable of DISE : Model / Non Model<br />
Table O9 :Percentage of Children Getting More than 60% Marks : Govt.<br />
<strong>School</strong>s : Model & Non model : Level Wise<br />
Particular Level Boys Girls Total<br />
Pass %age Non<br />
Model 28.5 35.77 31.87<br />
Pass %age Model Pry. 36.94 46.97 41.42<br />
Pass %age Non<br />
Model 30.26 32.97 31.55<br />
Pass %age Model U.Pry 37.06 42.67 41.14<br />
Pass %age Urban 34.11 41.5 37.42<br />
Pass %age Rural Pry. 27.31 36.98 32.03<br />
Pass %age Urban 36.44 40.98 38.57<br />
Pass %age Rural U.Pry 15.51 22.75 19.4<br />
Table 10 : Class Wise Number of Repeaters.<br />
<strong>School</strong> Management : Department of education<br />
Repeaters by type<br />
% Repeaters to total enrolment<br />
Cls<br />
Total<br />
Long<br />
% Long % Total<br />
enrolment Failure absentees % Failures absentees repeaters<br />
Boys Girls Boys Girls Boys Girls Boys Girls Boys Girls Boys Girls<br />
1 5553 4411 161 113 193 122 2.9 2.56 3.48 2.77 6.37 5.33<br />
2 5780 4853 121 100 209 154 2.09 2.06 3.62 3.17 5.71 5.23<br />
3 5528 4736 141 76 155 132 2.55 1.6 2.8 2.79 5.35 4.39<br />
4 5386 4527 155 95 107 85 2.88 2.1 1.99 1.88 4.86 3.98<br />
5 5585 4567 349 186 113 81 6.25 4.07 2.02 1.77 8.27 5.85<br />
6 5263 4480 589 354 78 50 11.19 7.9 1.48 1.12 12.67 9.02<br />
7 4603 3897 500 301 76 57 10.86 7.72 1.65 1.46 12.51 9.19<br />
8 4191 3803 584 486 55 38 13.93 12.78 1.31 1 15.25 13.78<br />
Total 41889 35274 2600 1711 986 719 6.21 4.85 2.35 2.04 8.56 6.89<br />
Note :Being small in numbers , Readmissions have not been Shown here.
Table : O11 Number of Repeaters At Primary Level : Management Wise<br />
Management 2004-05 2005-06 2006-07 2007-08<br />
(Govt) All 1852 2080 2916 3031<br />
(Pvt.) All 63 42 46 81<br />
(Aided) All 135 125 111 173<br />
(All ) All 2050 2247 3073 3285<br />
(Govt) Rural 417 527 1234 793<br />
(Govt) Urban 1435 1553 1682 2238<br />
(Govt) Boys 1111 1290 1745 1945<br />
(Govt) Girls 741 790 1171 1086<br />
Number of Repeaters<br />
No.<br />
(Govt) All<br />
(Pvt.) All<br />
(Aided) All<br />
3500<br />
3000<br />
2500<br />
2000<br />
1500<br />
1000<br />
500<br />
0<br />
2004-05 2005-06 2006-07 2007-08<br />
Year<br />
Repeaters at primary level has been increasing ever since 2004-05 in govt. <strong>School</strong>s<br />
particularily in govt. schools located in urban area. It indicates that some of the<br />
children who got mainstreamed are not able to cope up with their studies inspite of the<br />
best efforts of teachers or they stop coming to school because of livelihood<br />
compulsions .<br />
Table : O12 Repetition Rate in Primary <strong>School</strong>s : Location Wise<br />
Management 2004-05 2005-06 2006-07 2007-08<br />
(Govt) All 4.3 4.2 5.7 5.2<br />
(Pvt.) All 2.8 1.4 3.3 5.3<br />
(Aided) All 0.7 0.6 0.4 0.7<br />
(All ) All 3.1 2.9 3.7 3.8<br />
Rural 3.6 4.2 6.8 5.4<br />
Urban 4.6 4.2 5.1 5.2<br />
Boys 4.8 4.9 6.2 6.1<br />
(Govt) Girls 3.8 3.5 5 4.1
Repetition Rate At Primary Level<br />
6<br />
5<br />
4<br />
Rate 3<br />
2<br />
1<br />
(Govt)<br />
0<br />
(Pvt.)<br />
(Aided)<br />
2004-05 2005-06 2006-07 2007-08<br />
Year<br />
Table : O13 Repeaters at Upper Primary Level<br />
Management 2004-05 2005-06 2006-07 2007-08<br />
(Govt) All 2749 2961 3366 3205<br />
(Pvt.) All 148 112 48 121<br />
(Aided) All 303 219 159 203<br />
(All ) All 3231 3292 3573 3529<br />
(Govt) Rural 247 450 1048 828<br />
(Govt) Urban 2502 2511 2318 2377<br />
(Govt) Boys 1618 1700 1995 1814<br />
(Govt) Girls 1131 1261 1371 1391<br />
Table : O14 Repetition Rate at Upper Primary Level.<br />
Management 2004-05 2005-06 2006-07 2007-08<br />
(Govt) All 7.6 8.1 11.1 9.9<br />
(Pvt.) All 3.5 2.1 2.9 4.7<br />
(Aided) All 1.2 1 0.7 1.2<br />
(All ) All 5.3 5.2 6.9 6.7<br />
Rural 10.1 12.6 20.3 13.1<br />
Urban 7.1 7.2 8.3 9.1<br />
(Govt) Boys 8.6 9.4 12.4 11.7<br />
Girls 6.5 6.5 9.6 7.7
Table : O15 Repeaters at Elementary Level :<br />
Management 2004-05 2005-06 2006-07 2007-08<br />
(Govt) All 4601 5041 6282 6236<br />
(Pvt.) All 211 154 94 202<br />
(Aided) All 438 344 270 376<br />
(All ) All 5281 5539 6646 6814<br />
(Govt) Rural 664 977 2282 1621<br />
(Govt) Urban 3937 4064 4000 4615<br />
(Govt) Boys 2729 2990 3740 3759<br />
(Govt) Girls 1872 2051 2542 2477<br />
Table 016: Pass percentage of Class V In Govt <strong>School</strong>s. : Ward Wise<br />
Boys Girls Girls Boys<br />
Ward Enr. App. Pass >60% Enr. Appear Passed >60%<br />
Pass<br />
%<br />
Pass<br />
%<br />
1 600 600 534 175 491 491 450 180 91.65 89<br />
2 147 147 138 53 142 142 139 49 97.89 93.88<br />
3 173 170 159 55 103 103 101 59 98.06 93.53<br />
4 148 141 137 49 121 113 110 34 97.35 97.16<br />
5 497 448 336 39 368 358 303 49 84.64 75<br />
6 401 395 362 121 297 296 274 97 92.57 91.65<br />
7 470 456 448 143 407 410 398 187 97.07 98.25<br />
8 377 371 356 99 296 291 285 127 97.94 95.96<br />
9 207 190 176 66 152 144 144 64 100 92.63<br />
10 217 205 196 59 181 179 171 74 95.53 95.61<br />
11 156 153 143 65 153 149 143 70 95.97 93.46<br />
12 121 121 117 59 109 107 105 62 98.13 96.69<br />
13 133 130 124 69 113 110 107 71 97.27 95.38<br />
14 328 305 267 71 269 256 233 76 91.02 87.54<br />
15 166 160 152 32 128 125 122 15 97.6 95<br />
16 417 404 383 177 370 363 343 175 94.49 94.8<br />
17 72 72 63 40 67 67 64 50 95.52 87.5<br />
18 313 305 270 36 299 297 278 73 93.6 88.52<br />
19 370 359 316 106 382 375 348 157 92.8 88.02<br />
20 227 224 214 64 179 177 175 72 98.87 95.54<br />
Total 5540 5356 4891 1578 4627 4553 4293 1741 94.29 40.55
100<br />
90<br />
80<br />
70<br />
60<br />
%age 50<br />
40<br />
30<br />
20<br />
10<br />
0<br />
Girls<br />
Boys<br />
Pass %age in Class V<br />
1 3 5 7 9 11 13 15 17 19<br />
Wards<br />
The Pass Percentage in Ward 5 is the lowest of all.<br />
Table O 17 Pass percentage of Class VIII Govt <strong>School</strong>s. : Ward Wise<br />
Ward Enr. Appear Passed >60% Enr. Appear Passed >60%<br />
Pass<br />
%<br />
Pass<br />
%<br />
1 428 424 368 144 430 429 355 148 82.75 86.79<br />
2 135 135 111 26 146 146 118 34 80.82 82.22<br />
3 216 216 182 117 157 157 133 86 84.71 84.26<br />
4 140 137 73 13 132 131 66 6 50.38 53.28<br />
5 246 242 155 35 221 217 146 65 67.28 64.05<br />
6 409 405 314 88 384 383 302 144 78.85 77.53<br />
7 379 375 226 66 355 354 257 80 72.6 60.27<br />
8 299 294 223 61 289 289 201 56 69.55 75.85<br />
9 190 220 180 98 155 155 140 78 90.32 81.82<br />
10 0 120 79 26 0 106 73 30 68.87 65.83<br />
11 170 170 162 85 184 184 164 87 89.13 95.29<br />
12 134 134 128 56 129 129 120 77 93.02 95.52<br />
13 144 142 120 42 102 101 74 27 73.27 84.51<br />
14 182 178 139 42 171 171 120 45 70.18 78.09<br />
15 146 142 96 26 133 133 101 31 75.94 67.61<br />
16 333 331 282 106 249 248 206 107 83.06 85.2<br />
17 86 86 9 6 80 80 18 11 22.5 10.47<br />
18 185 185 136 27 201 199 140 47 70.35 73.51<br />
19 218 217 187 64 226 226 156 70 69.03 86.18<br />
20 132 129 105 31 72 72 55 22 76.39 81.4<br />
Total 4172 4282 3275 1159 3816 3910 2945 1251 75.32 76.48
Pass Percentage of Class VIII in Govt <strong>School</strong>s<br />
%age<br />
100<br />
90<br />
80<br />
70<br />
60<br />
50<br />
40<br />
30<br />
20<br />
10<br />
0<br />
1 3 5 7 9 11 13 15 17 19<br />
Girls<br />
Boys<br />
wards<br />
Ward 17 has lowest pass percentage.