3G & 4G Mobile Communication Systems - Department of ...
3G & 4G Mobile Communication Systems - Department of ...
3G & 4G Mobile Communication Systems - Department of ...
- No tags were found...

Create successful ePaper yourself
Turn your PDF publications into a flip-book with our unique Google optimized e-Paper software.
<strong>3G</strong>/<strong>4G</strong> <strong>Mobile</strong> <strong>Communication</strong>s <strong>Systems</strong><br />
Dr. Stefan Brück<br />
Qualcomm Corporate R&D Center Germany
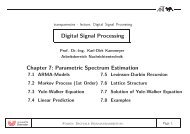
Chapter VII:<br />
Fundamental Radio<br />
Resource Management<br />
2<br />
Slide 2
Fundamental Radio Resource Management<br />
Scope <strong>of</strong> Radio Resource Management<br />
Radio Resource Management in UMTS<br />
Cell Breathing<br />
Capacity – Coverage Trade-<strong>of</strong>f<br />
Power Control<br />
Near Far Problem<br />
Inner and outer loop power control<br />
Load Control<br />
Spreading Code Management in HSDPA<br />
Examples <strong>of</strong> HSDPA and HSUPA Performance<br />
Radio Resource Management in LTE<br />
LTE UL Power Control<br />
Inter Cell Interference Coordination in LTE<br />
Flexible Frequency Reuse<br />
Heterogeneous Deployments<br />
Enhanced Inter Cell Interference Coordination in LTE<br />
Almost Blank Subframes (ABS)<br />
3<br />
Slide 3
RRM – High-Level Requirements<br />
Efficient use <strong>of</strong> limited radio resources (power, code space, spectrum, time)<br />
Minimizing interference<br />
Flexibility regarding services (Quality <strong>of</strong> Service, user behaviour)<br />
Simple algorithms requiring small signalling overhead only<br />
Stability and overload protection<br />
Self adaptive in varying environments<br />
Allow interoperability in multi-vendor environments<br />
Radio Resource Management<br />
algorithms control the efficient<br />
use <strong>of</strong> resources with respect to<br />
interdependent objectives:<br />
cell coverage<br />
cell capacity<br />
quality <strong>of</strong> service<br />
4<br />
Slide 4
Context <strong>of</strong> Radio Resource Management<br />
System evaluation and standardisation activities on three levels:<br />
(E)-UTRAN<br />
Interfaces<br />
Architecture<br />
• Access Network (Architecture)<br />
• Mobility Management<br />
Cellular Network<br />
Protocols<br />
• Cellular Network Aspects (Layer 2&3)<br />
• Radio Resource Management<br />
• Radio Link (Physical Layer)<br />
5<br />
Slide 5
Radio Resource Management Components<br />
Non-Access Stratum<br />
Radio Resource Management<br />
Handover<br />
Control<br />
Load<br />
Control<br />
Packet Data<br />
Control<br />
Power<br />
Control<br />
Medium<br />
Access<br />
Control<br />
Physical layer<br />
6<br />
Slide 6
Example <strong>of</strong> Coverage and Best Server Map<br />
coverage map<br />
best server map<br />
Application: RF engineering (cell layout)<br />
Legend: red indicates high signal level, yellow<br />
indicates low level<br />
Application: HO decision<br />
Legend: color indicates cell with best<br />
CPICH in area<br />
7<br />
Slide 7
Interference in CDMA Networks<br />
Interference<br />
Multiple Access Interference<br />
Intra-Cell Interference<br />
Inter-Cell Interference<br />
Problem<br />
Different users interfere dependent on<br />
the access scheme (T/F/CDMA)<br />
Interference caused by users belonging<br />
to the same cell<br />
Interference caused by users belonging<br />
to other cells<br />
Frequency reuse factor = 1<br />
CDMA is subject to high Multiple Access Interference (MAI)<br />
MAI can be separated in intra-cell and inter-cell interference<br />
S<strong>of</strong>t capacity: CDMA capacity (max. number <strong>of</strong> users) determined by<br />
interference is s<strong>of</strong>t<br />
TDMA capacity is given by available number <strong>of</strong> time slots<br />
Handling <strong>of</strong> interference is the main challenge in designing CDMA networks<br />
8<br />
Slide 8
Interference in CDMA - Uplink<br />
9<br />
Slide 9
Interference in CDMA - Downlink<br />
10<br />
Slide 10
Cell Breathing in CDMA<br />
Specified service specific C/I needs to be maintained at receiver to<br />
guarantee QoS<br />
Growth <strong>of</strong> traffic leads to an increase in interference power<br />
Both inter-cell and intra-cell power<br />
If transmitter power cannot be further increased (max. link power), maximum<br />
cell size decreases since specific C/I at far receiver is required<br />
Load dependent maximum cell is referred to as cell breathing<br />
As network load changes over day, also the maximum cell size changes over<br />
day<br />
Especially during busy hours the interference rises ⇒ small cell size<br />
Breathing is determined by intra-cell interference<br />
⇒ Active Load Control is needed<br />
11<br />
Slide 11
Cell Breathing<br />
Coverage depending on load: Load causes interference which reduces the<br />
area where a SIR sufficient for communication can be provided<br />
Coverage low load Coverage medium load Coverage high load<br />
Yellow area: Connection may drop or be blocked<br />
12<br />
Slide 12
Coverage vs. Capacity<br />
Capacity depends on:<br />
QoS <strong>of</strong> the users (data rate, error performance (bit-error-rate))<br />
User behaviour (activity)<br />
Interference (intra- & inter-/noise)<br />
Number <strong>of</strong> carriers/ sectors<br />
Coverage (service area) depends on:<br />
Interference (intra- & inter-cell) + noise<br />
Pathloss (propagation conditions)<br />
QoS <strong>of</strong> the users (data rate, error performance (bit-error-rate))<br />
Thus, trade-<strong>of</strong>f between capacity and coverage<br />
13<br />
Slide 13
Coverage vs. Capacity<br />
3.5<br />
13kbps circuit switched service capacity versus maximum cell radius<br />
3<br />
Maximum cell radius (km)<br />
2.5<br />
2<br />
1.5<br />
1<br />
←Downlink<br />
0.5<br />
Uplink→<br />
0<br />
0 20 40 60 80 100 120 140 160 180 200<br />
Erlangs (2% GOS)<br />
Downlink limits capacity while uplink limits coverage<br />
Downlink depends more on the load (user share total transmit BS power)<br />
14<br />
Slide 14
CDMA Power Control: Basics<br />
<br />
<br />
<br />
<br />
Controls the setting <strong>of</strong> the transmit power in order to:<br />
<br />
<br />
Keep the QoS within the required limits, e.g. data rate, delay and BER<br />
Minimise interference, i.e. the overall power consumption<br />
Power control handles:<br />
<br />
<br />
Path Loss (Near-Far-Problem), Shadowing (Log-Normal-Fading) and Fast<br />
Fading (Rayleigh-, Ricean-Fading)<br />
Environment (delay spread, UE speed, …) which implies different performance<br />
<strong>of</strong> the deinterleaver and decoder<br />
Three types <strong>of</strong> power control:<br />
<br />
<br />
<br />
Inner loop power control<br />
Outer loop power control (SIR-target adjustment)<br />
Open loop power control (Power allocation)<br />
Downlink power overload control to protect amplifier<br />
<br />
<br />
Gain Clipping (GC)<br />
Aggregated Overload Control (AOC)<br />
15<br />
Slide 15
Near-Far Problem in CDMA<br />
UE 1<br />
Near-Far Problem:<br />
Spreading sequences are not orthogonal<br />
(multi-user interference)<br />
Near mobile dominates<br />
Signal to interference ratio (SIR) is lower for far<br />
mobiles and performance degrades<br />
NodeB<br />
Problem can be resolved through dynamic<br />
power control to equalize all received power levels<br />
AND/OR: By means <strong>of</strong> joint multi-user detection (MUD)<br />
UE 2<br />
16<br />
Slide 16
Impact <strong>of</strong> Power Control<br />
Source: H. Holma, A. Toskala (Ed.), “WCDMA for UMTS”,<br />
17<br />
Slide 17
Power Control Results<br />
7.5<br />
7<br />
Required UL SIR [dB]<br />
6.5<br />
6<br />
5.5<br />
5<br />
PedA<br />
VehA<br />
0 20 40 60 80 100 120<br />
Velocity [km/h]<br />
SIR requirement strongly depends on the environment (due to different fast<br />
fading conditions – Jakes models)<br />
⇒ Outer loop power control needed to adapt SIR<br />
18<br />
Slide 18
Closed Loop Power Control in UMTS<br />
Closed loop power control is used on channels which are established in both<br />
directions, such as DCH<br />
The receiver generates transmit power commands (TPC) based on the<br />
estimated received quality; the TPC are send back to the transmitter in the<br />
opposite direction<br />
The transmit power is adjusted according to the received TPC<br />
User data<br />
PA<br />
Receiver<br />
Decoder<br />
User data<br />
TPC<br />
commands<br />
Inner loop<br />
Outer<br />
loop<br />
SIR-estimate<br />
TPC<br />
commands<br />
BLER-estimate<br />
Adjust SIR target<br />
DeMUX<br />
MUX<br />
19<br />
<strong>Mobile</strong> Station<br />
Base Station/RNC<br />
Slide 19
Inner/Outer Loop Power Control<br />
<br />
<br />
Inner Loop Power Control (1500 Hz)<br />
<br />
<br />
Objective: Adjust transmit power to keep the received SIR at a given SIR target<br />
Realisation using the SIR-estimate after RAKE combining:<br />
<br />
<br />
If SIR est > SIR target , then generate TPC “DOWN”<br />
If SIR est ≤ SIR target , then generate TPC “UP”<br />
Realisation in base station (Node B)<br />
<br />
Similar mechanisms for up- and downlink<br />
Outer Loop Power Control (100 Hz max)<br />
<br />
<br />
<br />
Objective: Meet the required reception quality, e.g. average BLER<br />
Realisation using the CRC attachment<br />
<br />
<br />
If CRC ok, then decrease SIR target = SIR target – ∆ down<br />
If CRC fails, then increase SIR target = SIR target + ∆ up<br />
∆ down = ∆ up × BLER target / (1–BLER target )<br />
Realisation in radio network controller (RNC)<br />
20<br />
Slide 20
Load Control: Basics<br />
General limitations in 3 rd generation mobile systems:<br />
Limited resources: spectrum, power, (code space)<br />
Not all service requests can be granted<br />
Different types <strong>of</strong> services in the same cellular environment<br />
Service parameters (user behaviour and QoS) and environmental conditions<br />
(propagation) vary over time<br />
CDMA-specific impacts:<br />
Coverage in CDMA systems depends on the cell loading: Cell breathing<br />
CDMA systems may become unstable in highly loaded situations<br />
due to fast inner-loop power control<br />
21<br />
Slide 21
Load Control<br />
Main objective:<br />
Avoid overload situations by controlling system load<br />
Monitor and controls radio resources <strong>of</strong> users<br />
Call Admission Control (CAC)<br />
Admit or deny new users, new radio access bearers or new radio links<br />
Avoid overload situations, e.g. by means <strong>of</strong> blocking a new call<br />
Decisions are based on interference and resource measurements<br />
Congestion Control (ConC)<br />
Monitor, detect and handle overload situations with the already connected users<br />
Bring the system back to a stable state, e.g. by means <strong>of</strong> dropping an existing call<br />
CAC and ConC decisions are based on network measurements averaged<br />
over hundreds <strong>of</strong> ms<br />
No fast fading impacts in these measurments<br />
22<br />
Slide 22
Basic Resource Equations (CDMA)<br />
R bi : data rate <strong>of</strong> user i<br />
h i : channel coefficient <strong>of</strong> user i<br />
P pilot : Pilot power<br />
F i : Orthogonality factor <strong>of</strong> user i (multipath)<br />
I th : thermal noise<br />
Downlink<br />
Quality (RAKE):<br />
E<br />
N<br />
bi<br />
t<br />
=<br />
F ⋅ h ⋅<br />
i<br />
i<br />
W Rbi<br />
⋅ hi<br />
P + P<br />
(∑ )<br />
j<br />
j<br />
pilot<br />
⋅ Pi<br />
+ I<br />
inter<br />
+ I<br />
th<br />
Resource <strong>of</strong> user i:<br />
α<br />
i<br />
=<br />
Pi<br />
P<br />
o<br />
P o<br />
: Total Transmitted Power<br />
Uplink<br />
Quality (RAKE):<br />
E<br />
N<br />
bi<br />
t<br />
W<br />
=<br />
∑ ≠<br />
Pˆ<br />
j<br />
i<br />
j<br />
R<br />
bi<br />
+ I<br />
⋅ Pˆ<br />
i<br />
inter<br />
+ I<br />
th<br />
Resource <strong>of</strong> user i:<br />
α<br />
i<br />
=<br />
Pˆ<br />
i<br />
I<br />
o<br />
=<br />
W<br />
Eb<br />
N<br />
R + E<br />
b<br />
t<br />
b<br />
N<br />
t<br />
I<br />
o<br />
: Total Interference<br />
Resource Consumption strongly depends on: data rate, quality (E b /N t ), receiver<br />
structure (RAKE etc., channel estimation, path tracking, …)<br />
Non-linear relation between resource, data rate and required E b /N t<br />
23<br />
Slide 23
Resource Consumption<br />
E b/N t [dB ]<br />
10<br />
9<br />
8<br />
7<br />
6<br />
5<br />
4<br />
3<br />
2<br />
1<br />
0<br />
Voice (12.2 kbps)<br />
BLER = 1%<br />
10 100 1000<br />
α<br />
Data Rate Rb [kbps]<br />
Data (144 kbps)<br />
BLER = 10%<br />
0,5% 1% 2% 5%<br />
10% 20% 35% 50%<br />
Service/BLER-dependent<br />
resource consumption<br />
Uplink example:<br />
Service I: Voice<br />
R b = 12.2kbps, E b /N t = 5dB<br />
α I = 0.99%<br />
Service II: Data<br />
R b = 144kbps, E b /N t = 3.1dB<br />
α II = 7.11%<br />
II<br />
with<br />
α =<br />
W<br />
( Eb<br />
Nt<br />
)<br />
R + ( E N<br />
b<br />
b<br />
W is the channel bandwidth and<br />
R b is the data rate<br />
t<br />
)<br />
24<br />
Slide 24
UL/DL Load Measures<br />
Noise Rise/ Power Rise [dB]<br />
20<br />
18<br />
16<br />
14<br />
12<br />
10<br />
8<br />
6<br />
4<br />
2<br />
0<br />
thr_CAC = 75%<br />
thr_ConC = 90%<br />
0% 10% 20% 30% 40% 50% 60% 70% 80% 90% 100<br />
%<br />
System Load<br />
UL Measurement<br />
I = ∑<br />
ˆ<br />
∈<br />
+<br />
0<br />
P<br />
i cell i<br />
+ Iinter<br />
Ith<br />
Load Estimate<br />
I − Ith<br />
ηcurrent<br />
=<br />
I<br />
NR =<br />
I<br />
0<br />
1<br />
0<br />
0<br />
I<br />
th<br />
= 1−<br />
DL Measurement<br />
P<br />
0<br />
= ∑ ∈<br />
+<br />
P<br />
i cell i<br />
P<br />
Load Estimate<br />
η<br />
current<br />
=<br />
PR =<br />
P<br />
P<br />
p<br />
NR<br />
0<br />
− P<br />
1<br />
0<br />
P<br />
0<br />
P<br />
= 1−<br />
PR<br />
25<br />
Slide 25
Call Admission Control<br />
Noise Rise/ Power Rise [dB]<br />
20<br />
18<br />
16<br />
14<br />
12<br />
10<br />
8<br />
6<br />
4<br />
2<br />
0<br />
thr_CAC<br />
η_current + α_new<br />
η_current<br />
0% 10% 20% 30% 40% 50% 60% 70% 80% 90% 100<br />
%<br />
<br />
<br />
<br />
<br />
Admitting new call always<br />
increases the cell loading<br />
CAC avoids overload by limiting<br />
this increase<br />
CAC load check:<br />
η<br />
current<br />
+ α<br />
new<br />
≤ thr<br />
CAC<br />
Threshold setting thr CAC<br />
trade-<strong>of</strong>f between<br />
Maximize capacity: prevent<br />
excessive blocking<br />
Avoid overload: thr CAC < thr ConC<br />
<br />
System Load<br />
26<br />
Slide 26
Call Admission Control (CAC)<br />
Admitting a new call always increases the cell load<br />
In order to avoid overload situations, the admission control will limit this load<br />
increase<br />
The principle is to check the current system load plus the expected resource<br />
consumption <strong>of</strong> the new call against the call admission threshold:<br />
load + consumption ≤ thr CAC <br />
In case the admission check fails, the basic strategy is to protect ongoing<br />
calls by denying the new user access to the system since dropping is<br />
assumed to be more annoying than blocking<br />
Admission control is required for uplink and downlink<br />
Arrivals <strong>of</strong> high-data-rate users that require a large amount <strong>of</strong> resources<br />
(especially in the downlink) may demand global information<br />
27<br />
Slide 27
Congestion Control<br />
Noise Rise/ Power Rise [dB]<br />
20<br />
18<br />
16<br />
14<br />
12<br />
10<br />
8<br />
6<br />
4<br />
2<br />
0<br />
NR/PR_max<br />
η_reduced<br />
η_current<br />
0% 10% 20% 30% 40% 50% 60% 70% 80% 90% 100<br />
%<br />
System Load<br />
thr_ConC<br />
Even with efficient CAC overload<br />
situations still occur due to<br />
Mobility (esp. downlink)<br />
Activity<br />
During overload quality <strong>of</strong> all<br />
users is deteriorated !<br />
Triggered by measurement<br />
η ≥<br />
current<br />
thr ConC<br />
Action: reduce <strong>of</strong>fered traffic by<br />
downgrading one user<br />
Threshold setting thr ConC to<br />
preserve the coverage:<br />
NR max : limitation <strong>of</strong> MS single<br />
transmit power P imax<br />
PR max : limitation <strong>of</strong> BTS total<br />
transmit power P 0max<br />
Slide 28<br />
28
Congestion Control (ConC)<br />
<br />
<br />
Due to the mobility (especially <strong>of</strong> high data rate users) overload situations<br />
occur even if an efficient admission control algorithm is used!<br />
The congestion control is activated once the system load exceeds the<br />
congestion threshold:<br />
load ≥ thr ConC<br />
<br />
In order to overcome the overload situation the load must be lowered until<br />
load < thr ConC<br />
<br />
<br />
This is done by reducing the <strong>of</strong>fered traffic<br />
<br />
<br />
<br />
Lowering the data rate <strong>of</strong> one or several services that are insensitive to increased<br />
delays – this might be the most preferred method<br />
Performing inter-frequency (inter-system) handover<br />
Removing one or several connections<br />
Global information may be required to minimize the number <strong>of</strong> altered<br />
connections<br />
29<br />
Slide 29
Call Admission Control: Simulation Results I<br />
Trade<strong>of</strong>f between blocking and dropping<br />
Example: 64k per user, urban<br />
50%<br />
45%<br />
40%<br />
thr_CAC = 50%<br />
thr_CAC = 75%<br />
thr_CAC = 90%<br />
20%<br />
18%<br />
16%<br />
thr_CAC = 50%<br />
thr_CAC = 75%<br />
thr_CAC = 90%<br />
Blocking Probability<br />
35%<br />
30%<br />
25%<br />
20%<br />
15%<br />
10%<br />
5%<br />
Dropping Probability<br />
14%<br />
12%<br />
10%<br />
8%<br />
6%<br />
4%<br />
2%<br />
0%<br />
5 15 25 35 45 55<br />
0%<br />
5 15 25 35 45 55<br />
Offered Traffic [Erlang per s ite ]<br />
Offered Traffic [Erlang per s ite ]<br />
30<br />
Slide 30
Call Admission Control: Simulation Results II<br />
Cell load depending on CAC threshold<br />
Example: 64k per user, urban<br />
90%<br />
80%<br />
Cell Loading<br />
70%<br />
60%<br />
50%<br />
40%<br />
30%<br />
20%<br />
10%<br />
0%<br />
5 15 25 35 45 55<br />
Offered Traffic [Erlang per site]<br />
thr_CAC = 50%<br />
thr_CAC = 75%<br />
thr_CAC = 90%<br />
31<br />
Slide 31
Packet Data Control: Channel Switching<br />
<br />
<br />
Flexibility<br />
Asymmetrical data rates<br />
Very low to very high data rates<br />
Control information/user information<br />
Efficient transmission making good use <strong>of</strong> CDMA characteristics<br />
Dedicated channel (DCH)<br />
<br />
Minimise transmission power by closed-loop power control<br />
Independence between uplink and downlink capacity<br />
Common channel<br />
Random access in the uplink (RACH)<br />
Dynamic scheduling in the downlink (FACH)<br />
Adaptive channel usage depending on traffic characteristics<br />
Infrequent or short packets ⇒ Common channel (Cell_FACH)<br />
Frequent or large packets ⇒ Dedicated channel (Cell_DCH)<br />
32<br />
Slide 32
Channel Switching – Example<br />
CELL_DCH CELL_FACH CELL_DCH<br />
DCH Active Time<br />
Page Download Time<br />
Reading Time<br />
“Chatty Applications”<br />
Example: Web service<br />
Chatty apps.: keep alive message, stock tickers, etc.<br />
(e.g. 100 bytes every 15 sec)<br />
Second stage: when no activity in CELL_FACH then switch to URA_PCH<br />
33<br />
Slide 33
Packet Data Control<br />
Burst Admission Control<br />
Decision on starting packet data transmission<br />
Similar principle like call admission control, i.e. check the system load against a<br />
threshold that is usually different from thr CAC<br />
Time horizon: 100msec … 10sec<br />
Rate Adaptation<br />
Choose data rate according to transmit power<br />
UE nearby NodeB<br />
UE at cell edges<br />
⇒ high data rate<br />
⇒ low data rate<br />
Decrease data rate in case <strong>of</strong> overload, cf. congestion control<br />
34<br />
Slide 34
Power Control vs. Rate Adaptation<br />
NodeB<br />
high data rate<br />
area<br />
UE 1<br />
low data rate<br />
area<br />
UE 2<br />
Power Control:<br />
Balances user received quality (BLER, SIR)<br />
Users at cell center get less share <strong>of</strong> BTS<br />
transmit power assigned than at cell edge<br />
Occurrence <strong>of</strong> power overload<br />
Rate Adaptation:<br />
Transmit power ~ data rate<br />
Users at cell edge get lower data rate<br />
assigned than at cell center<br />
Reduces also power overload<br />
In UMTS combination <strong>of</strong> power control and<br />
rate adaptation on DCH<br />
35<br />
Slide 35
Rate Adaptation Performance<br />
UM TS_urban, 50 k Byte<br />
UM TS_urban, 50 k Byte<br />
40%<br />
35%<br />
384k<br />
64k<br />
adaptive<br />
8<br />
7<br />
30%<br />
6<br />
384k<br />
Outage Probability<br />
25%<br />
20%<br />
15%<br />
10%<br />
Mean Delay [sec]<br />
5<br />
4<br />
3<br />
2<br />
64k<br />
adaptive<br />
5%<br />
1<br />
0%<br />
200 300 400 500 600<br />
Ce ll Throughput [kBit/s e c]<br />
0<br />
200 300 400 500 600<br />
Ce ll Throughput [k Bit/s e c]<br />
Rate adaptation significantly improves the RRM performance.<br />
36<br />
Slide 36
Spreading Code Management in HSDPA<br />
a) OVSF Code Tree<br />
Border adjusted by CRNC<br />
SF=2<br />
SF=4<br />
SF=8<br />
SF=16<br />
C 16,15<br />
Codes reserved for HS-PDSCH/ HS-SCCH<br />
b) Transmit Power<br />
Border adjusted by CRNC<br />
Codes available for DCH/<br />
common channels<br />
C 16,0<br />
Tx power available for HS-PDSCH/ HS-SCCH<br />
Tx power available for DCH/<br />
common channels<br />
Note: CRNC assigns resources to Node B on a cell basis<br />
37<br />
Slide 37
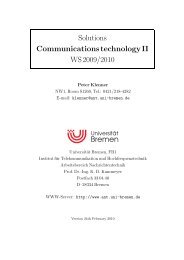
Cell and User Throughput versus Load<br />
Throughput [kbit/sec]<br />
2500<br />
2000<br />
1500<br />
1000<br />
500<br />
0<br />
Mean User Throughput<br />
Aggregated Cell Throughput<br />
Load Impact<br />
4 6 8 10 12 14 16 18<br />
Number <strong>of</strong> Users/ Cell<br />
36 cells network<br />
UMTS composite channel model<br />
FTP traffic model (2 Mbyte<br />
download, 30 sec thinking time)<br />
The user throughput is<br />
decreased when increasing load<br />
due to the reduced service time<br />
The cell throughput increases<br />
with the load because overall<br />
more bytes are transferred in the<br />
same time<br />
38<br />
Slide 38
HSDPA performance per UE Category<br />
2500<br />
2000<br />
Mean User Throughput<br />
Peak User Throughput<br />
Aggregated Cell Throughput<br />
Cat 6 - Cat 8 Comparison<br />
36 cells network<br />
UMTS composite channel model<br />
FTP traffic model (2 Mbyte<br />
download, 30 sec thinking time)<br />
throughput (kbps)<br />
1500<br />
1000<br />
500<br />
Higher category <strong>of</strong>fers higher<br />
max. throughput limit<br />
Cat.6: 3.6 MBit/sec<br />
Cat.8: 7.2 MBit/sec<br />
0<br />
Cat 6/ 10 users Cat 8/ 10 users Cat 6/ 20 users Cat 8/ 20 users<br />
Max. user perceived<br />
performance increased at low<br />
loading<br />
Cell performance slightly better<br />
39<br />
Slide 39
HSDPA Coverage Prediction<br />
Example Scenario<br />
15 users/cell<br />
Pedestrian A channel<br />
model<br />
Plot generated with field<br />
prediction tool<br />
HSDPA Throughput<br />
depends on location<br />
40<br />
Slide 40
User vs. Aggregate Cell Throughput for HSUPA<br />
10ms TTI, unlimited CE dec. rate<br />
2ms TTI, next release<br />
36 cells network<br />
User Throughput [kbps]<br />
1200<br />
1000<br />
800<br />
600<br />
400<br />
200<br />
0<br />
1<br />
2<br />
3<br />
#UEs/cell<br />
200 400 600 800 1000 1200 1400 1600<br />
Aggregated Cell Throughput [kbps]<br />
4<br />
5<br />
10<br />
6<br />
7<br />
8<br />
9<br />
UMTS composite channel<br />
model<br />
FTP traffic model (2 Mbyte<br />
upload, 30 seconds thinking<br />
time)<br />
Maximum cell throughput<br />
reached for about 7…8 UEs<br />
per cell<br />
Cell throughput drops if #UEs<br />
increases further since the<br />
associated signaling channel<br />
consume UL resources too<br />
41<br />
Slide 41
Single User Performance in HSUPA<br />
3500<br />
2ms, 1Tx<br />
10ms, 1Tx<br />
Average user throughput<br />
(RLC layer) for different<br />
channel pr<strong>of</strong>iles<br />
1 UE in the network<br />
3000<br />
1 target HARQ transmission<br />
Average User Throughput [kbps]<br />
2500<br />
2000<br />
1500<br />
1000<br />
500<br />
For AWGN channel<br />
conditions:<br />
10ms TTI: up to 1.7 Mbps<br />
(near theoretical limit <strong>of</strong> 1.88<br />
Mbps)<br />
2ms TTI: up to 3 Mbps<br />
(below theoretical limit 5.44<br />
Mbps)<br />
0<br />
AW GN PedA3 PedA30 VehA30 VehA120<br />
Scenario<br />
<br />
E.g. due to restrictions<br />
from RLC layer (window<br />
size, PDU size)<br />
42<br />
Slide 42
LTE Uplink Power Control<br />
Open-loop power control is the baseline<br />
uplink power control method in LTE<br />
(compensation for path loss and fading)<br />
<br />
<br />
Open-loop PC is needed to constrain the dynamic<br />
range between signals received from different UEs<br />
Unlike CDMA, there is no intra cell interference to<br />
combat; rather, fading is exploited by rate control<br />
Transmit power per PRB<br />
TxPSD (dBm) = α•PL (dB) + P0 nominal (dBm)<br />
Target SINR on PUSCH is now a function<br />
<strong>of</strong> the UE’s path loss:<br />
<br />
<br />
<br />
PL dB : pathloss, estimated from DL reference signal<br />
P0 nominal (dBm) = Γ nominal (dB) + I tot (dBm)<br />
Sum <strong>of</strong> SINR target Γ nominal and total interference<br />
I tot sent on BCH<br />
Fractional compensation factor α ≤ 1 (PUSCH)<br />
→ only a fraction <strong>of</strong> the path loss is compensated<br />
Additionally, (slow) closed loop PC can be<br />
used<br />
Target<br />
SINR<br />
SINR (dBm) = Γ nominal (dB) + (1–α)•PL (dB)<br />
Slide 43<br />
43
Interference Coordination - Flexible Frequency Reuse<br />
Cell edge<br />
Reuse > 1<br />
Cell centre<br />
Reuse = 1<br />
<br />
<br />
<br />
Scheduler can place restriction on which<br />
PRBs can be used in which sectors<br />
Achieves frequency reuse > 1<br />
Reduced inter-cell interference leads to<br />
improved SINR, especially at cell-edge<br />
Reduction in available transmission<br />
bandwidth leads to poor overall spectral<br />
efficiency<br />
Cell edge users with frequency reuse > 1,<br />
<br />
<br />
<br />
<br />
eNB transmits with higher power<br />
Improved SINR conditions<br />
Cell centre users can use whole frequency band<br />
<br />
<br />
eNB transmits with reduced power<br />
Less interference to other cells<br />
Flexible frequency reuse realized through<br />
intelligent scheduling and power allocation<br />
44<br />
Slide 44
Heterogeneous Networks<br />
Core<br />
Network<br />
Backhaul<br />
Relay<br />
Backhaul<br />
Need for Flexible and Low-<br />
Cost Network Deployment<br />
Using Mix <strong>of</strong> Macro, Pico,<br />
Relay, RRH and Home eNBs<br />
Internet<br />
HeNB<br />
Pico<br />
Macro<br />
Relay<br />
Pico<br />
Pico<br />
Network expansion due to varying traffic demand & RF environment<br />
Cell-splitting <strong>of</strong> traditional macro deployments is complex and iterative<br />
Indoor coverage and need for site acquisition add to the challenge<br />
Future network deployments based on Heterogeneous Networks (HeNBs)<br />
Deployment <strong>of</strong> Macro eNBs for initial coverage only<br />
Addition <strong>of</strong> Pico, HeNBs and Relays for capacity growth & better user experience<br />
Improved in-building coverage and flexible site acquisition with low power base stations<br />
Relays provide coverage extension with no incremental backhaul expense<br />
45<br />
Slide 45
HetNet: Macro-Pico (open access hot-spot)<br />
Macro-pico deployments with UEs operating in range expansion<br />
Large bias to compensate the power difference between macro and pico<br />
for traffic <strong>of</strong>floading<br />
Nominally a UE associates with a base station with strong DL SINR<br />
With range expansion, a UE can associate with a low power node<br />
based on smaller path loss, thus <strong>of</strong>floading the macro station<br />
With range expansion the serving cell is not necessarily the strongest one<br />
Pico<br />
Macro<br />
Pico<br />
46<br />
Slide 46
HetNet: Macro-Femto (CSG node, HeNB)<br />
Macro-femto deployments with UEs (or femto cells) operating under<br />
strong co-channel interference<br />
UEs in close proximity <strong>of</strong> a CSG femto cell they are not allowed to<br />
connect to (i.e. are still served by macro cell) may be:<br />
strongly interfered in DL by the CSG cell<br />
causing severe interference in UL to towards the femto cell<br />
Interference management helps the UE to survive<br />
CSG<br />
Macro<br />
CSG<br />
47<br />
Slide 47
Extending X2 to HeNB – <strong>3G</strong>PP Status Rel. 10<br />
During Rel. 10 work, several contributions have been discussed related to<br />
introduction <strong>of</strong> X2 interface for HeNB for mobility enhancement<br />
HeNB X2 scenarios<br />
HeNB-HeNB when the target cell is an open access HeNB<br />
HeNB-HeNB for closed/hybrid access with same CSG ID<br />
The existing X2 functionality is available for eNB and HeNB<br />
There is no separate X2 specification for HeNB and eNB<br />
The X2 functionality is optional<br />
X2 interface between eNB and HeNB has been also discussed but no<br />
agreement could be reached so far<br />
Scenario is more complex, as there may be a need for X2-GW which requires<br />
additional standardization work<br />
Postponed to Rel. 11<br />
48<br />
Slide 48
Enhanced ICIC in Rel. 10<br />
ICIC includes frequency and time domain components<br />
Frequency domain ICIC was already available in Rel. 8 and Rel. 9<br />
See lecture chapter 4 for details<br />
For the time domain ICIC, Almost Blank Subframes (ABSs) are used to<br />
protect resources receiving strong inter-cell interference (R3-103775)<br />
Extensions to X2AP are needed<br />
Time domain updates in Rel. 10 are called enhanced ICIC<br />
<br />
Both scenarios are handled differently, since there is no eNB – HeNB X2<br />
Semi-static eICIC in macro eNB – pico eNB<br />
Static eICIC in eNB – HeNB scenario<br />
ABS are defined by OAM for time domain eICIC (R3-103775)<br />
<br />
References:<br />
R3-103775, “X2 procedure and OAM requirements to support eICIC”, TSG-RAN WG3 Meeting #70,<br />
November 2010<br />
49<br />
Slide 49
Updates <strong>of</strong> the X2AP to support eICIC in Rel10<br />
Information <strong>of</strong> ABS pattern is added to the ‘Load Indication’ procedure<br />
The ABS pattern (40ms period for FDD) is sent from the aggressor to the victim<br />
The ABS patterns are semi-statically updated<br />
The ‘Load indication’ also contains an invoke indication<br />
This indicator is sent from the victim to the aggressor to ask for eICIC activation<br />
IE/Group Name Presence Range IE type and<br />
reference<br />
Invoke Indication M ENUMERATED<br />
(ABS<br />
Information, …)<br />
Semantics description<br />
–<br />
Information about the status <strong>of</strong> the ABS is added to the ‘Resource Status<br />
Reporting’ procedure<br />
Its initialization is enabled in the ‘Resource Status Reporting Initiation’ procedure<br />
This information is sent from the victim to the aggressor<br />
IE/Group Name Presence Range IE type and reference Semantics description<br />
DL ABS status M INTEGER (0..100) Percentage <strong>of</strong> ABS<br />
resource allocated for<br />
UEs protected by ABS<br />
from strong inter-cell<br />
interference.<br />
50<br />
<br />
References:<br />
R3-103667, “Introduction <strong>of</strong> X2 signaling support for eICIC”, TSG-RAN WG3 Meeting #70, November 2010<br />
R3-103776, “Enabling reporting <strong>of</strong> ABS resource status for eICIC purposes”, TSG-RAN WG3 Meeting #70,<br />
November 2010<br />
Slide 50