- Page 1 and 2:
Landscapes Forest and Global Change
- Page 3:
The contributions to this volume ha
- Page 6 and 7:
Table of contents Foreword Preface
- Page 8 and 9:
Fine-scale mapping of High Nature V
- Page 10 and 11:
Characterization of a Maculinea alc
- Page 12 and 13:
Urban tree inventory and socio-econ
- Page 14 and 15:
xiii Foreword Twenty years ago, Dr.
- Page 16 and 17:
Section 1 Scaling in landscape anal
- Page 18 and 19:
V. Cortes et al. 2010. Environmenta
- Page 20 and 21:
V. Cortes et al. 2010. Environmenta
- Page 22 and 23:
V. Cortes et al. 2010. Environmenta
- Page 24 and 25:
D. S. de Ron et al. 2010. Habitat s
- Page 26 and 27:
D. S. de Ron et al. 2010. Habitat s
- Page 28 and 29:
D. S. de Ron et al. 2010. Habitat s
- Page 30 and 31:
B. Bożętka 2010. Recent relations
- Page 32 and 33:
B. Bożętka 2010. Recent relations
- Page 34 and 35:
B. Bożętka 2010. Recent relations
- Page 36 and 37:
S.F. Chen et al. 2010. A physiotope
- Page 38 and 39:
S.F. Chen et al. 2010. A physiotope
- Page 40 and 41:
S.F. Chen et al. 2010. A physiotope
- Page 42 and 43:
V.D. de Campos & S M. Carvalho 2010
- Page 44 and 45:
V.D. de Campos & S M. Carvalho 2010
- Page 46 and 47:
V.D. de Campos & S M. Carvalho 2010
- Page 48 and 49:
N.S. Evseeva & Z.N. Kvasnikova 2010
- Page 50 and 51:
N.S. Evseeva & Z.N. Kvasnikova 2010
- Page 52 and 53:
S. Frank et al. 2010. A regionally
- Page 54 and 55:
S. Frank et al. 2010. A regionally
- Page 56 and 57:
S. Frank et al. 2010. A regionally
- Page 58 and 59:
M. García et al. 2010. The effect
- Page 60 and 61:
M. García et al. 2010. The effect
- Page 62 and 63:
S. Gholami et al. 2010. Spatial pat
- Page 64 and 65:
S. Gholami et al. 2010. Spatial pat
- Page 66 and 67:
S. Gholami et al. 2010. Spatial pat
- Page 68 and 69:
P. González-Moreno et al. 2010. Th
- Page 70 and 71:
P. González-Moreno et al. 2010. Th
- Page 72 and 73:
P. González-Moreno et al. 2010. Th
- Page 74 and 75:
T. Höbinger et al. 2010. Impact of
- Page 76 and 77:
T. Höbinger et al. 2010. Impact of
- Page 78 and 79:
T. Höbinger et al. 2010. Impact of
- Page 80 and 81:
P. Matos et al. 2010. Can lichen fu
- Page 82 and 83:
P. Matos et al. 2010. Can lichen fu
- Page 84 and 85:
P. Matos et al. 2010. Can lichen fu
- Page 86 and 87:
E.S. Meier et al. 2010. Projections
- Page 88 and 89:
E.S. Meier et al. 2010. Projections
- Page 90 and 91:
H. Moutahir et al. 2010. Applicatio
- Page 92 and 93:
H. Moutahir et al. 2010. Applicatio
- Page 94 and 95:
C. Palaghianu 2010. The use of Voro
- Page 96 and 97:
C. Palaghianu 2010. The use of Voro
- Page 98 and 99:
C. Palaghianu 2010. The use of Voro
- Page 100 and 101:
F. Peña-Cortés et al. 2010. Spati
- Page 102 and 103:
F. Peña-Cortés et al. 2010. Spati
- Page 104 and 105:
F. Peña-Cortés et al. 2010. Spati
- Page 106 and 107:
F.M. Rabenilalana et al. 2010. Mult
- Page 108 and 109:
F.M. Rabenilalana et al. 2010. Mult
- Page 110 and 111:
F.M. Rabenilalana et al. 2010. Mult
- Page 112 and 113:
A. Ruskule et al. 2010. Patterns of
- Page 114 and 115:
A. Ruskule et al. 2010. Patterns of
- Page 116 and 117:
A. Ruskule et al. 2010. Patterns of
- Page 118 and 119:
E. Sayad 2010. Nitrogen retrancloca
- Page 120 and 121:
E. Sayad 2010. Nitrogen retrancloca
- Page 122 and 123:
G. Zhelezov 2010. Evaluation of the
- Page 124 and 125:
G. Zhelezov 2010. Evaluation of the
- Page 126 and 127:
G. Zhelezov 2010. Evaluation of the
- Page 128 and 129:
Section 3 Disturbances in changing
- Page 130 and 131:
A. Altamirano et al. 2010. Human-ca
- Page 132 and 133:
A. Altamirano et al. 2010. Human-ca
- Page 134 and 135:
T. Curt & J. Pausas 2010. Are chang
- Page 136 and 137:
T. Curt & J. Pausas 2010. Are chang
- Page 138 and 139:
T. Curt & J. Pausas 2010. Are chang
- Page 140 and 141:
R.A Fleming et al. 2010. Forest man
- Page 142 and 143:
R.A Fleming et al. 2010. Forest man
- Page 144 and 145:
P.C. Goebel et al. 2010. How import
- Page 146 and 147:
P.C. Goebel et al. 2010. How import
- Page 148 and 149:
P.C. Goebel et al. 2010. How import
- Page 150 and 151:
L.R. Iverson et al. 2010. Merger of
- Page 152 and 153:
L.R. Iverson et al. 2010. Merger of
- Page 154 and 155:
L.R. Iverson et al. 2010. Merger of
- Page 156 and 157:
T.-C. Lin et al. 2010. Immediate ef
- Page 158 and 159:
T.-C. Lin et al. 2010. Immediate ef
- Page 160 and 161:
T.-C. Lin et al. 2010. Immediate ef
- Page 162 and 163:
K. L. Martin & P.C. Goebel 2010. Im
- Page 164 and 165:
K. L. Martin & P.C. Goebel 2010. Im
- Page 166 and 167:
K. L. Martin & P.C. Goebel 2010. Im
- Page 168 and 169:
G.M. Pastur et al. 2010. Indirect e
- Page 170 and 171:
G.M. Pastur et al. 2010. Indirect e
- Page 172 and 173:
G.M. Pastur et al. 2010. Indirect e
- Page 174 and 175:
E.W Saragih et al. 2010. Effects of
- Page 176 and 177:
E.W Saragih et al. 2010. Effects of
- Page 178 and 179:
E.W Saragih et al. 2010. Effects of
- Page 180 and 181:
L.R.P. Williamson et al. 2010. Anth
- Page 182 and 183:
L.R.P. Williamson et al. 2010. Anth
- Page 184 and 185:
L.R.P. Williamson et al. 2010. Anth
- Page 186 and 187:
N. Zurbriggen et al. 2010. Modeling
- Page 188 and 189:
N. Zurbriggen et al. 2010. Modeling
- Page 190 and 191:
N. Zurbriggen et al. 2010. Modeling
- Page 192 and 193:
Section 4 Biodiversity conservation
- Page 194 and 195:
Akbarzadeh et al. 2010. Ecotourism
- Page 196 and 197:
Akbarzadeh et al. 2010. Ecotourism
- Page 198 and 199:
C. Carvalho-Santos 2010. Fine-scale
- Page 200 and 201:
C. Carvalho-Santos 2010. Fine-scale
- Page 202 and 203:
C. Carvalho-Santos 2010. Fine-scale
- Page 204 and 205:
I. Catalano et al. 2010. Wood macro
- Page 206 and 207:
I. Catalano et al. 2010. Wood macro
- Page 208 and 209:
I. Catalano et al. 2010. Wood macro
- Page 210 and 211:
R.A. Diaz-Varela et al. 2010. Exten
- Page 212 and 213:
R.A. Diaz-Varela et al. 2010. Exten
- Page 214 and 215:
R.A. Diaz-Varela et al. 2010. Exten
- Page 216 and 217:
R.A. Diaz-Varela et al. 2010. Asses
- Page 218 and 219:
R.A. Diaz-Varela et al. 2010. Asses
- Page 220 and 221:
R.A. Diaz-Varela et al. 2010. Asses
- Page 222 and 223:
P.A.E. Diogo & J. Aranha 2010. GIS
- Page 224 and 225:
P.A.E. Diogo & J. Aranha 2010. GIS
- Page 226 and 227:
V. Etemad & N. Avani 2010. Investig
- Page 228 and 229:
V. Etemad & N. Avani 2010. Investig
- Page 230 and 231:
V. Etemad & N. Avani 2010. Investig
- Page 232 and 233:
A.E. Eycott et al. 2010. The impact
- Page 234 and 235:
A.E. Eycott et al. 2010. The impact
- Page 236 and 237:
A.E. Eycott et al. 2010. The impact
- Page 238 and 239:
E. Fernández-Núñez et al. 2010.
- Page 240 and 241:
E. Fernández-Núñez et al. 2010.
- Page 242 and 243:
E. Fernández-Núñez et al. 2010.
- Page 244 and 245:
N. Fracassi & D. Somma 2010. Partic
- Page 246 and 247:
N. Fracassi & D. Somma 2010. Partic
- Page 248 and 249:
N. Fracassi & D. Somma 2010. Partic
- Page 250 and 251:
J. Hartter et al. 2010. Fortresses
- Page 252 and 253:
J. Hartter et al. 2010. Fortresses
- Page 254 and 255:
J. Hartter et al. 2010. Fortresses
- Page 256 and 257:
M.B. Horta et al. 2010. Landscape S
- Page 258 and 259:
M.B. Horta et al. 2010. Landscape S
- Page 260 and 261:
M.B. Horta et al. 2010. Landscape S
- Page 262 and 263:
J.O. López-Martínez et al. 2010.
- Page 264 and 265:
J.O. López-Martínez et al. 2010.
- Page 266 and 267:
J.O. López-Martínez et al. 2010.
- Page 268 and 269:
Sara Marques et al. 2010. Impact of
- Page 270 and 271:
Sara Marques et al. 2010. Impact of
- Page 272 and 273:
Sara Marques et al. 2010. Impact of
- Page 274 and 275:
M.G.C. Martins & J. Aranha 2010. El
- Page 276 and 277:
M.G.C. Martins & J. Aranha 2010. El
- Page 278 and 279:
J.-F. Mas et al. 2010. Modeling lan
- Page 280 and 281:
J.-F. Mas et al. 2010. Modeling lan
- Page 282 and 283:
J.-F. Mas et al. 2010. Modeling lan
- Page 284 and 285:
R.S. Moro & T.K. Pereira 2010. Eval
- Page 286 and 287:
R.S. Moro & T.K. Pereira 2010. Eval
- Page 288 and 289:
R.S. Moro & T.K. Pereira 2010. Eval
- Page 290 and 291:
R.S. Moro & C.H Rocha 2010. A metho
- Page 292 and 293:
R.S. Moro & C.H Rocha 2010. A metho
- Page 294 and 295:
R.S. Moro & C.H Rocha 2010. A metho
- Page 296 and 297:
V. Núñez et al. 2010. Landscape i
- Page 298 and 299:
V. Núñez et al. 2010. Landscape i
- Page 300 and 301:
V. Núñez et al. 2010. Landscape i
- Page 302 and 303:
S.G. Plexida & A.I. Sfougaris 2010.
- Page 304 and 305:
S.G. Plexida & A.I. Sfougaris 2010.
- Page 306 and 307:
S.G. Plexida & A.I. Sfougaris 2010.
- Page 308 and 309:
A. Poljanec & A. Boncina 2010. Chan
- Page 310 and 311:
A. Poljanec & A. Boncina 2010. Chan
- Page 312 and 313:
A. Poljanec & A. Boncina 2010. Chan
- Page 314 and 315:
M. Redon & S. Luque 2010. Tengmalm
- Page 316 and 317:
M. Redon & S. Luque 2010. Tengmalm
- Page 318 and 319:
M. Redon & S. Luque 2010. Tengmalm
- Page 320 and 321:
M.C.C. Rodrigues et al. 2010. Contr
- Page 322 and 323:
M.C. Silva et al. 2010. Using Busin
- Page 324 and 325:
M.C. Silva et al. 2010. Using Busin
- Page 326 and 327:
M.C. Silva et al. 2010. Using Busin
- Page 328 and 329:
T.N. Terra & R.F dos Santos 2010. L
- Page 330 and 331:
T.N. Terra & R.F dos Santos 2010. L
- Page 332 and 333:
T.N. Terra & R.F dos Santos 2010. L
- Page 334 and 335:
E. Tetetla-Rangel et al. 2010. Rela
- Page 336 and 337:
E. Tetetla-Rangel et al. 2010. Rela
- Page 338 and 339:
E. Tetetla-Rangel et al. 2010. Rela
- Page 340 and 341:
M. Tsibulnikova 2010. Economic esti
- Page 342 and 343:
M. Tsibulnikova 2010. Economic esti
- Page 344 and 345:
M. Tsibulnikova 2010. Economic esti
- Page 346 and 347:
M. Akbarzadeh & E. Kouhgardi 2010.
- Page 348 and 349:
M. Akbarzadeh & E. Kouhgardi 2010.
- Page 350 and 351:
M. Akbarzadeh & E. Kouhgardi 2010.
- Page 352 and 353:
B. Baran-Zgłobicka & W. Zgłobicki
- Page 354 and 355:
B. Baran-Zgłobicka & W. Zgłobicki
- Page 356 and 357:
J. Beldade & T. Panagopoulos 2010.
- Page 358 and 359:
J. Beldade & T. Panagopoulos 2010.
- Page 360 and 361:
J. Beldade & T. Panagopoulos 2010.
- Page 362 and 363:
S.M. Carvalho & A.R. de Freitas 201
- Page 364 and 365:
S.M. Carvalho & A.R. de Freitas 201
- Page 366 and 367:
S.M. Carvalho & A.R. de Freitas 201
- Page 368 and 369:
R.A. Diaz-Varela et al. 2010. Quant
- Page 370 and 371:
R.A. Diaz-Varela et al. 2010. Quant
- Page 372 and 373:
R.A. Diaz-Varela et al. 2010. Quant
- Page 374 and 375:
I. Duarte & F.C. Rego 2010. Land us
- Page 376 and 377:
I. Duarte & F.C. Rego 2010. Land us
- Page 378 and 379:
I. Duarte & F.C. Rego 2010. Land us
- Page 380 and 381:
J.S.V. Filho & M.L. Leite 2010. Sim
- Page 382 and 383: J.S.V. Filho & M.L. Leite 2010. Sim
- Page 384 and 385: J.S.V. Filho & M.L. Leite 2010. Sim
- Page 386 and 387: F.J. Gómez et al. 2010. Land use c
- Page 388 and 389: F.J. Gómez et al. 2010. Land use c
- Page 390 and 391: F.J. Gómez et al. 2010. Land use c
- Page 392 and 393: M.L. Leite & J.S.V. Filho2010. Anal
- Page 394 and 395: M.L. Leite & J.S.V. Filho2010. Anal
- Page 396 and 397: M.L.Leite & J.S.V. Filho 2010. Iden
- Page 398 and 399: M.L.Leite & J.S.V. Filho 2010. Iden
- Page 400 and 401: M.L.Leite & J.S.V. Filho 2010. Iden
- Page 402 and 403: M. Ortega et al. 2010. Monitoring v
- Page 404 and 405: M. Ortega et al. 2010. Monitoring v
- Page 406 and 407: M. Ortega et al. 2010. Monitoring v
- Page 408 and 409: G. Puddu et al. 2010. Landscape tra
- Page 410 and 411: G. Puddu et al. 2010. Landscape tra
- Page 412 and 413: G. Puddu et al. 2010. Landscape tra
- Page 414 and 415: H.R. Ratsimba et al. 2010. Multi-sc
- Page 416 and 417: H.R. Ratsimba et al. 2010. Multi-sc
- Page 418 and 419: H.R. Ratsimba et al. 2010. Multi-sc
- Page 420 and 421: M.C. Rodrigues et al. 2010. Charact
- Page 422 and 423: M.C. Rodrigues et al. 2010. Charact
- Page 424 and 425: M.T.C. Rodrigues & V. Silva 2010. L
- Page 426 and 427: M.T.C. Rodrigues & V. Silva 2010. L
- Page 428 and 429: M.T.C. Rodrigues & V. Silva 2010. L
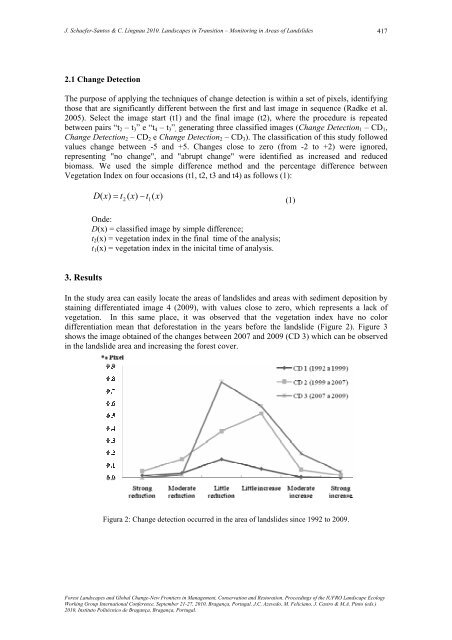
- Page 430 and 431: J. Schaefer-Santos & C. Lingnau 201
- Page 434 and 435: J. Schaefer-Santos & C. Lingnau 201
- Page 436 and 437: S.M. Scheffer & E. Schimanski 2010.
- Page 438 and 439: S.M. Scheffer & E. Schimanski 2010.
- Page 440 and 441: J. Superson et al. 2010. The defore
- Page 442 and 443: J. Superson et al. 2010. The defore
- Page 444 and 445: J. Superson et al. 2010. The defore
- Page 446 and 447: A.L. Teixido et al. 2010. Impacts o
- Page 448 and 449: A.L. Teixido et al. 2010. Impacts o
- Page 450 and 451: A.L. Teixido et al. 2010. Impacts o
- Page 452 and 453: H. Viana & J. Aranha 2010. Assessin
- Page 454 and 455: H. Viana & J. Aranha 2010. Assessin
- Page 456 and 457: H. Viana & J. Aranha 2010. Assessin
- Page 458 and 459: H. Viana & J. Aranha 2010. Mapping
- Page 460 and 461: H. Viana & J. Aranha 2010. Mapping
- Page 462 and 463: H. Viana & J. Aranha 2010. Mapping
- Page 464 and 465: Section 6 Tools of landscape assess
- Page 466 and 467: N. Avani et al. 2010. Investigation
- Page 468 and 469: N. Avani et al. 2010. Investigation
- Page 470 and 471: N. Avani et al. 2010. Investigation
- Page 472 and 473: J.C. Azevedo et al. 2010. Spatial d
- Page 474 and 475: J.C. Azevedo et al. 2010. Spatial d
- Page 476 and 477: J.C. Azevedo et al. 2010. Spatial d
- Page 478 and 479: T. Batista et al. 2010. The third d
- Page 480 and 481: T. Batista et al. 2010. The third d
- Page 482 and 483:
T. Batista et al. 2010. The third d
- Page 484 and 485:
V. Caboun 2010. New classification
- Page 486 and 487:
V. Caboun 2010. New classification
- Page 488 and 489:
V. Caboun 2010. New classification
- Page 490 and 491:
A.M. Carvalho et al. 2010. Connecti
- Page 492 and 493:
A.M. Carvalho et al. 2010. Connecti
- Page 494 and 495:
A.M. Carvalho et al. 2010. Connecti
- Page 496 and 497:
M. Deconchat et al. 2010. Identific
- Page 498 and 499:
M. Deconchat et al. 2010. Identific
- Page 500 and 501:
M. Deconchat et al. 2010. Identific
- Page 502 and 503:
J. Gaspar et al. 2010. Visibility a
- Page 504 and 505:
J. Gaspar et al. 2010. Visibility a
- Page 506 and 507:
A.M. Geraldes 2010. Landscape runof
- Page 508 and 509:
A.M. Geraldes 2010. Landscape runof
- Page 510 and 511:
A.M. Geraldes 2010. Landscape runof
- Page 512 and 513:
A.M. Geraldes & M.J. Boavida 2010.
- Page 514 and 515:
A.M. Geraldes & M.J. Boavida 2010.
- Page 516 and 517:
A.M. Geraldes & M.J. Boavida 2010.
- Page 518 and 519:
K. Koschke et al. 2010. Using a mul
- Page 520 and 521:
K. Koschke et al. 2010. Using a mul
- Page 522 and 523:
K. Koschke et al. 2010. Using a mul
- Page 524 and 525:
J.-F. Mas et al. 2010. Assessing
- Page 526 and 527:
J.-F. Mas et al. 2010. Assessing
- Page 528 and 529:
J.-F. Mas et al. 2010. Assessing
- Page 530 and 531:
A. Matos et al. 2010. Economic valu
- Page 532 and 533:
A. Matos et al. 2010. Economic valu
- Page 534 and 535:
A. Matos et al. 2010. Economic valu
- Page 536 and 537:
A. Migliozzi et al. 2010. Land-use
- Page 538 and 539:
A. Migliozzi et al. 2010. Land-use
- Page 540 and 541:
A. Migliozzi et al. 2010. Land-use
- Page 542 and 543:
M.L Porto et al. 2010. Naturalness
- Page 544 and 545:
M.L Porto et al. 2010. Naturalness
- Page 546 and 547:
M. Rehor & V. Ondracek 2010. Applic
- Page 548 and 549:
M. Rehor & V. Ondracek 2010. Applic
- Page 550 and 551:
M. Rehor & V. Ondracek 2010. Applic
- Page 552 and 553:
J. Russell et al. 2010. Developing
- Page 554 and 555:
J. Russell et al. 2010. Developing
- Page 556 and 557:
J. Russell et al. 2010. Developing
- Page 558 and 559:
Section 7 Management and sustainabi
- Page 560 and 561:
P. Angelstam & M. Elbakidze. 2010.
- Page 562 and 563:
P. Angelstam & M. Elbakidze. 2010.
- Page 564 and 565:
P. Angelstam & M. Elbakidze. 2010.
- Page 566 and 567:
M. Castro et al. 2010. Relationship
- Page 568 and 569:
M. Castro et al. 2010. Relationship
- Page 570 and 571:
M. Castro et al. 2010. Relationship
- Page 572 and 573:
M. Elbakidze et al. 2010. Does fore
- Page 574 and 575:
M. Elbakidze et al. 2010. Does fore
- Page 576 and 577:
M. Elbakidze et al. 2010. Does fore
- Page 578 and 579:
F. Fonseca & T. de Figueiredo 2010.
- Page 580 and 581:
F. Fonseca & T. de Figueiredo 2010.
- Page 582 and 583:
F. Fonseca & T. de Figueiredo 2010.
- Page 584 and 585:
A. Gil-Tena et al. 2010. Disentangl
- Page 586 and 587:
A. Gil-Tena et al. 2010. Disentangl
- Page 588 and 589:
A. Gil-Tena et al. 2010. Disentangl
- Page 590 and 591:
M.B. Horta & E. Keizer 2010. Assess
- Page 592 and 593:
M.B. Horta & E. Keizer 2010. Assess
- Page 594 and 595:
M.B. Horta & E. Keizer 2010. Assess
- Page 596 and 597:
E. Kouhgardi & M. Akbarzadeh 2010.
- Page 598 and 599:
E. Kouhgardi & M. Akbarzadeh 2010.
- Page 600 and 601:
E. Kouhgardi & M. Akbarzadeh 2010.
- Page 602 and 603:
E. Kouhgardi et al. 2010. Values of
- Page 604 and 605:
E. Kouhgardi et al. 2010. Values of
- Page 606 and 607:
E. Schimanski 2010. The importance
- Page 608 and 609:
E. Schimanski 2010. The importance
- Page 610 and 611:
E. Schimanski 2010. The importance
- Page 612 and 613:
L.A.M. da Silva & E. Shimanki 2010.
- Page 614 and 615:
L.A.M. da Silva & E. Shimanki 2010.
- Page 616 and 617:
L.A.M. da Silva & E. Shimanki 2010.
- Page 618 and 619:
N. Stryamets et al. 2010. Role of n
- Page 620 and 621:
N. Stryamets et al. 2010. Role of n
- Page 622 and 623:
N. Stryamets et al. 2010. Role of n
- Page 624 and 625:
E. Volkova 2010. The regional analy
- Page 626 and 627:
E. Volkova 2010. The regional analy
- Page 628 and 629:
E. Volkova 2010. The regional analy
- Page 630 and 631:
I. Löfström et al. 2010. Biodiver
- Page 632 and 633:
I. Löfström et al. 2010. Biodiver
- Page 634 and 635:
A.C.R. de Oliveira & S.M. Carvalho
- Page 636 and 637:
A.C.R. de Oliveira & S.M. Carvalho
- Page 638 and 639:
A.C.R. de Oliveira & S.M. Carvalho
- Page 640 and 641:
I. Silva et al. 2010. Lisbon’s pu
- Page 642 and 643:
I. Silva et al. 2010. Lisbon’s pu
- Page 644 and 645:
I. Silva et al. 2010. Lisbon’s pu
- Page 646 and 647:
Section 9 Symposia
- Page 648 and 649:
Z.L. Urech & J.P. Sorg 2010. Taking
- Page 650 and 651:
Z.L. Urech & J.P. Sorg 2010. Taking
- Page 652 and 653:
Z.L. Urech & J.P. Sorg 2010. Taking
- Page 654 and 655:
Measures of landscape structure as
- Page 656 and 657:
E.R. Diaz-Varela et al. 2010. Multi
- Page 658 and 659:
E.R. Diaz-Varela et al. 2010. Multi
- Page 660 and 661:
E.R. Diaz-Varela et al. 2010. Multi
- Page 662 and 663:
J.L. Hernández-Stefanoni et al. 20
- Page 664 and 665:
J.L. Hernández-Stefanoni et al. 20
- Page 666 and 667:
J.L. Hernández-Stefanoni et al. 20
- Page 668 and 669:
E. Uuemaa et al. 2010. Spatial grad
- Page 670 and 671:
E. Uuemaa et al. 2010. Spatial grad
- Page 672 and 673:
E. Uuemaa et al. 2010. Spatial grad
- Page 674 and 675:
E. Penot 2010. Socio-economic diagn
- Page 676 and 677:
E. Penot 2010. Socio-economic diagn
- Page 678 and 679:
E. Penot 2010. Socio-economic diagn
- Page 680 and 681:
Network theory to conserve and reco
- Page 682 and 683:
S. Decout et al. 2010. Connectivity
- Page 684 and 685:
S. Decout et al. 2010. Connectivity
- Page 686 and 687:
S. Decout et al. 2010. Connectivity
- Page 688 and 689:
S. Joost et al. 2010. GEOME. Toward
- Page 690 and 691:
S. Joost et al. 2010. GEOME. Toward
- Page 692 and 693:
S. Joost et al. 2010. GEOME. Toward
- Page 694 and 695:
S.R. Freitas et al. 2010. The effec
- Page 696 and 697:
S.R. Freitas et al. 2010. The effec
- Page 698 and 699:
S.R. Freitas et al. 2010. The effec
- Page 700 and 701:
B. Terrones et al. 2010. Detecting
- Page 702 and 703:
B. Terrones et al. 2010. Detecting
- Page 704 and 705:
B. Terrones et al. 2010. Detecting
- Page 706 and 707:
M. Kolström et al. 2010. Is it pos
- Page 708 and 709:
M. Kolström et al. 2010. Is it pos
- Page 710 and 711:
M. Kolström et al. 2010. Is it pos
- Page 712 and 713:
S. M. Carvalho-Ribeiro & T. Pinto-C
- Page 714 and 715:
S. M. Carvalho-Ribeiro & T. Pinto-C
- Page 716 and 717:
S. M. Carvalho-Ribeiro & T. Pinto-C
- Page 718 and 719:
J.P. Nunes et al. 2010. Impacts of
- Page 720 and 721:
J.P. Nunes et al. 2010. Impacts of
- Page 722 and 723:
J.P. Nunes et al. 2010. Impacts of
- Page 724 and 725:
Management and conservation of Medi
- Page 726 and 727:
P.M. Fernandes et al. 2010. Testing
- Page 728 and 729:
P.M. Fernandes et al. 2010. Testing
- Page 730 and 731:
P.M. Fernandes et al. 2010. Testing
- Page 732 and 733:
E. Andrieu et al. 2010. When forest
- Page 734 and 735:
E. Andrieu et al. 2010. When forest
- Page 736 and 737:
E. Andrieu et al. 2010. When forest
- Page 738 and 739:
D. Geni et al. 2010. A framework fo
- Page 740 and 741:
D. Geni et al. 2010. A framework fo
- Page 742 and 743:
D. Geni et al. 2010. A framework fo
- Page 744 and 745:
A. Ouin et al. 2010. Do wooded elem
- Page 746 and 747:
A. Ouin et al. 2010. Do wooded elem
- Page 748 and 749:
A. Ouin et al. 2010. Do wooded elem
- Page 750 and 751:
C. Estreguil & G. Caudullo 2010. Ha
- Page 752 and 753:
C. Estreguil & G. Caudullo 2010. Ha
- Page 754 and 755:
C. Estreguil & G. Caudullo 2010. Ha
- Page 756 and 757:
J.M. Rey Benayas 2010. Restoration
- Page 758 and 759:
J.M. Rey Benayas 2010. Restoration
- Page 760 and 761:
J.M. Rey Benayas 2010. Restoration
- Page 762:
IUFRO Unit 8.01.02 Landscape Ecolog