FORM 10-K/A GAMCO Investors, Inc. - Gabelli
FORM 10-K/A GAMCO Investors, Inc. - Gabelli
FORM 10-K/A GAMCO Investors, Inc. - Gabelli
- No tags were found...

Create successful ePaper yourself
Turn your PDF publications into a flip-book with our unique Google optimized e-Paper software.
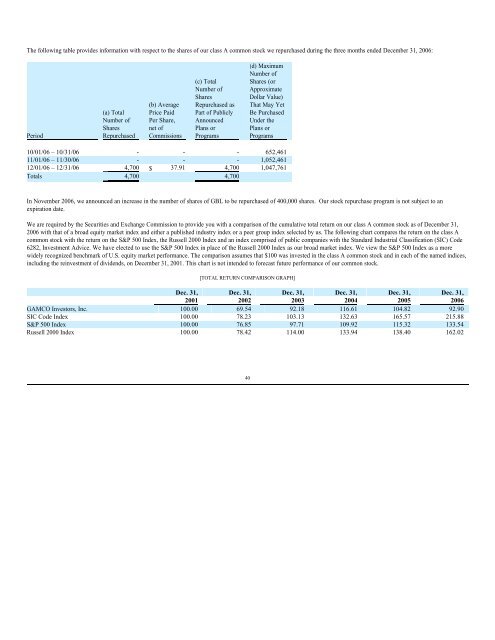
The following table provides information with respect to the shares of our class A common stock we repurchased during the three months ended December 31, 2006:<br />
Period<br />
(a) Total<br />
Number of<br />
Shares<br />
Repurchased<br />
(b) Average<br />
Price Paid<br />
Per Share,<br />
net of<br />
Commissions<br />
(c) Total<br />
Number of<br />
Shares<br />
Repurchased as<br />
Part of Publicly<br />
Announced<br />
Plans or<br />
Programs<br />
(d) Maximum<br />
Number of<br />
Shares (or<br />
Approximate<br />
Dollar Value)<br />
That May Yet<br />
Be Purchased<br />
Under the<br />
Plans or<br />
Programs<br />
<strong>10</strong>/01/06 – <strong>10</strong>/31/06 - - - 652,461<br />
11/01/06 – 11/30/06 - - - 1,052,461<br />
12/01/06 – 12/31/06 4,700 $ 37.91 4,700 1,047,761<br />
Totals 4,700 4,700<br />
In November 2006, we announced an increase in the number of shares of GBL to be repurchased of 400,000 shares. Our stock repurchase program is not subject to an<br />
expiration date.<br />
We are required by the Securities and Exchange Commission to provide you with a comparison of the cumulative total return on our class A common stock as of December 31,<br />
2006 with that of a broad equity market index and either a published industry index or a peer group index selected by us. The following chart compares the return on the class A<br />
common stock with the return on the S&P 500 Index, the Russell 2000 Index and an index comprised of public companies with the Standard Industrial Classification (SIC) Code<br />
6282, Investment Advice. We have elected to use the S&P 500 Index in place of the Russell 2000 Index as our broad market index. We view the S&P 500 Index as a more<br />
widely recognized benchmark of U.S. equity market performance. The comparison assumes that $<strong>10</strong>0 was invested in the class A common stock and in each of the named indices,<br />
including the reinvestment of dividends, on December 31, 2001. This chart is not intended to forecast future performance of our common stock.<br />
[TOTAL RETURN COMPARISON GRAPH]<br />
Dec. 31, Dec. 31, Dec. 31, Dec. 31, Dec. 31, Dec. 31,<br />
2001 2002 2003 2004 2005 2006<br />
<strong>GAMCO</strong> <strong>Investors</strong>, <strong>Inc</strong>. <strong>10</strong>0.00 69.54 92.18 116.61 <strong>10</strong>4.82 92.90<br />
SIC Code Index <strong>10</strong>0.00 78.23 <strong>10</strong>3.13 132.63 165.57 215.88<br />
S&P 500 Index <strong>10</strong>0.00 76.85 97.71 <strong>10</strong>9.92 115.32 133.54<br />
Russell 2000 Index <strong>10</strong>0.00 78.42 114.00 133.94 138.40 162.02<br />
40