Producing a Depth Converted Seismic Horizon in Zmap
Producing a Depth Converted Seismic Horizon in Zmap
Producing a Depth Converted Seismic Horizon in Zmap

Create successful ePaper yourself
Turn your PDF publications into a flip-book with our unique Google optimized e-Paper software.
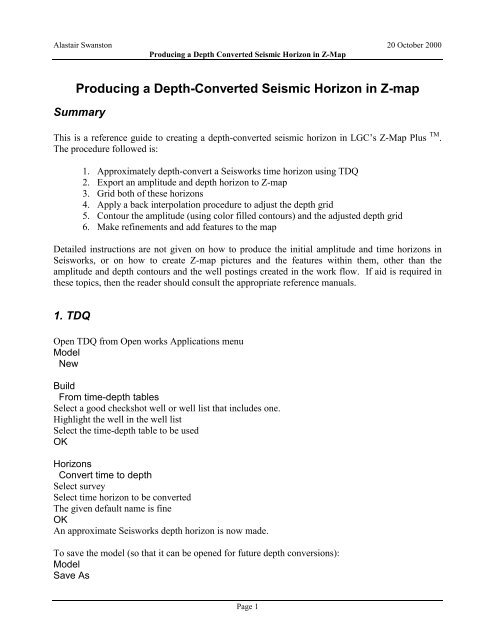
Alastair Swanston 20 October 2000<br />
<strong>Produc<strong>in</strong>g</strong> a <strong>Depth</strong> <strong>Converted</strong> <strong>Seismic</strong> <strong>Horizon</strong> <strong>in</strong> Z-Map<br />
<strong>Produc<strong>in</strong>g</strong> a <strong>Depth</strong>-<strong>Converted</strong> <strong>Seismic</strong> <strong>Horizon</strong> <strong>in</strong> Z-map<br />
Summary<br />
This is a reference guide to creat<strong>in</strong>g a depth-converted seismic horizon <strong>in</strong> LGC’s Z-Map Plus TM .<br />
The procedure followed is:<br />
1. Approximately depth-convert a Seisworks time horizon us<strong>in</strong>g TDQ<br />
2. Export an amplitude and depth horizon to Z-map<br />
3. Grid both of these horizons<br />
4. Apply a back <strong>in</strong>terpolation procedure to adjust the depth grid<br />
5. Contour the amplitude (us<strong>in</strong>g color filled contours) and the adjusted depth grid<br />
6. Make ref<strong>in</strong>ements and add features to the map<br />
Detailed <strong>in</strong>structions are not given on how to produce the <strong>in</strong>itial amplitude and time horizons <strong>in</strong><br />
Seisworks, or on how to create Z-map pictures and the features with<strong>in</strong> them, other than the<br />
amplitude and depth contours and the well post<strong>in</strong>gs created <strong>in</strong> the work flow. If aid is required <strong>in</strong><br />
these topics, then the reader should consult the appropriate reference manuals.<br />
1. TDQ<br />
Open TDQ from Open works Applications menu<br />
Model<br />
New<br />
Build<br />
From time-depth tables<br />
Select a good checkshot well or well list that <strong>in</strong>cludes one.<br />
Highlight the well <strong>in</strong> the well list<br />
Select the time-depth table to be used<br />
OK<br />
<strong>Horizon</strong>s<br />
Convert time to depth<br />
Select survey<br />
Select time horizon to be converted<br />
The given default name is f<strong>in</strong>e<br />
OK<br />
An approximate Seisworks depth horizon is now made.<br />
To save the model (so that it can be opened for future depth conversions):<br />
Model<br />
Save As<br />
Page 1
Alastair Swanston 20 October 2000<br />
<strong>Produc<strong>in</strong>g</strong> a <strong>Depth</strong> <strong>Converted</strong> <strong>Seismic</strong> <strong>Horizon</strong> <strong>in</strong> Z-Map<br />
Give it a name (identify<strong>in</strong>g it as yours) and a comment if you desire<br />
OK<br />
2. Export to <strong>Zmap</strong><br />
Open Seisworks<br />
It is a good idea to check that your new depth horizon has been created and looks approximately<br />
correct <strong>in</strong> Map View before cont<strong>in</strong>u<strong>in</strong>g.<br />
From the Seisworks ma<strong>in</strong> menu, select<br />
Interpret<br />
Export to Z-MAP Plus<br />
Click the MFD Output – List button:<br />
Create an appropriately named mfd file <strong>in</strong> your Z-map directory (If you don't have one, then you<br />
can add one <strong>in</strong> /hydro/d0/<strong>Zmap</strong>).<br />
It is best to create a new Z-map mfd rather than add<strong>in</strong>g the exported horizons to an exist<strong>in</strong>g one.<br />
Do not select Flip Values on export<br />
Click the <strong>Horizon</strong>s box.<br />
Select the horizons that you wish to export (amplitude and depth), and deselect any that may be<br />
highlighted that you do not want to export.<br />
Do not export Znons<br />
You can leave the l<strong>in</strong>e and trace values as defaults (the fist <strong>in</strong> the survey), but change the Increment<br />
to a sensible value, s<strong>in</strong>ce this determ<strong>in</strong>es the density of the exported data. The <strong>in</strong>formation at the<br />
base of Seisworks Map View will tell you the l<strong>in</strong>e and trace <strong>in</strong>crements <strong>in</strong> the survey. It is best to<br />
pick <strong>in</strong>crements that correspond to 100 - 300 feet. Tak<strong>in</strong>g every other l<strong>in</strong>e and trace will usually<br />
accomplish this.<br />
Leave the faults and contours buttons unselected if you do not have any <strong>in</strong>terpreted.<br />
OK<br />
Page 2
Alastair Swanston 20 October 2000<br />
<strong>Produc<strong>in</strong>g</strong> a <strong>Depth</strong> <strong>Converted</strong> <strong>Seismic</strong> <strong>Horizon</strong> <strong>in</strong> Z-Map<br />
3. Z-Map<br />
This paper does not give <strong>in</strong>structions on how to create basemaps and features such as title blocks,<br />
map borders etc., but concentrates on how to produce an amplitude map of a seismic horizon with<br />
depth converted structure contours.<br />
Open Z-map from the OpenWorks menu<br />
Create or open the picture that will conta<strong>in</strong> the amplitude and structure map of your horizon. Note,<br />
there should be sufficient space outside the map border for the amplitude color bar that will be<br />
created <strong>in</strong> this procedure (4 <strong>in</strong>ches is a good value).<br />
Make sure that there is a directory path to the newly created mfd file.<br />
Open the mfd us<strong>in</strong>g:<br />
File<br />
MFD Open/Close<br />
3.1 Create a bound<strong>in</strong>g Polygon for the Event<br />
Post either the exported amplitude or depth data from Seisworks us<strong>in</strong>g:<br />
View<br />
(X,Y,Z)Po<strong>in</strong>t data<br />
Select Data - select your data file<br />
OK (you don't need to alter the other parameters)<br />
The location of all the exported po<strong>in</strong>ts should be posted on your map. Trace around the edge to<br />
make the polygon by:<br />
Page 3
Alastair Swanston 20 October 2000<br />
<strong>Produc<strong>in</strong>g</strong> a <strong>Depth</strong> <strong>Converted</strong> <strong>Seismic</strong> <strong>Horizon</strong> <strong>in</strong> Z-Map<br />
Edit<br />
Edit/Create Data<br />
Create Data<br />
Polyl<strong>in</strong>e<br />
Give it a filename e.g. horizon_name polygon<br />
Save it <strong>in</strong> the mfd that you created<br />
OK<br />
OK<br />
Create the l<strong>in</strong>e by click<strong>in</strong>g with the left mouse button and then trace around the outl<strong>in</strong>e with the<br />
middle mouse button.<br />
Click End And Close to complete the polygon, and then OK.<br />
Delete the posted values us<strong>in</strong>g<br />
Edit<br />
Edit Picture<br />
Delete Features<br />
Posted contol po<strong>in</strong>ts and values<br />
OK<br />
You can check that the polygon was created successfully by<br />
View<br />
Features<br />
L<strong>in</strong>es<br />
File<br />
Select Data<br />
Click on your polygon<br />
OK (the other parameters are f<strong>in</strong>e)<br />
You may need to refresh the screen to see it.<br />
3.2 Grid the Amplitude Data<br />
Gridd<strong>in</strong>g<br />
Po<strong>in</strong>t Gridd<strong>in</strong>g Plus<br />
(It is usually good practice to click Unlock parameters on all of these types of Z-map menus, s<strong>in</strong>ce<br />
unwanted parameters may rema<strong>in</strong> from previous work.)<br />
Chang<strong>in</strong>g the gridd<strong>in</strong>g parameters greatly affects the gridd<strong>in</strong>g procedure and result. The follow<strong>in</strong>g<br />
parameters work well for seismic data, but you may wish to experiment or refer to the Z-map<br />
manual for more <strong>in</strong>formation.<br />
Page 4
Alastair Swanston 20 October 2000<br />
<strong>Produc<strong>in</strong>g</strong> a <strong>Depth</strong> <strong>Converted</strong> <strong>Seismic</strong> <strong>Horizon</strong> <strong>in</strong> Z-Map<br />
Contol po<strong>in</strong>ts - select your amplitude data<br />
Select a fault set if you have one<br />
Output file names - enter a suitable name e.g. horizon_name amplitude grid<br />
Save it <strong>in</strong> the same mfd<br />
Primary parameters - Change the search radius to someth<strong>in</strong>g only slightly larger than the X<br />
and Y <strong>in</strong>crements.<br />
Secondary Parameters - Change weight<strong>in</strong>g to Smooth<br />
Flex<strong>in</strong>g Parameters - Change Smoothness modulus to about 0.8<br />
Number of Ref<strong>in</strong>ements : 2<br />
Number of Flex Passes: 7<br />
Other parameters can be left as default<br />
Apply<br />
Gridd<strong>in</strong>g should take a couple of m<strong>in</strong>utes.<br />
Click Save when it's done.<br />
Make a note of the Z-Value range <strong>in</strong> the grid, which can be found with<br />
File<br />
Info<br />
Grid Statistics<br />
Click the newly created grid<br />
The <strong>in</strong>formation is displayed <strong>in</strong> the Z-Map system w<strong>in</strong>dow.<br />
Click Cancel when done.<br />
3.3 Color Contour Amplitude Map<br />
The easiest way to make a color contour amplitude map with a scale bar is to use the Color-filled<br />
Contour Macro, located <strong>in</strong><br />
Macros<br />
Graphics<br />
Color-filled Contours<br />
Click Fill <strong>in</strong> Macro Parameters Defaults<br />
View Parameter Panels...<br />
Select your amplitude grid<br />
Use a fault file if you have one, otherwise click None - use no file<br />
Set Contour Ref<strong>in</strong>ement: F<strong>in</strong>e<br />
Enter the maximum and m<strong>in</strong>imum contour values that you found from the grid statistics<br />
You want to have about 30 - 50 contours, so set the contours <strong>in</strong>terval accord<strong>in</strong>gly<br />
Number of contours = Max - M<strong>in</strong> + 1<br />
OK<br />
Page 5
Alastair Swanston 20 October 2000<br />
<strong>Produc<strong>in</strong>g</strong> a <strong>Depth</strong> <strong>Converted</strong> <strong>Seismic</strong> <strong>Horizon</strong> <strong>in</strong> Z-Map<br />
The next 2 boxes of parameters are not needed, so click<br />
OK<br />
OK<br />
Change Draw Contour L<strong>in</strong>es on Picture to OMIT<br />
Colorbar location: Left (or wherever you want it)<br />
OK<br />
Select the polygon that you created<br />
OK for the next box<br />
Apply<br />
The procedure should aga<strong>in</strong> take a couple of m<strong>in</strong>utes<br />
Click Save<br />
Redraw your Map <strong>in</strong> the ma<strong>in</strong> w<strong>in</strong>dow.<br />
You should now have a color contour map with a color scale.<br />
Edit the colors to make a suitable scale us<strong>in</strong>g the color table button on the left of the ma<strong>in</strong> w<strong>in</strong>dow<br />
Click on the color squares to edit them. Interpolate is a very useful option. A "spectrum" type<br />
color scheme usually works well.<br />
(At this stage, faults can be <strong>in</strong>terpreted <strong>in</strong> Z-map, us<strong>in</strong>g the amplitudes as a guide. This is done<br />
us<strong>in</strong>g a similar procedure to how the polygon was created previously.)<br />
Page 6
Alastair Swanston 20 October 2000<br />
<strong>Produc<strong>in</strong>g</strong> a <strong>Depth</strong> <strong>Converted</strong> <strong>Seismic</strong> <strong>Horizon</strong> <strong>in</strong> Z-Map<br />
3.4 Gridd<strong>in</strong>g the <strong>Depth</strong> Data<br />
Grid the depth horizon us<strong>in</strong>g exactly the same procedure and changes from the defaults as was done<br />
for the amplitude horizon. Name the grid someth<strong>in</strong>g like horizon_name TDQ depth grid. Make<br />
sure that you reduce the search radius.<br />
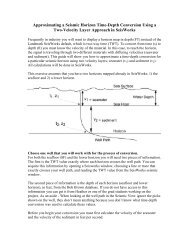
4. Back Interpolation<br />
The next stage is to adjust the crude depth conversion that TDQ produces to fit the well data for the<br />
horizon. The back <strong>in</strong>terpolation method f<strong>in</strong>ds the depth <strong>in</strong> the TDQ grid at the position of each<br />
well. This is then subtracted from the well depth, then this "error" data is gridded and then added to<br />
the orig<strong>in</strong>al TDQ grid to produce a corrected depth grid.<br />
Well<br />
Back-Interpolated<br />
TDQ <strong>Horizon</strong> <strong>Depth</strong>,<br />
H<br />
Error, E<br />
TDQ <strong>Depth</strong><br />
<strong>Horizon</strong><br />
Grid<br />
Sub-Sea <strong>Depth</strong><br />
from Well Data,<br />
W<br />
W – H = E<br />
⇒ W = H – E<br />
Figure: Diagram illustrat<strong>in</strong>g the theory beh<strong>in</strong>d the back-<strong>in</strong>terpolation method.<br />
A data file of horizon depth (True vertical, Sub-sea) and well names is needed for this operation. If<br />
one does not exist, then you can create a text file <strong>in</strong> Z-map friendly format and import it (see the<br />
reference manual).<br />
Page 7
Alastair Swanston 20 October 2000<br />
<strong>Produc<strong>in</strong>g</strong> a <strong>Depth</strong> <strong>Converted</strong> <strong>Seismic</strong> <strong>Horizon</strong> <strong>in</strong> Z-Map<br />
4.1 Post the well <strong>in</strong>formation on the map<br />
View<br />
(X,Y,Z)Po<strong>in</strong>t Data<br />
Select Data: The well data file<br />
Fields to post: The well name and SSTV <strong>Depth</strong><br />
Labell<strong>in</strong>g parameters<br />
Field Parameters<br />
Well Name<br />
Choose a color<br />
Font: Duplex<br />
Height: 0.14<br />
OK<br />
Save<br />
OK<br />
SS <strong>Depth</strong>:<br />
Font: Duplex<br />
Height: 0.12<br />
Location: Below<br />
Operations<br />
Back Interpolation<br />
Select <strong>in</strong>put grid - the TDQ depth grid<br />
Select a fault file if you have one<br />
Select Input Data - the well data file.<br />
Output Z-field:<br />
New Field - Give it a name (e.g. BI depth data)<br />
Output Name..<br />
Call it horizon_name BI depth data<br />
Apply<br />
Save<br />
4.2 F<strong>in</strong>d the difference between the TDQ depth and the well <strong>Depth</strong><br />
Operations<br />
Data Operations<br />
Dual Data Operations<br />
Input data: The data file that you just created<br />
Input A: The back <strong>in</strong>terpolated data<br />
Input B: The well data<br />
Operation: Subtract (This is A-B)<br />
Output Field: New Field e.g. <strong>Depth</strong> error<br />
Field Type: Z-Value<br />
Page 8
Alastair Swanston 20 October 2000<br />
<strong>Produc<strong>in</strong>g</strong> a <strong>Depth</strong> <strong>Converted</strong> <strong>Seismic</strong> <strong>Horizon</strong> <strong>in</strong> Z-Map<br />
OK<br />
Apply<br />
Save<br />
Output Data: Name - e.g. horizon_name <strong>Depth</strong> error data<br />
The data statistics can be found <strong>in</strong> the System W<strong>in</strong>dow. The values typically range from ± several<br />
hundred feet.<br />
4.3 Grid the Error Data<br />
Gridd<strong>in</strong>g<br />
Po<strong>in</strong>t Gridd<strong>in</strong>g Plus<br />
(Unlock Parameters)<br />
Control po<strong>in</strong>ts: Your error data set<br />
Z-field: Use the <strong>Depth</strong> error field that you created<br />
Use a fault file if you have one<br />
Output filename: E.g. horizon_name depth error grid<br />
Primary parameters: It is important to alter the X, Y and Z bound<strong>in</strong>g values such that the grid<br />
will extend over the whole horizon, and not just where the wells are (the Z maximum and<br />
m<strong>in</strong>imum should be <strong>in</strong>creased so that the grid values can <strong>in</strong>crease/decrease beyond the region of<br />
the wells - <strong>in</strong>creas<strong>in</strong>g their magnitude by 500 feet should suffice).<br />
Set the X and Y <strong>in</strong>crements to about 400 feet<br />
Leave the Search Radius as the default value<br />
OK<br />
Secondary parameters: Leave as defaults<br />
Flex<strong>in</strong>g parameters: Set Number of Ref<strong>in</strong>ements to 2<br />
OK<br />
Apply<br />
Save<br />
4.4 Subtract the error Grid from the TDQ grid<br />
Operations<br />
Grid Operations<br />
Dual Grid Operations<br />
Grid A: The TDQ grid<br />
Grid B: The error depth grid<br />
Operation: Subtract<br />
Output Grid Name: E.g. <strong>Horizon</strong>_name <strong>Depth</strong> Grid<br />
Source for area of <strong>in</strong>terest: Intersection<br />
OK<br />
Set X and Y <strong>in</strong>crements to 400 ft<br />
Page 9
Alastair Swanston 20 October 2000<br />
<strong>Produc<strong>in</strong>g</strong> a <strong>Depth</strong> <strong>Converted</strong> <strong>Seismic</strong> <strong>Horizon</strong> <strong>in</strong> Z-Map<br />
Apply<br />
Save<br />
OK<br />
4.5 Contour the New <strong>Depth</strong> Grid<br />
View<br />
Contour<strong>in</strong>g<br />
Contour<br />
Input file: The new adjusted depth grid<br />
Constra<strong>in</strong>t: Use a fault file if you have one, otherwise the horizon polygon<br />
Contour<strong>in</strong>g Parameters…<br />
Change the m<strong>in</strong>imum to the nearest multiple of 500 below the value given<br />
100 ft is a good contour <strong>in</strong>terval<br />
Curve Sampl<strong>in</strong>g Density: F<strong>in</strong>e<br />
OK<br />
Curve Draw<strong>in</strong>g and Label<strong>in</strong>g Parameters:<br />
Contour Labels: 5<br />
Reference Contours: 5<br />
Distance to first label: 3<br />
Character Height: 0.15<br />
Change the Start<strong>in</strong>g Color <strong>in</strong>dex for Contour L<strong>in</strong>es to an unused color, e.g. 23<br />
OK<br />
OK<br />
Refresh the Ma<strong>in</strong> W<strong>in</strong>dow if necessary. Zoom <strong>in</strong> to verify that the <strong>Depth</strong> contours honor the well<br />
data.<br />
If you did not use a polygon <strong>in</strong> the contour<strong>in</strong>g (you had a fault file), then the contours will extend<br />
beyond the horizon for a short distance. A simple way to deal with this is to make them the same<br />
color as the background. S<strong>in</strong>ce the map will often be plotted, it is advisable to change to<br />
background color from black to white. Then, alter the contour color to white us<strong>in</strong>g the color table.<br />
Tip: Z-map often gets confused when us<strong>in</strong>g pure black or white because they can alter when the<br />
background color is changed. This can be avoided by us<strong>in</strong>g a non-pure color i.e. for white, make<br />
one of the red, blue or green percentages 99% rather than 100%, and similarly for black.<br />
5. F<strong>in</strong>al Edits<br />
The map can be ref<strong>in</strong>ed by alter<strong>in</strong>g the widths of the l<strong>in</strong>es etc. us<strong>in</strong>g<br />
Edit<br />
Edit/Create Data<br />
Contours, Faults, L<strong>in</strong>es<br />
Page 10
Alastair Swanston 20 October 2000<br />
<strong>Produc<strong>in</strong>g</strong> a <strong>Depth</strong> <strong>Converted</strong> <strong>Seismic</strong> <strong>Horizon</strong> <strong>in</strong> Z-Map<br />
Display parameters<br />
By l<strong>in</strong>e<br />
Click on the l<strong>in</strong>e you wish to change<br />
Make whatever changes are necessary<br />
Click OK when you’ve f<strong>in</strong>ished.<br />
You can also make small hand alterations to the contours us<strong>in</strong>g:<br />
Edit<br />
Edit/Create Data<br />
Contours, Faults, L<strong>in</strong>es<br />
Page 11