Stopwatch and Timer Calibrations - National Institute of Standards ...
Stopwatch and Timer Calibrations - National Institute of Standards ...
Stopwatch and Timer Calibrations - National Institute of Standards ...
- No tags were found...

Create successful ePaper yourself
Turn your PDF publications into a flip-book with our unique Google optimized e-Paper software.
The Direct Comparison Method <br />
path, the received uncertainty <strong>of</strong> the radio signal will still not exceed 1 ms [13].<br />
If a traceable time display is used instead <strong>of</strong> a radio signal or telephone signal,<br />
it can generally be assumed that the uncertainty <strong>of</strong> the display is less than 1<br />
ms. This is because instruments that continuously synchronize their displays to<br />
traceable signals will normally have repeatable <strong>and</strong> stable delays. However, in<br />
order for this uncertainty estimate to be valid, be sure to use only time displays<br />
that meet the traceability requirements discussed in Section 5.A.3.<br />
5.C.2. Uncertainty Due to Human Reaction Time<br />
To underst<strong>and</strong> the effect <strong>of</strong> human reaction time on stopwatch <strong>and</strong> timer calibration<br />
uncertainties, a small study was conducted at S<strong>and</strong>ia <strong>National</strong> Laboratories. Four<br />
individuals were selected <strong>and</strong> asked to calibrate a st<strong>and</strong>ard stopwatch using the<br />
direct comparison method. Two separate experiments were conducted. In the<br />
first experiment, the operators were asked to use a traceable audio time signal,<br />
<strong>and</strong> in the second experiment, the operators were asked to use a traceable time<br />
display. The time base <strong>of</strong> the stopwatch was measured before <strong>and</strong> after each test<br />
(using the Time Base Method), <strong>and</strong> its <strong>of</strong>fset from nominal was found to be small<br />
enough that it would not influence the test. Therefore, differences in readings<br />
between the stopwatch being tested <strong>and</strong> the st<strong>and</strong>ard would be due only to the<br />
operator’s reaction time. Each operator was asked to repeat the measurement<br />
process 10 times, <strong>and</strong> the resulting 10 differences between the st<strong>and</strong>ard <strong>and</strong> the<br />
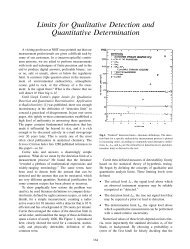
stopwatch were recorded <strong>and</strong> plotted (Figure 11).<br />
As shown in Figure 11, the average reaction time was usually less than 100<br />
ms, with a worst-case reaction time exceeding 700 ms. The mean <strong>and</strong> st<strong>and</strong>ard<br />
deviation for each operator was computed <strong>and</strong> graphed in Figure 12. This graph<br />
indicates that the average (mean) reaction time <strong>of</strong> the operator can be either<br />
negative (anticipating the audible tone) or positive (reacting after the audible<br />
tone). Figure 12 also shows that in addition to the average reaction time having<br />
a bias, the data is somewhat dispersed, so both elements <strong>of</strong> uncertainty will need<br />
to be considered in a complete uncertainty budget. For this experiment, the<br />
worst case mean reaction time was 120 ms <strong>and</strong> the worst case st<strong>and</strong>ard deviation<br />
was 230 ms. It should be noted that in the measurements recorded in Figure 12,<br />
Operators 1 <strong>and</strong> 2 had no previous experience calibrating stopwatches. Based on<br />
these results, it is recommended that each calibration laboratory perform tests to<br />
determine the uncertainty <strong>of</strong> their operator’s reaction time.<br />
35