NORTHEAST GEORGIA - University System of Georgia
NORTHEAST GEORGIA - University System of Georgia
NORTHEAST GEORGIA - University System of Georgia

You also want an ePaper? Increase the reach of your titles
YUMPU automatically turns print PDFs into web optimized ePapers that Google loves.
ECONOMIC STUDY<br />
<strong>of</strong><br />
<strong>NORTHEAST</strong> <strong>GEORGIA</strong><br />
Prepared For<br />
Northeast <strong>Georgia</strong> Development<br />
and Planning Association<br />
and<br />
The Agricultural and industrial<br />
Development Board <strong>of</strong> <strong>Georgia</strong><br />
State ....<br />
Engineering<br />
Experiment<br />
Station . . .<br />
<strong>Georgia</strong><br />
Indutrul . .<br />
. . Econ<<br />
Re*earcb<br />
Special t*port No. 21<br />
Me* $4<br />
Industrial Economic Research Staff<br />
State Engineering Experiment Station<br />
<strong>Georgia</strong> School <strong>of</strong> Technology, Atlanta<br />
April, 1946
The State Engineering Experiment Station <strong>of</strong> the <strong>Georgia</strong> School <strong>of</strong><br />
Technology is the engineering and industrial research agency <strong>of</strong> the Uni<br />
versity <strong>System</strong> <strong>of</strong> <strong>Georgia</strong>. It serves to coordinate and advance research<br />
activities <strong>of</strong> the School through an integrated program <strong>of</strong> fundamental and<br />
applied research and development, for the purpose <strong>of</strong> contributing to the<br />
general welfare <strong>of</strong> the State. It is organized to aid directly in the de<br />
velopment and integration <strong>of</strong> industrial and agricultural activities and<br />
better utilization <strong>of</strong> resources in the South through its investigations<br />
and technological studies.<br />
The affairs <strong>of</strong> the Station are administered by the Director with the<br />
counsel <strong>of</strong> the Faculty Advisory Council Consisting <strong>of</strong> Faculty members ap<br />
pointed from the faculties <strong>of</strong> the <strong>Georgia</strong> School <strong>of</strong> Technology and other<br />
units <strong>of</strong> the <strong>University</strong> <strong>System</strong> <strong>of</strong> <strong>Georgia</strong>. The Staff is made up <strong>of</strong> a Di<br />
rector, Assistant Director, full-time Research Fellows, Assistants and<br />
Consultants, Faculty Associates and Research Graduate and Technical As<br />
sistants.<br />
Faculty members are encouraged to engage in scientific research along<br />
with their teaching duties. These men have at their disposal a variety <strong>of</strong><br />
special research equipment and facilities in the Station, as well as the<br />
regular equipment available to them in the various departments <strong>of</strong> the<br />
School.<br />
To make the results <strong>of</strong> its scientific investigations available to the<br />
public, the State Engineering Experiment Station publishes and distributes<br />
technical Bulletins. It also publishes circulars- <strong>of</strong> timely interest, pre<br />
senting information <strong>of</strong> importance, compiled from various sources, and not<br />
otherwise readily accessible to the public and the engineering pr<strong>of</strong>ession,<br />
and reprints <strong>of</strong> articles written by members <strong>of</strong> the staff appearing in<br />
technical periodicals.<br />
For copies <strong>of</strong> publications or for other information address:<br />
Gerald A. Rosselot, Director,<br />
The State Engineering Experiment Station,<br />
<strong>Georgia</strong> School <strong>of</strong> Technology,<br />
Atlanta, <strong>Georgia</strong>.<br />
--II
Table <strong>of</strong> Contents<br />
Page<br />
Index <strong>of</strong> Tables .................. Iv-v<br />
Preface. .................... vi-x<br />
Northeast <strong>Georgia</strong> Area. ................ 1-2<br />
Sistory. ..................... 3-6<br />
Weather. .............. ....... 7-11<br />
Housing. .................... 12-20<br />
Population. ................... 2I-2k<br />
»<br />
Labor Force ................... 25-38<br />
Income ..................... 39-hh<br />
Tourist and Recreation. ............... It5-50<br />
Industries. ................... 51-153<br />
Introduction .................. 51-55<br />
Power. .................... 56-62<br />
Mineral Industries ................ 63-72<br />
Refractories .................. 73-81 .<br />
Brick and Tile. ................. 62-90 "<br />
Glass and Sand. ................ 91-100<br />
Forest Industries. ............... 101-lli2<br />
Timber. .................. 101-139<br />
Paper ...................<br />
Handcraft ..................<br />
Plastics. ..................<br />
Clothjoig. .................. 1U6-1U9<br />
Agricultural Industries.............. 150-153<br />
Taxes .................... 15^-158<br />
Water .................... 159-167<br />
Agriculture .................. 168-251<br />
Agricultural Summary. .............. 168-17U<br />
County Income Classification ............ 175-193<br />
Agricultural Characteristics ........."... 19l»-227<br />
Livestock .................. 228-251<br />
County Sunmaries. ................ 252-280<br />
Hi
Index <strong>of</strong> Tables<br />
Table Title Page Table<br />
Weather<br />
W-l Average Maximum Temperature 9 U-h<br />
W-la Highest Temperature 8<br />
K-Z Average Minimum Temperature 9 M-5<br />
W-2a Lowest Temperatures 8 M-6<br />
IT-3 Average Growing Season<br />
W-U Average Days with 0.01 Inches<br />
W-5<br />
W-6<br />
H-l<br />
H-2<br />
H-3<br />
E-k<br />
P-l<br />
P-2<br />
P-3<br />
P-k<br />
P-5<br />
or More Precipitation 10<br />
Average Precipitation Average Snowfall 11<br />
10<br />
Housing<br />
Dwellings by Race, Ownership<br />
and Population Type 12-llj<br />
Kunfcer <strong>of</strong> Dwelling Units 16-17<br />
Dwellings by Tear Built,<br />
State <strong>of</strong> Repair 18-19<br />
Ewslling Urits, Households 17<br />
Population<br />
Population by Race and Sex 23<br />
Rural Fam Population 2li<br />
lion-Farm Population 2:<br />
Rural Kon-Fara Population 2!<br />
War Changes in population 21<br />
Labor Force<br />
L-l Labor Force Summary 25<br />
L-2 Agricultural Labor Force 26<br />
L-3 Industrial Labor Force 27<br />
L-li Labor Force, 19l|0 29<br />
L-5 Unite Labor Force 30<br />
L-6 Kon-ffhite Labor Force 37<br />
L-7 19l
Table Title<br />
T-l<br />
T-2<br />
fi-lt<br />
G-5<br />
A-l<br />
A-la<br />
A-lt<br />
A-lta<br />
A-57<br />
A-2<br />
A-2a<br />
A-3<br />
A-3b<br />
A-3c<br />
A-S5<br />
A-Lia<br />
A-5<br />
A-6<br />
A-7<br />
A-3<br />
A-Ga<br />
A-9<br />
A-9a<br />
A-10<br />
A-n<br />
A-12<br />
A-13<br />
A-llt<br />
A-15<br />
Taxes<br />
State and County Tax Rates l51j<br />
Typical Balance Sheets 155-158<br />
Water<br />
Minimum Stream Flow l6l<br />
River Gaging Stations 162-161;<br />
Agricultural Summary<br />
Summary, 1920, 1930,<br />
191tO 170-172<br />
Man Labor Maeda 173<br />
Land Use 169<br />
Land Use Averages 168<br />
Farm Acreages 19l|0-19l»5 163<br />
County Income Classification<br />
Farms 1in <strong>Georgia</strong> by Income<br />
and Size Segments 176<br />
<strong>Georgia</strong> Income-Size Ratios 177<br />
Income, Size-<strong>of</strong>-Farm Seg<br />
ments, Income-Size<br />
Ratios 181-182<br />
Humber <strong>of</strong> Farms by Income,<br />
3ize-<strong>of</strong>-Farm Segments l83-l8ii<br />
Comparison with <strong>Georgia</strong> 185<br />
Minimum Levels Which Will<br />
Absorb AH Tenant Faras ISO<br />
Agricultural Characteristics<br />
Land Use Averages 221<br />
Number and Size <strong>of</strong> Farms 228<br />
Value <strong>of</strong> Farms 229<br />
Autos, Trucks and Tractors 230<br />
Average Value <strong>of</strong> All Prod<br />
ucts 203<br />
Number-Income Ratios <strong>of</strong><br />
Farms 19U<br />
Consumption Farm Products 212<br />
Consumption on Fants with<br />
Production <strong>of</strong> $250 or Less 211j<br />
Total and Average Value <strong>of</strong><br />
Products 195-196<br />
Acreage Operated by Owners 222<br />
Farms Operated by Tenants 221<br />
Number <strong>of</strong> Farms by Grpups 20lt<br />
Subsistence Farm Produc<br />
tion 215-220<br />
Total Value <strong>of</strong> Products 223<br />
Page Table Title Page<br />
Characteristics (cont©d)<br />
A-37 saies 01 vege^aoleo PIT<br />
A-37a Vslue <strong>of</strong> Vegetables 208<br />
A-lil Farm Wages© 226<br />
A.-56 Orchards 198-200<br />
A-59 Poultry 201<br />
A-6C Fruits and Nuts 207<br />
A-61 Farm Groups and Types 205<br />
A-62 Farm Operators Not Fanners 212<br />
A-63 Products Consumed 22U-225<br />
A-61i Tractors on Non-<br />
Subsistence Fanns 223<br />
A-65 Work <strong>of</strong>f Farm 227<br />
A-66 Cropland Adapted, Available<br />
and Devoted to Vegetables 209<br />
A-67 Acreage and Production <strong>of</strong><br />
Vegetables 208<br />
A-68 Vegetables Sold to Various<br />
Type Buyers 210<br />
A-16<br />
A-17<br />
A-18<br />
A-19<br />
A-2C<br />
A-21<br />
A-22<br />
A-2U<br />
A-25<br />
A-26<br />
A-27<br />
A-28<br />
A-28&<br />
A-29<br />
A-30<br />
A-31<br />
A-32<br />
A-33<br />
A-3U<br />
A-35<br />
A-36<br />
A-39<br />
A-ltf<br />
A-50<br />
A-69<br />
Livestock<br />
Acreage Per Ar.imal Unit 21*0<br />
AnJjnal Unit Distribution 2ijl<br />
Animal Unit Percentage 2ld<br />
19iiO Feed Requirements 235<br />
Corn Equivalents 238-239<br />
Maximum Aniical Units 2UO<br />
Annual Feed Requirements 236<br />
Effect <strong>of</strong> Improved Practice 237<br />
Forage Crop Yields 236<br />
Hay Production and Sug<br />
gested Increases 2h2<br />
Suggested Realisation <strong>of</strong><br />
Grain Acreage 2ii3<br />
Livestock and Dairy Sales 2liU<br />
Counties with Highest Dairy<br />
or Livestock Income 250<br />
Livestock Sold and Traded 2Ui<br />
Bairy Products Sold 22»7<br />
Number <strong>of</strong> Cows and Heifers 233<br />
Per Cent Cows and Heifers 233<br />
Value Dairy Products 2U
Preface<br />
The Economic Study <strong>of</strong> Northeast <strong>Georgia</strong> is the seventh re<br />
port; in a. series <strong>of</strong> similar studies prepared by the Industrial<br />
Economic Research Staff <strong>of</strong> the State Engineering Experiment<br />
Station at the <strong>Georgia</strong> School <strong>of</strong> Technology.<br />
Statt ....<br />
Experiment<br />
Scit©um . . .<br />
ladnitiul . .<br />
. . Economic<br />
Racarcb . .<br />
As has been pointed out in previous reports, "the prosperity <strong>of</strong><br />
<strong>Georgia</strong> is simply the sum <strong>of</strong> the various local ©prosperities© which exist<br />
in the several sections <strong>of</strong> the state." Each local prosperity is depen<br />
dent on the way the hunan and natural resources which exist are utilized.<br />
The succeeding chapters present an evaluation <strong>of</strong> the facts about these<br />
human and natural resources. The future <strong>of</strong> the Northeast <strong>Georgia</strong> Aroa<br />
depends on what forms <strong>of</strong> action the people living in the sixteen counties<br />
take for the economic utilization <strong>of</strong> these resources.<br />
Despite the unsettled national labor conditions <strong>of</strong> the moment there<br />
is every reason to expect that the postwar period gives promise <strong>of</strong> con<br />
tinuing the high productive pattern with which the United States has<br />
Brazed the world. By V-B Day, partial reconversion <strong>of</strong> industrial opera<br />
tions had begun not only in <strong>Georgia</strong>, but elsewhere. It may be expected<br />
to continue in <strong>Georgia</strong> and the Southeast more rapidly than elsewhere,<br />
since the number <strong>of</strong> job changes to be made is less than in some other<br />
areas, either as a total or relatively. The volume <strong>of</strong> goods produced<br />
may not be as large immediately as pent-up consumer demand will seem<br />
to require nor as available savings could pay for, but, in general,<br />
the Southeast is in a favorable position to increase its productive<br />
service to the nation. Manufacturing in <strong>Georgia</strong> appears to be on the<br />
way to levels equal to or above those attained during the war emergency.<br />
The Northeast <strong>Georgia</strong> Area has long been the source <strong>of</strong> much <strong>of</strong> the<br />
hydro-electric power in <strong>Georgia</strong>. The Savannah river development is<br />
contiguous and will largely increase the power available at low cost. The<br />
Southeast has for years had a power rate situation more favoradle than<br />
the United States average, and manufacturers in the Southeast have used<br />
core power per wage-earner than the average for the United States.<br />
The expansion <strong>of</strong> automobile assembly and manufacture in the Atlanta<br />
area, the class-rate decision <strong>of</strong> the Interstate Commerce Commission and<br />
the authorization by Congress <strong>of</strong> the development <strong>of</strong> the Savannah river<br />
and the Coosa river are all factors in this view with respect to <strong>Georgia</strong>.<br />
The simplification <strong>of</strong> class freight rates which will result from<br />
the Interstate Commerce .Commission decision will very largely expand<br />
the area over which <strong>Georgia</strong> manufacturers will have either an advantage<br />
or parity in shipping costs. Litigation will doubtless delay this ef<br />
fect, but, ultimately rates may be expected which will have this re<br />
sult.<br />
The power and freight rate factors mentioned were contributory to<br />
the recent decisions <strong>of</strong> major automotive manufacturers to expand their"<br />
assembly and manufacturing operations in Atlanta. This in turn creates<br />
numerous opportunities for the establishment in the Northeast <strong>Georgia</strong><br />
Area <strong>of</strong> parts manufacturing plants to serve this expansion.<br />
The foregoing points are stressed because they Illustrate the oper<br />
ation <strong>of</strong> the econoric process.<br />
Vi
Since, as already pointed out, the State economy is merely<br />
the suit <strong>of</strong> local economies (and the national economy, the sum<br />
<strong>of</strong> state economies), decisions in the Northeast <strong>Georgia</strong> Area to<br />
a»nufacture or not to manufacture, to produce or not to produce,|<br />
are the keys to the prosperity <strong>of</strong> the postwar period and to the<br />
planning which it requires.<br />
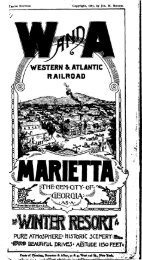
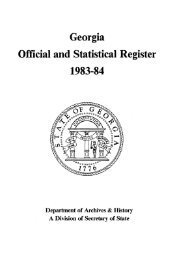
Manufacturing employment in <strong>Georgia</strong> rose to almost twice<br />
the 1939 level during the war period; manufacturing payrolls about<br />
tripled, as shown by the following data on manufacturing:<br />
Comparison <strong>of</strong> Manufacturing Bnployroent<br />
and Payrolls from 1939~"to"<br />
T944 Covered by Unemployment<br />
Insurance<br />
Number <strong>of</strong> Workers<br />
Wages Paid<br />
Sun ....<br />
Engineering<br />
Experiment<br />
Sution . . .<br />
Cnrgia<br />
Tec*<br />
Indutrul . .<br />
. . Economic<br />
Reieanb .<br />
fear<br />
Average<br />
Number<br />
Qnployed<br />
Total<br />
Payrolls<br />
Average<br />
Per<br />
Bnployee<br />
1939<br />
1940<br />
1941<br />
1942<br />
1943<br />
1944<br />
183,000<br />
192,000<br />
231 ,000<br />
258,000<br />
297,000<br />
301 ,000<br />
$150,259,000<br />
161,550,000<br />
224,688,000<br />
300,953,000<br />
440,316,000<br />
509,738,000<br />
$ 821<br />
841<br />
973<br />
1,166<br />
1,483<br />
1,693<br />
Source: <strong>Georgia</strong> Labor Depart<br />
ment, Unemployment Division. The<br />
data include only firms engaged in<br />
nanufacturing and covered by unem<br />
ployment insurance (8 or more ©em<br />
ployees).<br />
1939 19U1 191*2 19W 19UU<br />
So far as <strong>Georgia</strong> is concerned, trends <strong>of</strong> long standing indicate that<br />
the growth shown in the preceding table may be expected to continue. Be<br />
tween 1919 and 1939 manufacturing employment increased from 1.36 per cent<br />
<strong>of</strong> the national total to 2.0 per cent. The relative position <strong>of</strong> wage pay-<br />
Bents in manufacturing over the. same period rose from 0.96 per cent <strong>of</strong> the<br />
national total to 1.19 per cent.<br />
Requirements <strong>of</strong> Planning; The basic problem <strong>of</strong> all postwar planning<br />
is to make possible the continuation <strong>of</strong> production for peace st a rate<br />
which closely approaches what has been done for war.<br />
The requirements for success in such planning are three:<br />
1. A study <strong>of</strong> the problems<br />
2. A decision concerning actions<br />
3. Prompt action in each individual situation when the<br />
proper time comes<br />
Purpose <strong>of</strong> Study: The unbiased examination <strong>of</strong> the various factors<br />
which will have a part in the economic growth <strong>of</strong> the Northeast <strong>Georgia</strong><br />
Area is the object <strong>of</strong> this study. Every effort has been made to pro-<br />
Tide as complete information as possible so that the citizens <strong>of</strong> the<br />
northeast <strong>Georgia</strong> Area and others who are interested in establishing<br />
enterprises may haxe a hasis for decision.
How to Use Report; The report should be regarded as a<br />
source <strong>of</strong> information ajid ideas. Its value lies in the gather<br />
ing together <strong>of</strong> facts and in their presentation in a form which<br />
it is hoped will stimulate thinking on the part <strong>of</strong> those who<br />
read it. Only the facts and general conclusions can be pre<br />
sented; the individual must make his own decisions about fur<br />
ther industrial development <strong>of</strong> the Northeast <strong>Georgia</strong> Area and<br />
about particular situations.<br />
State ....<br />
Engineering<br />
Experiment<br />
Station ...<br />
Grorp©n<br />
Ttd,<br />
bdnftrii! . .<br />
. . Economic<br />
Retcatch . .<br />
Market Research Needed: The expanding <strong>Georgia</strong> and Southeastern m«rkets<br />
which may be expected to result from the postwar expansion <strong>of</strong> indus<br />
try in <strong>Georgia</strong> and the Southeast will serve to emphasize the importance<br />
and general necessity <strong>of</strong> marketing plans and research as an integral part<br />
<strong>of</strong> each new industrial enterprise.<br />
People Just do not buy merchandise simply because it is manufactured.<br />
First and foremost, <strong>of</strong> course, the product must be one for which there is<br />
some consumer demand. This demand is for the product itself, not neces<br />
sarily for the brand made by a particular manufacturer. This demand, how<br />
ever, is not <strong>of</strong> itself, sufficient. The consumer must acquire by some<br />
meats not only a desire to satisfy this latent demand but a desire to buy<br />
the particular variety <strong>of</strong> the wanted product made by some one manufactures<br />
© Marketing research can generally be depended upon to determine<br />
whether or not there is a potential market in general which the manufac<br />
turer has an opportunity for satisfying. The size <strong>of</strong> this potential mar<br />
ket can be measured. The problem <strong>of</strong> developing desire on the part <strong>of</strong> a<br />
sufficient nunber <strong>of</strong> consumers for the variety <strong>of</strong> the product produced by<br />
a particular manufacturer is, generally speaking, dependent on the adver<br />
tising and other sales efforts employed.<br />
One <strong>of</strong> the early steps in developing any new industry is, therefore,<br />
the working out in detail <strong>of</strong> a sales plan. As already suggested, this<br />
should be based on a careful study <strong>of</strong> the market. The services <strong>of</strong> a com<br />
petent advertising agency should generally be secured to make this market<br />
study and help develop the sales plan. Failure to provide for a detailed<br />
and adequate study <strong>of</strong> the market will frequently cause the enterprise to<br />
fail.<br />
Management Skill Essential; The quality <strong>of</strong> the management usually<br />
determines the success or failure <strong>of</strong> an enterprise. In this connection<br />
it cannot be stressed too strongly that the basic element in developing<br />
industries is that <strong>of</strong> the people concerned. The personalities <strong>of</strong> the<br />
management, the extent and limitations <strong>of</strong> their technical knowledge, the<br />
habits and standards <strong>of</strong> living <strong>of</strong> the workers, as well as the likes and<br />
dislikes and desires <strong>of</strong> ultimate consumer, all enter into this calcula<br />
tion.<br />
In general, managerial genius is not required for industrial success.<br />
The exception is in the case <strong>of</strong> the extremely large enterprise <strong>of</strong> which<br />
the national economy contains only a relatively small number. Hhat is re<br />
quired for the vast majority <strong>of</strong> pr<strong>of</strong>itable and useful industrial plants<br />
for which <strong>Georgia</strong> and the Northeast <strong>Georgia</strong> Area <strong>of</strong>fer opportunity is<br />
management with a combination <strong>of</strong> qualities somewhat above average.<br />
Quality Paramount; New industrial enterprises in the Area will,<br />
in general, find their problems fewer if they start out with the intention<br />
and desire <strong>of</strong> making their product the best <strong>of</strong> its kind. IBiile in many<br />
cases, the "perfect" product may entail costs which limit the market, the<br />
vlli
problem ©is always easier if at the price level selected the<br />
plan is to make the product the "best to be had" for a dime, a<br />
dollar, or "whatever the price*<br />
Design Important: Hew products must be attractive if they<br />
are to niove readily in the retail market. The intrinsic qual<br />
ity must not only be built into the product, but the shape and<br />
color must be pleasing. This usually calls for the service <strong>of</strong><br />
a pr<strong>of</strong>essional artist or designer.<br />
Stite ....<br />
Engineering<br />
Experiment<br />
Station . . .<br />
InduKriil . .<br />
. . Economic<br />
Retuich . .<br />
The Industrial Motive; The general assumption that the dominant in<br />
terest <strong>of</strong> management is primarily determined by the pr<strong>of</strong>it motive is by no<br />
means universally true. It is true that pr<strong>of</strong>its are essential to the suc<br />
cessful conduct <strong>of</strong> an industrial enterprise, but the aesthetic pleasure<br />
derived from producing a superior product, the ©social satisfaction <strong>of</strong> pro<br />
viding goods and services useful to other members <strong>of</strong> the community, and<br />
providing employment are just as <strong>of</strong>ten the dominating principle.<br />
Sources <strong>of</strong> Information; In the development <strong>of</strong> this study, informa<br />
tion Eas been~"d~rawn from many sources. This is Indicated by appropriate<br />
footnotes. In the interest <strong>of</strong> brevity, data taken from the reports <strong>of</strong> the<br />
Bureau <strong>of</strong> the Census, since it is a frequent source, are indicated by<br />
exact reference only when presented in tabulated form. The Division <strong>of</strong><br />
Mines, Mining, and Geology; the Forestry Division, and other units in the<br />
<strong>Georgia</strong> Department <strong>of</strong> Natural Resources: the College <strong>of</strong> Agriculture at the<br />
<strong>University</strong> <strong>of</strong> <strong>Georgia</strong>; the county agricultural agents <strong>of</strong> the various<br />
counties; and the Highway Board <strong>of</strong> <strong>Georgia</strong> have provided much useful data.<br />
Arrangement <strong>of</strong> Report; The general arrangement <strong>of</strong> this report is<br />
that <strong>of</strong> a series o separate reports dealing with the major subjects such<br />
as Weather, Population, labor Force, Agriculture, Industry, Geology, and<br />
the like. Agriculture and Industry are broken down beyond this into subreports<br />
dealing with particular phases <strong>of</strong> each subject. In every case an<br />
effort has been made to make each major or sub-section as nearly complete<br />
within itself as possiole i©n order to reduce the necessity for a reader<br />
turning back and forth from one section to another.<br />
All tables are numbered by major sections. In each section, the<br />
table numoer for a particular set <strong>of</strong> data is the same in the Northeast<br />
<strong>Georgia</strong> Report and reports for other areas in the series. This means that<br />
soae table numbers are missing since they deal with suojects not particu<br />
larly related to the Northeast <strong>Georgia</strong> Area. Footnotes are numbered consecu<br />
tively within major sections. In general, graphs and maps are numbered<br />
to correspond with the tables which they illustrate. Graphs and naps which<br />
are not directly associated with tables are given Roman numerals. Wherever<br />
possible geology material is included in the industrial section in associa<br />
tion with the industries for which the minerals or earths being discussed<br />
are used as raw materials.<br />
Acknowledgements; The Agricultural and Industrial Development Board<br />
<strong>of</strong> <strong>Georgia</strong> has provided additional personnel, and this has aided in in<br />
creasing the scope <strong>of</strong> the report. Captain Garland Peyton, Director,<br />
Department <strong>of</strong> Mines, Mining, and Geology, has made possible the section<br />
on Water Resources prepared by M. T. Thomson, District Engineer, S- M.<br />
Eerrick, Assistant Geologist, and W. L. Lamar, Associate chemist, <strong>of</strong> the<br />
later Resources Branch, U. S. Geological Survey. The State Department <strong>of</strong><br />
labor co-operated by making scarce tabulating machine equipment availa&le.
Staff; The staff members who have contributed to the work<br />
<strong>of</strong> preparing this report are Itrs. Bessie Cheek, statistical as<br />
sistant; Mr. H. A. Woodward, and Hiss ©Rebecca Christian, edi<br />
torial assistants.<br />
Staff Consultants; Kueh <strong>of</strong> the geologic information used<br />
was developed by Pr<strong>of</strong>essor Axthur C. Itunyan, graciously made<br />
Sutt....<br />
Enfintfriiii<br />
Expectant<br />
Sutkm . . .<br />
Grorpia<br />
Ttcft<br />
Indutriil . .<br />
. . Econonk<br />
Racarcb . .<br />
available by Emory <strong>University</strong>. The return <strong>of</strong> Dr. Lane llitchell, _______<br />
head <strong>of</strong> the Department <strong>of</strong> Ceramic Engineering, and <strong>of</strong> Charles Wysong, as<br />
sistant pr<strong>of</strong>essor <strong>of</strong> ceramic engineering, from the Navy, made them avail<br />
able for discussion <strong>of</strong> tJie sections on Brick and Tile and Refractories.<br />
Frank F. King and Major John IT. Firor, Sr., Agricultural Economists at th»<br />
College <strong>of</strong> Agriculture, <strong>University</strong> <strong>of</strong> <strong>Georgia</strong>, have expanded the statis<br />
tical analysis developed in previous reports in this series in order to<br />
provide a more complete evaluation <strong>of</strong> the factors which contribute to<br />
fam prosperity in the northeast <strong>Georgia</strong> Area. The tax section is based<br />
on preliminary figures from the state wide study being carried on by G.N.<br />
Sisk, Assistant Pr<strong>of</strong>essor <strong>of</strong> Economics, <strong>Georgia</strong> School <strong>of</strong> Technology.<br />
Dr. Paul Weber, Pr<strong>of</strong>essor <strong>of</strong> Chemical Engineering, has participated in<br />
numerous conferences on industrial problems.<br />
Editorial Review: The Editorial Board consisted <strong>of</strong> Dr. Gerald A.<br />
Eosselot, Director <strong>of</strong> the State Engineering Experiment Station; Dr. Paul<br />
Weber, Assistant Director <strong>of</strong> the Station and Chairman <strong>of</strong> the Station©s<br />
publication committee; E. H. IVeil, Chief, Division <strong>of</strong> Technical Informa<br />
tion; and Pr<strong>of</strong>essor E. E. Dennison, Director <strong>of</strong> Industrial Economic<br />
Research.<br />
Joseph B. Hosmer<br />
Industrial Economist and Xditoi
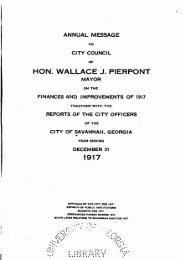
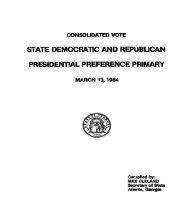
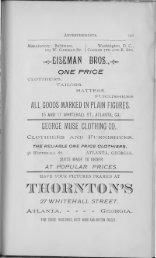
Area<br />
The Northeast <strong>Georgia</strong> Area oomprisea sixteen counties in<br />
the extreme northeastern corner <strong>of</strong> the* state. The 1940 popu<br />
lation <strong>of</strong> the Area was 197,873, and the largest city, Gainesrille,<br />
had a population <strong>of</strong> 10,243. With adjoining Chicopee,<br />
Gaines Cotton Mill,and Dew Holland, there was a compact concen<br />
tration <strong>of</strong> 14,457 people around Gainesville.<br />
Sat. ....<br />
EafiaminB<br />
ExperimiBt<br />
StltioB . . .<br />
Graryu<br />
r«*<br />
Iiuhttrial . .<br />
. . Eccaoak<br />
Rncarcb . .<br />
Tocooa, with a 1940 population <strong>of</strong> 5,494, is the next largest city.<br />
Winder, 3,974; Commerce, 3,294; and Hartwell, 2,372, are other important<br />
centers. The location <strong>of</strong> all county seats and towns and cities <strong>of</strong> orer<br />
500 are shown on the map on page 2. The 1940 populations <strong>of</strong> these cities<br />
were i<br />
County<br />
County<br />
. Seat<br />
1940<br />
Popu<br />
lation<br />
Towns Over 500<br />
1940<br />
Popu-<br />
TatTon<br />
Banks<br />
Homer<br />
283<br />
Ibysrille<br />
614<br />
Barrow<br />
Winder<br />
3,974<br />
Statham<br />
605<br />
Daws on<br />
Dawsonville<br />
319<br />
Forsyth<br />
Cumffling<br />
958<br />
Franklin<br />
Carnesville<br />
361<br />
Laronia<br />
Royston<br />
1,667<br />
1,549<br />
Habersham<br />
Clarkesville<br />
850<br />
Cornelia<br />
Demo rest<br />
Habersham<br />
1,808<br />
820<br />
696<br />
Hall<br />
Gainesrille<br />
10,243<br />
Chioopee<br />
Gaines Cotton Mill<br />
Wirrayrille<br />
New Holland<br />
Flowery Branch<br />
920<br />
1,308<br />
700<br />
1,986<br />
506<br />
Hart<br />
Hartwell<br />
2,372<br />
Koyston.<br />
1,549<br />
Jacks on<br />
Jefferson<br />
1,839<br />
Commerce<br />
Ifeysville<br />
3,294<br />
514<br />
Lumpkln<br />
Dahlonega<br />
1,294<br />
Ifcdison<br />
Danielsville<br />
333<br />
Comer<br />
Royston<br />
811<br />
1,549<br />
Rabun<br />
Clayton<br />
1,088<br />
Mountain City<br />
524<br />
Stephens<br />
Toccoa<br />
5,494<br />
Towns<br />
Hiawassee<br />
163<br />
Union<br />
Blairsville<br />
358<br />
hite<br />
Cleveland<br />
471
The land area <strong>of</strong> the sixteen counties is 2,739,200 acres,<br />
<strong>of</strong> which 63.03 per cent was in farms and 61.8 per cent was in<br />
forest land in 1940. Forty per cent <strong>of</strong> the lan©d la farms was<br />
woodland*<br />
The Chattahoochee River divides the Area into two rather<br />
disiinot regions: forests and mountains to the north and hilly<br />
farm, land to the south. The highlands <strong>of</strong> the northern part have<br />
©in the past proved formidable barriers to settlement and trade, and parts<br />
<strong>of</strong> the region have remained remote. In recent years, however, the con<br />
struction <strong>of</strong> highways has made the whole region accessible. Private and<br />
government enterprises have harnessed the water power <strong>of</strong> the mountain<br />
streams. The forests <strong>of</strong> pine, hemlock, oak, poplar, and maple, under improvei<br />
forest, management, are <strong>of</strong>fering greater forestry possibilities. ;he<br />
Chattahoochee national Forest, with a gross area <strong>of</strong> over a million acres in<br />
the northern part <strong>of</strong> the state, was established to conserve and increase the<br />
productivity <strong>of</strong> the forest land and to protect the watersheds <strong>of</strong> <strong>Georgia</strong>©s<br />
nountain river systems. Both the Chattahoochee and the Savannah rivers<br />
have their origins in the Area. 7ogel State Park, covering four thousand<br />
acres, is within the boundaries <strong>of</strong> the National Forest, and, because <strong>of</strong> its<br />
recreational features <strong>of</strong> lake and forest, attracts thousands <strong>of</strong> vacationers<br />
every year.<br />
The southern part <strong>of</strong> the Area is a region <strong>of</strong> early settlsment and<br />
agricultural development. Industrial grovrth has been greatest in this sec<br />
tion, and increasing pastures are ending the threat <strong>of</strong> erosion, which<br />
reached its peak in the early twenties.<br />
<strong>NORTHEAST</strong> <strong>GEORGIA</strong><br />
AREA<br />
—2—
History<br />
The first settlements in the Northeast <strong>Georgia</strong> Area irere<br />
made toward the end <strong>of</strong> the Revolutionary liar. Shortly thereafter<br />
it became apparent that the Cherokee Indians were <strong>of</strong>fering the<br />
chief obstacles to advancement, and the conflicts which followed,<br />
intensified by the discovery <strong>of</strong> gold in 1829, led to their re<br />
moval in 1838 and to the opening <strong>of</strong> all the lands <strong>of</strong> North<br />
<strong>Georgia</strong> to settlement.<br />
State ....<br />
Engiatering<br />
Experiment<br />
Statioa . . .<br />
ImfaittuI . .<br />
. . Economic<br />
RtKattb . .<br />
A group <strong>of</strong> adventurers, largely Tories, had settled among the Indians<br />
on the Etowah River, inciting a number <strong>of</strong> murderous raids on the frontiers<br />
<strong>of</strong> ffilkes County. In 1782 a group <strong>of</strong> patriots, led by Elijah Clark and<br />
Andrew Pickens .broke up their settlement and forced them to sign a treaty<br />
ceding Indian lands from the Tugaloo to the© Chattahoochee. In 178It, when<br />
this treaty had been confirmed by the state, Franklin county, the oldest<br />
in the Area, was laid ou4.<br />
As new settlements were made, new counties were created. Jackson<br />
county was laid out in 1796, Madison county in 1811, Habersham and Hall<br />
counties in 1818. Settlements made by New Englanders who had lived in<br />
Virginia, and a few Tories, were consolidated into Katun county in 1819<br />
The climax to <strong>Georgia</strong>©s race for land was the final removal <strong>of</strong> the<br />
Cherokees. <strong>Georgia</strong> Cherokees occupied some Ij61i,61i6 acres in North <strong>Georgia</strong>,<br />
an enviable countjy <strong>of</strong> forest-covered mountains and well-watered valleys<br />
In 1802 <strong>Georgia</strong> ceded to the United States all <strong>of</strong> her western, lands, now<br />
Alabama and Mississippi, on condition that the Cherokees be removed from<br />
the state. When little had been done after a quarter <strong>of</strong> a century,<br />
<strong>Georgia</strong>ns decided to take matters into their own hands. Consequently,in<br />
1830 the <strong>Georgia</strong> legislature extended <strong>Georgia</strong> laws throughout all Cherokee<br />
land lying within the state.<br />
Just before this, gold had been discovered in the Cherokee nation,<br />
probably in 1829 at Dude©s Creek in White county. Itehlonega, in Lumpkin<br />
county, was settled in 1833 at a place called licklog, and soon became<br />
the center <strong>of</strong> the gold mining region, with ten to fifteen thousand miners<br />
within a radius <strong>of</strong> fifteen miles. The federal government established a<br />
mint at Dahlonega which operated from 1836 to 1861. The greater part <strong>of</strong><br />
<strong>Georgia</strong>©s total gold production <strong>of</strong> $18,000,000 was mined in the vicinity<br />
<strong>of</strong> Dahlonega between 1830 and 1850.<br />
In 1831 the Assembly authorized the Governor to survey the Cherokee<br />
territory, divide it into counties, and dispose <strong>of</strong> the© land by lottery.<br />
The next year ten new counties had appeared, including, in the Northeast<br />
<strong>Georgia</strong> Area, Forsyth, Lumpkin, and Union counties. In 1835 the Chero<br />
kees signed a treaty with United States commissioners agreeing to give<br />
up all their lands in <strong>Georgia</strong> for lands in the West and five million<br />
dollars. In 1838 General Winfield Scott was given the unenviable task<br />
<strong>of</strong> removing the Cherokees from their <strong>Georgia</strong> home. Hundreds evaded<br />
©"©Coulter, E. Mertoji, A. Short History <strong>of</strong> <strong>Georgia</strong>^ The <strong>University</strong> <strong>of</strong><br />
North Carolina Press, 19337 pp. 167-lbtl.<br />
2 Cyclopedia <strong>of</strong> <strong>Georgia</strong>, ed. Candler, Alien D. and Evans, Clement, A.,<br />
State Historical Association, Atlanta, 1906, IT, pp. 175, 183, 35k, 521,<br />
III, p. U;6.<br />
Johnson, Amanda, <strong>Georgia</strong> as Colony and State, Walter W. Brown Pub<br />
lishing Co., Atlanta, 1938, p. 2T3-<br />
—Z—
capture or escaped fron stockades, and from these originated the<br />
present eastern group <strong>of</strong> Cherokees in the reservations in North<br />
Carolina<br />
Franklin, Jackson, lladison, Habersham, Hall, Rabun, Forsyth,<br />
Lunpkin, and Union counties completed the original organization<br />
<strong>of</strong> the Area. Other counties were carved from these and sur<br />
Sun ....<br />
Engineering<br />
Experiment<br />
Station . , .<br />
<strong>Georgia</strong><br />
Ttcfc<br />
Industrial . .<br />
. . Economic<br />
Rcteatcb . .<br />
rounding counties, Rart 1 and Towns counties in© 1856, White and _______<br />
Dawson counties in 1857, Banks county in 1858, Stephens county in 1905, and<br />
Barrow county in 191ii.<br />
Proposals were made for railroads in the Northeast <strong>Georgia</strong> Area as<br />
early as I81t0, but permanent construction was not begun until after the War<br />
Between the States. The Charlotte and Atlanta Hallway, now a part <strong>of</strong> the<br />
Southern, was begun in 1869 and completed in 182. The Elberton Air-line<br />
Railroad, now a branch line <strong>of</strong> the Southern, was chartered in 1871 and<br />
completed in 1878. It is fifty miles long and connects Elberton with<br />
Toccoa. The Hartwell Railroad, built in 1879, is ten miles long, and<br />
connects Eartvrell with Bowersville.<br />
Construction was begun in 1886 on the Gainesvllle and Dahlonega<br />
Railroad, but the project was soon abandoned.<br />
The Gainesvllle, Jefferson, and Southern Railroad, now the GaijnesvLlle<br />
Kidland, covering the U2 miles from Gainesville to Monroe, was consolidated<br />
In 1881; with the Walton county Railroad which runs from Uonroe to Social<br />
Circle.<br />
The Northeast Railroad <strong>of</strong> <strong>Georgia</strong> was chartered in 1870, and roads<br />
were built from Athens to Lula, ijO miles, and from Rabun Gap to Tallulah,<br />
20.8 miles. The road from Athens to Lula is now under control <strong>of</strong> the<br />
Southern Railway. The road from Rabun Gap to Tallulah is now known as<br />
Tallulah Falls Railroad and has been extended north to Franklin, North<br />
Carolina, and south to Cornelia, where it connects with the Southern<br />
from Atlanta to Charlotte.<br />
The Seaboard Air line, from Atlanta to Birmingham, skirts the<br />
southern part <strong>of</strong> the Area.<br />
Gainesville, the county seat <strong>of</strong> Habersham county, is the largest city<br />
in the Area, having a 191iO population <strong>of</strong> 10,21:3. Incorporated in 1821,it<br />
first developed as an agricultural center although it attracted some<br />
settlers because <strong>of</strong> its nearness to the gold fields. The greatest stim<br />
ulus to development, however, came with the construction <strong>of</strong> the Charlotte<br />
and Atlanta Air-Line Railroad, now the Southern, and <strong>of</strong> the Gainesville,<br />
Jefferson, and Southern Railway, now the Gainesville Midland. The city<br />
has become the industrial center <strong>of</strong> the Area. The Pacolet Manufacturing<br />
Company, established in 1908, manufactures sateen, Osnaburg, sharkskin,<br />
coleskin, heavy sheetings and drills, and employs 1600 people. The<br />
Chicopee Manufacturing Corporation established in 192lj, manufactures<br />
*Cain, Andrew W., History <strong>of</strong> Lumpkin County for the First Hundred<br />
Years 1832-1932, Stein Printing Co., Atlanta, 1932. Cyclopedia <strong>of</strong> <strong>Georgia</strong>,<br />
in, rp. 560-561.<br />
Avery, I. W., The History <strong>of</strong> the State <strong>of</strong> <strong>Georgia</strong> from 1850 to_ 1881,<br />
Brown and Derby, New York, 1S81, pp. 632-633- Kenderson, J. T., The<br />
Ccmmonwealth <strong>of</strong> <strong>Georgia</strong>, the Country, the People, the Productions, Jas.<br />
F. Harrison & Co.. Atlanta, 1BB5, PP. 35~
gauze products for Johnson and Johnson,and employs 600 people.<br />
Otter plants manufacture chenille, and silk and rayon knitted<br />
products. Experiment<br />
Station . . .<br />
Toccoa, at the Junction <strong>of</strong> the main line <strong>of</strong> the Southern . GT£*S<br />
and the Toccoa-Elberton branch, lies in a productive fans,<br />
forest, and orchard section. Four furniture factories utilize<br />
the timber from the surrounding country, and cotton mills manu<br />
Industrial . .<br />
. . Economic<br />
Rdcirch . .<br />
facture sheetings and spool thread. The Le Tourneau Company, manufacturers<br />
<strong>of</strong> earth moving equipment, established a branch plant near Toccoa in 1938.<br />
Winder, formerly known as Jug Tavern, was incorporated in 1893. It<br />
owes its progress chiefly to its location at the junction <strong>of</strong> the Seaboard<br />
Air Line and the Gainesville Midland Railroads. Winder, with its six<br />
plants manufacturing men©s work garments and chenille products, and employ<br />
ing about a thousand people, is becoming something <strong>of</strong> a manufacturing center.<br />
Hartwell, the courtty seat <strong>of</strong> Hart county, was incorporated in 1856.<br />
Located on the Hartwell Railroad, it is essentially a trading center for the<br />
surrounding agricultural country, although the Hartwell Mills manufacture<br />
sheetings and employ about 125 people.<br />
Jefferson, the county seat <strong>of</strong> Jackson county, was settled in 1796<br />
and is located on the Gainesville Midland Railroad. The Jefferson Mills©,<br />
established in 1900,manufacture flannels, fancy dobbies, and specialties.<br />
A branch mill is located at Royston.<br />
Cornelia is the center <strong>of</strong> the apple growing region. Located on the<br />
rain line <strong>of</strong> the Southern Railway and at the terminus <strong>of</strong> the Tallulah Falls<br />
Railroad, it serves as a trading and shipping center for the surrounding<br />
country.<br />
Cahlonega, as the center <strong>of</strong> the gold mining region, in I81i0 boasted<br />
a population <strong>of</strong> over ten thousand. Its gold mines virtually abandoned,<br />
and without a railroad, its 191*0 population was 1,291;.<br />
A number <strong>of</strong> educational institutions including colleges <strong>of</strong> liberal<br />
arts, and vocational and industrial scho&Ls provide educational facilities<br />
to the Area. Erenau College at Gainesville <strong>of</strong>fers degrees in liberal<br />
arts, music,and speech. Piedmont College, in Haberoham county, main<br />
tained by the Congregational Church, is an accredited four-year college<br />
<strong>of</strong>fering degrees in liberal arts and science. North <strong>Georgia</strong> College<br />
at Dahlonega is a coeducational junior college in the <strong>University</strong> <strong>System</strong><br />
<strong>of</strong> <strong>Georgia</strong>. Young Harris Junior College in Towns county is a coedu<br />
cational institution maintained by the Methodist Church. Riverside<br />
BiH.tary Academy in Gainesville is a military preparatory school recog<br />
nized Toy the War Department as an honor school, and holds winter sessions<br />
in Hollywood, Florida. The Rabun Gap-Nacoochee School in Rabun county<br />
maintains a sixteen-hundred acre demonstration farm and <strong>of</strong>fSrs two years<br />
<strong>of</strong> agricultural training. The Toccoa Falls Institute is an accredited<br />
four-year high school and maintains a school farm and dairy. Tallulah<br />
Falls Industrial School, operated under the auspices <strong>of</strong> the <strong>Georgia</strong><br />
Federation <strong>of</strong> Women©s Clubs, <strong>of</strong>fers courses through the eleventh grade,<br />
specializing in mountain arts and crafts. The North <strong>Georgia</strong> Vocational<br />
Trade School at Clarkesville, established in 19Wi, operates under the<br />
State Department <strong>of</strong> Education. Courses are <strong>of</strong>fered in refrigeration,<br />
automotive and radio mechanics, welding, watch repair, laundry, and<br />
machine shop work.<br />
—5—
The northern part <strong>of</strong> the Area, a land <strong>of</strong> forest-covered<br />
mountains, lakes, and mountain streams, has long been a resort<br />
region, attracting thousands <strong>of</strong> vacationers yearly. Recently<br />
both private and government enterprises have increased its at<br />
tractions. The lakes created by the <strong>Georgia</strong> Power Company,<br />
Burton, Rabun, Tallulah, Tugalco, and Nacoochee, and the sur<br />
rounding country <strong>of</strong>fer opportunities for fishing and camping<br />
pleasures. The Chattahoochee National Forest, a vast region <strong>of</strong><br />
State ....<br />
Engineering<br />
Experiment<br />
Station . . .<br />
CfOtgia<br />
Tifh<br />
Industrial . .<br />
. . Economic<br />
Remcch . .<br />
natural beauty in the.northern part <strong>of</strong> the state, was established in 1936<br />
for the protection <strong>of</strong> timber, wildlife, and watersheds <strong>of</strong> important streams.<br />
The gross area includes over a mi 111 on acres, but as several towns and much<br />
privately owned property lie within its boundaries, the land actually owned<br />
by the government is 5li,772 acres. The region is covered with a network<br />
<strong>of</strong> trout streams such as Hoontcotla, Eock, Cooper, Chestatee, Wildcat,<br />
DLx, Moccasin, and Hiawassee, stocked annually with trout and bass by<br />
state and federal conservation departments. Quail and wild turkey are<br />
plentiful, and deer and bear are occasionally seen. Within the Area are<br />
a hundred miles <strong>of</strong> the Appalachian©Trail, the hiker©s highway, which<br />
begins at Mount Katahdin in Maine, and ends at Mount Oglethorpe in<br />
<strong>Georgia</strong>, leading through the wildest parts <strong>of</strong> the state. Vogel State<br />
Park lies within the boundaries <strong>of</strong> the national forest, and covers 1),000<br />
acres, part <strong>of</strong> which is state owned, and part leased from the federal<br />
government. Its lake and forest attractions make it one <strong>of</strong> the most<br />
popular resorts <strong>of</strong> the State.<br />
6
Weather<br />
The Northeast <strong>Georgia</strong> Area is characterized by a mountain<br />
ous terrain with altitudes ranging from a loir <strong>of</strong> 557 feet to<br />
peaks <strong>of</strong> as much as /»,768 feet (Brasstown Bald in Towns county).<br />
For much <strong>of</strong> the Area, the range is from nine hundred to twelve<br />
hundred feet. The weather stations are typically at lower than<br />
average altitudes for the Area, the highest being Rabun Gap and<br />
Clayton in Rabun county,with altitudes <strong>of</strong> 2,300 and 2,100 feet, respectively.<br />
Ihile for the ten stations reported in nine counties <strong>of</strong> the Northeast Georg<br />
ia Area the minimum.and maximum temperature averages vary only slightly,<br />
greater variations are found in the highest and lowest temperatures ever<br />
reported. For some <strong>of</strong> the seven counties which have no weather stations<br />
(Barrow, Dawson, Forsyth, Franklin, Jackson, Towns, and Onion counties)<br />
greater variations may be expected. The towns in Barrow, Jackson, Forsyth,<br />
and Franklin counties are at the altitudes generally comparable with the<br />
stations reporting in Hall, Habersham, Hart, Madison, and Stephens.and<br />
therefore might be expected to have somewhat similar weather. Union,<br />
Towns, Forsyth, and Dawson counties are typically at much higher altitudes,<br />
and the topography is much rougher, so that it would be almost certain<br />
that, while temperature averages might be similar, the extremes would be<br />
more widely separated. The reports for Rabun Gap and for Clayton in Rabun<br />
county, for Lee in White county, and for Dahlonega in Lumpkin county would<br />
be somewhat typical, but at points it might well be expected that tempera<br />
ture variations would be greater than for these three stations. Altitudes<br />
for towns In. these counties are:<br />
County<br />
County<br />
Forsytn<br />
Dawson<br />
Towns .<br />
Union .<br />
Town<br />
Gumming . .<br />
Dawsonville .<br />
Hiawassee. .<br />
Blairsville .<br />
Table W-3<br />
Altitude (Feet)<br />
1,963<br />
1,925<br />
Average Length <strong>of</strong> Growing Season and First and Last Killing<br />
Frosts for Northeast <strong>Georgia</strong> Area, ty Stations<br />
tenks and Hail<br />
Jabersham<br />
Hall<br />
Jart<br />
-umpkin<br />
iabun<br />
Stephens<br />
Station<br />
Gillsville<br />
Cornelia<br />
Gainesville<br />
Hartwell<br />
Dahlonega<br />
Clayton<br />
Toccoa<br />
ITS.<br />
Aver<br />
aged<br />
22<br />
11<br />
35<br />
29<br />
39<br />
36<br />
36<br />
Growing Season<br />
Average<br />
Frost Dates<br />
Last<br />
Apr .6<br />
Apr.5<br />
Apr.U<br />
Apr. 2<br />
Apr .11<br />
Apr. 20<br />
Apr.U<br />
First<br />
Oct.28<br />
Nov.6<br />
Oct.30<br />
Nov. 2<br />
6ct.26<br />
Oct.iB<br />
Nov.l<br />
Grow<br />
ing<br />
Days<br />
205<br />
215<br />
209<br />
214<br />
198<br />
181<br />
211<br />
Killing Frosts<br />
Lastf<br />
Apr.17<br />
Apr.lb<br />
Apr. 21<br />
Apr. 2/1<br />
Hay 10<br />
Hay 15<br />
Apr.20<br />
Firs€<br />
Oct.ll<br />
Oct. 20<br />
Oct.9<br />
Oct.ll<br />
Oct.10<br />
Oct.l<br />
Oct.10<br />
Source: U. S. Department <strong>of</strong> Agricul ture, Climatic Summary <strong>of</strong> the<br />
hited States . 1930, Sections 102 and 103 « The data extend from<br />
'stablishment <strong>of</strong> station to 1930.<br />
xLast reported in spring. 2First reported in fall.
A<br />
•M H row ,<br />
to w t* w J<br />
Cr O W H V/l<br />
O vn O O ' -<br />
10 C O O<br />
Table W-la<br />
i<br />
CD<br />
I<br />
County<br />
Banks and H»ll<br />
Habersham<br />
Ball<br />
Hart<br />
Lunpkln<br />
Rabun©<br />
Stephens<br />
Highest Temperature Reported by Months and Annual<br />
Tor Northeast <strong>Georgia</strong> Area by Stations©<br />
Station<br />
Oillsville<br />
Cornelia<br />
Gainesvilli<br />
Bartwell<br />
Dahlonega<br />
Olayton<br />
Tooooa<br />
Jan Tab<br />
74 76<br />
73 77<br />
76 79<br />
78 82<br />
72 76<br />
76 76<br />
76<br />
)hr Apr.<br />
87 92<br />
87 91<br />
88 93<br />
90 96<br />
88 92<br />
89 91<br />
80 90<br />
May June July Aug. Sept Dot Nov Deo Arm.<br />
96 104 102 100 100 91 81 72 104<br />
96 99 10S 100 99 86 78 76 103<br />
97 100 106 104 103 93 79 74 106<br />
102 106 108 107 109 94 83 82 109<br />
96 101 101 102 99 89 79 71 102<br />
94 99 102 98 93 89 80 72 102<br />
96 99 103 107 103 104 92 81 79 107<br />
Souroei U. S. Department <strong>of</strong> Agriculture, Climatic Summary <strong>of</strong> the United States,<br />
1930, Sections 102 and 103. The data extend from establishment or stations to 193O.<br />
Table lf-2a<br />
Lowest Temperature Reported bj Honths and Annual<br />
for Northeast <strong>Georgia</strong> Area by Stations<br />
Banks and Ball<br />
Habersham<br />
aui<br />
Bart<br />
Lumpkin<br />
Rabun<br />
Stephens<br />
GillsYille<br />
Cornelia<br />
Gainesville<br />
Hartwell<br />
Dahlonega<br />
Clayton<br />
Tooooa<br />
J<br />
7<br />
0<br />
-1<br />
3<br />
-1<br />
"9<br />
3<br />
F<br />
-6<br />
10<br />
-6<br />
6<br />
-11<br />
-8<br />
-2<br />
M<br />
6<br />
12<br />
6<br />
12<br />
0<br />
0<br />
9<br />
A<br />
28<br />
26<br />
26<br />
28<br />
23<br />
16<br />
26<br />
M J<br />
36 44<br />
38 44<br />
33 41<br />
37 46<br />
30 39<br />
29 38<br />
34 42<br />
Sourcei TJ. S. Department <strong>of</strong> Agriculture, Climfttio Summary <strong>of</strong> the United<br />
Statea, .l»3u, iseotions luz and 1U3. The data ext'and from as-ta£liakiimn-k nf ,Vn-<br />
€Lor» to 1BSO.<br />
J<br />
62<br />
64<br />
EO<br />
Bl<br />
60<br />
46<br />
55<br />
A<br />
66<br />
51<br />
61<br />
63<br />
49<br />
44<br />
61<br />
S<br />
37<br />
43<br />
Bfi<br />
4,1<br />
34<br />
34<br />
39<br />
0<br />
24<br />
33<br />
20<br />
2R<br />
23<br />
.l<br />
26<br />
N<br />
16<br />
J]<br />
12<br />
16<br />
10<br />
a<br />
14<br />
1)<br />
R<br />
B<br />
1<br />
fi<br />
-1<br />
1<br />
0<br />
-6<br />
0<br />
-fi<br />
3<br />
-1J<br />
-9<br />
-2
—<br />
"<br />
8*S "S B 8<br />
S3. '"i Maximum Average<br />
Temperature by Months and Annual «<br />
s weather data available for the Northeast <strong>Georgia</strong> Area<br />
le period from ia2 to 1930. The 1930-19U5 data have not<br />
i published. All but one <strong>of</strong> the averages are based on<br />
ld-<br />
' for Northeast Area <strong>Georgia</strong> by Stations »6 p.<br />
_i jj.Ef « tr m o c*<br />
———<br />
ranging from twenty-two to fifty-seven years and are <strong>of</strong><br />
. nt length that the omission <strong>of</strong> the last ten years is not<br />
1 to have any particular effect on the conclusions drawn.<br />
§<br />
1<br />
O<br />
&<br />
1<br />
-P<br />
8<br />
•a<br />
o<br />
w<br />
to<br />
3<br />
»H<br />
I<br />
*<br />
£<br />
1<br />
1<br />
1<br />
Station<br />
|<br />
c- CO O O ^ C- IO<br />
O> r-l O tO Ol CO rH<br />
tO t- t- C- to CD t-<br />
CO 10 CM BO BO CO tO<br />
CM CM rH •* i-l O tO<br />
CM CO C- U3 O tO CO<br />
**•••••<br />
O IO O tO O Cft rH<br />
LO tO CO CO CO IO CO<br />
BO co cn to to cn LO<br />
O (0 rH xt< O 01 CM<br />
D- C- t- C— C*- CD t-<br />
co t^- t- o CM to cn<br />
rH BO rH LO O O) CM<br />
CO CO CO CO CO C- CO<br />
CM O IO IO ^H tO CO<br />
10 co co cn to ^ r>eo<br />
co 0 co co co so<br />
cn co cc ^ to to o<br />
CO £• CM 1O CO<br />
C-- rH O> r-l CO t- O<br />
t- CO ^- CO ^- t" CO<br />
oa to BO to ^< -41 co<br />
• ••••*•<br />
rH iH O tO O Cn CM<br />
o> to t- r-: to co 10<br />
S<br />
lO iH IO r-l O tO<br />
CD tO CO CO CO CD<br />
CO C^ CO t- D- tO t-<br />
^4 BO CM CO CM CM ^<br />
CO IO i* CO CO t^ BO<br />
^ CM O BO O O CM<br />
tO tO ©ft tO ^p to 'O<br />
r-t r-l tf<br />
BTj rH -H rH Gj<br />
^H -H »> rH O fi<br />
rH t> (0 O C! O d<br />
0) , O<br />
rf "^ ** 8<br />
O O U 5 (§ O EH<br />
i-l<br />
H<br />
1! a 1<br />
Sourcei U. S. Department<br />
Agriculture, Climatic Summary <strong>of</strong> United States, Sections 102 1930, and<br />
—9—<br />
extend |iua. The data from<br />
establishment <strong>of</strong> station to 1930.<br />
Table lf-2<br />
for Northeast Stations' <strong>Georgia</strong> Area by<br />
Average Minimum Temperature by Months and Annual<br />
|<br />
o<br />
1<br />
•P<br />
s<br />
•8.<br />
O<br />
CO<br />
I<br />
^<br />
I<br />
JT<br />
i<br />
J<br />
1<br />
1<br />
Station<br />
•P<br />
s<br />
§<br />
O O CD BO rH t^ BO<br />
O O CO O CO IO C7><br />
CO Cft OJ O C- IO i^<br />
CM ^ BO ^< CM O tO<br />
to to to BO to to to<br />
W O O O 0 rH C-<br />
rH rH Oi O Ch ID Cl<br />
^ BO<br />
CO CO tO CO CO LO CO<br />
C- O rH tO • O<br />
^ 9 9 4< ^ to CM O CM<br />
to to to to to to BO<br />
CO O O C- O> CM CM<br />
CM BO CM BO rH O CM<br />
tO tO tO tO BO BO BO<br />
ID<br />
O rH<br />
rH rH 0<br />
r-l (fi -H rH &)<br />
•H ft > r-l 0 C<br />
t» rH «> O C O at<br />
10 O 0) k O -P O<br />
rH CJ (2 4> rH >» O<br />
rH *4 -H t, 45 «tf 0<br />
r-l<br />
•-!- ~<br />
Sou<br />
EapM CfUlf<br />
Exptr LBCBt<br />
Station f©<br />
Cm<br />
I.dott•ill . .<br />
mamlc<br />
S<br />
a<br />
0<br />
*H<br />
•P<br />
O<br />
g Ol<br />
«<br />
(0<br />
county, Clayton and<br />
in Ra range 5 from Gi at lsvi le srage days per number <strong>of</strong> mo<br />
§<br />
CD *1<br />
to 0><br />
(0 *<br />
CQ O<br />
Table ff-4<br />
Average Nunber <strong>of</strong> Day_s with 0.01 Inches or More<br />
Precipitation by Months and Annual for<br />
Hortheast <strong>Georgia</strong> Area by Stations'<br />
County<br />
Station J F 11 A 11 J J A S<br />
Banks and Sail Gillaville 8 8 7 7 7 7 8 8 6<br />
flail<br />
Gainesville 9 9 9 8 8 9 11 10 9<br />
Hart<br />
Hartwoll 8 8 8 7 8 8 9 8 6<br />
Lumpkin<br />
Dahlonega 12 11 11 10 11 12 14 13 9<br />
Ifedieon<br />
Carlton<br />
9 9 8 7 8 8 9 9 6<br />
1-J<br />
I Rabun<br />
o Stephens Tooooa<br />
Clayton<br />
8 8 9 7 8 9 11 9 6<br />
10 9 9 8 9 10 12 11 8<br />
II<br />
Source i U. S. Department <strong>of</strong> Agrioultur 3, Climatic Summary <strong>of</strong> United<br />
States, 1930, Sections 102 and 103. The dat x extend from estab lishment <strong>of</strong><br />
station to 1930.<br />
County<br />
Banks and Hall<br />
Hall<br />
Hart<br />
Lumpkin<br />
Ifedison<br />
Rabun<br />
Stephens<br />
Table Vf-6<br />
Average Snowfall (unmelted) in Inches by Months and<br />
Annual~for Hor"theast <strong>Georgia</strong> Area byStations<br />
Station<br />
Gillsville<br />
Gainesville<br />
Hartwell<br />
Dahlonega<br />
Carlton<br />
Clayton<br />
Tooooa<br />
J<br />
1.0<br />
1.2<br />
1.0<br />
1.6<br />
0.6<br />
1.9<br />
1.6<br />
F<br />
1.4<br />
1.3<br />
0.9<br />
1.8<br />
0.6<br />
2.4<br />
2.0<br />
1C<br />
0.1<br />
0.2<br />
0.2<br />
0.6<br />
0.1<br />
1.1<br />
0.3<br />
Source: U. S. Department <strong>of</strong> Agriculture,<br />
States. 1930. Sections 1O2 i»nd 103. The data<br />
T<br />
TTT0<br />
T<br />
T<br />
0<br />
e<br />
8<br />
E<br />
9<br />
6<br />
6<br />
6<br />
0 0 000000 000000 0 0000 0 0 0 000000 0 000000 T 0.2<br />
T 0.2<br />
TTTTT 0.2<br />
0.2<br />
0.1<br />
0.3<br />
0.1<br />
S 0 N<br />
N<br />
© D<br />
A<br />
6 7 83<br />
6 8 104<br />
6 8 89<br />
8 11 131<br />
6 9 94<br />
6 8 94<br />
7 9 108<br />
D<br />
0.7<br />
0.9<br />
0.8<br />
0.8<br />
0.3<br />
1.7<br />
0.6<br />
A<br />
3.4<br />
3.8<br />
3.1<br />
E.O<br />
1.8<br />
7.4<br />
4.6<br />
Climatic Summary <strong>of</strong> the United<br />
extend from establishment <strong>of</strong>
county. The maximum annual snowfall was 2.k inches at<br />
Clayton in Rabun county in February. The average annual snow- -<br />
fall in the Northeast <strong>Georgia</strong> Area ranged from 1.8 inches at<br />
Garlton In Hadison county to 7.U Inches at Clayton in Rabun<br />
County.<br />
«!<br />
SU<br />
s«<br />
ai<br />
1<br />
WNC-lQIOC-l<br />
iA2o>t-wioot<br />
C- r-l C-- O CO C- O><br />
c-D-ioiototoioeot-en<br />
The heaviest<br />
precipitation aver<br />
ages shown in Table<br />
State ....<br />
Eiperimcac<br />
Station . . .<br />
Ctorgia<br />
T«A<br />
htdutrial . .<br />
. . Economk<br />
ff-5 usually occur in December or<br />
January, although in some coun<br />
ties this is as late as March.<br />
The next heaviest precipitation<br />
is almost always in July.<br />
Growing Season: The grow<br />
ing season ranges from 181 to<br />
215 days. The averse date <strong>of</strong><br />
the last killing frost in the<br />
spring ranged from April 2 at<br />
Hartwell in Hart county to<br />
April 20 at Clayton in Rabun<br />
county. The average date <strong>of</strong> the.<br />
first killing frost in the fall<br />
ranged from October 18 at Clayton<br />
in Rabun county to November<br />
6 at Cornelia in Habersham<br />
county. The latest killing<br />
frost recorded in the Northeast<br />
<strong>Georgia</strong> Area was May 15 at<br />
Clayton in Rabun county; the<br />
earliest was October 1 at Clayton.<br />
fc-i<br />
COrH^t-lOfr-tOtOCOCM<br />
11
547<br />
40<br />
607<br />
Per<br />
Uni£<br />
1940<br />
4.38<br />
3.78<br />
4.03<br />
4.66<br />
4.63<br />
3.79<br />
4.70<br />
3.97<br />
3.39<br />
3.57<br />
4.45<br />
4.66<br />
6.05<br />
4.51<br />
4.38<br />
3.97<br />
4.43<br />
Persons<br />
Par<br />
RuailjP<br />
1930<br />
4.74<br />
4.21<br />
4.27<br />
4.9%<br />
6.03<br />
4.29<br />
6.15<br />
4.48<br />
3.94<br />
3.66<br />
4.85<br />
4.64<br />
3.49<br />
4.74<br />
4.62<br />
3.63<br />
4.71<br />
Hunber at Pnolling Units and Oooupied Units bjr Kaoe<br />
Vnd Qwnerahlp for Urban, Hon-lUrm anT Bural-farm<br />
Oooupants Ty Counties for TCTo<br />
Table H-l<br />
Oooupied Dwelling Units<br />
Suannry and All<br />
Counties by Dwell<br />
Total and Types ing<br />
<strong>of</strong> Population1 Units Total TThite Hegro<br />
to<br />
i Area Total 47,642 46,185 40,380 4,806<br />
I Urban<br />
6,808 6,090 4,868 1,222<br />
Rural Hon-farm 11,734 11,038 10,014 1,018<br />
Rural farm 39,700 28,063 26,498 2,666<br />
Banks<br />
Rural Hon-farm<br />
Rural farm<br />
Barrow<br />
Winder<br />
Rural Hon-farm<br />
Rural farm<br />
Dana on<br />
Rural Hon-farm<br />
Rural farm<br />
Forsyth<br />
Rural Hon-farm<br />
Rural farm<br />
2,162<br />
386<br />
1,777<br />
3,355<br />
1,198<br />
390<br />
1,767<br />
982<br />
92<br />
890<br />
2,709<br />
302<br />
2,407<br />
1,926<br />
366<br />
1,570<br />
3,290<br />
1,171<br />
390<br />
1,729<br />
961<br />
91<br />
870<br />
2,586<br />
301<br />
2,286<br />
1,802<br />
343<br />
1,459<br />
2,739<br />
966<br />
872<br />
1,402<br />
961<br />
91<br />
870<br />
2,579<br />
301<br />
2,278<br />
124<br />
13<br />
111<br />
651<br />
206<br />
18<br />
327<br />
7<br />
7<br />
Per<br />
Cent<br />
Hegro<br />
10.6<br />
20.1<br />
9.2<br />
9.1<br />
6.4<br />
3.7<br />
7.1<br />
16.7<br />
17.6<br />
4.6<br />
18.9<br />
0.3<br />
0.3<br />
Units Oooupied<br />
By Owner<br />
Number<br />
17,097<br />
2,097<br />
3,919<br />
11,081<br />
626<br />
101<br />
626<br />
1,030<br />
342<br />
161<br />
537<br />
414<br />
51<br />
363<br />
966<br />
70<br />
696<br />
Per<br />
C«»t<br />
37.8<br />
34.4<br />
36.5<br />
39.5<br />
32.6<br />
28.4<br />
33.4<br />
31.3<br />
29.2<br />
38.7<br />
31.1<br />
43.1<br />
41.7<br />
37.4<br />
23.3<br />
39.2<br />
By<br />
Tenant<br />
28,086<br />
3,993<br />
7,113<br />
16,982<br />
1,300<br />
265<br />
1,045<br />
2,260<br />
629<br />
239<br />
1,192<br />
1,620<br />
231<br />
1,389
Kfew construction needs to provide for urban and non-farm<br />
growth in the immediate postwar period amount to aoout one<br />
thousand units, while the replacement <strong>of</strong> one in four <strong>of</strong> the<br />
11,488 oosolete1 farm units would amount to 2,872 with 745 more<br />
ir. the rural Ron-farm areas. Half the obsolete units in urban<br />
places would add about 325 more, making a total <strong>of</strong> 3,942 units.<br />
Kcst new construction should be from four to seven rooms.<br />
Sun ....<br />
Enftacrinf<br />
Expirintat<br />
Station . . .<br />
Ttck<br />
hdutiul . .<br />
. . Ecoaoaic<br />
Rtmrcb . .<br />
The proportion <strong>of</strong> the dwellings in the Kortheast <strong>Georgia</strong> Area over<br />
forty years old in 1940 is higher than usual. Almost one quarter, or<br />
11,323 dwellings, were built before 1900. Ifcny <strong>of</strong> these should obviously<br />
be replaced or modernized. Slightly less than a quarter (10,759) <strong>of</strong> all<br />
dwelling units were built between 1900 and 1909, <strong>of</strong> which 6,790 were farm<br />
IO IO O<br />
IOO H<br />
« «< 10<br />
CO CM ^<br />
^ CO t-<br />
• • •<br />
* IO ^1<br />
OJ CM C-<br />
CO rH C-<br />
N (O tO<br />
M rH<br />
10 tO O<br />
+ t- (O<br />
w w to<br />
IO CO C-<br />
O> tD CM<br />
r* W CO<br />
H<br />
iSee Table H-S, Heeding Major Repairs.<br />
rH C- 10<br />
CO ^ rH<br />
*l •* 10<br />
c- to CM<br />
BO rH tO<br />
• • •<br />
*&•#•#<br />
to o to<br />
CM tO tO<br />
O> O CO<br />
rH rH<br />
rH tO O)<br />
to co tv<br />
^ W ^<br />
C- •* IO<br />
IO «} O)<br />
^< to e-<br />
*<br />
rH<br />
S<br />
to to cn<br />
rH <br />
•41 ^1 ^ ^<br />
Cn rH CM rH<br />
OI CO OT CO<br />
• • • •<br />
"* 10 ^ **<br />
O IO CO C-<br />
O tD CM O<br />
CM D- t- C-<br />
IO i-H rH rH<br />
OS ^ tO IO<br />
10 ^ CM O<br />
to to to •*<br />
Ol ^ ^» rH<br />
S CM tO IO<br />
O> CO rH<br />
CM rH<br />
**t to CM<br />
CO O O<br />
* * 10<br />
10 to •*<br />
* to to<br />
• • •<br />
4< to *JI<br />
CO CM is<br />
• • • •<br />
^ w w •*<br />
CO •* rH tO<br />
to co ca to<br />
M 10 t- 0><br />
BO rH<br />
CD D- os to<br />
OS ^ CO CO<br />
CM CO CM 02<br />
eg q to o><br />
CO H O» fr-<br />
IO tO CM t-<br />
rH<br />
t- *# IO<br />
to o> c-<br />
^» 10 •«*<br />
S£g<br />
• • •<br />
«« BO •*<br />
Q CM CO<br />
O IO CO<br />
rH O O><br />
O CM EC<br />
IO 4* tO<br />
IO O EO<br />
o cn IH<br />
t- i-H IO<br />
S o t-<br />
CO CO<br />
•4< n ^*<br />
to to CM<br />
to t- to<br />
• • •<br />
-tf K> •«*<<br />
S|8<br />
«" r<br />
O CO CM<br />
sss<br />
^ to co<br />
CM eo co<br />
OS O3 CM<br />
to to<br />
tO rH IO<br />
StO t-<br />
CM tO<br />
8SS3<br />
^» •* •* 10<br />
tO rH CO tO<br />
(O rH t><br />
T*<br />
*H 10<br />
CM 01 10<br />
• • •<br />
IO t- CM<br />
IO C- CO<br />
53-°<br />
O O O CM<br />
O CM CM IO<br />
rH CM<br />
§<br />
os to ^<<br />
rH rH rH rH<br />
t- CO IO tO<br />
CM IO O» O><br />
O- i-H rH tO<br />
O CM O<br />
• • •<br />
4* CO CM<br />
ID t- OS<br />
IO IO rH<br />
fr- to to<br />
• mm<br />
3855<br />
S3S2<br />
IO rH IO<br />
to to c-<br />
• • •<br />
CM tO rH<br />
O CM CO<br />
^< CM rH<br />
« t rHCO<br />
SS^"<br />
to to co o><br />
CM CO CM O<br />
•* CM rH<br />
00 H t-<br />
to<br />
N ri rH<br />
CO O> OS<br />
tO OS (o<br />
CO CM IO<br />
BO t- to<br />
tO rH rH<br />
S<br />
CM 41 CO<br />
en<br />
t-<br />
to<br />
c-<br />
W rH rH<br />
cn cn CM co<br />
O co to 10<br />
rH to IO CO<br />
CO CM CM CM<br />
§<br />
e- •* to<br />
tO O rH<br />
to e- co o<br />
CO CM CM tO<br />
e- e- o<br />
Sco S<br />
to co<br />
CO CM<br />
|H rH p<br />
sgi<br />
tO CM<br />
O ^« «fl CM<br />
** ft rH 10<br />
CO CO O t-<br />
^* r-l CM<br />
CO IO CM (C<br />
t- o to to<br />
CO OS O Cn<br />
•* rH CM<br />
tO CM rH<br />
SU3 IO<br />
4* cn<br />
i-H<br />
o> to to<br />
t> t- O<br />
4< 0<br />
rH rH<br />
CM rH rH<br />
§S5<br />
tO CM<br />
CO 0> ^<br />
O> tO CM<br />
«a *<br />
OS tO IO CM<br />
CM rH rH<br />
O O CM CO<br />
S9 O CO<br />
•0 •# CM<br />
tO fH rH<br />
Franklin<br />
Rural N -farm on<br />
farm Pural<br />
(<br />
Habereheua<br />
Rural Non-fKrm<br />
farm Rural<br />
Ball<br />
Rural Non-farm<br />
Gainesvi ls<br />
Rural farm<br />
Hart<br />
Rural Non-farm<br />
farm Rural<br />
13<br />
Conmeroe<br />
Jackson<br />
Rural Non- fcnn<br />
form Rural<br />
lABnplcin<br />
Rural Son- farm<br />
Rural farm<br />
dieon<br />
Hon-fkrm Rural<br />
Rural farm<br />
r<br />
•ll.<br />
rH rH<br />
gfil!<br />
l««<br />
S<br />
Btephena 1 To 30 oa<br />
1 Rural lon- fcrm<br />
| Rural farm
o >-• B d- d-<br />
3- M « B<br />
. If S ' '<br />
CD i-t<br />
p- M<br />
CO rt- ri- o*<br />
H- 9} 10 V-*<br />
eh ffl M CT o<br />
» S ct<br />
P ct P. co o<br />
o h" n ct<br />
& n P<br />
ro ^tn M H»<br />
^lO tO H«<br />
13 >1 H H- H-<br />
>->•(+(» O J3<br />
N «< CJ.<br />
Summary and<br />
Counties by<br />
Total and Types<br />
<strong>of</strong> Population1<br />
Towns<br />
Rural Non-farm<br />
Rural farm<br />
Union<br />
1,787<br />
Rural Non-farm 222<br />
Rural farm 1,565<br />
white<br />
Rural Non-farm<br />
Rural farm<br />
Table H-l - Continued<br />
O O ft p rt- • o<br />
'rt >-* 1 ti* if* M 1<br />
Number <strong>of</strong> Dwelling Units and Occupied Units by Race % "!J 5 £ ' 00 & »<br />
O O H- ' M •<br />
ja<br />
CD ^ o<br />
c<br />
t-j<br />
HI<br />
o<br />
»i<br />
ft >N<br />
tn<br />
** £ Jtw 0 § M<br />
5. I- 1 C CO O H- (H CO<br />
CO *i 1 *1 rt b Ol<br />
n f> PS o W *•<br />
n> £ HI o ct<br />
(D CO H' < S* O<br />
o H» tr ct 5* *i<br />
O H« JO (D • tl D<br />
«
It is further shown in Table E-l that 37.8 per cent <strong>of</strong> all<br />
the occupied dwellings in, the Northeast <strong>Georgia</strong> Area were owneroccupied<br />
in 1940. The percentage <strong>of</strong> ownership was somewhat<br />
higher in the rural farm classification than it was in the urban<br />
and rural non-farm classifications; for the last two, it was<br />
34.4 per cent and 35.5 per cent, respectively, whereas for the<br />
first classification it was 39.5 per cent. The highest percent<br />
age <strong>of</strong> home ownership in the Northeast <strong>Georgia</strong> Area was found in<br />
Towns county: 64.C per cent for all families and for rural farm families<br />
66.9 per cent <strong>of</strong> the homes were occupied by the owners. The next highest<br />
percentage <strong>of</strong> home ownership in the Area was in Union county with 61.2 per<br />
cent <strong>of</strong> all the homes in the county occupied by the owners and 63.9 per<br />
cent <strong>of</strong> all rural farm homes occupied by the owners.<br />
Crowding: The number <strong>of</strong> persons per room is the criterion <strong>of</strong> over<br />
crowding.BEen this rate reaches 1.5 persons per room, the overcrowding<br />
is usually regarded as serious. It is difficult, however, to detemtce<br />
exactly what size <strong>of</strong> house is lacking since the crowding frequently re<br />
sults from large families in small houses, balanced by small families in<br />
large nouses. Apparently economic status and tho habits which are as<br />
sociated with various standards <strong>of</strong> living are much more the controlling<br />
factors than the actual existence <strong>of</strong> the right number <strong>of</strong> houses <strong>of</strong> the<br />
right size. Table H-2 shows that 8,901 dwelling units in the Northeast<br />
<strong>Georgia</strong> Area were occupied in 1940 at a rate <strong>of</strong> over 1.5 persons per<br />
room. Of these, 5,615, or about 63 per cent were rural farm dwellings,<br />
approximately the proportion that rural dwellings are <strong>of</strong> all dwellings.<br />
The number <strong>of</strong> dwellings with an occupancy rate <strong>of</strong> from 1 to l.E persons<br />
per room was 8,393 (<strong>of</strong> which, 6,149 or about 73 per cent were farm<br />
duellings).<br />
ffliile the specific overcrowding already described existed in 1940, it<br />
is difficult to be exact in locating the sizes <strong>of</strong> dwellings which were<br />
deficient. On the other hand, 8,435 dwellings were occupied only to the<br />
ertent <strong>of</strong> 0.5 or less persons per room, 8,188 more at rates between 0.51<br />
and 0.75 persons per room, and 10,717 more at rates between 0.7S end l.OC<br />
persons per room.<br />
All families in the Northeast <strong>Georgia</strong> Area could be accommodated in<br />
the existing housing at a rate <strong>of</strong> less than l.E persons per room if it<br />
jrere possible to match families and houses by size.<br />
In Table E-4 is shown the extent to which matching the 1940 families<br />
and dwellings fails to secure a rate <strong>of</strong> occupancy <strong>of</strong> one person or less<br />
per room, tnder this assumption there are not enough dwelling units in<br />
the 11-room, 10-room, 9-room, 8-room, or 7-roon croups to accommodate<br />
the families <strong>of</strong> corresponding size. The accumulated deficit down to the<br />
7-room— 7-person family groups was 2,787. Beginning with the 6-roon<br />
ait, there were more dwellings than families <strong>of</strong> corresponding size.<br />
Age <strong>of</strong> Structure: Table H-3 presents data showing that in the<br />
lortheast <strong>Georgia</strong> Area, the greatest number <strong>of</strong> houses, 0,052 or 42.09<br />
per cent <strong>of</strong> tho total number <strong>of</strong> houses in the Area, were built in the<br />
period between 1900 and 1920. More than'half <strong>of</strong> these dwelling units<br />
(12,985) were classed as rural farm. It appears fron examination <strong>of</strong><br />
the table that the greatest numbers <strong>of</strong> rural farm dwellings built during<br />
this period were built in Jackson, Ball, and Hart counties. Three out<br />
<strong>of</strong> every four <strong>of</strong> the 10,311 dwellings built before 1900 were farm<br />
Sellings. The 5,757 houses built between 1935 and 1939 represented<br />
12.08 per cent <strong>of</strong> the total number <strong>of</strong> houses in the Area in 1940. This<br />
--15--
per cent is higher than the 10.31 per cent for this group In<br />
<strong>Georgia</strong>. Of these 6,757 duellings, 2,576 (44.74 per cent) were<br />
rural farm; 1,948 or 33.64 par cent were rural non-farm and<br />
1,£32 or 21.42 tier cent were urtan dwellings. AD examination <strong>of</strong><br />
Tacie H-2<br />
Unit <strong>of</strong><br />
Comparison<br />
Rooms Per<br />
Dwelling<br />
1 Rood<br />
2 Roons<br />
3 Rooms<br />
a Rooms<br />
5 Rooms<br />
6 Rooms<br />
7 Rooms<br />
8 Rooms<br />
9 Roois<br />
10 Roois<br />
11 Rooms<br />
No Report<br />
Persons Per<br />
Household<br />
1 Person<br />
2 Persons<br />
3 Persons<br />
1* Persons<br />
5 Persons<br />
6 Persons<br />
7 Persons<br />
8 Persons<br />
9 Persons<br />
10 Persons<br />
ll Persons<br />
Persons<br />
Per Room<br />
Under 0.51<br />
0.51-0.75<br />
0.76-1.00<br />
1.01-1.50<br />
1.51-2.00<br />
Over 2.00<br />
No Report<br />
Number <strong>of</strong> Dwelling Units by Size <strong>of</strong> Unit, Persons<br />
Per gnTt and Persons Per Room for Northeast<br />
<strong>Georgia</strong> Area by Counties in 191)0<br />
Area<br />
Total<br />
902<br />
i*,ao9<br />
10,605<br />
12,U27<br />
8,559<br />
5,557<br />
2,251<br />
1,160<br />
521<br />
353<br />
337<br />
561<br />
1,6W><br />
8,1)00<br />
9,2U3<br />
8,086<br />
5,981*<br />
l*,i*17<br />
3,027<br />
1,919<br />
1,211)<br />
636<br />
613<br />
8,1*35<br />
8,188<br />
10,717<br />
8,393<br />
5,563<br />
3,338<br />
551<br />
•a<br />
1CO<br />
g<br />
is<br />
m.<br />
c o<br />
iQ<br />
<br />
gh.<br />
c<br />
•H<br />
r-t<br />
Ita<br />
§<br />
n<br />
t,<br />
CJ<br />
•S<br />
Number <strong>of</strong> Dwellings in County<br />
21*<br />
131)<br />
526<br />
632<br />
371<br />
226<br />
i2a<br />
53<br />
27<br />
11<br />
8<br />
21)<br />
Ill<br />
U28<br />
71*7<br />
798<br />
571*<br />
368<br />
171<br />
61*<br />
35<br />
20<br />
20<br />
19<br />
17<br />
79<br />
297<br />
21*7<br />
156<br />
91*<br />
35<br />
11)<br />
5 1* 2<br />
32<br />
19<br />
121<br />
753<br />
8UO<br />
1)86<br />
295<br />
92<br />
30<br />
25<br />
U<br />
2<br />
35<br />
59<br />
301*<br />
701)<br />
871<br />
717<br />
1)86<br />
21*1<br />
131<br />
53<br />
25<br />
30<br />
X<br />
71*<br />
353<br />
782<br />
778<br />
660<br />
1*37<br />
179<br />
108<br />
53<br />
39<br />
61<br />
1)8<br />
21<br />
c oin<br />
,-t<br />
X<br />
H**" so<br />
s 3*-3<br />
126<br />
796<br />
1,801*<br />
2,398<br />
1,507<br />
858<br />
31)8<br />
196<br />
102<br />
75<br />
76<br />
100<br />
Number <strong>of</strong> Dwellings in County<br />
55<br />
327<br />
382<br />
330<br />
21*6<br />
231<br />
162<br />
79<br />
65<br />
26<br />
11*2<br />
735<br />
781<br />
595<br />
387<br />
257<br />
18U<br />
103<br />
1*7<br />
23<br />
31*<br />
25<br />
33<br />
169<br />
185<br />
183<br />
121)<br />
96<br />
66<br />
38<br />
32<br />
11)<br />
21<br />
61)<br />
1*1*9<br />
580<br />
1*71*<br />
365<br />
251<br />
155<br />
116<br />
61*<br />
1*0<br />
28<br />
127<br />
601)<br />
716<br />
610<br />
1*52<br />
350<br />
232<br />
150<br />
121*<br />
58<br />
61<br />
151<br />
667<br />
666<br />
565<br />
1*32<br />
31)2<br />
226<br />
150<br />
85<br />
52<br />
1*1)<br />
266<br />
1,527<br />
1,712<br />
1,538<br />
1,115<br />
780<br />
512<br />
289<br />
202<br />
82<br />
86<br />
Number <strong>of</strong> Dwellings in County<br />
358<br />
339<br />
1*70<br />
358<br />
232<br />
Ili6<br />
23<br />
629<br />
671)<br />
828<br />
608<br />
375<br />
158<br />
11*2<br />
170<br />
191<br />
185<br />
136<br />
18<br />
105i<br />
32<br />
1)59<br />
1*82<br />
610<br />
5n<br />
327<br />
162<br />
35<br />
699<br />
637<br />
778<br />
671<br />
39a<br />
21*6<br />
59<br />
721J<br />
573<br />
801*<br />
602<br />
395<br />
26U<br />
1,1*1*6<br />
1,51*0<br />
2,032<br />
1,51*1)<br />
929<br />
2JL<br />
518<br />
100<br />
28<br />
295<br />
790<br />
1,075<br />
603<br />
1*71<br />
173<br />
90<br />
25<br />
16<br />
9<br />
66<br />
129<br />
61)5<br />
690<br />
623<br />
1)52<br />
319<br />
250<br />
ia&<br />
119<br />
66<br />
80<br />
1*1*1<br />
1,053<br />
1,292<br />
919<br />
563<br />
21)0<br />
. 123<br />
1*9<br />
1*2<br />
35<br />
190<br />
81i8<br />
961<br />
851)<br />
601)<br />
1*61)<br />
300<br />
188<br />
105<br />
1)8<br />
667<br />
612<br />
836<br />
61*1)<br />
1*27<br />
235<br />
36<br />
179<br />
1*1*0<br />
31*9<br />
207<br />
130<br />
1*1<br />
Jji<br />
15<br />
9<br />
16<br />
36 16<br />
58<br />
68<br />
900<br />
809<br />
1,126<br />
882<br />
588<br />
66<br />
300<br />
35<br />
State ....<br />
Enfinecriaf<br />
Experiment<br />
Station . . .<br />
Gtoryi*<br />
Tich<br />
ladutrial..<br />
. . Economic<br />
ReaeaKb . .<br />
c<br />
>H<br />
•*<br />
!<br />
§ 01<br />
f<br />
a | B<br />
55<br />
263<br />
261)<br />
229<br />
177<br />
11)7<br />
103<br />
77<br />
1*9<br />
17<br />
22<br />
Source: U. S. Census, Housing, 191)0, Second Series, Table 23.<br />
—16—<br />
1*8<br />
188<br />
693<br />
91*8<br />
653<br />
1)02<br />
156<br />
65<br />
i*a<br />
25<br />
12<br />
115<br />
232<br />
1*10<br />
379<br />
1*09<br />
313<br />
121*<br />
62<br />
16<br />
314<br />
1*1<br />
59 39<br />
107<br />
60a<br />
642<br />
539<br />
391)<br />
272<br />
199<br />
11)6<br />
81<br />
1*1)<br />
81)<br />
269<br />
312<br />
286<br />
251<br />
165<br />
121<br />
111<br />
33<br />
30<br />
30<br />
229 599 362<br />
230 633 282<br />
301 712 391<br />
21*2 530 251<br />
219 366 202<br />
166 183 188<br />
16 59 36
Table H-3 discloses that the largest number <strong>of</strong> rural farm duel<br />
lings built in any one county In the 1935-39 period was 304 in<br />
Ttaion county. Hall county with 292, and Bart county with 207<br />
were next in total farm dwelling construction for this most re<br />
cent period. During this same period over half the urban units<br />
erected in the Area were built in Gainesville, while in Hall<br />
county more than a quarter <strong>of</strong> the total rural non-farm units wer«<br />
erected. These 694 urban units and 535 non-farm units totalling<br />
State ....<br />
Enfinenui<br />
Experiment<br />
Station . . .<br />
Ge«r»M<br />
r«*<br />
Indutrii] . .<br />
. . Economic<br />
1,229 were more than a fifth <strong>of</strong> all types <strong>of</strong> residential construction in<br />
the Area during the 193S-39 period. Table H-4<br />
Dnit <strong>of</strong><br />
Comparison<br />
Rooms Per<br />
Duelling<br />
1 Room<br />
2 Booms<br />
3 Rooms<br />
U Rooms<br />
5 Rooms<br />
6 Rooms<br />
7 Rooms<br />
B Rooms<br />
9 Rooms<br />
10 Rooms<br />
11 Rooms<br />
No ReDOrt<br />
S<br />
4s-<br />
£<br />
n<br />
|<br />
Suit ....<br />
Engineering<br />
Hxpcrimmt<br />
Station . . .<br />
Grorgiu<br />
Tnl><br />
Induilriil . .<br />
. . Economic<br />
Rtsmch . .<br />
Year Built<br />
Area Total<br />
v-> I Urban<br />
Rural Non-farm<br />
TO<br />
Rural farm<br />
I<br />
Banks<br />
Rural Non-fam<br />
Rural farm<br />
Barroif<br />
Winder<br />
Rural Non-farm<br />
Rural farm<br />
Dawson<br />
Rural Non-farm<br />
Rural farm<br />
Forcyth<br />
Rural Non-farm<br />
Rure.l farm<br />
Franklin<br />
Rural Non-fam<br />
Rural farm<br />
Hatershan<br />
Rural Son-fanr.<br />
Hur*1 farm<br />
1936-<br />
1940<br />
5,767<br />
1,233<br />
1,948<br />
2,676<br />
116<br />
36<br />
80<br />
S72<br />
206<br />
47<br />
119<br />
114<br />
26<br />
89<br />
252<br />
66<br />
186<br />
229<br />
76<br />
163<br />
434<br />
aei<br />
183<br />
1930-<br />
1934<br />
3,183<br />
366<br />
1,062<br />
1,766<br />
87<br />
26<br />
62<br />
168<br />
64<br />
34<br />
60<br />
83<br />
17<br />
66<br />
130<br />
21<br />
• 109<br />
169<br />
62<br />
107<br />
339<br />
168<br />
171<br />
1926-<br />
1929<br />
3,076<br />
421<br />
1,067<br />
1,598<br />
96<br />
14<br />
82<br />
108<br />
60<br />
14<br />
44<br />
33<br />
3<br />
30<br />
164<br />
22<br />
142<br />
176<br />
61<br />
116<br />
343<br />
216<br />
128<br />
1920-<br />
1924<br />
4,061<br />
522<br />
1,031<br />
2,498<br />
167<br />
18<br />
149<br />
216<br />
107<br />
19<br />
90<br />
67<br />
67<br />
226<br />
33<br />
193<br />
366<br />
119<br />
236<br />
392<br />
163<br />
238<br />
1910-<br />
1919<br />
9,293<br />
1,096<br />
2,002<br />
6,196<br />
348<br />
46<br />
302<br />
817<br />
291<br />
90<br />
436<br />
166<br />
10<br />
146<br />
463<br />
28<br />
436<br />
791<br />
199<br />
692<br />
748<br />
361<br />
387<br />
Table H-3<br />
NUJnber o: ' Dwell Ing Units by Tear Built and .————————————————————.<br />
tate ( >f Re pa Ir in TSSTTor Nort.tiaast<br />
State <strong>of</strong> Repair and Plumbing<br />
Cleorgia<br />
Area \>y Countiea<br />
Not needing Needing<br />
Number <strong>of</strong> Dwellings in County<br />
Major Repairs Major<br />
1900-<br />
1909<br />
10,769<br />
1,368<br />
2,601<br />
6,790<br />
636<br />
106<br />
430<br />
866<br />
267<br />
108<br />
600<br />
161<br />
4<br />
147<br />
662<br />
26<br />
637<br />
892<br />
272<br />
620<br />
629<br />
334<br />
296<br />
1890-<br />
1899<br />
6,284<br />
788<br />
920<br />
3,676<br />
377<br />
73<br />
304<br />
496<br />
192<br />
60<br />
264<br />
110<br />
6<br />
104<br />
377<br />
32<br />
346<br />
492<br />
102<br />
390<br />
297<br />
161<br />
136<br />
1880-<br />
1889<br />
2,376<br />
267<br />
479<br />
1,639<br />
193<br />
36<br />
158<br />
126<br />
14<br />
19<br />
92<br />
84<br />
9<br />
76<br />
126<br />
11<br />
116<br />
286<br />
40<br />
846<br />
201<br />
127<br />
74<br />
1860-<br />
1879<br />
1,683<br />
93<br />
189<br />
1,301<br />
123<br />
20<br />
103<br />
107<br />
3<br />
3<br />
101<br />
89<br />
7<br />
82<br />
121<br />
16<br />
106<br />
102<br />
. 9<br />
93<br />
65<br />
14<br />
41<br />
1869<br />
or<br />
earlier<br />
1,069<br />
19<br />
134<br />
916<br />
75<br />
3<br />
72<br />
68<br />
10<br />
2<br />
56<br />
68<br />
6<br />
62<br />
88<br />
20<br />
68<br />
87<br />
7<br />
80<br />
66<br />
10<br />
46<br />
Not<br />
reportinB<br />
1,212<br />
65<br />
311<br />
846<br />
44<br />
9<br />
35<br />
23<br />
4<br />
4<br />
16<br />
38<br />
6<br />
33<br />
£00<br />
29<br />
171<br />
103<br />
44<br />
69<br />
38<br />
10<br />
28<br />
Number<br />
30,309<br />
6,300<br />
8,192<br />
16,817<br />
718<br />
163<br />
• 566<br />
2,860<br />
1,083<br />
344<br />
1,423<br />
601<br />
65<br />
446<br />
1,692<br />
130<br />
1,462<br />
2,057<br />
639<br />
1,418<br />
2,762<br />
1,472<br />
1,890<br />
No<br />
running<br />
imter<br />
21,634<br />
1,412<br />
4,308<br />
16,914<br />
676<br />
136<br />
640<br />
1,989<br />
367<br />
241<br />
1,381<br />
487<br />
48<br />
439<br />
1,641<br />
99<br />
1,442<br />
1,643<br />
307<br />
1,336<br />
1,938<br />
777<br />
1,181<br />
Repairs<br />
Number<br />
16,046<br />
661<br />
2,983<br />
11,411<br />
1,292<br />
211<br />
1,081<br />
394<br />
84<br />
43<br />
267<br />
416<br />
29<br />
387<br />
1,084<br />
158<br />
866<br />
1,467<br />
279<br />
1,188<br />
631<br />
263<br />
368<br />
Run<br />
ning<br />
mater<br />
414<br />
162<br />
185<br />
77<br />
10<br />
2<br />
8<br />
10<br />
9<br />
1<br />
2<br />
1<br />
1<br />
2<br />
1<br />
1 1<br />
66<br />
42<br />
' 13<br />
29<br />
24E
Ball<br />
GAlnoGville<br />
Rural Hon-farm<br />
Bural Harm<br />
Hart<br />
Rural Non-farm<br />
Rural farm<br />
Jaotson<br />
Comneroe<br />
Rural Non-farm<br />
Rural farm<br />
Lumpkin<br />
Rural Hon-farm<br />
Rural farm<br />
Ifadison<br />
Rural JJon-farm<br />
Rural farm<br />
Rabun<br />
Rural Hon-farm<br />
Rural farm<br />
Stephens<br />
Tooooa<br />
Rural Hon-farm<br />
Rural farm<br />
Towns<br />
Rural Don-farm<br />
Rural farm<br />
tFnion<br />
Rural Kon-fa:ir.<br />
Rural farm<br />
Unite<br />
Rural Bon-farm<br />
Rural farm<br />
1,62.1<br />
694<br />
636<br />
292<br />
263<br />
66<br />
207<br />
293<br />
93<br />
83<br />
117<br />
274<br />
123<br />
151<br />
18E<br />
50<br />
136<br />
466<br />
266<br />
190<br />
541<br />
240<br />
163<br />
138<br />
173<br />
47<br />
126<br />
376<br />
71<br />
304<br />
159<br />
63<br />
106<br />
664<br />
139<br />
812<br />
203<br />
163<br />
23<br />
140<br />
216<br />
58<br />
66<br />
93<br />
165<br />
53<br />
102<br />
94<br />
15<br />
79<br />
363<br />
822<br />
131<br />
201<br />
96<br />
32<br />
74<br />
132<br />
34<br />
98<br />
812<br />
30<br />
182<br />
137<br />
49<br />
88<br />
059<br />
161<br />
368<br />
130<br />
144<br />
7<br />
137<br />
192<br />
63<br />
41<br />
88<br />
122<br />
27<br />
95<br />
112<br />
30<br />
82<br />
226<br />
128<br />
97<br />
282<br />
147<br />
46<br />
89<br />
142<br />
23<br />
119<br />
178<br />
24<br />
154<br />
100<br />
34<br />
66<br />
669<br />
221<br />
191<br />
247<br />
316<br />
66<br />
260<br />
293<br />
60<br />
70<br />
173<br />
101<br />
17<br />
84<br />
194<br />
44<br />
160<br />
316<br />
181<br />
135<br />
288<br />
144<br />
34<br />
110<br />
162<br />
35<br />
117<br />
139<br />
8<br />
131<br />
170<br />
63<br />
117<br />
1,S1K<br />
439<br />
279<br />
694<br />
798<br />
140<br />
658<br />
1,010<br />
126<br />
243<br />
642<br />
199<br />
30<br />
169<br />
867<br />
232<br />
635<br />
387<br />
110<br />
277<br />
603<br />
241<br />
55<br />
307<br />
210<br />
36<br />
175<br />
231<br />
17<br />
204<br />
364<br />
137<br />
227<br />
3,103<br />
552<br />
772<br />
779<br />
982<br />
215<br />
767<br />
1,387<br />
284<br />
289<br />
814<br />
336<br />
98<br />
238<br />
960<br />
194<br />
766<br />
269<br />
79<br />
190<br />
580<br />
276<br />
37<br />
268<br />
104<br />
16<br />
88<br />
177<br />
15<br />
162<br />
226<br />
37<br />
189<br />
745<br />
304<br />
109<br />
352<br />
461<br />
102<br />
359<br />
680<br />
162<br />
96<br />
433<br />
131<br />
51<br />
80<br />
379<br />
61<br />
318<br />
60<br />
8<br />
52<br />
349<br />
140<br />
' 21<br />
188<br />
83<br />
17<br />
66<br />
118<br />
6<br />
112<br />
129<br />
26<br />
103<br />
S86<br />
168<br />
47<br />
160<br />
161<br />
37<br />
124<br />
361<br />
56<br />
71<br />
234<br />
72<br />
39<br />
33<br />
136<br />
16<br />
120<br />
32<br />
9<br />
23<br />
89<br />
29<br />
8<br />
52<br />
46<br />
7<br />
39<br />
67<br />
67<br />
41<br />
4<br />
37<br />
Z24<br />
60<br />
18<br />
146<br />
142<br />
32<br />
110<br />
218<br />
9<br />
29<br />
180<br />
47<br />
18<br />
29<br />
137<br />
4<br />
133<br />
17<br />
6<br />
12<br />
65<br />
21<br />
4<br />
30<br />
21<br />
3<br />
18<br />
63<br />
3<br />
60<br />
62<br />
5<br />
67<br />
74 4<br />
11<br />
69<br />
84<br />
9<br />
75<br />
168<br />
4<br />
30<br />
134<br />
29<br />
12<br />
17<br />
117<br />
7<br />
110<br />
28<br />
2<br />
26<br />
23<br />
1<br />
22<br />
8<br />
5<br />
3<br />
61<br />
4<br />
57<br />
45<br />
6<br />
39<br />
17O<br />
36<br />
62<br />
73<br />
127<br />
24<br />
103<br />
66<br />
9<br />
16<br />
30<br />
13<br />
6<br />
8<br />
112<br />
16<br />
96<br />
61<br />
32<br />
19<br />
19<br />
7<br />
2<br />
10<br />
6<br />
6<br />
186<br />
44<br />
142<br />
87<br />
9<br />
18<br />
5,736<br />
2,283<br />
1,918<br />
1,637<br />
1,849<br />
433<br />
1,416<br />
3,203<br />
850<br />
659<br />
1,694<br />
1,034<br />
308<br />
726<br />
1,549<br />
421<br />
1,128<br />
1,761<br />
846<br />
915<br />
2,135<br />
1,084<br />
260<br />
789<br />
668<br />
148<br />
410<br />
1,324<br />
149<br />
975<br />
880<br />
257<br />
623<br />
£,632<br />
686<br />
646<br />
1,460<br />
1,476<br />
104<br />
1,371<br />
2,187<br />
96<br />
462<br />
1,630<br />
889<br />
179<br />
710<br />
1,432<br />
360<br />
1,082<br />
1,037<br />
343<br />
694<br />
1,350<br />
414<br />
184<br />
762<br />
600<br />
117<br />
383<br />
1,061<br />
116<br />
946<br />
797<br />
200<br />
• 697<br />
2,340<br />
367<br />
623<br />
1,360<br />
1,640<br />
236<br />
1,302<br />
1,294<br />
5<br />
255<br />
1,034<br />
411<br />
158<br />
263<br />
1,612<br />
204<br />
1,308<br />
323<br />
120<br />
203<br />
826<br />
205<br />
138<br />
483<br />
456<br />
63<br />
393<br />
609<br />
65<br />
544<br />
610<br />
136<br />
374<br />
123<br />
94<br />
26 4<br />
41<br />
31<br />
10<br />
32<br />
3<br />
23<br />
6<br />
10<br />
10<br />
9<br />
3<br />
6<br />
. 12<br />
4<br />
B<br />
47<br />
46<br />
1<br />
5<br />
3<br />
2<br />
4<br />
4<br />
23<br />
14<br />
9<br />
Souroei U( S. Census, Housing, 1940. Second Series, Table 22.
unning water, naldLng a total <strong>of</strong> 36,238 drolling units in the<br />
Hortheast <strong>Georgia</strong> Area which were without running water in 1940.<br />
Type <strong>of</strong> Construction: Both the cost and the usefulness <strong>of</strong><br />
rural hous©oHg are influenced by the amount <strong>of</strong> technical planning<br />
which has been applied to the problem. Flans and specifications<br />
for a number <strong>of</strong> farm dwellings have been prepared by the archi<br />
tectural service <strong>of</strong> Southern Brick and Tile Manufacturers As<br />
sociation, Candler Building, Atlanta. They are available without charge.<br />
The Portland Cement Association, Eurt Building, Atlanta, also has availrtli,<br />
Eftterial on farm construction and frequently various© agricultural magazicni<br />
publish farm dwelling plans. In adapting such material to a particular<br />
farm site, it is desirable to consult with the Rural Electrification co-op,<br />
to consider the location <strong>of</strong> wells and other structures, and access from<br />
the highway "to determine what modifications, if any, should be made.<br />
20--
Population.<br />
The 1943 population <strong>of</strong> the Northeast <strong>Georgia</strong> Are* is esti-<br />
»te
I(0<br />
i<br />
to<br />
to<br />
1<br />
Table P-li Table P-3<br />
Rural Non-Farm Population by Race and Sex<br />
Northeast <strong>Georgia</strong> Area by Counties ror<br />
Summary<br />
and<br />
Counties<br />
Area Total<br />
Banks<br />
Barrow<br />
Dawson<br />
Forsyth<br />
Franklin<br />
Habershajn<br />
Hall<br />
Hart<br />
Jackson<br />
Lumpkin<br />
Madison<br />
Rabun<br />
Stephens<br />
Towns<br />
Union<br />
White<br />
Total1<br />
1)1), 1)12<br />
1,350<br />
1,393<br />
551<br />
1,191)<br />
3,71*3<br />
7,117<br />
10,821)<br />
2,512<br />
1),OU2<br />
1,791<br />
2,1*05<br />
2,657<br />
1,562<br />
81*7<br />
821*<br />
1,600<br />
Male<br />
White<br />
19,371*<br />
622<br />
605<br />
277<br />
598<br />
1,1)83<br />
3,11)0<br />
5,110<br />
875<br />
1,529<br />
817<br />
850<br />
1,223<br />
737<br />
1)10<br />
1)27<br />
671<br />
191)0<br />
Female<br />
20,71*1<br />
61*9<br />
702<br />
210<br />
596<br />
1,689<br />
3,1*63<br />
5,1)19<br />
91*8<br />
1,661,<br />
81*9<br />
917<br />
1,31)3<br />
722<br />
1)37<br />
391*<br />
739<br />
Male<br />
2,01*2<br />
1)1<br />
36<br />
61*<br />
260<br />
226<br />
11*3<br />
303<br />
1)28<br />
67<br />
282<br />
1*1*<br />
1)8<br />
__<br />
2<br />
98<br />
for the<br />
LyZTo<br />
Negro<br />
Source: U. S. Census, Population, 191)0,<br />
Second Series, Table 26.<br />
1Totals include other races.<br />
Female<br />
2,250<br />
33<br />
So<br />
.._<br />
_<br />
311<br />
288<br />
152<br />
386<br />
1*21<br />
58<br />
356<br />
55<br />
—<br />
1<br />
92<br />
Total Non-Farm Populatl on by_ Race and Sex for thto g M o ' H 8 '*•<br />
Northeast <strong>Georgia</strong> Aroa bjr Counties for lyliO ^ g- M p b 8- $ »<br />
Summary<br />
and<br />
Counties<br />
Area Total<br />
Banks<br />
Barrow<br />
Dawson<br />
Forsyth<br />
Franklin<br />
Habersham<br />
Hall<br />
Hart<br />
Jackson<br />
Lumpkin<br />
Madison<br />
Rabun<br />
Stephens<br />
Towns<br />
Union<br />
White<br />
Total1<br />
67,1*17<br />
1,350<br />
5,367<br />
551<br />
1,191*<br />
3,71*3<br />
7,117<br />
21,067<br />
2,512<br />
7,336<br />
1,791<br />
2,1,05<br />
2,657<br />
7,056<br />
81*7<br />
821*<br />
1,600<br />
28,003<br />
622<br />
2,113<br />
277<br />
598<br />
1,1*83<br />
3,11)0<br />
8,833<br />
875<br />
*817<br />
850<br />
1,223<br />
2,850<br />
1)10<br />
1)27<br />
671<br />
3,522<br />
61,9<br />
*210<br />
596<br />
1,689<br />
3,1*63<br />
9,681<br />
9U8<br />
3,11*9<br />
81*9<br />
917<br />
1,31*3<br />
2,981*<br />
1,37<br />
391*<br />
739<br />
t*,063<br />
1*1<br />
31)1)<br />
61*<br />
260<br />
226<br />
1,129<br />
303<br />
659<br />
67<br />
282<br />
1)1)<br />
51)1)<br />
—<br />
2<br />
98<br />
l),82l) ' 33<br />
1)36<br />
_..<br />
. —<br />
311<br />
288<br />
l,l|2ll<br />
386<br />
711*<br />
58<br />
Source i Calculated from Tables P-l and<br />
P-2.<br />
1 Totals include other races.<br />
1)7<br />
678<br />
, —<br />
1<br />
92<br />
* U-<br />
•«! » H p."d p.<br />
p.
j»tural growth were considered in making the estimate <strong>of</strong><br />
206,000 population for 1946 (page 21). As mentioned, distrilution<br />
<strong>of</strong> this 1946 total over the counties is very likely to<br />
jhoir a tendency for greater increases in Hall, Stephens, Habershamj<br />
Hart, and Jackson counties, because <strong>of</strong> the presence <strong>of</strong><br />
lore industry and <strong>of</strong> urban centers. Population growth in coun<br />
ties such as Rabun, Tlhite, Towns, Onion, and Lumpkin is likely<br />
to be somewhat slower in starting and will probably result in<br />
increased use <strong>of</strong> these counties for hones by people who have retired.<br />
Suit ....<br />
Enfiflccrinf<br />
Expcrinnt<br />
Station . . .<br />
Gtotlia<br />
TV*<br />
Indutiut . .<br />
. . Economic<br />
Rucarcb .<br />
Rural farm population predominates in most counties, particularly the<br />
smaller Subsistence farm counties,in the northern part <strong>of</strong> the Area. In<br />
all counties except Hall and Stephens, more than half the population is on<br />
fanns. In seven counties (Banks, Dawson, Forsyth, Ifcdison, Towns, Union,<br />
and Unite), more than three-fourths <strong>of</strong> the population lived on farms.<br />
Summary<br />
and<br />
Counties<br />
Area Total<br />
Banks<br />
Barrow<br />
Dawson<br />
Forsyth<br />
Franklin<br />
Habersham<br />
Hall<br />
Hart<br />
Jackson<br />
Lumpkin<br />
Madison<br />
Rabun<br />
Stephens<br />
Towns<br />
Dnion<br />
White<br />
Table P-l<br />
Total Population by Race and Sex by Counties<br />
for 19UO, with 1930" Total<br />
Total1<br />
197,873<br />
8,733<br />
I3,06U<br />
U.U79<br />
11,322<br />
15,612<br />
lii,771<br />
3lt,822<br />
15,512<br />
20,089<br />
6,223<br />
13,131<br />
7,821<br />
12,972<br />
lt.925<br />
7,680<br />
6,lH7<br />
Male<br />
191*0<br />
Unite<br />
87,79Jj<br />
1*,033<br />
5,195<br />
2,266<br />
5,662,<br />
6,657<br />
6,91.9<br />
15,1*83<br />
5,886<br />
8,215<br />
3,017<br />
5,505<br />
3,878<br />
5,523<br />
2.51A<br />
3,919<br />
3,060<br />
Female<br />
87,882<br />
U,039<br />
5,iao<br />
2,lli9<br />
5,617<br />
6,685<br />
7,155<br />
16,000<br />
5,665<br />
8,333<br />
2,986<br />
5,321<br />
3,808<br />
. 5,593<br />
2,381<br />
3,750<br />
2,990<br />
Kale<br />
Negro<br />
10,77lj<br />
32k<br />
1,176<br />
61t<br />
22<br />
1,105<br />
305<br />
1,529<br />
1,955<br />
1,766<br />
120<br />
1,28U<br />
68<br />
852<br />
—<br />
h<br />
200<br />
Female<br />
Il,la7<br />
332<br />
1,283 —<br />
15<br />
1,165<br />
362<br />
1,810<br />
2,006<br />
1,775<br />
100<br />
1,320<br />
67<br />
i.ooU<br />
—<br />
7<br />
167<br />
1930<br />
Total 1<br />
186,637<br />
9,703<br />
12,Jt01<br />
3,502<br />
10.62U<br />
15,902<br />
12,7lt8<br />
30,313<br />
i5,m<br />
21,609<br />
U,927<br />
llt,921<br />
6,331<br />
n,7UO<br />
!»,3l*6<br />
6,3liO<br />
6,056<br />
Source: U. S. Census, Population, 19hO, Second Series,<br />
Table 22.<br />
1 Totals include other races.<br />
--23--
Table P-2<br />
Rural Farm Population<br />
Northeast <strong>Georgia</strong> Area<br />
Sunmiary<br />
and<br />
Counties<br />
Irea Total<br />
Banks<br />
Barrow<br />
Dawson<br />
Forsyth<br />
Franklin<br />
Habersham<br />
Hall<br />
Hart<br />
Jackson<br />
T.7jffrr>]H n<br />
Madison<br />
Rabun<br />
Stephsns<br />
Toims<br />
Union<br />
White<br />
Totaf<br />
130.U56<br />
7,383<br />
7,697<br />
3,928<br />
10,128<br />
11,669<br />
7,6SU<br />
13,755<br />
13,000<br />
12,753<br />
li,U32<br />
11,026<br />
5,16U<br />
5,916<br />
U,078<br />
6,856<br />
k,Sl7<br />
Hale<br />
Unite<br />
59,791<br />
3,101<br />
3,082<br />
1,989<br />
5,066<br />
5,17U<br />
3,809<br />
6,650<br />
5,011<br />
5,101<br />
2,200<br />
U,655<br />
2,655<br />
2,673<br />
2,13lt<br />
3,1)92<br />
,389<br />
19hO<br />
Female<br />
57,360<br />
3,390<br />
2,936<br />
1,939<br />
5,021<br />
U,996<br />
3,692<br />
6,319<br />
4,717<br />
5,l8i<br />
2,137<br />
U,l*0lt<br />
2.U65<br />
2,609<br />
l,9Wi<br />
3,356<br />
2,251<br />
Hale<br />
6,711<br />
283<br />
832<br />
22<br />
8U5<br />
79<br />
llOO<br />
1,652<br />
1,107<br />
53<br />
1,002<br />
2k<br />
308<br />
—<br />
2<br />
102<br />
Negro<br />
Source: U. S. Census, Population, 19UO,<br />
Second Series, Table 27.<br />
1 Totals include other races.<br />
Female<br />
6,593<br />
299<br />
81(7<br />
19<br />
85U<br />
7U<br />
386<br />
1,620<br />
1.C61<br />
liZ<br />
96k<br />
20<br />
326<br />
—<br />
6<br />
75<br />
State<br />
Eafinceriiif<br />
Experiment<br />
Station . . .<br />
Crorgia<br />
Ttck<br />
ladottrut..<br />
. Econonk<br />
RtKircb .
Labor Force<br />
Any discussion <strong>of</strong> the Labor Force In the Northeast <strong>Georgia</strong><br />
Area must be approached in a different way from other areas in<br />
<strong>Georgia</strong>. This ©is because Northeast <strong>Georgia</strong> has some basic<br />
characteristics which are completely different from most section:<br />
<strong>of</strong> the state.<br />
State ....<br />
Engineering<br />
Experiment<br />
Station . . .<br />
Ttch<br />
Industrial . .<br />
. . Economic<br />
Research . .<br />
Six Northern Counties: To begin with, six counties must be largely<br />
disregarded .n considering most manufacturing problems. In Dawson, Lumpkin,<br />
Unite, Union, Towns, and Rabun counties, the small total populations, the<br />
preponderance <strong>of</strong> Subsistence farms, the lack <strong>of</strong> railroads, and the mountai<br />
nous terrain all tend to lijait conventional approaches to industry.<br />
Ten Southern Counties: In the remaining ten counties, in 1939, most<br />
<strong>of</strong> the raani acturing was concentrated in four counties, Hall, Barrow, Ste—<br />
phens and Jackson, and in consequence these counties contain over half the<br />
total Labor Force and three-quarters <strong>of</strong> the manufacturing labor. The en<br />
tire ten, however, appear to have labor characteristics which may be re<br />
garded as industrially suitable. Forsyth county, which has strong agricul<br />
tural ties with Oaines-<br />
Table L-l<br />
ville, is, from the<br />
industrial viewpoint,<br />
Labor Force Summary for the Northeast <strong>Georgia</strong> Area<br />
somewhat allied with<br />
Atlanta, since many<br />
80,000-1<br />
industrial workers<br />
froi Forsyth county are<br />
enp}.oyed in the Atlanta<br />
Area. Table L-l shows<br />
a total 191(0 Labor<br />
Force <strong>of</strong> 69,090. Of<br />
60,000-<br />
this total, 72.6 per<br />
cent was found in the<br />
ten southern counties.<br />
Table L-2 shows an<br />
agricultural Labor<br />
Force in 191*0 <strong>of</strong> 33,218,<br />
1(0,000-<br />
<strong>of</strong> which 79.39 per<br />
cent was in the ten<br />
southern counties.<br />
Table A-3 shows an in<br />
dustrial Labor Force<br />
<strong>of</strong> Ik,k5i, <strong>of</strong> which<br />
20,000-<br />
S9.7l(' per cent was in<br />
the southern counties.<br />
The estimates in Table<br />
1-7 show a decrease <strong>of</strong><br />
736 in the Labor Force<br />
available for 191(6 in<br />
the six northern coun<br />
191(0<br />
ties, and an increase<br />
Census Estimate<br />
<strong>of</strong> 3,110 in the ten<br />
southern counties, Total I^bor Force<br />
69,090<br />
=ost <strong>of</strong> which is in the Total increase<br />
four which had the<br />
greatest concentration<br />
<strong>of</strong> industry in the<br />
nrewar years.<br />
Six Northern Counties<br />
191(6 Decrease over 191(0<br />
Ten Southern Counties<br />
191(6 Increase over 19liO<br />
—25—<br />
11,927<br />
57,163<br />
71,161,<br />
2,37li<br />
11,191<br />
736<br />
60,273<br />
3,110
191*6 Estimates; The 191*6 Labor Force estimates show that<br />
in the six northern counties there is an increase <strong>of</strong> size only<br />
in the farm Labor Force. In other classifications, there is<br />
either little change or a decrease, and none <strong>of</strong> these changes<br />
are particularly significant. Tbe net decrease <strong>of</strong> 736 in the<br />
total Labor Force for these counties may reflect the necessary<br />
elimination from the Labor Force <strong>of</strong> a part <strong>of</strong> the 877 who in<br />
191*0 were included in the Labor Force total but were not em- ___<br />
ployed, since employment within their counties is less likely and the<br />
workers are less likely to want to move. The high Subsistence farm rate<br />
also contributes to the difficulty <strong>of</strong> caking estimates for these counties,<br />
because many subsistence farmers will tend to claim former occupations<br />
but will never actually accept employment.<br />
It should be noted that the 191*0 Labor Force totals Include both<br />
those employed and those seeking employment. The postwar estimate 1 , like<br />
wise, includes both groups, so that, as compared with 191*0, there will<br />
probably exist in the postwar period, over the Area as a. whole, a poten<br />
tial demand (Including those not employed but seeking employment in 191*0)<br />
for a total <strong>of</strong> 10,271* more jobs than actually existed in 191*0. In 191*0,<br />
the total Labor Force was 69,090 <strong>of</strong> which 61,190 were actually employed<br />
during the census week. Thus the 191*6 estimate is a net increase <strong>of</strong><br />
2,271* over 191*0. For the ten southern counties the net increase will be<br />
3,110, while the six northern counties will have a decrease <strong>of</strong> 736. Dur<br />
ing the war period, most <strong>of</strong> the individuals represented in the 10,271*<br />
(except those in the armed services) were employed either in the Area or<br />
in war plants elsewhere.<br />
Industrial Labor<br />
ForcesIn Table L-3<br />
is shown an estimate<br />
<strong>of</strong> the Labor Force<br />
available to industry<br />
in 191*6. This esti<br />
mate shows an Area<br />
increase over 191*0 <strong>of</strong><br />
lil*.07 per cent. For<br />
the six northern<br />
counties, the increase<br />
was only 26.25 per<br />
cent from 1,1*82 to<br />
1,871. The ten south<br />
ern counties, con<br />
taining almost nine<br />
out <strong>of</strong> ten Industrial<br />
workers, are esti<br />
mated to have an in<br />
crease in industrial<br />
workers <strong>of</strong> 1*6.11 per<br />
cent, or from 12,969<br />
to 18,91*9.<br />
^•The estimate<br />
is intended to re-<br />
Comparison <strong>of</strong><br />
1*0,000<br />
30,000-<br />
20,000-<br />
10,000-<br />
Total<br />
Six Northern Counties<br />
Famers, Managers<br />
Farm Laborers<br />
Family Workers<br />
Total<br />
fleet the substantial Ten Southern Counties<br />
completion <strong>of</strong> the re- Farmers, Managers<br />
turn <strong>of</strong> men from the Farm Laborers<br />
amed services by the suczier <strong>of</strong> 191*6. Family Workers<br />
Total<br />
26--<br />
Table L-2<br />
Agricultural Labor Force<br />
191*0<br />
Census<br />
33,218<br />
1*,568<br />
1*27<br />
1,853<br />
6,81,8<br />
17,063<br />
3,661.<br />
5,6!i6<br />
26,373<br />
7,269:<br />
191*6<br />
Estimate<br />
33,216<br />
1*33<br />
1,789<br />
7,269<br />
16,892<br />
3,691<br />
5,3ft<br />
2S.9W
Agricultural Labor Force; The agricultural labor force for<br />
the Area, in the 191l6 estimates shown in Table L-2, is essential<br />
ly unchanged from 19l(0, since all <strong>of</strong> the estimated changes are<br />
small. The increase in the six northern counties largely re<br />
flects the technical inclusion <strong>of</strong> ail subsistence farmers as<br />
farmers, while the decrease in the total for the ten southern<br />
counties largely results from a downward revision <strong>of</strong>,the esti<br />
mate for unpaid family workers.<br />
Stiu....<br />
Engineering<br />
Experiment<br />
Station . . .<br />
<strong>Georgia</strong><br />
Tech<br />
Industrial . .<br />
. . Economic<br />
Reseatcb . .<br />
Defense Migration: During the war years, there was a considerable<br />
migration from the northern counties, particularly Union, Towns, and Rabun,<br />
to Oak Ridge, Tennessee, and other war plant areas. Ifost <strong>of</strong> these workers,<br />
however, appear to have resumed the subsistence farming in which they or<br />
their families were previously engaged. To a lesser degree, but in larger<br />
numbers, there was also a net migration during the emergency from all but<br />
one <strong>of</strong> the ten southern counties, as well as some Internal migration.<br />
The exception was Stephens, for which Table P-5 (page 21 ) indicates a<br />
population gain. There will be many more individuals suitable for and<br />
seeking industrial employment and slightly less interested in agriculture.<br />
These two changes nay be expected to result in more manufacturing, a<br />
further mechanization <strong>of</strong> agriculture, and a resulting rise in the income<br />
and standard <strong>of</strong> living levels over all <strong>of</strong> the Area.<br />
Other Possible Increases; In the Area as a whole, Farmers and Fam<br />
Managers is the largest classification in the Labor Force. This is true,<br />
also, for all counties except Hall, where more workers are classed as<br />
Operatives. The probability exists in some counties, particularly the<br />
northern six and one or two others with high Subsistence farm per cents,<br />
that additional industrial labor could be found among the farm families<br />
for a few special types <strong>of</strong> manufacturing (such as hooked rugs or other<br />
craft industries).<br />
Table L-3<br />
Women provide an<br />
other possible source<br />
Comparison <strong>of</strong> Industrial Labor Force<br />
<strong>of</strong> workers in some <strong>of</strong><br />
the ten southern coun<br />
30,000-,<br />
ties. Of the ll(,20U<br />
shown in the 19l;0<br />
Labor Force for the<br />
20,000-<br />
Area, 10.62U or 7U.79<br />
If*** ****""fI<br />
per cent are in six <strong>of</strong><br />
the ten southern coun<br />
10,000-<br />
ties. The lli,20li<br />
total was only 20.55<br />
per cent <strong>of</strong> total<br />
0<br />
Labor Force, and it<br />
19U6<br />
included 2,592 in<br />
Census<br />
Estimate<br />
Domestic Service, 233<br />
Fam Laborers and Total<br />
20,820<br />
1,86 Farm Laborers, Six Northern Counties<br />
Unpaid, a sub-total Craftsmen<br />
501<br />
<strong>of</strong> 3,69lt, or 5.3U per Operatives<br />
1.55<br />
566<br />
cent <strong>of</strong> the entire Laborers<br />
610<br />
BOh<br />
Labor Force total,<br />
Total<br />
1,871<br />
leaving only 15.21 Ten Southern Counties<br />
Per cent <strong>of</strong> the Labor Craftsmen<br />
2,725<br />
Force represented by Operatives<br />
8,210<br />
11,87U<br />
»omen in trade, in- Laborers<br />
2,031:<br />
2,927<br />
Total<br />
12,969<br />
18.9U9<br />
27
Table L-10 dustry, and .<br />
the pr<strong>of</strong> es- 1 SUK ....<br />
Kunber <strong>of</strong> Persons Baployed ir. 191.0 in the sions. In- i|n«ia«nin8<br />
Kortheast <strong>Georgia</strong> Area by Type <strong>of</strong> Industry creased de- I sarion"""'<br />
Type .<strong>of</strong> Industry<br />
Agriculture<br />
Forestry<br />
Vining<br />
Construction<br />
Total nanufacturing<br />
Food and kindred<br />
Textile Eill<br />
Apparel1<br />
Logging<br />
Sawmills, planing mills<br />
Furniture2<br />
Paper and allied<br />
Printing and publishing<br />
Chendcals and allied<br />
Leather<br />
Stone, clay, and glass<br />
Iron, steel<br />
Nor-ferrous aetals<br />
liachir.ery<br />
AutoEobiles, eauipment<br />
Transportation*<br />
Others, not specified<br />
Transportation<br />
Railroads<br />
Trucking service<br />
Other transportation<br />
C<strong>of</strong>fimuni cation<br />
Utilities<br />
Wholesale trade<br />
Total retail<br />
Food and dairy<br />
Eating and drinking<br />
liotor vehicles<br />
Other retail trade<br />
Finance4<br />
Service businesses6<br />
Donsstic service<br />
Anusecent<br />
Pr<strong>of</strong>essional services<br />
Govemaent<br />
Industry not reported<br />
Total<br />
33,296<br />
101<br />
161<br />
1,739<br />
10,539<br />
296<br />
5,200<br />
2,066<br />
78<br />
1,200<br />
658<br />
2<br />
115<br />
-isu<br />
li»0<br />
1*2<br />
252<br />
5<br />
223<br />
U<br />
5<br />
99<br />
852<br />
hSl<br />
226<br />
175<br />
132<br />
281<br />
553<br />
3,971<br />
1,037<br />
376<br />
816<br />
1,71(2<br />
317<br />
1,696<br />
2,91i3<br />
136<br />
3,036<br />
986<br />
1.51<br />
Hale<br />
30,701<br />
95<br />
157<br />
1,727<br />
6,780<br />
28U<br />
3,122<br />
500<br />
78<br />
1,191<br />
631;<br />
2<br />
95<br />
1U7<br />
132<br />
1)2<br />
2hZ<br />
5<br />
211<br />
It<br />
5<br />
86<br />
"536<br />
10,0<br />
22li<br />
172<br />
6U<br />
268<br />
523<br />
3,170<br />
919<br />
227<br />
778<br />
1,21(6<br />
2UU<br />
1,12k<br />
271<br />
-111<br />
1,322<br />
818<br />
323<br />
Female<br />
2,595 6<br />
h<br />
12<br />
3,759<br />
12<br />
2,078<br />
1,566<br />
—<br />
9<br />
21.<br />
—<br />
20<br />
78<br />
—<br />
10<br />
—<br />
12<br />
—<br />
—<br />
13<br />
16<br />
11<br />
2<br />
3<br />
68<br />
13<br />
30<br />
801<br />
118<br />
Ih9 38<br />
1.96<br />
73<br />
572<br />
2,672<br />
25<br />
1,71k<br />
168<br />
128<br />
Source: II. S. Census, Population, 19ljO,<br />
Second Series, Taole 23.<br />
1 Includes other fabricated textiles.<br />
zlncludes store fixtures, miscellaneous<br />
wooden goods.<br />
3Except auto.<br />
* Includes insurance and real estate.<br />
"Includes automobile and repair services,<br />
hotels, launderir.g, cleaning, miscellaneous per<br />
sonal services.<br />
—2S--<br />
very probably Ind J^i . .<br />
oroduce more • • Economit<br />
women workers Ra""h • •<br />
than the I8,6o3 total<br />
shown in Table L-7 as<br />
the 191(6 estimate.<br />
Few Negro Workers:<br />
In 19UO the Labor Force<br />
included 8,755 Negroes.<br />
Seven <strong>of</strong> the southern<br />
counties contained<br />
7,718 <strong>of</strong> these Kegroes,<br />
only 16.82 per cent <strong>of</strong><br />
the k$,86h Labor Force<br />
for the seven counties.<br />
The seven counties are<br />
listed below; in two<br />
counties, !ovrns_ and<br />
Dasfson, no Negro work<br />
ers were reported, while<br />
in Forsyth and Union<br />
the totals were 12 and<br />
k respectively. Thus<br />
it is obvious that Negro<br />
labor is available only<br />
in part <strong>of</strong> the southern<br />
counties and that in<br />
these counties the pro<br />
portion is less than<br />
for most <strong>of</strong> <strong>Georgia</strong>.<br />
The Seven Counties<br />
With the Largest<br />
No. <strong>of</strong> Kegroes<br />
in Labor Force<br />
~<br />
~~<br />
for<br />
~~~ ~~<br />
19S3<br />
~~ ~~ "<br />
Hall 1,621<br />
Hart I,li01<br />
Jackson 1,280<br />
Barrow 1,032<br />
Stephens 807<br />
Kadison 802<br />
Franklin 785<br />
Womer. in the Labor<br />
Force: The majority <strong>of</strong><br />
the women employed in<br />
industry in the Area,<br />
numbering 3 ,67li, are<br />
Operatives in textile.<br />
plants. The next
to<br />
to I<br />
Type <strong>of</strong> Worker<br />
Persons ll) years old and over<br />
In Labor Force<br />
Employed<br />
Wage and Salary Workers<br />
Employers1<br />
Pr<strong>of</strong>essional<br />
Semi-Pr<strong>of</strong> essional<br />
Farmers, Farm Managers<br />
Proprietors, Officials2<br />
Clerical, Sales'<br />
Craftsmen, Foremen<br />
Operatives<br />
Domestic Service<br />
Service Workers*<br />
Farm Laborers, Foremen<br />
Farm Workers, Unpaid6<br />
Laborers2<br />
Occupation Not Reported<br />
Table L-U<br />
Total Labor Force in Northeast <strong>Georgia</strong> Area in 191tO by_ Type <strong>of</strong><br />
"*~* • in TotaT end by Northern and Southern Counties<br />
Northeast <strong>Georgia</strong> Area<br />
Total<br />
136,31,0<br />
69,090<br />
61,190<br />
27,571,<br />
25,701<br />
2,721<br />
159<br />
21,631<br />
2,807<br />
3,053<br />
3,11)2<br />
8,665<br />
2,809<br />
1,683<br />
It, 091<br />
7,1)99<br />
2,61,1)<br />
286<br />
Male<br />
67,21)9<br />
51), 886<br />
1)8,531)<br />
18,361,<br />
2U,3U3<br />
1,203<br />
139<br />
21,139<br />
2,521<br />
1,967<br />
3,067<br />
1),991<br />
217<br />
1,070<br />
3,858<br />
5,630<br />
2,559<br />
173<br />
Female<br />
69", 091<br />
lit, 201,<br />
12,656<br />
9,210<br />
1,353<br />
1,518<br />
20<br />
1)92<br />
286<br />
1,086<br />
75<br />
3,67k<br />
2,592<br />
613<br />
233<br />
1,869<br />
85<br />
113<br />
Six Northern Counties Ten Southern Counties<br />
Total Male Female Total Male Female<br />
21), 9W) 12,677 12,267 111,396 Sit, 572 56,821,<br />
11,927 10,585 1,31,2 57,163 lilt, 301 12,862<br />
10,050 8,91)5 1,105 51,11)0 39,589 11,551<br />
2,911 2,262 61)9 21,, 663 16,102 8,561<br />
5,201 5,033 168 20,500 19,310 1,190<br />
515 257 258 2,206 91,6 1,260<br />
17 16 1 11)2 123 19<br />
1),568 It, 1)81 87 17,063 16,658 1,05<br />
1)52 387 65 2,355 2,131) 221<br />
251 170 81 2,802 1,797 1,005<br />
1)17 1)15 2 2,25 2,652 73<br />
1)55 U32 23 8,210 U,559 3,651<br />
225 8 217 2,581t 209 2,375<br />
212 116 966 1,1)71 951) 517<br />
1)27 1)21<br />
3,661, 3,1)37 227<br />
1,853 1,602 251 5,61,6 1,,028 1,618<br />
610 609 1 a,03U 1,950 8U<br />
1)8 31 17 238 11)2 96<br />
Source; U. S. Census, Population, 19UO, Second Series, Table 23, 23a.<br />
Includes own-account workers . 4Except domestic.<br />
"Except farm. BFamily workers. r<br />
*And kindred workers.<br />
2.' ET -SPSPifl<br />
9 o. /iSi. » « 1
o<br />
I<br />
Type <strong>of</strong> Worker<br />
Persons lit years old and over<br />
In Labor Force<br />
Employed<br />
Wage and Salary Workers<br />
Employees<br />
Pr<strong>of</strong>essional<br />
Semi-Pr<strong>of</strong> essional<br />
Farmers, Farm Managers<br />
Proprietors, Officials8<br />
Clerical, Sales*<br />
Craftsmen, Foremen3<br />
Operatives<br />
Domestic Service<br />
Service Workers4<br />
Farm Laborers, Foremen<br />
Farm Workers, Unpaid<br />
Laborers8<br />
Occupation Hot Reported<br />
Table L-5<br />
White Labor Force in Northeast <strong>Georgia</strong> Area in 191.0 tg Type <strong>of</strong><br />
Worker in Total and by~HoVthern~and SouTEern Countiea<br />
Northeast <strong>Georgia</strong> Area<br />
Total<br />
121,511<br />
60,335<br />
52,973<br />
22,681<br />
23,307<br />
2,558<br />
156<br />
19,731.<br />
2,768<br />
3,023<br />
3,031.<br />
8,277<br />
688<br />
1,111<br />
2,669<br />
6,618<br />
2,095<br />
2l»2<br />
Hale<br />
60,186<br />
l»9,170<br />
1.3,252<br />
15,562<br />
22,385<br />
1,1ft<br />
136<br />
19,310<br />
2,500<br />
1,91.5<br />
2,959<br />
h,6Bl\<br />
26<br />
681<br />
2,561<br />
5,131<br />
2,018<br />
lit<br />
Female<br />
61,325<br />
11,165<br />
9,721<br />
7,119<br />
922<br />
1,1.01,<br />
20<br />
teli<br />
268<br />
1,078<br />
75<br />
3)593<br />
662<br />
130<br />
108<br />
1,1*87<br />
77<br />
95<br />
Six Northern Counties<br />
Total<br />
21., 388<br />
ll,63li<br />
9,795<br />
2,71.1<br />
5,11.5<br />
512<br />
17<br />
It, 517<br />
1.51<br />
250<br />
1.12<br />
1.36<br />
173<br />
166<br />
1.03<br />
1,827<br />
586<br />
• 1*5<br />
Male<br />
12,362<br />
10,377<br />
8,770<br />
2,155<br />
t.,982<br />
257<br />
16<br />
It, 1.30<br />
387<br />
170<br />
1.10<br />
1.15<br />
1.<br />
83<br />
397<br />
1,586<br />
585<br />
Female<br />
12,026<br />
1,257<br />
1,025<br />
586<br />
163<br />
255 1<br />
87<br />
61*<br />
80<br />
2<br />
21<br />
169<br />
836<br />
30<br />
21.1<br />
1<br />
15<br />
Ten Southern Counties<br />
Total<br />
97,123<br />
1.8,701<br />
1.3,178<br />
19,91.0<br />
18,162<br />
2,01.6<br />
139<br />
15,217<br />
2,317<br />
2,773<br />
2,622<br />
7,81.1<br />
515<br />
91.5<br />
2,266<br />
i.,791<br />
1,509<br />
197<br />
Kale<br />
1.7, 821.<br />
38,793<br />
3lt,1.82<br />
13,1.07<br />
17,1.03<br />
897<br />
120<br />
11., 880<br />
2,113<br />
1,775<br />
2,51.9<br />
It, 269<br />
22<br />
598<br />
2,161*<br />
3,515<br />
1,1.33<br />
117<br />
Female<br />
1(9,299<br />
9,908<br />
8,696<br />
6,533<br />
759<br />
1,11.9<br />
19<br />
337<br />
20U<br />
998<br />
73<br />
3,572<br />
1.93<br />
31*7<br />
102<br />
1,21*6<br />
76<br />
80<br />
Source: U. S. Census, Population, 191.0, Second Series, Table 23, 23a.<br />
Includes own-account workers. ESccept domestic.<br />
3Except farm. T^"" workers.<br />
Vd kindred workers. a : I 0 B<br />
1 ——————————————————————————————————————————————————————— s we ^S
Female<br />
1,706<br />
69<br />
621<br />
274<br />
2,080<br />
174<br />
6,283<br />
2,477<br />
1,071<br />
343<br />
1,630<br />
286<br />
16,914<br />
n M. o o o e*<br />
si^&s^a<br />
* : a- M s-<br />
•;«7<br />
1946 Estimate <strong>of</strong> Labor Force for Northeast <strong>Georgia</strong> Area<br />
in Total and by Northern an Southern~Counties©<br />
Northeast <strong>Georgia</strong> Area<br />
Total<br />
3,678<br />
277<br />
21,939<br />
3,688<br />
4,322<br />
4,649<br />
12,440<br />
2,941<br />
2,522<br />
4,124<br />
7,153<br />
3,731<br />
71,464<br />
Male<br />
1,672<br />
178<br />
21,306<br />
© 3,247<br />
2,068<br />
4,424<br />
6,078<br />
227<br />
1,299<br />
3,764<br />
5,245<br />
3.293<br />
52,801<br />
Femdle<br />
2,006<br />
99<br />
633<br />
441<br />
2,254<br />
225<br />
6,362<br />
2,714<br />
1,223<br />
360<br />
1,908<br />
438<br />
18.663<br />
Six Northern Counties<br />
Total<br />
561<br />
61<br />
5,047<br />
561<br />
348<br />
501<br />
566<br />
247<br />
283<br />
433<br />
1,789<br />
804<br />
11,191<br />
Male<br />
261<br />
21<br />
4,935<br />
394<br />
174<br />
450<br />
487<br />
10<br />
131<br />
416<br />
1,511<br />
652<br />
9,442<br />
Female<br />
300<br />
30<br />
112<br />
167<br />
174<br />
51<br />
79<br />
237<br />
152<br />
17<br />
278<br />
152<br />
1,749<br />
Ten Southern Counties<br />
Total<br />
3,117<br />
226<br />
16,892<br />
3,127<br />
3,974<br />
4,148<br />
11.874<br />
2,694<br />
2,239<br />
3,691<br />
5,364<br />
2,927<br />
60,273<br />
Male<br />
1,411<br />
157<br />
16,371<br />
2,863<br />
1,894<br />
3,974<br />
5,591<br />
217<br />
1,168<br />
3,348<br />
3,734<br />
2,641<br />
43,369<br />
Source; U. S. Census <strong>of</strong> Population, 1940, Second Series, Tables 23, 23a.<br />
Except Farm Eand Kindred Workers ©Except Domestic ^Family Workers
I<br />
OI<br />
to<br />
I<br />
Slate ....<br />
Engineering<br />
Experiment<br />
Station . . .<br />
Gtowia<br />
Tub<br />
Induitrial . -<br />
. . Economic<br />
Rettitch . .<br />
Summary<br />
and<br />
Counties<br />
Area<br />
Panel I<br />
Panel II<br />
Total<br />
136,3liO<br />
37,062<br />
99,278<br />
Panel I Counties<br />
Barrow<br />
lart<br />
i'orsyth<br />
Jadison<br />
9,1)80<br />
10,712<br />
7,566<br />
9,30lt<br />
Panel II Counties<br />
Franklin<br />
iabun<br />
'ackson<br />
White<br />
Hall<br />
labersham<br />
jumpkin<br />
Stephens<br />
ianks<br />
Inion<br />
oims<br />
Dawocm<br />
10,700<br />
5,280<br />
13,960<br />
U,226<br />
2U.571<br />
10,075<br />
U,109<br />
9,118<br />
5,910<br />
5,088<br />
3,290<br />
2,951<br />
Persons Over<br />
Fourteen Years <strong>of</strong> Age<br />
11<br />
White<br />
60,186<br />
15,596<br />
Mi, 590<br />
3,81j2<br />
a,091<br />
3,791<br />
3,872<br />
1),51)7<br />
2,595<br />
5,686<br />
2,021)<br />
10,707<br />
U.695<br />
1,980<br />
3,859<br />
2.73U<br />
.2,587<br />
1.66U<br />
I,lj92<br />
F<br />
61,325<br />
15,592<br />
1)5,733<br />
1),070<br />
U.018<br />
3,751<br />
3,753<br />
1),631<br />
2,573<br />
5,965<br />
1,977<br />
11.U98<br />
U.886<br />
1,983<br />
3,966<br />
2,761<br />
2,1)92<br />
1,606<br />
1,39$<br />
labor Force by Cowities and by Typo <strong>of</strong> Occupation<br />
for 1 Northeast <strong>Georgia</strong> Area<br />
Non-White<br />
11<br />
7,063<br />
2,61)2<br />
h,221<br />
71)2<br />
1,263<br />
12<br />
825<br />
721)<br />
56<br />
1,122<br />
120<br />
1,051<br />
226<br />
71<br />
575<br />
208<br />
h<br />
6k<br />
F<br />
7,766<br />
3,032<br />
1),73()<br />
826<br />
1,31*0<br />
12<br />
85h<br />
798<br />
56<br />
1,187<br />
105<br />
1,315<br />
268<br />
75<br />
718<br />
207<br />
5<br />
gtcTTn"<br />
Total<br />
69,090<br />
18,71)8<br />
$0,3li<br />
5,1*51)<br />
5,309<br />
3,507<br />
lt,U78<br />
U,913<br />
2,598<br />
7,3hl)<br />
2,033<br />
13,1)01)<br />
U.98U<br />
1,918<br />
U.962<br />
2,606<br />
2,389<br />
1,552<br />
l,Ji37<br />
Table L-9<br />
Total Number <strong>of</strong><br />
Persons in Labor Force<br />
U<br />
Wiite<br />
1)9,170<br />
12,51)7<br />
36,623<br />
3,11)8<br />
3,21)5<br />
3,136<br />
3,018<br />
3,557<br />
2.13U<br />
U,70l)<br />
1,705<br />
8,818<br />
3,71)0<br />
1,668<br />
3,11)0<br />
2,287<br />
2,237<br />
1,1)27<br />
1,206<br />
F<br />
11,165<br />
2,751)<br />
8,1)11<br />
l,27lj<br />
663<br />
359<br />
1)58<br />
571<br />
381<br />
1,360<br />
205<br />
2,965<br />
918<br />
170<br />
1,015<br />
325<br />
11)5<br />
125<br />
231<br />
Non-White<br />
U<br />
5,716<br />
2,375<br />
3,31il<br />
6k9<br />
1,006<br />
12<br />
708<br />
58U<br />
1)9<br />
897<br />
98<br />
610.<br />
187<br />
57<br />
1)58<br />
166<br />
1)<br />
F<br />
3,039<br />
1,072<br />
1,967<br />
383<br />
395<br />
291)<br />
201<br />
31)<br />
383<br />
25<br />
780<br />
139<br />
23<br />
31)9<br />
30<br />
3<br />
Total<br />
61,190<br />
17,086<br />
hlt,Wk<br />
Number <strong>of</strong> Persons Bnployed<br />
U,920<br />
1>,9*<br />
3,193<br />
i),067<br />
U.USI)<br />
2,085<br />
6.86U<br />
1,716<br />
11,835<br />
U,150<br />
1,61)7<br />
)i,Mil<br />
2,28o<br />
2,o5l<br />
1,307<br />
1.2UU<br />
M<br />
White<br />
1)3,252<br />
11,369<br />
31,883<br />
2,765<br />
2,975<br />
2,905<br />
2,72U<br />
F<br />
9,721<br />
2,1)11<br />
7,310<br />
1,197<br />
563<br />
276<br />
375<br />
3,251) U79<br />
1,705 306<br />
li,365 1,262<br />
1.U59 152<br />
7,721 2,623<br />
3,062 797<br />
1,1)37 11)1<br />
2,818 912<br />
1,893 212<br />
1,905 139<br />
1,197 110<br />
1,067 177<br />
Non-U/hite<br />
M<br />
5,282<br />
2,267<br />
3,015<br />
585<br />
978<br />
12<br />
692<br />
557<br />
Wi<br />
861<br />
81<br />
71)1)<br />
157<br />
1)6<br />
371<br />
150<br />
1*<br />
F<br />
2,935<br />
1,039<br />
1,896<br />
373<br />
390<br />
276<br />
191)<br />
30<br />
376<br />
21i<br />
7l(7<br />
131)<br />
23<br />
31)0<br />
25<br />
3
(continued)<br />
I<br />
I<br />
O)<br />
W<br />
I<br />
I<br />
Summary<br />
and<br />
Counties<br />
Area<br />
Panel I<br />
Panel II<br />
Number <strong>of</strong><br />
Wage and Salary Workers<br />
Total<br />
27,57l(<br />
6,115<br />
21,1*59<br />
Panel I Counties<br />
Barrow<br />
Hart<br />
Forsyth<br />
Madison<br />
2,581<br />
1,1)80<br />
516<br />
1,538<br />
Panel II Counties<br />
Franklin<br />
Rabun<br />
Jackson<br />
White<br />
Hall<br />
Habershaa<br />
Lumpkin<br />
Stephens<br />
Banks<br />
Union<br />
Towns<br />
Dawson<br />
1,61)3<br />
877<br />
3,51k<br />
U21<br />
7,580<br />
2,1(03<br />
612<br />
2,81)3<br />
505<br />
390<br />
279<br />
332<br />
11<br />
White<br />
15, #2<br />
2,767<br />
12,795<br />
1,026<br />
621<br />
1)05<br />
715<br />
F<br />
7,119<br />
1,666<br />
5,ltS3<br />
1,031<br />
292<br />
111<br />
232<br />
881) 351<br />
S«l 230<br />
1,839 997<br />
292 81<br />
U.376 2,081<br />
1,526 61)5<br />
1)62 100<br />
1,690 651<br />
325 11)2<br />
317 67<br />
221) 55<br />
279 53<br />
Non-White<br />
H<br />
2,802<br />
l,01il<br />
1,761<br />
301)<br />
35« —<br />
379<br />
F<br />
2,091<br />
61)1<br />
l.liSO<br />
220<br />
209<br />
212<br />
Number <strong>of</strong> Employers<br />
and Own-Account Workers<br />
Total<br />
25,701<br />
8,3l>7<br />
17,351i<br />
1,758<br />
2,1)92<br />
2,06<br />
2,028<br />
255 153 2,1)35<br />
UO 26 939<br />
.1)50 288 2,392<br />
36 12 908<br />
5U9 57U 3,305<br />
117 115 1,1(31<br />
27 23 785<br />
253 2U9 1,219<br />
301) 82 1,371<br />
1,193<br />
— — 737<br />
— — 639<br />
11<br />
White<br />
22,385<br />
7,056<br />
15,329<br />
1,1)13<br />
1,921<br />
2,011;<br />
1,708<br />
2,057<br />
880<br />
1,995<br />
860<br />
2,775<br />
1,310<br />
71)8<br />
970<br />
1,2W)<br />
1,167<br />
716<br />
611<br />
F<br />
922<br />
211<br />
711<br />
52<br />
56<br />
1*6<br />
57<br />
88<br />
S3<br />
Ik<br />
17<br />
206<br />
69<br />
19<br />
76<br />
35<br />
25<br />
21<br />
Non-White<br />
11<br />
1,958<br />
91(9<br />
1,009<br />
211(<br />
1(81<br />
9<br />
2U5<br />
259 •)<br />
295<br />
30<br />
171<br />
37<br />
18<br />
105<br />
91<br />
__<br />
28, —<br />
F<br />
U36<br />
131<br />
305<br />
79<br />
31(<br />
18<br />
31<br />
3<br />
28<br />
1<br />
153<br />
15<br />
68<br />
51<br />
—<br />
—<br />
Number <strong>of</strong><br />
Pr<strong>of</strong>essional Workers<br />
Total<br />
2,721<br />
57U<br />
2,1U7<br />
11(2<br />
193<br />
108<br />
131<br />
21V<br />
136<br />
2lil<br />
75<br />
51il<br />
323<br />
93<br />
217<br />
93<br />
85<br />
77<br />
1(9<br />
White<br />
11<br />
1.15U<br />
217<br />
937<br />
59<br />
75<br />
50<br />
33<br />
96<br />
59<br />
85<br />
28<br />
2S5<br />
121<br />
53<br />
95<br />
28<br />
51<br />
U9<br />
17<br />
F<br />
l,l*0l(<br />
299<br />
1,105<br />
72<br />
92<br />
58<br />
77<br />
111<br />
76<br />
128<br />
1(7<br />
2h9<br />
19U<br />
38<br />
10U<br />
6li<br />
31*<br />
28<br />
32<br />
Negro<br />
M<br />
k9<br />
13<br />
36<br />
2<br />
5<br />
6<br />
h<br />
H<br />
_<br />
Hi<br />
3<br />
7<br />
— _<br />
_<br />
—<br />
F<br />
111(<br />
1»5<br />
69<br />
9<br />
1<br />
15<br />
6<br />
1<br />
20<br />
_<br />
23<br />
5<br />
2<br />
Yl<br />
1<br />
_<br />
—<br />
(Continued on p. 3U )
Table L-9 (Continued)<br />
I<br />
O)<br />
lf><br />
I<br />
Summary<br />
and<br />
Counties<br />
Area<br />
Panel I<br />
Panel II<br />
Number <strong>of</strong> Semi-<br />
Pr<strong>of</strong>essional Worker<br />
Total<br />
159<br />
28<br />
131<br />
Panel I Counties<br />
Barrow<br />
Hart<br />
Forsyth<br />
Madison<br />
12<br />
6<br />
1*<br />
6<br />
U<br />
136<br />
25<br />
111<br />
Panel II Counties<br />
Franklin<br />
Rabun<br />
Jackson<br />
White<br />
Hall<br />
Habershai<br />
Lumpkin<br />
Stephens<br />
Banks<br />
Union<br />
Totms<br />
Dawson<br />
6<br />
1U<br />
3<br />
1*1*<br />
17<br />
6<br />
33<br />
~k<br />
1<br />
White<br />
12<br />
h<br />
I*<br />
5<br />
6<br />
3<br />
1U<br />
3<br />
35<br />
1U<br />
5<br />
26<br />
"u<br />
1<br />
F<br />
20<br />
2<br />
18<br />
1<br />
1<br />
8<br />
3<br />
1<br />
6<br />
Negro<br />
U<br />
3<br />
1<br />
2<br />
F<br />
—<br />
Number <strong>of</strong><br />
Farmers and Farm Managers<br />
Total<br />
21,631<br />
7,1*53<br />
1U.178<br />
1 — 1,357<br />
2,268<br />
l,96lt<br />
1,86U<br />
1<br />
1<br />
—<br />
—<br />
_ '<br />
2,116<br />
753<br />
2,027<br />
836<br />
2,267<br />
1,062<br />
679<br />
81*5<br />
1,293<br />
1,065<br />
61*5<br />
590<br />
White<br />
U<br />
19,310<br />
6,377<br />
12,933<br />
1,11*1<br />
1.7UO<br />
1,917<br />
1,579<br />
1,818<br />
728<br />
1,706<br />
793<br />
2,088<br />
1,002<br />
655<br />
719<br />
1,170<br />
1)01*9<br />
638<br />
567<br />
F<br />
1421*<br />
116<br />
308<br />
10<br />
1*0<br />
38<br />
28<br />
39<br />
22<br />
33<br />
13<br />
67<br />
21*<br />
6<br />
30<br />
28<br />
16<br />
7<br />
23<br />
Negro<br />
U<br />
1,029<br />
926<br />
903<br />
202<br />
1*71<br />
9<br />
2UU<br />
21*9<br />
3<br />
277<br />
30<br />
110<br />
31*<br />
18<br />
92<br />
90<br />
F<br />
68<br />
31*<br />
31*<br />
1*<br />
17<br />
13<br />
10<br />
11<br />
2<br />
2<br />
U<br />
5<br />
—<br />
Number <strong>of</strong> Proprie<br />
tors and Officials<br />
Tota:<br />
2,807<br />
615<br />
2,192<br />
266<br />
138<br />
82<br />
129<br />
219<br />
131*<br />
271<br />
61<br />
658<br />
279<br />
81<br />
251<br />
62<br />
79<br />
60<br />
37<br />
White<br />
U<br />
2,500<br />
572<br />
1,928<br />
2U1<br />
131<br />
77<br />
123<br />
190<br />
108<br />
2U2<br />
51*<br />
575<br />
250<br />
72<br />
231<br />
53<br />
70<br />
51<br />
32<br />
F<br />
26B<br />
37<br />
231<br />
20<br />
6<br />
6<br />
26<br />
25<br />
27<br />
7<br />
62<br />
29<br />
9<br />
11*<br />
9<br />
9<br />
9<br />
5<br />
Negro<br />
U<br />
21<br />
1<br />
20<br />
F<br />
18<br />
5<br />
13<br />
1 It<br />
1<br />
3<br />
2<br />
12<br />
3<br />
__<br />
1<br />
9<br />
3<br />
Number <strong>of</strong><br />
Clerical and Sales Workers<br />
Total<br />
3,053<br />
653<br />
2,1*00<br />
302<br />
11*2<br />
55<br />
151*<br />
201<br />
91<br />
302<br />
39<br />
l.OW<br />
250<br />
51<br />
311*<br />
39<br />
35<br />
22<br />
13<br />
U<br />
White<br />
1,91*5<br />
U27<br />
1,518<br />
192<br />
87<br />
36<br />
112<br />
131<br />
62<br />
207<br />
29<br />
631<br />
171*<br />
32<br />
170<br />
35<br />
25<br />
13<br />
9<br />
F<br />
1,078<br />
221*<br />
851*<br />
110<br />
53<br />
19<br />
1*2<br />
68<br />
29<br />
93<br />
10<br />
391*<br />
75<br />
18<br />
11*0<br />
li<br />
10,<br />
9<br />
1*<br />
Negro<br />
U<br />
22<br />
1<br />
21<br />
F<br />
8<br />
1<br />
7<br />
1 1<br />
1<br />
2<br />
~~5<br />
13<br />
1<br />
U<br />
1<br />
1<br />
*" 5" 6tuni0» I<br />
(Continued on p. 35 )
Summary<br />
Counties<br />
Area<br />
Panel I<br />
Panel II<br />
Number <strong>of</strong><br />
Craftsmen and Foremen<br />
Total<br />
3,11*2<br />
537<br />
2,605<br />
Panel I Counties<br />
Barrow-<br />
Hart<br />
Forsyth<br />
liadlgon<br />
208<br />
135 57<br />
137<br />
Panel II Counties<br />
Franklin<br />
Rabun<br />
Jackson<br />
White<br />
Hall<br />
Habersham<br />
Lumpkin<br />
Stephens<br />
Banks<br />
Onion<br />
Towns<br />
Daws on<br />
11*8<br />
11*6<br />
293<br />
63<br />
866<br />
275<br />
71*<br />
5U8 58 52<br />
56<br />
26<br />
Unite<br />
U<br />
2,959<br />
1*82<br />
2,1*77<br />
183<br />
119 56<br />
121*<br />
138<br />
11*3<br />
260<br />
61<br />
837<br />
262<br />
72<br />
519 51<br />
52<br />
56<br />
26<br />
F<br />
75<br />
21<br />
5k<br />
Negro<br />
11<br />
10B<br />
3k Ik<br />
16 212<br />
9<br />
m—<br />
U<br />
2<br />
1<br />
13 1<br />
13<br />
3<br />
_.<br />
lit7<br />
—<br />
—<br />
—<br />
F<br />
_ _<br />
__<br />
—<br />
__<br />
_<br />
—<br />
—<br />
Number <strong>of</strong> Operatives<br />
Total<br />
8,665<br />
1,651*<br />
7,011<br />
1,157<br />
258<br />
1*1*<br />
195<br />
8 __ 1*00<br />
2 — 118<br />
20 — 1,1*01<br />
1 ——. 69<br />
16 3,012<br />
10 — 61*5<br />
2 — 138<br />
15 — 996<br />
—. 102<br />
—.<br />
——— 65<br />
__ 32 — 33<br />
It<br />
White<br />
l*,68lt<br />
555<br />
1*,129<br />
Table L-9 (Continued)<br />
F<br />
3,593<br />
1,019<br />
2,571*<br />
310 820<br />
118 112<br />
ko k<br />
87 83<br />
231<br />
107<br />
701<br />
56<br />
1,710<br />
396<br />
127<br />
585<br />
58<br />
62<br />
31<br />
32<br />
mo<br />
5<br />
61*7 6<br />
1,131<br />
233<br />
5<br />
359<br />
Negro<br />
U<br />
307<br />
75<br />
232<br />
F<br />
81<br />
5<br />
76<br />
26 1<br />
21* h<br />
— —,<br />
25 —<br />
27<br />
U<br />
1*27<br />
87<br />
15 6 1*31<br />
1*3311<br />
. _ .<br />
_<br />
—<br />
2<br />
2<br />
11<br />
__<br />
511<br />
—<br />
9<br />
_<br />
_<br />
—<br />
Total<br />
2,809<br />
679<br />
2,130<br />
Number in<br />
Domestic Service<br />
276<br />
178 16<br />
209<br />
181*<br />
109<br />
331*<br />
23<br />
830<br />
233<br />
50<br />
297<br />
27<br />
20<br />
White<br />
U<br />
26<br />
9<br />
17<br />
1<br />
2<br />
2<br />
li<br />
__<br />
32<br />
__<br />
5k<br />
—<br />
2<br />
m<br />
9<br />
_<br />
1<br />
—<br />
(Continued on p. 36 )<br />
F<br />
662<br />
71<br />
591<br />
15<br />
10<br />
Hi<br />
32<br />
16<br />
85<br />
65<br />
10<br />
195<br />
100<br />
31*<br />
31<br />
15<br />
18<br />
1C<br />
191<br />
30<br />
161<br />
10<br />
12<br />
—<br />
8<br />
18<br />
2<br />
33<br />
1<br />
73<br />
22183<br />
139<br />
Negro<br />
_<br />
—<br />
F<br />
1,930<br />
569<br />
1,361<br />
250<br />
151*<br />
165<br />
150 19<br />
231*<br />
12<br />
557<br />
107 15<br />
258<br />
72<br />
—<br />
Total<br />
1,683<br />
271<br />
1,1*12<br />
Number <strong>of</strong><br />
Service Workers<br />
126<br />
79<br />
20<br />
1*6<br />
90<br />
92<br />
130<br />
11<br />
610<br />
160 51<br />
186<br />
2k<br />
2U<br />
21<br />
13<br />
White<br />
U<br />
681<br />
121<br />
560<br />
F<br />
1*30<br />
71<br />
359<br />
52 28<br />
33 20<br />
11 9<br />
25 1U<br />
111 21*<br />
27 U6<br />
59U 272<br />
21U 131.<br />
75 1*3<br />
21 11<br />
73 U268<br />
15<br />
13<br />
10<br />
8<br />
Negro<br />
11<br />
389<br />
50<br />
339<br />
33<br />
11*<br />
3<br />
16<br />
13<br />
281*<br />
181*<br />
27<br />
m U832<br />
11<br />
5<br />
_<br />
—<br />
F<br />
183<br />
29<br />
151*<br />
13<br />
12<br />
_<br />
1*<br />
9<br />
6<br />
16<br />
1<br />
78<br />
15<br />
5<br />
23<br />
1<br />
_<br />
--.
Summary<br />
and<br />
Counties<br />
Area<br />
Panel I<br />
Panel II<br />
Number <strong>of</strong><br />
Farm Laborers and Foremen<br />
Total<br />
I* 091<br />
1,589<br />
2,502<br />
Panel I Counties<br />
Barrow<br />
Hart<br />
Forsyth<br />
Madison<br />
365<br />
1*95<br />
136<br />
593<br />
Panel II Counties<br />
Franklin<br />
Rabun<br />
Jackson<br />
White<br />
Hall<br />
Habersham<br />
Lumpkin<br />
Stephens<br />
Banks<br />
Union<br />
Towns<br />
Dawson<br />
391<br />
132<br />
769<br />
57<br />
316<br />
337<br />
Id<br />
11*8<br />
111*<br />
lOU<br />
35<br />
58<br />
U<br />
White<br />
2,561<br />
731<br />
1,830<br />
11*1.<br />
191*<br />
128<br />
265<br />
237<br />
121<br />
1.60<br />
I|5<br />
239<br />
F<br />
108<br />
27<br />
81<br />
10<br />
1<br />
36<br />
15<br />
81S1i<br />
56<br />
38<br />
91<br />
92<br />
102<br />
35<br />
Table L-9 (Continued)<br />
Number <strong>of</strong><br />
Family Farm Workers<br />
Negro<br />
White Negro<br />
U F Total U F U F<br />
1,29'7 125 7,1*99 5,131<br />
71.6 85 2.U86<br />
551 1*0 5,011 3,6^6<br />
1.U95<br />
1,1*87 1*99 382<br />
1*79 259 255<br />
1,008 21(0 127<br />
j, 196<br />
10 258 85 _.<br />
292<br />
_w<br />
2<br />
139<br />
10<br />
251*<br />
12<br />
56<br />
15 2<br />
1*2<br />
21<br />
—<br />
__<br />
—<br />
21<br />
33 —<br />
31<br />
5<br />
3°<br />
_..<br />
6<br />
._ 10<br />
_<br />
—.<br />
_<br />
—<br />
51*5<br />
881<br />
597<br />
1*65<br />
378<br />
21*9<br />
869<br />
371*<br />
889<br />
29<br />
232<br />
331*<br />
393<br />
1*1*7<br />
280<br />
271<br />
315<br />
U09<br />
1*80<br />
291<br />
302<br />
235<br />
512<br />
299<br />
553<br />
217<br />
215<br />
321*<br />
1.10<br />
252<br />
175<br />
95<br />
201*<br />
111*<br />
66<br />
25<br />
13<br />
183<br />
51<br />
300 71<br />
16<br />
159<br />
29<br />
37<br />
28<br />
96<br />
6k<br />
127<br />
3<br />
65<br />
1*2<br />
1<br />
US<br />
lit<br />
23<br />
31<br />
13 28<br />
__<br />
—<br />
—<br />
71<br />
11*1<br />
—<br />
1*3<br />
9<br />
—<br />
59<br />
10<br />
13<br />
I*<br />
— .<br />
20<br />
12<br />
—<br />
—<br />
—<br />
Number <strong>of</strong><br />
Laborers other than Fari i<br />
Total<br />
2, Jlil.<br />
1*27<br />
8,217<br />
ISO<br />
78<br />
101<br />
98<br />
110<br />
111*<br />
191<br />
91<br />
721*<br />
261<br />
11*0<br />
259<br />
62<br />
66<br />
57<br />
11*2<br />
2,018<br />
308<br />
1,710<br />
Occupation<br />
Not Reported<br />
White Negro<br />
White Negro<br />
M F V. F Total U F M F<br />
77 51*1 ft 286 11(7 9 26 18<br />
8 111 118 50 37 20 11<br />
69 1*30 8 168 97 58 6 7<br />
109<br />
37<br />
99<br />
63<br />
1*9<br />
105<br />
103<br />
80<br />
529<br />
226<br />
137<br />
159<br />
59<br />
61*<br />
57<br />
11*2<br />
Sourcet 1). S. Census, Population, Qeorgia, 19UO, Second Series, Table 23.<br />
2<br />
2<br />
2<br />
2<br />
11<br />
—<br />
6<br />
__<br />
39 81ll<br />
—<br />
—<br />
—<br />
39 __<br />
39 __<br />
—<br />
33 —<br />
1*9<br />
9<br />
78<br />
11<br />
151.<br />
27<br />
2<br />
95<br />
32<br />
—<br />
—<br />
1<br />
1*<br />
2<br />
—<br />
. —<br />
1<br />
. —<br />
, —<br />
—<br />
—<br />
m<br />
559<br />
1*0<br />
21*<br />
8<br />
22<br />
ll*<br />
35<br />
13<br />
11<br />
13<br />
13<br />
58<br />
2<br />
6<br />
26<br />
5<br />
13<br />
5<br />
11<br />
U<br />
17<br />
3<br />
12<br />
__<br />
5<br />
_<br />
6<br />
—<br />
S<br />
15 7 i 1<br />
1* 3I* — a<br />
m 2 2<br />
7 5 1<br />
17 16 1 i<br />
7 611* —<br />
10 .—<br />
—.<br />
863li2 — i<br />
6 1 .—<br />
21* —<br />
If**' s %'"&
.1<br />
O)<br />
type <strong>of</strong> Worker<br />
Persons 11. years old and over<br />
In Labor Force<br />
Employed<br />
Wage and Salary Workers<br />
Bnployers1<br />
Pr<strong>of</strong>essional<br />
Semi-Pr<strong>of</strong> essional<br />
Farmers, Farm Managers<br />
Proprietors, Officials2<br />
Clerical, Sales'<br />
Craftsmen, Foremen8<br />
Operatives<br />
Domestic Service<br />
Service Workers*<br />
Farm Laborers,. Foremen<br />
Farm Workers, Unpaid*<br />
Laborers2<br />
Occupation Not Reported<br />
Table L-6<br />
Non-White Labor Force in northeast <strong>Georgia</strong> Area in 191*0 by_<br />
Worker in Total ancTby Northern~and SouthenTCounties<br />
Northeast <strong>Georgia</strong> Area Six Northern Counties Ten Southern Counties<br />
Total<br />
11*, 829<br />
8,755<br />
8,217<br />
U.893<br />
2,391*<br />
163 '3<br />
1,897<br />
39<br />
30<br />
108<br />
388<br />
2,121<br />
572<br />
1,1*22<br />
881<br />
51.9<br />
ia.<br />
Hale<br />
7,063<br />
5,716<br />
5,282<br />
2,802<br />
1,958<br />
1*9<br />
3<br />
1,829<br />
21<br />
22<br />
108<br />
307<br />
191<br />
389<br />
1,297<br />
1*99<br />
51.1<br />
26<br />
Female<br />
7,766<br />
3,039<br />
2,935<br />
2,091<br />
1*36<br />
111*<br />
—<br />
68<br />
18<br />
8<br />
81<br />
1,930<br />
183<br />
125<br />
382<br />
8<br />
18<br />
Total<br />
556<br />
293<br />
255<br />
170<br />
56<br />
3<br />
—<br />
51 ii5<br />
19<br />
52<br />
1*6<br />
21*<br />
26<br />
21.<br />
3<br />
Male<br />
315<br />
208<br />
175<br />
107<br />
51<br />
Female<br />
21,1<br />
85<br />
80<br />
635<br />
__ 3 _ —.<br />
51 _<br />
— 1<br />
.— 1 5 —<br />
17 2<br />
1* 1*8<br />
33 13<br />
21*<br />
16 10<br />
21*<br />
1<br />
—<br />
2<br />
Total<br />
11., 273<br />
8,1,62<br />
7,962<br />
1*,723<br />
2,338<br />
160<br />
3<br />
1,81*6<br />
38<br />
29<br />
103<br />
369<br />
2,069<br />
526<br />
1,398<br />
855<br />
525<br />
<strong>of</strong><br />
Hale Female<br />
6,71*8 7,525<br />
5,508 2,951*<br />
5,107 2,855<br />
2,695 2,028<br />
1,907 1*31<br />
1*9 111<br />
.3 _<br />
1,778 68<br />
21 17<br />
22 7<br />
103<br />
290 79'<br />
187 1,882<br />
356 170<br />
1,273 125<br />
1*83 372<br />
517 8<br />
1.1 25 16<br />
Source: U. S. Census, Population, 191*0, Second Series, Table 23, 23a.<br />
alncludes own-account workers. 4Except domestic.<br />
Except fain. TTamily workers.<br />
sAnd kindred workers. • If<br />
HF
more, it is apparent that local planning will be necessary to<br />
furnish these men with specific opportunities. The Teturning<br />
serviceiran has the legal right to return to his old job. How<br />
ever, many <strong>of</strong> the younger members <strong>of</strong> the armed forces went<br />
directly from high school or college into the service <strong>of</strong> their<br />
country and do not have positions to which they may return.<br />
Others have acquired new skills and want different jobs or would<br />
like to utilize their military experiences in pioneering new<br />
enterprises.<br />
Blanket plans for "setting veterans up as farmers" have generally<br />
failed in the past and are fundamentally in contradiction to the idea <strong>of</strong><br />
absorbing veterans into civilian activities and furnishing them with quick<br />
opportunities to take on civilian ways. The sound way to solve th»s«<br />
problems is through contact with the individuals, veteran by veteran.<br />
Both individual employers and civic groups can well give time to such indi<br />
vidual discussions <strong>of</strong> individual problems.<br />
Uany Till Farm; In Northeast <strong>Georgia</strong>, there will be a high propor<br />
tion wh3 will probably want to engage in farming, and those who have the<br />
interest and skill should be encouraged in this desire. It is important<br />
that would-be farmers be guided by advice from agricultural agencies such<br />
as the County Agent, the Agricultural Extension Service, the College <strong>of</strong><br />
Agriculture, and the Agricultural Experiment Station. The veteran must<br />
be re-established so that he can become an integral part <strong>of</strong> his community,<br />
ac.-opting his share <strong>of</strong> responsibility for problems which occur there. If<br />
he contributes energetically and with his best ability, he can help in<br />
creating the best economic pattern for the postwar period.<br />
—33--
Income<br />
The total buying income <strong>of</strong> the sixteen counties in the<br />
Hortheast <strong>Georgia</strong> Area has increased from $lil,8U8,000 in 1939 to<br />
$103,185,000 in 19liU. The largest item in this increase is de<br />
rived from the sales <strong>of</strong> broilers and frying chickens which dur<br />
State ....<br />
Enfinetrinf<br />
ExpcriaiBt<br />
Station . . .<br />
Indutrial..<br />
ing this period has become the largest single source <strong>of</strong> farm income and one<br />
<strong>of</strong> the major income sources <strong>of</strong> the Area. At the same time the long-stand<br />
ing crops and the manufacturing industries have had increases in general<br />
following the <strong>Georgia</strong> pattern, so that the actual increase in total Buying<br />
Income <strong>of</strong> H6.33 per cent in 19UU over 1939 is somewhat higher than in<br />
other <strong>Georgia</strong> Areas. At the same time retail sales have increased at a<br />
somewhat lower rate, due to the effects <strong>of</strong> rationing, bond buying and in<br />
creased income taxes.<br />
Million<br />
Dollars<br />
100<br />
BoJ<br />
60-<br />
90-<br />
70-<br />
50-<br />
IjO-<br />
30-<br />
20-<br />
10-<br />
—Buying Income<br />
— Retail Sales<br />
1939<br />
(Ten Southern Counties) „.<br />
Table J-l, which<br />
presents the Area sum<br />
mary <strong>of</strong> both income<br />
and retail sales data,<br />
is taken from Sales<br />
Management, and repre<br />
sents estimates based<br />
on gross income Vwages,<br />
salaries, dividends<br />
and interest, Govern<br />
ment payments, and all<br />
miscellaneous itens <strong>of</strong>.<br />
income) adjusted to<br />
represent real or buy<br />
ing income. "After<br />
apportioning to each<br />
state its share <strong>of</strong> the<br />
total national income,<br />
based upon studies <strong>of</strong><br />
retail sales, bank<br />
debits, carloadings,<br />
dividend payments, ag<br />
ricultural marketings,<br />
etc., the total state<br />
incomes are then dis<br />
tributed by counties<br />
on a ratio number<br />
built from the proportion<br />
<strong>of</strong> income tax returns and agricultural marketings which each county<br />
Table J-l<br />
Retail Sales<br />
Buying Income<br />
Source: Table J-2.<br />
Retail Sales and Buying Income, 1939-19UU<br />
(In Thousands <strong>of</strong>T '<br />
1939<br />
$22,097<br />
14,81*8<br />
—39—<br />
191*0<br />
$23,556<br />
IJ.,516<br />
191*1<br />
$28,880<br />
51,133<br />
19U2<br />
$25,597<br />
56,168<br />
19U3<br />
$30,62fc<br />
78,235<br />
19Uj<br />
$39,835<br />
103,885
Summary and<br />
Counties<br />
Area Total<br />
Six Northern<br />
Rabun<br />
Ihite*<br />
Lumpkln<br />
Union<br />
Towns<br />
Dawson*<br />
Total<br />
Ten Southern<br />
Barrow<br />
Hart<br />
Forsyth*<br />
Madison<br />
Franklin<br />
Jackson*<br />
Hall*<br />
Habersham*<br />
Stephens<br />
Banks<br />
Total<br />
Table 1-2<br />
Retail Sales and Buying Income Estimates for the Northeast<br />
<strong>Georgia</strong> Area by Counties 1939 through 19U<br />
Item<br />
Buying Incoma<br />
Retail Sales<br />
Counties:<br />
Buying Income<br />
Retail Sales<br />
Buying Income<br />
Retail Sales<br />
Buying Income<br />
Retail Sales<br />
Buying Income<br />
Retail Sales<br />
Buying Income<br />
Retail Sales<br />
Buying Income<br />
Retail Sales<br />
Buying Income<br />
Retail Sales<br />
Counties:<br />
Buying Income<br />
Retail Sales<br />
Buying Income<br />
Retail Sales<br />
Buying Income<br />
Retail Sales<br />
Buying Income<br />
Retail Sales<br />
Buying Income<br />
Retail Sales<br />
Buying Income<br />
Retail Sales<br />
Buying Income<br />
Retail Sales<br />
Buying Income<br />
Retail Sales<br />
Buying Income<br />
Retail Sales<br />
Buying Income<br />
Retail Sales<br />
Buying Income<br />
Retail Sales<br />
(In Thousands <strong>of</strong> Dollars)<br />
1939 191,0 19W.<br />
*1*1,31*8<br />
22,097<br />
1,6U8<br />
1,012<br />
512<br />
265<br />
1,010<br />
353<br />
728<br />
230<br />
170<br />
11,6<br />
375 76<br />
l*,7l*3<br />
2,087<br />
3,1,87<br />
1,688<br />
3,71*7<br />
962<br />
1,383<br />
560<br />
3,001<br />
823<br />
3,736<br />
1,869<br />
1*,372<br />
2,lj03<br />
10,1,09<br />
7,323<br />
2,621<br />
2,075<br />
3,891*<br />
2,111,<br />
1,55<br />
188<br />
37,105<br />
20,010<br />
$1*1,516<br />
23,556<br />
1,691*<br />
1,079<br />
526<br />
282<br />
1,038<br />
382<br />
71*8<br />
21*5<br />
1*83<br />
156<br />
185<br />
81<br />
l*,67l*<br />
2,225<br />
3,231,<br />
1,799<br />
3,852<br />
1,026<br />
1,1*22<br />
597<br />
1,385<br />
877<br />
3,81,0<br />
1,992<br />
h,h9h<br />
2,562<br />
10,700<br />
7,812<br />
2,891*<br />
2,212<br />
1*,003<br />
2,251*<br />
1(68<br />
200<br />
36,81*2<br />
21,331<br />
$51,133<br />
28,830<br />
2,218<br />
1,312<br />
627<br />
31*3<br />
1,237<br />
1,65<br />
891<br />
293<br />
575<br />
190<br />
370<br />
99<br />
li,918<br />
2,707<br />
3,913<br />
2,138<br />
2,589<br />
1,21*8<br />
2,1*51,<br />
956<br />
1,067<br />
1,067<br />
U.575<br />
2,1*23<br />
5, Hit<br />
3,116<br />
1U,298<br />
9,501<br />
Ij,lt99<br />
2,690<br />
U,769<br />
2,7la<br />
658<br />
2U3<br />
1*5,215<br />
26,173<br />
19irf<br />
156,168<br />
25,597<br />
2,3l»6<br />
1,11*2<br />
693<br />
299<br />
1,309<br />
h05<br />
91*3<br />
259<br />
608<br />
165<br />
Ii09<br />
135<br />
6,308<br />
2.10S<br />
U,139<br />
1,905<br />
2,739<br />
1,087<br />
3,1*52<br />
1,185<br />
2,161.<br />
929<br />
1,81*0<br />
2,110<br />
5,811,<br />
2,713<br />
16,081<br />
8,272<br />
1*,890<br />
2,1*1*1<br />
5,01,5<br />
2,387<br />
696<br />
212<br />
1*9,860<br />
23,21*1<br />
*78,235<br />
30,621,<br />
2,990<br />
1,216<br />
981<br />
391*<br />
1,839<br />
1*75<br />
1,221<br />
280<br />
72!*<br />
161*<br />
l*5o<br />
11*2<br />
8,205<br />
2,671<br />
5,227<br />
2,008<br />
3,61,8<br />
1,209<br />
5,018<br />
1,216<br />
2,763<br />
991<br />
7,122<br />
2,595<br />
7,1*95<br />
2,970<br />
23,71*8<br />
11,016<br />
6,914*<br />
2,889<br />
7,151<br />
2,827<br />
911*<br />
232<br />
70,030<br />
19M<br />
$103,385<br />
39,83i<br />
3,786<br />
1,697<br />
1,337<br />
1,51*<br />
^,330<br />
605<br />
1,680<br />
336<br />
1,075<br />
252<br />
626<br />
181,<br />
10,831,<br />
3.78<br />
7,31,7<br />
2,839<br />
8,62!.<br />
1.U13<br />
7,581<br />
1,395<br />
J*,231«<br />
1,378<br />
8,602<br />
3,11*2<br />
10,753<br />
3,632<br />
28,1*68<br />
1U.10J,<br />
7,371)<br />
3,680<br />
. 8,960<br />
3.5W<br />
1,053<br />
319<br />
93,001<br />
36.251<br />
27,953<br />
Source: Sales Management, April 10, 191*0, 191*1, 19ii2;May 10, 191*3,<br />
19li!*, 191.5. remission has "Seen secured to use these copyrighted estimates.<br />
7ne 1939 retail sales figure is tabulated from U. S. Census, Retail Trade,<br />
<strong>Georgia</strong>, 1939, Table 16.<br />
•Since the Sales Management tables distribute the state total <strong>of</strong> agri<br />
cultural incooe to individual counties according to a general fonmila,the<br />
estimates for six counties fail to include farm income from the sale <strong>of</strong><br />
broilers. The Sales Management estimates <strong>of</strong> both Buying Income and Retail<br />
Sales for Forsyth, Hall, Bawson, Habersham, Jackson, and White counties<br />
have been revised for 191,1-1*1, to reflect this income. _<br />
—40—
has to the total income returns and agricultural marketings <strong>of</strong><br />
tie state. These basic figures are then further refined by<br />
applying known information about the non-money income received<br />
TOJ farmers, as estimated from government surveys made' in 1935-36,<br />
..... The resultant figure is called Effective Buying In<br />
come—effective because it attempts to measure real income, and<br />
not merely dollars and cents. . . .'*L<br />
State ....<br />
Enpnmuif<br />
Experiment<br />
Station . . .<br />
Grergia<br />
Tidt<br />
Indutiul . .<br />
. . Ecoaomk<br />
Refeircb . .<br />
As is the case with most data for Northeast <strong>Georgia</strong>, the summary be<br />
comes more understandable nhen the counties are divided into groups which<br />
reflect the geographic and economic diversities within the Area. Table<br />
J-2 which presents the county detail already summarized in Table J-l di<br />
vides the counties into two groups: (1) the six northern counties, and (2)<br />
the ten southern counties.<br />
As might be expected from the subsistence character <strong>of</strong> fanning and<br />
the lack <strong>of</strong> industry in the six northern counties, they have not quite a<br />
Table J-3<br />
tenth <strong>of</strong> the total income and<br />
slightly smaller proportion <strong>of</strong> the<br />
retail sales.<br />
Value <strong>of</strong> Farm Products Sold, Traded,<br />
and Consumed in 19397 as Per Cent<br />
~~<strong>of</strong> Buying Income in I9UO, for<br />
the Northeast <strong>Georgia</strong> Area,<br />
5ounties<br />
Summary<br />
and<br />
Counties<br />
Area Total<br />
Banks<br />
Barrow<br />
Dawson<br />
Forsyth<br />
ranklin<br />
labersham<br />
Ball<br />
Bart<br />
Jackson<br />
laapkin<br />
ladison<br />
Jabun<br />
Stephens<br />
Towns<br />
Inion<br />
fcite<br />
Value<br />
Farm<br />
Products<br />
1939<br />
$13,223<br />
65k<br />
998<br />
219<br />
1,163<br />
I,2ii9<br />
815<br />
1,385<br />
1,566<br />
1,377<br />
372<br />
1,168<br />
582<br />
105<br />
225<br />
579<br />
1*57<br />
Buying<br />
Income<br />
19UO<br />
(Add 000)<br />
*la,5i6<br />
il68<br />
3,281*<br />
185<br />
1,1(22<br />
3,8JjO<br />
2,891*<br />
10,700<br />
3,852<br />
k,k9k<br />
1,038<br />
1,835<br />
1,691*<br />
U,003<br />
1*83<br />
71(8<br />
526<br />
Per<br />
Cent1<br />
31.85<br />
139.7k<br />
30.39<br />
118.38<br />
81.79<br />
32.53<br />
28.16<br />
12.9U<br />
It0.65<br />
30.6U<br />
35.8k<br />
61.96<br />
3U. 36<br />
10.37<br />
U6.58<br />
77.1*1<br />
86.38<br />
Sources (Col. 1) U. S. Census,<br />
Igrioulture , <strong>Georgia</strong>, 191iO, Third<br />
series, Tab le 17; (Col. 2) Table J-2.<br />
Col. £ calculated from Cols. 1 and 2.<br />
Per Cent which value <strong>of</strong> Farm<br />
Products (Col. 1) is <strong>of</strong> Buying In<br />
come fCol. 2).<br />
—41—<br />
Retail Sales; Tables J-l and<br />
J-2 indicate an upward trend in .re<br />
tail sales for the 1939-19ld( period,<br />
but not a rise equal to that <strong>of</strong><br />
buying income. The explanation<br />
probably lies in the scarcity <strong>of</strong><br />
many consumer goods, increased in<br />
come taxes, and the purchase <strong>of</strong><br />
war bonds. The retail sales<br />
figures are based upon census<br />
figures for 1939, but have been<br />
modified by Sales Management by<br />
changes in population, studies <strong>of</strong><br />
sales tax receipts, bank debits<br />
and a correlation between bank" deb<br />
its and retail sales, and by index<br />
figures <strong>of</strong> retail sales compiled by<br />
the Federal Reserve Bank and by the<br />
Department <strong>of</strong> Commerce. In retabulating<br />
both the retail sales and<br />
income figures,-adjustments have<br />
been made in six counties (Dawson,<br />
Forsyth, Hall, Habersham, Jackson,<br />
and Unite) to reflect the effect<br />
<strong>of</strong> the rapid expansion <strong>of</strong> the<br />
broiler industry which the Sales<br />
Management formula would not<br />
property distribute because <strong>of</strong> the<br />
rapid growth entirely during the<br />
period and the fact that the en<br />
tire development was confined to<br />
eight counties, six <strong>of</strong> which are<br />
in the Northeast <strong>Georgia</strong> Area.<br />
•"•Sales Management, May 10,<br />
19U(, p. 26.
Despite the very apparent predominance <strong>of</strong> farm population<br />
In Northeast <strong>Georgia</strong>, the total value <strong>of</strong> farm products "sold,<br />
traded and consumed" in 1939 was only 31.85 per cent <strong>of</strong> the<br />
Sales Management estimate <strong>of</strong> Buying Income for 191»0, as shown in<br />
Table J-3.<br />
At first glance,the farm products-buying income ratios <strong>of</strong><br />
139.7k per cent for Banks county, and 118.38 per cent for Dawson<br />
county, would appear- to be impossible. Residents <strong>of</strong> both counties, however,<br />
will tend to make retail purchases in Gainesville, Comnerce,or Atlanta,<br />
thus reducing the total <strong>of</strong> retail trade within each county. The Sales<br />
Management estimates <strong>of</strong> buying income take account <strong>of</strong> retail trade as a<br />
control, a. factor which would undoubtedly reduce the buying income estimate<br />
and inflate the farm products-buying income ratio. It must be remembered,<br />
also, that retail purchase <strong>of</strong> food, a large item in non-farm budgets, is a<br />
relatively small item in farm budgets.<br />
Retail trade figures are broken down in the various sections <strong>of</strong> Table<br />
J-U and J-lia, to show in more detail the distribution <strong>of</strong> retail sales in<br />
the Area and in the individual counties. Averags sales per store vary<br />
widely from county to county, ranging from $1$0° in Dawson county to<br />
$20,021 in Hall county. For tiie Area as a whole> th average sales per<br />
store are $12,2Hi, but in general the counties with a high ratio <strong>of</strong> form<br />
Sunmary<br />
and<br />
Counties<br />
Area Total<br />
Banks<br />
Barrow<br />
Dawson<br />
Forsyth<br />
Franklin<br />
Habersham<br />
Ball<br />
Hart<br />
Jackson<br />
Lumokic<br />
Madison<br />
Babun<br />
Stephens<br />
Towns<br />
Union<br />
Ihite<br />
Table J-lt<br />
Retail Trade Summary for the Northeast<br />
<strong>Georgia</strong> Area, for 1939<br />
by~Counties<br />
Number<br />
<strong>of</strong> Stores<br />
Total<br />
1,908<br />
50<br />
138<br />
ko<br />
lOli<br />
17lt<br />
171<br />
375 98<br />
183<br />
73<br />
107<br />
87<br />
129<br />
17 68<br />
6U<br />
Unin<br />
corpo<br />
rated<br />
1,791<br />
1*8<br />
13<br />
U2<br />
103<br />
179<br />
139<br />
366<br />
92<br />
17U<br />
k7<br />
100<br />
85<br />
117<br />
U7<br />
68<br />
U9<br />
Total<br />
Sales<br />
(Add<br />
000)<br />
$22,097<br />
188<br />
1,688<br />
76<br />
560<br />
1,869<br />
2,075<br />
7,328<br />
962<br />
2,U03<br />
358<br />
823<br />
1,012<br />
a,iii<br />
Uj6<br />
230<br />
265<br />
Total<br />
Pay<br />
rolls<br />
(Add<br />
000)<br />
Aver<br />
age Em<br />
ployees<br />
2,275<br />
8<br />
209<br />
1<br />
26<br />
155<br />
220<br />
871<br />
106<br />
258<br />
26<br />
62<br />
86<br />
UjO 218<br />
63lj 10<br />
118<br />
»1,379<br />
2<br />
111,<br />
1<br />
17<br />
77<br />
117<br />
618<br />
58<br />
125<br />
15<br />
31*<br />
US<br />
Source: IT. S. Census, Retail Trade,<br />
<strong>Georgia</strong>, 1939, Table 16.<br />
—42—<br />
income to total income<br />
shorr sales per store considei-ably<br />
below the Area<br />
average. Conversely,<br />
those counties with a<br />
low ratio <strong>of</strong> farm income<br />
to total income show<br />
sales per store well<br />
above the Area average,<br />
Hall being the most<br />
outstanding example.<br />
Table J-lia also has<br />
several noteworthy<br />
blanks, indicating ab<br />
sence <strong>of</strong> stores <strong>of</strong> some<br />
types in Banks, Madison,<br />
Towns, Union, nhite, Dawson,<br />
or Forsyth, so that<br />
residents <strong>of</strong> these coun<br />
ties desirir-g to pa<br />
tronize such conveniences<br />
as exclusive clothing<br />
stores or drug stores<br />
would have to make a trip<br />
to Gainesville, Cornelia,<br />
Commerce or outside the<br />
Area to Athens or Atlanta.
Table J-Ua gut. ....<br />
Enputriac<br />
Retail Trade by Eleven Types <strong>of</strong> Stores for the Northeast |rptri»»t<br />
<strong>Georgia</strong> Area, by_ Counties for 1939 G£,& '<br />
~~ T»d><br />
(Sales in Thousands <strong>of</strong> Dollars) ^E^—i<br />
,__<br />
Banks<br />
__ —— _„<br />
———<br />
9 33 2 *<br />
Barrow<br />
5 69 3 88 3k 226 It 120<br />
Dawson — — — — 1 26 2 *<br />
Forsyth i76 * 167 * 10 52 5 21<br />
Franklin<br />
78<br />
261* 22 210 8 189<br />
Eabersham<br />
89<br />
329 1*1* 276 n 253<br />
Ball<br />
13 51*2 H. 1,791 69 61O 735ii ItOU<br />
Hart<br />
253 * 3 1.0 23 158<br />
5k<br />
Jackson<br />
67 6 361 1.3 230<br />
98<br />
Lmapkin<br />
12 1 * 10 60<br />
Hadison<br />
.—<br />
5 156 26 105<br />
Habun<br />
2 * 26 16 105 •i. *<br />
165<br />
Stephens 5iii 131.<br />
1.83 28 210 5 139<br />
Towns<br />
1<br />
5 8<br />
Union<br />
* 1 * 81* 1*1* 1 *<br />
,lhite<br />
* 1 *<br />
27<br />
*<br />
Food General General<br />
Stores Merchandise Apparel<br />
Item Area Total Stores 752 Sales $5,071 Stores 195 Sales $1,662 Stores 86 Sales $2,571* Stores 1*1 Sales<br />
$551*<br />
Banks<br />
__<br />
27 86 9 50 1 #<br />
Barrow<br />
52 1*90<br />
1* 60* 7 271<br />
1* 5o<br />
Cawson<br />
21* 21, 7<br />
— —<br />
Forsyth 39 91 33 187 5 72 __ __<br />
Franklin 80 1.88<br />
1*<br />
1*7<br />
239 3 7<br />
Eabersham 55 1*69 11* 20U 9 168 3 89<br />
Ball<br />
153 1,597 12 125 10 793 21 387<br />
Eart<br />
31* 256 12 89 5 166 15i *<br />
Jackson 61 51*1* 11 183 13 Uol*<br />
21<br />
Luapkin<br />
1*0 90 7 117 3358 2<br />
*<br />
Kadison 39 101 21* 253<br />
1*8 — . —<br />
Rabun<br />
28 178 7<br />
1*8<br />
87 1 *<br />
Stephens 35 1*78 6 1.7<br />
321* 2 *<br />
Towns<br />
9 7 19 73 2 **— _ __<br />
Union<br />
1*2 86 6 59 1<br />
Unite<br />
31* 86 18 120 —<br />
— —<br />
House Furni Automotive Pilling Lumber-Bldg.<br />
ture, Radio Group Stations Hardware<br />
Item Area Total Stores 52 Sales $ 991 Stores 57 Sales $3,512 Stores 358 Sales $2,101 Stores 60 Sales<br />
$1,W*3<br />
Source: U. 5. Census, Retail Trade, <strong>Georgia</strong>, 1939, Table 15.<br />
_ -mithheld to "avoid disclosure.<br />
—43—
Table J-Ua - Continued<br />
I ten:<br />
irea Total<br />
Banks<br />
Barrow<br />
Dawson<br />
Forsvth<br />
Franklin<br />
Eabershas<br />
Hall<br />
Eart<br />
Jackson<br />
Lunskiri<br />
liadison<br />
Hab-on<br />
Stephens<br />
Towss<br />
Onion<br />
White<br />
Eating, Drink<br />
ing Places<br />
Stores<br />
125<br />
10<br />
——<br />
7<br />
9<br />
31»7<br />
11<br />
1»<br />
—<br />
11<br />
187It<br />
3<br />
Sales<br />
8 602<br />
Drug Stores<br />
Stores<br />
hi<br />
__ ,——<br />
ii<br />
_<br />
1<br />
6<br />
22<br />
*5<br />
58 _—<br />
27<br />
U<br />
226<br />
17<br />
S3<br />
li<br />
—<br />
71<br />
63<br />
k<br />
8<br />
2<br />
6<br />
1<br />
1<br />
3 2<br />
1<br />
1<br />
1<br />
Station , , .<br />
Crorgia<br />
T«h<br />
Indutria!,,<br />
. . Economk<br />
Research<br />
60 179 260<br />
86<br />
71<br />
21A 3U6 581<br />
*<br />
75<br />
78** 17 36U<br />
2 **<br />
8<br />
39**** 8 102<br />
111 137<br />
21 **#<br />
1<br />
Experiment<br />
Other Stores<br />
Sales * 59k _ 90 _ * Stores llil 2 11 _ 9 Sales<br />
$1,837<br />
*<br />
166 _<br />
81
Tourists and Recreation<br />
Sac* .<br />
The lakes, rivers, mountains, and valleys <strong>of</strong> Northeast<br />
Ssorgia present a broad opportunity for the development <strong>of</strong> a<br />
pr<strong>of</strong>itable tourist and reoreational industry. Ill fact, in at<br />
least six counties in the Area-- Eabun, Union, Towns, White,<br />
Lumpkin, and Dawson. and possibly in Habersham, this industry<br />
Expcrimtnt<br />
Station . . .<br />
CraroM<br />
TKh<br />
lodiutrUl. .<br />
. . Ecoaonk<br />
Raeucli . .<br />
<strong>of</strong>fers the greatest possibilities <strong>of</strong> economic development. In these coun<br />
ties, which are essentially rural, over 70 per cent <strong>of</strong> the farms were<br />
Subsistence farms in 1940, and thus were not necessarily farms in the<br />
accepted sense. The roughness <strong>of</strong> terrain, the mountains, and the forests—<br />
the very elements which have hindered successful farming— are proving<br />
The Northeast <strong>Georgia</strong> Area probably has more spots with<br />
tourist appeal than any other section <strong>of</strong> its size in <strong>Georgia</strong>.<br />
In addition to the various places <strong>of</strong> historical and recreational<br />
interest, two conservation regions <strong>of</strong> unusual beauty are in the<br />
Area, Vogel State Park and the Chattahoochee National Forest,<br />
as well as one hundred miles <strong>of</strong> the Appalachian Trail, the<br />
hiker's paradise. Vogel State Park consists <strong>of</strong> four thousand<br />
ceres lying in the heart <strong>of</strong> the Chattahoochee National Forest.<br />
t. 40-aere lake <strong>of</strong>fers fishing, swimming, and boating. Nearby are two<br />
large picnic areas and several miles <strong>of</strong> mountain trails for hiking or<br />
horseback riding.<br />
Eipcri<br />
Sution . . .<br />
Gloria<br />
T«*<br />
Indoitrul. .<br />
. . Economic<br />
Rourcb .<br />
The Chattahoochee National Forest includes within its boundaries<br />
1,165,000 acres in North <strong>Georgia</strong>, although the government owns only<br />
514,772 acres. Within the forest is some <strong>of</strong> the most superb scenery in<br />
the Appalachian Highlands. Daer and bear are rather scarce, but there is<br />
an abundance <strong>of</strong> quail ana wild turkeys, and the streams are well stocked<br />
with fish.<br />
The Appalachian Trail is a 2,050 mile hiking route running along<br />
the crest <strong>of</strong> the highlands froc Mount Katahdin in Ifeine to Mount Oglethorpe<br />
in <strong>Georgia</strong>. The section <strong>of</strong> the trail in <strong>Georgia</strong> is 100 miles long. It<br />
crosses the <strong>Georgia</strong>-North Carolina line over Rich Knob Mountain and enters<br />
the Chattahoochee National Forest, traversing or skirting seven counties<br />
in the Northeast <strong>Georgia</strong> Area— Rabun, Towns, Habershaa, White, Union,<br />
Lumpkin, and Bawson. The trail passes through the wildest and mpst<br />
beautiful part <strong>of</strong> the state, a region <strong>of</strong> dense woodlands, high mountains,<br />
and cascades.<br />
The variety <strong>of</strong> possible tourist attractions in Northeast <strong>Georgia</strong><br />
ranges from mountains, waterfalls, lakes, and springs to Indian mounds,<br />
folk-lore, and folk dances. The Trade and Industry Panel has assembled<br />
a list by counties <strong>of</strong> points <strong>of</strong> interest in each county which may have<br />
tourist appeal. Some have been adequately developed, some partly devel<br />
oped, others virtually untouched.<br />
Banks County; While relatively little has been done to attract<br />
tourists into Banks county, the county none the less <strong>of</strong>fers opportunities<br />
<strong>of</strong> exploitation in a tourist development program. There are a number <strong>of</strong><br />
springs, set in mountain scenery <strong>of</strong> unusual beauty, which may be developed<br />
into watering places. & legend about a spring in the eastern part <strong>of</strong> the<br />
county claii-s for it properties which will cause anyone drinking from it<br />
to becoce the parent <strong>of</strong> twins.<br />
Fishing and hunting are good in Banks county, since the terrain is<br />
<strong>of</strong>ten wild and rugged. A number <strong>of</strong> large streams yield trout and bass.<br />
Quail and rabbits in abundance, some wild turkeys, and an occasional fox<br />
Invite sportsmen from other parts <strong>of</strong> the state.<br />
Barrow County; Fort Yargo, three miles southwest <strong>of</strong> Winder, was<br />
built about '1768 or 1770 and is in a good state <strong>of</strong> preservation. Although<br />
remodelled as a dwelling, one loophole is still visible. Two granite<br />
Barkers erected by the D. A. H. mrk Indian trails. One is 1-J- miles<br />
from Winder, and the other at the intersection <strong>of</strong> the Milledgeville road<br />
and the Bankhead highway.<br />
Dawson County; The mountain scenery In Dawson county is <strong>of</strong> unusual<br />
beauty and <strong>of</strong>fers many opportunities in the development <strong>of</strong> a tourist<br />
program. Amicalola Falls, about, thirteen miles northwest <strong>of</strong> Dawsonville<br />
--46--
i» the highest falls in <strong>Georgia</strong>. Amicalola means ".Tumbling<br />
Suu ....<br />
fcter." Although little known because <strong>of</strong> its isolation, it is Enpoecrioi<br />
tmo <strong>of</strong> the most beautiful sites in the state. Heard Shoals, Experiment<br />
six miles west <strong>of</strong> Dawsonville on State Route No. 52, consists Station .. .<br />
<strong>of</strong> several beautiful cataracts. At the "Narrows," about five Tali<br />
liles southwest <strong>of</strong> Dawsonville, Shoal Creek narrows down between IndutiUI . .<br />
. . EcoAomk<br />
roeks to a point where it can be stepped across. The section is Rcw«cb . .<br />
not easily accessible. The Appalachian Trail ends at Mount<br />
Oglethorpe in Dawson county.<br />
Forsyth County; Several small mounds on the Lawreneeville road south<br />
<strong>of</strong> Cunning are said to be graves <strong>of</strong> Indian chiefs. Near Silver City is<br />
Ifcrked Eock, a granite boulder 8Jj feet long and 2^ feet wide, on which are<br />
carved a number <strong>of</strong> mysterious characters. According to Cherokee legend,<br />
they were made by a race which preceded them.<br />
About 1845 there were seven gold mines in operation in the eastern<br />
!»rt <strong>of</strong> the county.<br />
Franklla Countyi Few points in Franklin county have been developed<br />
to attract tourists. However, here, as in other counties, there are<br />
doubtless a number <strong>of</strong> places <strong>of</strong> historic or sc.enlc interest known only<br />
to residents which, if developed, could bring tourist trade into the<br />
county. Indian sites and relics probably exist which might prove to be<br />
attractive.<br />
Franklin Springs, in the southern part <strong>of</strong> the county, was a wellknown<br />
watering place before the War Between the States. It is now largely<br />
the property <strong>of</strong> the Pentecostal Methodist Church.<br />
Habersham County; Tallulah Falls Industrial School, owned and<br />
operated by the Seorgia Federation <strong>of</strong> Women's Clubs, is a modern school<br />
for mountain boys and girls. Located on the side <strong>of</strong> Cherokee Mountain,<br />
the point provides expansive views <strong>of</strong> the blue ranges <strong>of</strong> Tennessee and<br />
lorth Carolina. Grey Eagle's Chair, once the Council Chair <strong>of</strong> the<br />
Cherokees, is on the grounds <strong>of</strong> the school. It is roughly carved from<br />
» single rock, and weighs 500 pounds. The haudcraft <strong>of</strong> the students <strong>of</strong><br />
the school is <strong>of</strong> interest to visitors.<br />
Clarkesville, the county seat <strong>of</strong> Habersham county, lies in a valley<br />
tad was once a popular summer resort. Old frame hotels built in the<br />
nineteenth century are grouped around the town square. Along the road<br />
ire apple packing houses and apple orchards. Chopped Oak, six miles<br />
southeast <strong>of</strong> Clarkesville, was the intersection <strong>of</strong> several Indian trails,<br />
isd a favorite Indian rendezvous*<br />
On Alex Mountain are the remains <strong>of</strong> an old fort, believed to be <strong>of</strong><br />
Frsnoh construction, and probably the remains <strong>of</strong> an old trading post.<br />
Jhe Appalachian Trail runs along a ridge bordering the northern part <strong>of</strong><br />
the county, affording broad, spectacular views <strong>of</strong> the surrounding country.<br />
Hall County; The Jackson Trail marker, seven miles south <strong>of</strong> Gainesrille,<br />
marks the place where Jackson an* his troops rested in 1818 on<br />
'Isir way to Florida to suppress the Seminole Indians.<br />
Unite Sulphur Springs was once a popular health resort, and the<br />
fccolet Mills occupy a part <strong>of</strong> the "New Holland Spring," also at one<br />
S«S a popular health resort.<br />
—47—
Hart County; Three mij.es southwest <strong>of</strong> Hartwell a. marker<br />
shows the location <strong>of</strong> Ah-yeh-li A-lo-hee, a Oherokee assembly<br />
ground and the intersection <strong>of</strong> several Indian trails. A<br />
marker at Hartwell honors Naney Hart, the Revolutionary heroine,<br />
for whom the county was named.<br />
Jackson County; At Jefferson is a monument to Crawford If.<br />
Long/"where, on Kerch 30, 1842, Dr. Long performed the first<br />
operation in which ether was used as an anaesthetic.<br />
Stale ....<br />
Engianruif<br />
Experiment<br />
Station . . .<br />
<strong>Georgia</strong><br />
Tfch<br />
Industrial . .<br />
. . Economic<br />
Research . .<br />
Six miles from Hoschton stands a one-room log house, built in 1774,<br />
where Andrew Jackson made his headquarters when he blazed the famous<br />
"Jackson Trail" in 1812. On 0. 3. Highway 129 is the Jackson Trail<br />
marker, calling attention to the route taken by Andrew Jackson in 1818 on<br />
his way to Florida to suppress the Seminole Indians.<br />
jVunpkin County; Dahlonega, a little mountain town <strong>of</strong> about 1,300<br />
people, once had a population <strong>of</strong> 10,000. Gold was discovered there in<br />
1829, and the region was soon filled with the shanties <strong>of</strong> miners. Kining<br />
began to decline with the discovery <strong>of</strong> gold in the Best, and today a<br />
number <strong>of</strong> virtually abandoned gold nines are the chief evidence <strong>of</strong> an<br />
adrecturesoce past Probably the nest Interesting to tourists is the<br />
Calhoun cine, once the property <strong>of</strong> John C. Calhoun. The Lumpkin county<br />
courthouse on the town square in Dahlonega is a two-story structure,<br />
built fror 1833 to 1836 <strong>of</strong> hand-made brick made <strong>of</strong> local clay. The<br />
Wigwam hotel, constructed in the 1830's, is also on the town square and<br />
is a large frame building containing two stories and an attic, built<br />
upon a brick foundation. It is now used as a dormitory by Korth <strong>Georgia</strong><br />
College. The Dahlonega Hugget <strong>of</strong>fice is a small wooden building where<br />
the Dahlonega Kugget. a frequently-quoted small town weekly, has been<br />
published for about a half a century. It contains the old-fashioned<br />
handpress used by the first publisher. A water wheel at Dahlonega is forty<br />
feet in diameter and is said to be the largest <strong>of</strong> its type ever constructed.<br />
It once furnished power for Dahlonega.<br />
The town <strong>of</strong> Auraria from 1828 to 1830 had a population <strong>of</strong> 10,000<br />
people. It is today a "ghost town," with few evidences <strong>of</strong> its former<br />
glory.<br />
IToody Gap, between Dahlonega and Keel Gap, is said to be the most<br />
beautiful scenic gap in <strong>Georgia</strong>. At Porter Springs, once a popular<br />
mountain resort, a hotel and cottages surround the mineral springs.<br />
Hearby is a stone cairn, said to be the grave <strong>of</strong> an Indian maiden,<br />
Trahlyta, or. whose grave every passing Indian dropped a stone. Excellent<br />
fishing is found at Cane Creek Jails, and cabins are available. The<br />
Appalachian Trail borders the northern part <strong>of</strong> the county.<br />
Ifedisoe County; Denielsville, the county seat <strong>of</strong> Madison county,<br />
is the birchplace <strong>of</strong> Crawford IT. Long, the surgeon who first used ether<br />
as an anaesthetic. The Crawford Vf. Long monument there reads, "liy pro<br />
fession is, to me, a ministry from God. r<br />
Kadison Springs, with both mineral and freestone water, was in the<br />
nineteenth century one <strong>of</strong> the South*s most popular health resorts. Gold<br />
has been mined in several sections <strong>of</strong> ths county.<br />
Eabun County; Clayton is a little mountain town <strong>of</strong> about a thousand<br />
people whose chief industry is tourists. Frame hotels providing accomodations<br />
for summer visitors line the streets. Hiking trails lead up<br />
—43—
Black Rock and Binnacle mountains. Within a few miles are<br />
twelve lakes, air <strong>of</strong> them formed by power dams. A, large part<br />
<strong>of</strong> the county lies within the Chattahoochee National Forest,<br />
iihere camping facilities are available and fish are plentiful<br />
in the streams. The Appalachian Trail runs along the western<br />
border <strong>of</strong> the county, through one <strong>of</strong> the most isolated highland<br />
sections <strong>of</strong> the state.<br />
State ....<br />
Engineering<br />
Experiment<br />
Station ...<br />
<strong>Georgia</strong><br />
Tee*<br />
Indtutiul . .<br />
. . Economic<br />
Racarcb . .<br />
Just outside <strong>of</strong> Clayton is Screamer Mountain, said to be named for<br />
an Indian who fled screaming to the mountain during the Cherokee removal,<br />
it War Woman Dell are a shelter and picnic facilities. A road ; the dell,<br />
and a creek are named for an Indian woman who is said to have warned the<br />
settlers <strong>of</strong> a proposed Indian raid.<br />
Dick's Creek Tunnel, on a farm near Clayton, was dug through a granite<br />
Eountain before 1860, to be used as a passage for the Black Diamond Rail<br />
road. Construction was not resumed after the War Between the States.<br />
Chestnut Mountain, in the northwestern part <strong>of</strong> the county, has an<br />
altitude <strong>of</strong> 4,600 feet.<br />
Lake Burton is the largest <strong>of</strong> the lakes created by the power developoents<br />
<strong>of</strong> the <strong>Georgia</strong> Power Company. It has a shore line <strong>of</strong> 65 miles.<br />
Sanps and cottages are built in the wooded mountains around the lakes,<br />
and boating and fishing are popular sports.<br />
Tallulah Gorge was out by the great torrent <strong>of</strong> water which once<br />
flowed over the thousand-foot precipice to form the beautiful Tallulah<br />
Falls. The course <strong>of</strong> the Tallulah river has been diverted to supply<br />
rater power, and only the Gorge remains. The Tallulah and the Chattooga<br />
rivers form the Tugalo river, which has been dammed to form Tugalo and<br />
Yonah lakes.<br />
Stephens County: Toccoa Falls, two miles from Toccoa, is formed by<br />
Toccoa Creek as it cascades over a precipice 186 feet high. A rustic<br />
stairway leads to the top <strong>of</strong> the falls.<br />
Hear Tocooa is the prather House, a two-story, white clapboard<br />
house overlooking the Tugalo river, built about 1850. Here Robert Toombs<br />
took refuge from Union soldiers after the downfall <strong>of</strong> the Confederacy.<br />
Tovms County; Kount Enotah, or Brasstown Bald, is the highest peak<br />
in <strong>Georgia</strong>, having an altitude <strong>of</strong> 4,784 feet. It is heavily wooded,<br />
ozcept for the top, on which is located the lookout tower <strong>of</strong> the United<br />
States Forest Service. The Appalachian Trail enters <strong>Georgia</strong> in Towns<br />
county over Rich Knob Uountain and leads into the Chattahooehee national<br />
Forest.<br />
Union County: For a number <strong>of</strong> years much gold-mining activity took<br />
place around Blairsville. Near Uount "Wellborn are many shafts and tunnels<br />
<strong>of</strong> nines, many <strong>of</strong> them now dangerous to enter.<br />
On the summit <strong>of</strong> Track Rock ridge are a number <strong>of</strong> boulders bearing<br />
strange figures, which, according to Cherokee legend were made by a<br />
race which preceded them there.<br />
Nottely Lake, formed by the dam built by the Tennessee Valley<br />
luthority on the Hottely river, <strong>of</strong>fers recreational facilities. The<br />
Appalachian Trail skirts the southern part <strong>of</strong> the county.<br />
--49—
TJhite Countyl There are a number <strong>of</strong> abandoned gold mines<br />
in the county. A pottery shop in Cleveland turns out articles<br />
<strong>of</strong> old-fashioned blister-Hare. Kacoochee Valley, called the<br />
"Lost paradise <strong>of</strong> the Cherokee Indians," is said to be one <strong>of</strong><br />
the most beautiful spots in the world.<br />
The Kacoochee Indian mound, 190 feet long, 150 feet Tide,<br />
and 20 feet high, was excavated by scientists in 1915.<br />
Helen, a little valley town <strong>of</strong> about 200 inhabitants, is popular<br />
as a summer resort.<br />
The Appalachian Trail runs along a ridge bordering the northern part<br />
<strong>of</strong> the county.<br />
Folk-Music; The popularity <strong>of</strong> the "hill-billy" music and "barn<br />
dances" heard on the radio indicates the appeal <strong>of</strong> the mountain ballads<br />
•which have their origin in the Southern mountains, and <strong>of</strong> the "square<br />
dances" which the isolated people <strong>of</strong> the hills have retained from the<br />
formal dances <strong>of</strong> a long-past era. To present this folk music in its<br />
full spontaneity to visitors from other sections is a challenge to those<br />
developing a tourist program.<br />
The Trade, Commerce, and Business Panel <strong>of</strong> the Agricultural and<br />
Industrial Development Board is primarily concerned with a tourist develop<br />
ment program for <strong>Georgia</strong>. Anyone wishing to obtain information on the<br />
activities <strong>of</strong> the Panel, or wishing to contribute to the program may<br />
address lir. Lee S. Triable, Director, Trade and Commerce Panel, Agricultural<br />
and Industrial Development Board, 20 Ivy Street, Atlanta, <strong>Georgia</strong>.<br />
—50—
Industries<br />
Industrial growth in the Northeast <strong>Georgia</strong> Area will follow<br />
two somewhat different patterns in various parts <strong>of</strong> the Area.<br />
The present industrial activity is largely concentrated in Hall,<br />
Barrow, Habersham, Stephens, Jackson, and Hart counties,as is<br />
indicated in Table M-l and Table M-2- These counties, with<br />
Banks, Franklin, and Madison (where somewhat similar conditions •————<br />
exist) may be expected to afford more diverse industrial opportunities<br />
than the more isolated, sparsely populated counties to the north in the -<br />
rugged mountains.<br />
For the ten counties in the southern part <strong>of</strong> the Northeast <strong>Georgia</strong><br />
Area,' eight types probably represent the more desirable opportunities.<br />
These eight types are:<br />
1. Chemical industries based on mineral deposits in the whole Area.<br />
2. Ceramic industries based on recently discovered deposits, and<br />
possibly brick.<br />
3. Industries based on wood-working, including the manufacture <strong>of</strong><br />
furniture, wallboard, fine plywood for furniture and construction<br />
veneer for crates, and household woodenware.<br />
It. Chemical industries based on wood, including pulp and paper<br />
mills, and rayon and cellulose plastics.<br />
5. Light metal industries such as the manufacture <strong>of</strong> automotive<br />
parts, household utensils spun from sheet aluminum or stamped from<br />
Table M-l<br />
Number <strong>of</strong> Plants in the Hortheaat <strong>Georgia</strong> Area<br />
in 1939/"by Industry Groups and by Counties<br />
Counties<br />
Irea Total<br />
Banks<br />
Barrow<br />
Daws on<br />
Porsyth<br />
Franklin<br />
Habersham<br />
Ball<br />
Bart<br />
Jackson<br />
Lunpkin<br />
fcdiaon<br />
Eabun<br />
Stephens<br />
Towns<br />
Union<br />
Ihite<br />
10.<br />
Total<br />
15<br />
S<br />
7<br />
12<br />
27<br />
5<br />
11<br />
2<br />
3<br />
15<br />
1<br />
2<br />
1<br />
1<br />
1<br />
2<br />
9<br />
2<br />
2<br />
3<br />
3<br />
3<br />
1<br />
5<br />
I<br />
Z<br />
1<br />
Industry Groups1<br />
103 20 13 16 16 13 11<br />
4<br />
9<br />
1<br />
1<br />
1<br />
2<br />
2<br />
— —<br />
—<br />
S<br />
3<br />
2<br />
2<br />
1<br />
2<br />
2<br />
1<br />
1<br />
2<br />
Group Bumbers<br />
Source: U. S. Census , Manufactures, 1939, Table<br />
See page S3 for explanation <strong>of</strong> industry groups.<br />
6<br />
2<br />
1<br />
4<br />
6<br />
—<br />
—51—<br />
8 9 12 13 14 17 20<br />
1<br />
2<br />
2<br />
3<br />
1<br />
1<br />
1<br />
6<br />
1<br />
1<br />
4<br />
2<br />
1<br />
1<br />
— — — — —<br />
—<br />
—<br />
1<br />
1<br />
1<br />
1<br />
1<br />
1<br />
3<br />
2<br />
1<br />
sheet steel.<br />
6. Textile pro<br />
cessing, including<br />
industrial products,<br />
apparel and housewares.<br />
7. Other light<br />
industries employing<br />
women, such as nov<br />
elties using paper,<br />
metal, leather, or<br />
wood as raw materi<br />
als.<br />
8. Food pro<br />
cessing.<br />
For the moun<br />
tain counties, some<br />
<strong>of</strong> the industries<br />
included under wood<br />
working (3), food<br />
processing (8), and<br />
textile processing<br />
(6) can be con<br />
sidered.<br />
Area Pattern;<br />
Textiles, apparel,<br />
furniture, earth mov<br />
ing machinery, and<br />
food were the major<br />
types <strong>of</strong> industry re<br />
ported in 1939. Of
the twenty groups used by the census, industries were reported<br />
in twelve groups. In four counties (Banks, Forsyth, Vadison,<br />
and Towns) no industries with a value <strong>of</strong> product exceeding<br />
$5,000 were reported, while in five more (Dawson, Lumpkin,Rabun,<br />
Union, and White) only 3 or less establishments were shown and<br />
ir. some cases all <strong>of</strong> the money values were withheld to avoid<br />
disclosure.<br />
Hall county in 1939 produced almost half the Value <strong>of</strong> Product for the<br />
Area and more than half the Value Added in manufacture. Barrow county had<br />
the next largest totals, shown in Table 11-2. The third county was Ste<br />
phens, although Jackso"n county (on which most figures were withheld for<br />
193 tc avoid disclosure) may actually have been in third place. TJhile<br />
most <strong>of</strong> the manufactures in the Area were concentrated in these four<br />
counties, it appears probable that Franklin, Habersham, and Hart cay expect<br />
increases in industrial employment and that Banks, Madison, and possibly<br />
Forsyth (in all <strong>of</strong> which no manufacturing was reported) may develop light<br />
industries based en truck transportation.<br />
Advantages; The general industrial pattern, indicated by Tables K-l<br />
ar.d K-2, reflects the natural development in the Area as the result <strong>of</strong><br />
conditions which ex-fst and which are elsewhere described in this report.<br />
Table M-2<br />
Census <strong>of</strong> Manufactures Supmary for the Northeast <strong>Georgia</strong><br />
Area, 193S, by Counties<br />
County<br />
Number <strong>of</strong> .-<br />
Averag<br />
Es-<br />
Yearly<br />
tac-<br />
Wage<br />
lish-<br />
ments ers<br />
Earn<br />
1<br />
ITages<br />
Cost <strong>of</strong><br />
Ifaterials 2<br />
Value <strong>of</strong><br />
Products<br />
Value<br />
Added<br />
Area Total<br />
Banks 3<br />
Harrow<br />
Dawson<br />
Forsj-th 3<br />
Franklin<br />
EaBersham<br />
Ball<br />
Eart<br />
Jackson<br />
Lunokin<br />
Jfadisoa<br />
Rabun<br />
Stephens<br />
Towns 3<br />
Unioc<br />
Fnite<br />
103<br />
—<br />
15<br />
3<br />
—<br />
7<br />
12<br />
27<br />
5<br />
11<br />
2<br />
, _<br />
3<br />
15<br />
_-<br />
1<br />
2<br />
7,752<br />
__<br />
1,603<br />
26<br />
—<br />
205<br />
551<br />
3,080<br />
154<br />
1,445<br />
*<br />
_<br />
25<br />
663<br />
__<br />
*<br />
*<br />
$3,601,150<br />
_<br />
873,535<br />
*<br />
—<br />
90,756<br />
*<br />
2,161,856<br />
*<br />
*<br />
#<br />
_ _<br />
11,015<br />
463,988<br />
_<br />
»<br />
*<br />
*8,784,826<br />
_<br />
3,398,813<br />
*<br />
__<br />
214,661<br />
*<br />
4,417,345<br />
*<br />
*<br />
*<br />
__<br />
12,365<br />
741,642<br />
_<br />
»<br />
*<br />
$16,251,723<br />
_<br />
S, 462, 920<br />
*<br />
_<br />
362,009<br />
*<br />
8,732,944<br />
*<br />
*<br />
*<br />
35,716<br />
1,658,134<br />
*<br />
*<br />
*7,466,897<br />
_„<br />
2,064.107<br />
*<br />
..<br />
147,348<br />
*<br />
4.315,599<br />
•<br />
•<br />
*<br />
_<br />
• 23,351<br />
16,492<br />
*<br />
*<br />
Sources U. S. Census, Ifanufaetures, 1939, Table 2.<br />
Tlot including salaried <strong>of</strong>ficers and employees or non-manufacturing<br />
wage earners.<br />
2 Supplies, fuel, purchased electricity, and contract work.<br />
3 Ko Eanufacturicg reported.<br />
*Withheld to avoid disclosure.<br />
—52—
From the viewpoint <strong>of</strong> industrial location the Northeast <strong>Georgia</strong><br />
Irea hast<br />
1. Adequate rail and highway transportation for the con<br />
centration <strong>of</strong> raw materials and shipment <strong>of</strong> finished goods<br />
in all directions.<br />
2. A labor force with adequate skills and readily trainable.<br />
Expcrimtat<br />
Station . . .<br />
Tidi<br />
Iidutriil . .<br />
. . Ecoaomk<br />
Rnttrcb . .<br />
3. The possibility <strong>of</strong> expanding the labor force as new needs arise.<br />
k- Adequate supplies <strong>of</strong> timber which are tending to increase.<br />
5- A cost <strong>of</strong> construction lower than northern regions, resulting<br />
from the narrower range <strong>of</strong> temperatures and the warmer winters.<br />
6. Abundant low cost electric power.<br />
7. Construction costs for plant buildings are frequently one-fourth<br />
or more lower than in northern regions.<br />
8. Existing freight rates in general are comparable with other points<br />
in the Southeast.<br />
9. The weather <strong>of</strong>fers definite advantages, as there is a narrower<br />
ar.nual range <strong>of</strong> temperature and a higher minimum than in colder<br />
climates.<br />
Industry groups; The following is a complete list <strong>of</strong> the twenty<br />
groups into which the census classified the UU7 types <strong>of</strong> industry in the<br />
United States in 19!jO.<br />
1. Food and kindred products.<br />
2. Tobacco manufacture.<br />
3- Textile mill products and other fiber manufactures.<br />
It. Apparel and other finished products made from fabrics.<br />
5- Lumber and timber basic products.<br />
6. Furniture and finished lumber products.<br />
7- Paper and allied products.<br />
8. Printing, publishing, and allied products.<br />
9. Chemicals and allied products.<br />
10. Products <strong>of</strong> petroleum and coal.<br />
11. Rubber products.<br />
12. Leather and leather products.<br />
13- Stone, clay, and glass products.<br />
Ik. Iron and steel and their products, except machinery.<br />
15- Honferrous metals and their products.<br />
16. Electrical machinery.<br />
17. Machinery (except electrical).<br />
18. Automobiles and automobile equipment.<br />
19. Transportation equipment, except automobiles.<br />
20. Miscellaneous industries.<br />
Industrial Comparisons<br />
The Census <strong>of</strong> Manufactures for 1939 classifies all industries in the<br />
United States into the twenty groups which are listed above. In these<br />
twenty groups are Wi7 industry types. In general, the census consolidates<br />
is a single report diverse processes with similar end-products.<br />
For the vast majority <strong>of</strong> these industries, however, the probable<br />
rarlations between individual plants is not so great but that comparisons<br />
can be made on the basis <strong>of</strong> internal ratios between two areas for the<br />
sane industry, as well as between one type and another in the same area<br />
or different areas.<br />
—S3—
The statistical method by which these ratio comparisons can<br />
be made yields a series <strong>of</strong> seven figures, each <strong>of</strong> which contrib<br />
utes to the comparison. Each <strong>of</strong> these figures is arrived at by<br />
dividing the sun: <strong>of</strong> factory wages and salaries into the appropri<br />
ate total. Each <strong>of</strong> the seven figures says: For the expenditure<br />
cf $100 in plant salaries and wages, the ___________ indus<br />
try in ___________Area:<br />
1. Produces a value <strong>of</strong> product <strong>of</strong> $ ________<br />
2- Consumes materials, supplies, containers, fuel, and electricity<br />
valued at $<br />
3.<br />
li.<br />
Creates an additional value (value added) <strong>of</strong> $_<br />
Pays plant salaries amounting to $________~<br />
These four are derived directly from the usual figures reported in<br />
the census for industries by states! The other three are derived either<br />
Croc other tables or by additional calculation.<br />
-The ir.ost significant <strong>of</strong> these figures is the one which says:<br />
5. For each $100 in wages and salaries a gross margin <strong>of</strong><br />
$__________ results.<br />
The gross margin is arrived at by subtracting wages and salaries<br />
from value added.<br />
The others which can usually be calculated arer<br />
6. Value <strong>of</strong> fuel consumed for each $100 <strong>of</strong> wages and salaries.<br />
7. Value <strong>of</strong> purchased electricily consumed for each $100 <strong>of</strong> wages<br />
ar.d salaries.<br />
The most significant <strong>of</strong> these values are those for value added and<br />
for gross margin. It should be noted that,since gross margin is arrived<br />
at by subtracting wages and salaries from value added, the value for<br />
gross margin will uniformly be $100 less than that for value added.<br />
In general, industries or areas with higher values for these two are<br />
nore desirable than those which are lower. The average gross margin<br />
value for all industries in the United States is $172; for the Southeast,<br />
$121; for <strong>Georgia</strong>, $101. Types <strong>of</strong> areas which are above this average<br />
will usually contribute more to the prosperity and standard <strong>of</strong> living <strong>of</strong><br />
the community than those which are below.<br />
Small Industries Heeded; In addition to the major types <strong>of</strong> in<br />
dustry indicated for the Area, there are a larger number <strong>of</strong> small in<br />
dustries which may successfully operate almost anywhere. The principal<br />
requirements for success in this group are: (1) an idea which is<br />
different, (2) a sales personality, and (3) a happy combination <strong>of</strong><br />
circunstances in which the idea catches on with the public.<br />
Sone enterprises <strong>of</strong> this sort can be established with a relatively<br />
snail initial investment. They are, however, subject to considerable<br />
economic hazard,and,frequently,the small investment may be lost. In<br />
part this high hazard factor arises from the circumstance that either<br />
1 For 1939 the salary item is not reported for counties so that<br />
comparable calculations cannot be made at the county level.<br />
--54--
.<br />
the idea has pure novelty* characteristics or it is a venture<br />
Into previously untried fields; <strong>of</strong>ten the first sales are very<br />
great, but resales are zero. Very frequently such enterprises<br />
have an extremely high value added in relation to pay rolls and<br />
an extremely loir raw material cost. These characteristics tend<br />
to encourage imitative competition and <strong>of</strong>ten result in price<br />
complications in the event <strong>of</strong> success because <strong>of</strong> early price de<br />
cisions and agreements growing out <strong>of</strong> apparent low cost. Often<br />
State ....<br />
Enpnirriiit<br />
Experiment<br />
Station . . .<br />
Ctorgia<br />
T*h<br />
iDdaitxul . .<br />
. . EcoBomk<br />
Rocarth . .<br />
such costs tend to rise after the transition to large scale production from<br />
utiat was originally a family or partnership operation, as the need for an<br />
Increased working force appears.<br />
In the beginning, enterprises <strong>of</strong> this character are frequently started<br />
to supply some specific market with the result that since the product is<br />
bought rather than sold, distributive costs are discounted and expansion<br />
nay be undertaken at an ultimately unpr<strong>of</strong>itable price.<br />
Despite these hazards, these small industries are desirable: They<br />
should, however, be carefully checked with competent technical management<br />
and marketing authorities, so that encouragement is extended to those more<br />
likely to succeed and decisions are based on an understanding <strong>of</strong> the risks.<br />
"Novelty merchandise usually sells rapidly in the beginning, after<br />
»hich sales drop, <strong>of</strong>ten disappearing entirely.<br />
—55--
Power<br />
O-ie <strong>of</strong> the outstanding enterprises <strong>of</strong> Northeast <strong>Georgia</strong> is<br />
the production <strong>of</strong> electrical power, the Tugalo and Tallulah<br />
rivers provide storage and power for the extensive <strong>Georgia</strong> Power<br />
Company developments which are on these rivers, and the<br />
Hiawassee and Kottley rivers provide storage for the Tennessee<br />
Valley Authority. The aggregate capacity <strong>of</strong> the principal<br />
existing dans within the Area and the Hiwassee Dam in North Carolina is<br />
225,725 kilowatts. Proposed projects on the Savannah River will add<br />
approximately 291,100 kilowatts to existing capacity.<br />
Prineip _____ Existing Developments; ________ There are two large power dams <strong>of</strong><br />
the <strong>Georgia</strong> Power Ccnpany on the head <strong>of</strong> the Tugalo Hiver, the Tonah Dam<br />
with a station rating <strong>of</strong> 22,500 kilowatts, and the Tugalo Dam with a sta<br />
tion rating <strong>of</strong> US,000 kilowatts. Both are run-<strong>of</strong>-river dams. Just above<br />
these dans are the four developments <strong>of</strong> the <strong>Georgia</strong> Power Conpany on the<br />
Tallulah Hiver, the most completely developed stream in the state. At the<br />
mouth <strong>of</strong> the river is the Tallulah Falls Dam,which has a station rating <strong>of</strong><br />
72,000 kilowatts and operates under a head <strong>of</strong> 60S feet, fourth highest<br />
head <strong>of</strong> any plant east <strong>of</strong> the Rocky Mountains. Above the Tallulah Dam are<br />
the Uathis, Kacoochee,and Burton dams, with station ratings <strong>of</strong> 16,000<br />
kilowatts, lt,800 kilowatts, and 6,120 kilowatts,respectively. The Tallulah<br />
and Nacoochee dams are run-<strong>of</strong>-river dams. The Burton and Jiathis dams are<br />
storage-power dams with a combined storage capacity <strong>of</strong> 129,000 aci«-feet.<br />
Order<br />
<strong>of</strong> De<br />
velop<br />
ment Kane <strong>of</strong> Dam<br />
Proposed Develops; J.j<br />
Savannah River <strong>System</strong><br />
1 Eartwell<br />
2 Canp Creek<br />
3 War Woman<br />
h Rogues Ford<br />
5 Sand Bottom<br />
£ Tallow Hill<br />
Existing Dams<br />
Savannah River <strong>System</strong><br />
Yonah<br />
Tugalo<br />
Tallulah Falls<br />
Kathis<br />
Nacoochee<br />
Burton<br />
Chattahoochee River Sy<br />
Habershara Mills<br />
Tennessee River <strong>System</strong><br />
Kottely<br />
Hiwassee<br />
Tabls M-38<br />
Proposed and Existing Tater Power Developments<br />
in Northeast <strong>Georgia</strong> Area<br />
River<br />
Savannah<br />
Chattooga<br />
Chattooga<br />
Chattooga<br />
Chattooga<br />
Broad<br />
Tugalo<br />
Tugalo<br />
Tallulah<br />
Tallulah<br />
Tallulah<br />
Tallulah<br />
;tem<br />
Soque<br />
Nottely<br />
Hiwassee<br />
—56—<br />
Miles<br />
above<br />
Savannah<br />
290.0<br />
3«8.2<br />
363.6<br />
35U.1;<br />
360.8<br />
292.7<br />
339-9<br />
3U3.1<br />
3Ulj.9<br />
3a7.3<br />
362.1<br />
366. U<br />
Type<br />
<strong>of</strong><br />
Dam1<br />
S P<br />
S P<br />
S P<br />
S P<br />
S P<br />
S P<br />
P<br />
S P P<br />
S P<br />
S<br />
S P<br />
Proposed<br />
Generat<br />
ing Cap<br />
acity Kff<br />
I77-,500<br />
13,700<br />
15,UOO<br />
27,600<br />
11,800<br />
U3.100<br />
289,100<br />
22,500<br />
Il5,000<br />
72,000<br />
16,000<br />
U.SOO<br />
6,120<br />
1,305<br />
58 000<br />
225)725<br />
Estimated<br />
Cost<br />
$33,339,003<br />
2,586,000<br />
5,3811,000<br />
5,81t7,000<br />
2,780,000 1<br />
15,190,000 1<br />
65,126,000 I •<br />
Source:<br />
U. S. Engi<br />
neers.<br />
iS-storage;P-po«r<br />
_
The Nottely Dam, a development <strong>of</strong> the Tennessee Valley<br />
Authority, is located on the Nottely River approximately 2.3<br />
idles south <strong>of</strong> the <strong>Georgia</strong>-North Carolina state line in Union<br />
county. It is a storage unit for holding surplus water for<br />
plants further downstream. No power units have been installed,<br />
although provision has been made for the later installation <strong>of</strong> a<br />
15,000 kilowatt generating unit. The reservoir has a volume <strong>of</strong><br />
190,000 acre-feet.<br />
State ....<br />
Eafiattriai<br />
Expcriwat<br />
Sution . . .<br />
GtoroM<br />
T«
Between 1939 and 1942, the seven Southeastern states had<br />
the largest percentage increase in electric current consumption<br />
<strong>of</strong> any area in the United States. Tables V-3 and 11-4 give<br />
the details <strong>of</strong> consumption for the four years.<br />
Table K-4<br />
Hours <strong>of</strong> Electric Energy Consumption in<br />
Southeast forTll Purposes for 1939 to 1942<br />
State<br />
North Carolina<br />
South Carolina<br />
<strong>Georgia</strong><br />
Florida<br />
Tennessee<br />
Alabama.<br />
Mississippi<br />
1939<br />
2,725<br />
1,509<br />
2,175<br />
1,154<br />
2,822<br />
2,193<br />
557<br />
13,135<br />
1940<br />
(000,000<br />
3,376<br />
1,S83<br />
2,224<br />
1,283<br />
3,626<br />
2,949<br />
442<br />
15,482<br />
1941<br />
Quitted<br />
4,131<br />
2,062<br />
2,760<br />
1,486<br />
4,558<br />
3,652<br />
697<br />
19,34<br />
1942<br />
4,470<br />
2,602<br />
3,757<br />
1,616<br />
7,155<br />
4,034<br />
608<br />
"24"734"5<br />
Per<br />
Cent<br />
In<br />
crease<br />
1942<br />
over<br />
1939<br />
64.0<br />
72.4<br />
72.7<br />
31.4<br />
153.5<br />
83.9<br />
-8.8<br />
83.0<br />
Source: Regional Shifts in Population, Produc<br />
tion and Markets, 1939-43. Bur< =au <strong>of</strong> Foreign and<br />
Domestic Comerce.<br />
Totals for<br />
1942 in the ta<br />
ble 11-4 are al<br />
most equivalent<br />
to the figures<br />
for the entire<br />
Pacific Coast,<br />
which in 1942<br />
had a total<br />
consumption <strong>of</strong><br />
24,859 million<br />
kilowatt hours,<br />
an increase <strong>of</strong><br />
48.6 per cent<br />
over the 1939<br />
total <strong>of</strong> 16,729<br />
million kiloiratt<br />
hours. The<br />
Pacific Coast<br />
proportion <strong>of</strong><br />
the total United<br />
States consump<br />
tion was, in<br />
1942, 12.99 par<br />
cent, conpared with 12.71 per cent in 1939. Only the Middle Atlantic and<br />
East Korth Central regions exceed the Southeast or Pacific Coast consump<br />
tion <strong>of</strong> electric energy. The Kiddle Atlantic total for 1942 was<br />
47,237,000, an increase <strong>of</strong> 55.8 per cent, while the East North Central<br />
had a 1942 total <strong>of</strong> 42,728,000, an increase <strong>of</strong> 45.7 per cent.<br />
Table H-5<br />
Regional nse <strong>of</strong>- Soergy, in Manufactures for 1939<br />
Dollar Expenditure for Fuel and<br />
Purchased Electric Energy<br />
Southeast<br />
United States Southeast % <strong>of</strong> U. S.<br />
Fuel f 850,464,000 \ 52,414,000 6.1<br />
Purchased Electric Energy 465,426,000 56.940,000 12.2<br />
Total Energy Expenditure Jl,315,890,000 4165,364,000 '8.3<br />
Generated by Industries<br />
Purchased<br />
Millions <strong>of</strong> Kilowatt Hours Used<br />
26,827<br />
45.040<br />
71,867<br />
Source: 0. S. Census, Manufactures, 1939.<br />
—53—<br />
3,287 12.2<br />
^,065 15.6<br />
157352
The foregoing percentages and totals coapare total con<br />
sumption. Not all electricity, <strong>of</strong> course, enters into indus<br />
trial use. The 1940 census presents on a national basis<br />
figures showing the dollar value <strong>of</strong> purchased electric energy<br />
used by industries and the kilowatt hours purchased, and,as a<br />
separate figure, kilowatt hours generated by industries.<br />
Corresponding figures are also given for individual industr5.es.<br />
State ....<br />
Engiaccrinf<br />
Eipcrimeat<br />
Station . . .<br />
Gtorgia<br />
TV*<br />
Industrial . .<br />
. . Economic<br />
Rewarcb . .<br />
Table M-6<br />
Kilovjatt Hours used by Manufacturers<br />
In the Southeast in 1939<br />
State<br />
Korth Carolina<br />
South Carolina<br />
<strong>Georgia</strong><br />
Florida<br />
Tennessee<br />
Alabama<br />
Mississippi<br />
Region<br />
Gener-| Pur-<br />
Total ated1 1 chased<br />
(000,000 Onitted)<br />
2,322<br />
1,470<br />
1,309<br />
485<br />
2,777<br />
1,710<br />
279<br />
10,352<br />
821<br />
538<br />
342<br />
339<br />
495<br />
643<br />
109<br />
TT2S7<br />
Sources u. S. Census, Manu<br />
factures, 1939.<br />
1 By manufacturers.<br />
1,501<br />
932<br />
967<br />
146<br />
2,282<br />
1,067<br />
170<br />
7,065<br />
The industrial potentialities<br />
for the Northeast <strong>Georgia</strong> Area<br />
inherent in the Savannah River<br />
development may best be approached<br />
by examination <strong>of</strong> these data for<br />
the United States, which also in<br />
clude a discussion <strong>of</strong> the expendi<br />
tures for fuel. Following the<br />
general discussion, individual<br />
industries selected on the basis<br />
<strong>of</strong> the general discussion will be<br />
examined in greater detail in<br />
terms <strong>of</strong> power costs in individual<br />
states.<br />
For 1939 all industry in<br />
the United States expended<br />
$1,315,890,000 for fuel and pur<br />
chased electric energy. The use<br />
<strong>of</strong> electricity totaled 71,867<br />
million kilowatt hours.<br />
Table K-7<br />
The Largest Users <strong>of</strong> Fuel In Manufactures<br />
in the United~States la 1939<br />
Industry Tvpe<br />
Blast Fjruaces<br />
Steel Works, Rolling Mills<br />
Petroleum Refining<br />
Paper<br />
Chemicals, Unclassified<br />
Ceaent<br />
Motor Vehicles<br />
Bread and Bakery<br />
Priaary Smelting, non-ferrous<br />
Brick and Tile<br />
Pulp<br />
Heat Packing<br />
Djaing t Finishing Textiles<br />
Purchased<br />
Electricity<br />
(000 emitter!)<br />
Fuel<br />
$145,500<br />
125,989<br />
58,479<br />
43,506<br />
31,757<br />
24,134<br />
18,749<br />
18,043<br />
14,486<br />
12,650<br />
11,402<br />
10,563<br />
10,151<br />
$523,449<br />
* 1,444<br />
35,304<br />
10,904<br />
15,387<br />
16,580<br />
9,908<br />
16,645<br />
11,394<br />
11,040<br />
2,725<br />
5,518<br />
7,026<br />
2,106<br />
1143,461<br />
Sources U. S. Census, Manufactures, 1939.<br />
—59—<br />
Comparing the<br />
percentage in Table<br />
M-6 with the per<br />
centage <strong>of</strong> Value<br />
Added in the region,<br />
7.1 per cent, only<br />
the fuel figure is<br />
below the regional<br />
Value Added peroent-<br />
»Se - The high per<br />
centage for pur<br />
chased electric<br />
energy and kilowatt<br />
hours reflect the<br />
greater availability<br />
<strong>of</strong> water power alectricity<br />
in the region,<br />
so that a lesser<br />
part <strong>of</strong> the fuel<br />
item in the region<br />
is used for tne gen<br />
eration <strong>of</strong> current<br />
by manufacturers, as<br />
well as a favorable<br />
rate situation re<br />
sulting from the
location in the region <strong>of</strong> 22 per cent <strong>of</strong> the nation'3 water<br />
power available for generating eleotrioity. This is emphasized<br />
^>y the fact that industry purchased 15.6 per cent <strong>of</strong> the pur<br />
chased electric energy for 12.2 per cent <strong>of</strong> the expenditure<br />
(Table Jt-5) . The extent to which electric energy is employed<br />
by industry in the various states in the region is shown in<br />
Table Jl-S.<br />
Industry TytJQ<br />
Steel Works and<br />
Rolling Hills<br />
Cotton Broad Woven<br />
Xotor Vehicles<br />
Chemicals1<br />
Ice<br />
Paoer<br />
Primary Smelting<br />
noi-ferrous<br />
3raad and Bakery<br />
Table M-8<br />
The Largest Users <strong>of</strong> Purchased Electric Energy in<br />
Manufactures i£~"the United states in 1939<br />
Purchased<br />
Elec<br />
Fuel tricity<br />
(000 Omitted) Industry<br />
$125,989<br />
8,830<br />
18,743<br />
31,757<br />
3,791<br />
43,506<br />
14,483<br />
16.043<br />
* 35,804<br />
22,705<br />
16,645<br />
16,530<br />
15,971<br />
15,387<br />
11,640<br />
11,394<br />
Petroleum<br />
Cement<br />
newspapers<br />
Cotton Yarn<br />
Meat packing<br />
Pulp Mills<br />
Flour<br />
Totals<br />
Source: U- S. Census, Manufactures, 1939.<br />
•"•Hot elsewhere classified.<br />
Purchased<br />
Electricitv<br />
Fuel<br />
(000 Omitted)<br />
* 58,479<br />
24,164<br />
2,651<br />
889<br />
10,563<br />
11,402<br />
2,256<br />
13737555<br />
$ 10,904<br />
9,908<br />
7,205<br />
7,086<br />
7,026<br />
5,519<br />
6,226<br />
$199,985<br />
Table V-9<br />
Manufacturers Generating Over One<br />
Billion SiloTOtt Hours <strong>of</strong><br />
glescrie Eaergy, 1939<br />
Industry Type<br />
palp and Paper<br />
Blast Furnaces and<br />
Rolling Mills<br />
Chemicals<br />
Cesent<br />
Petroleum Refining<br />
Hayon and Allied<br />
Products<br />
All Smelting<br />
Used in Industry<br />
Gener Pur<br />
ated chased<br />
(000,000 Quitted)<br />
6,087<br />
4,331<br />
2,731<br />
1,298<br />
1,268<br />
1,027<br />
927<br />
17^553<br />
2,972<br />
5,118<br />
3,806<br />
1,402<br />
1,505<br />
211<br />
3,694<br />
IS7, 705<br />
Source: U- S. Census, Manufac<br />
tures, 1939.<br />
—60—<br />
While data are not available<br />
by states for the use <strong>of</strong> fuel and<br />
electric energy in individual<br />
industry types, the national fig<br />
ures will provide a general basis<br />
on which the regional advantage<br />
in terms <strong>of</strong> electricity may be<br />
used as a means <strong>of</strong> selection.<br />
Thirteen industries nation<br />
ally are the largest purchasers<br />
<strong>of</strong> fuels, aeeouating for 61.5 per<br />
cent <strong>of</strong> 'the national fuel in<br />
industry total (Table 3^-7). No<br />
cdi3 industry in this group ex<br />
pends less than $10 million for<br />
fuel. These same thirteen in<br />
dustries are frequently large<br />
buyers <strong>of</strong> electric energy.<br />
They used 31.3 per cent <strong>of</strong> the<br />
purchased electric energy total.<br />
Fifteen industries (shown<br />
in Table n-8) purchased elec<br />
tric energy in amounts over $5<br />
million. These industries
ougnt 43.0 per cent <strong>of</strong> the purchased electric energy used by<br />
all manufactures. They also bought 43.7 per cent <strong>of</strong> a'll fuel<br />
purchased by manufactures.<br />
For the United States, manufacturers generated<br />
28,749,940,000 kilowatt hours <strong>of</strong> electric -energy. Of this,<br />
,922,940,000 kilowatt hours were sold, leaving a net use <strong>of</strong><br />
E6.827 million kilowatt hours. Seven industry types each<br />
generating over one billion kilowatt hours,used 17,659 million<br />
kilowatt hours, and in addition purchased 18,708 million as shown in<br />
Table JJ-9.<br />
Suu . . .<br />
Engineering<br />
ixpcninriit<br />
Sution . .<br />
<strong>Georgia</strong><br />
Ttdt<br />
Indoltriil . .<br />
. . Economic<br />
Ronrcb . .<br />
All but one <strong>of</strong> the seven industry types in Table M-9 appear in<br />
the two preceding tables. Tables M-7 and M-8 have ten common types betnaen<br />
them. All <strong>of</strong> this emphasizes the importance <strong>of</strong> available electric<br />
eaerjy to industry, since for most <strong>of</strong> the nineteen industries in the<br />
three tables either heat or steam is necessary in processing; yet even<br />
these industries buy two-thirds the electric energy bought by all indus<br />
try, and produce and use (<strong>of</strong>ten as a by-product <strong>of</strong> their heat and steam<br />
uses) an equal proportion <strong>of</strong> the total <strong>of</strong> electric energy produced<br />
irithin industry.<br />
The five usual uses <strong>of</strong> energy in manufactures provide:<br />
1. Heat 4. Electrolysis<br />
2. Steam 5. Illumination<br />
3. Power<br />
Fuels ranging from ooal, coke, oil, kerosene, gasoline, wood, gas,<br />
and waste products are used to provide directly heat, steam, and power.<br />
Indirectly they may provide heat, power, electrolysis, and illumination<br />
through the generation <strong>of</strong> electric energy.<br />
Electric energy may likewise provide all <strong>of</strong> industry's energy re<br />
quirements, but, practically, the production <strong>of</strong> steam should be excluded,<br />
and in some oases heat produced electrically will adversely affect<br />
costs. Industry may secure electric energy from three sources; by<br />
purchases from water power or steam plant producers, by generation by<br />
steam or diesel plants operated by the industry, or by water power<br />
plants operated by the industry. With this background, the relative<br />
requirements <strong>of</strong> various industry types for fuel and purchased electric<br />
energy emerge as a factor in the selection <strong>of</strong> desirable new industries<br />
for the region which is discussed in connection with individual in<br />
dustries.<br />
Atomic<br />
. ,<br />
Energy<br />
„<br />
The atomic bomb which ended the war has a long range significance to<br />
Seorgia and the Northeast <strong>Georgia</strong> Area. Ultimately, it may be expected<br />
that atomic energy will pr<strong>of</strong>oundly affect the production <strong>of</strong> power, the<br />
transmission <strong>of</strong> power, and even its application to mechanical problems.<br />
At this early date it is not practical to make any sort <strong>of</strong> an estimate as<br />
to when these results will begin to occur, or when they will reach general<br />
use. The limited amount <strong>of</strong> information already released permits no<br />
accurate time estimate, while the natural scientific caution <strong>of</strong> the rela<br />
tively fow persons who know the whole story may be expected to prevent<br />
jay estimates from that source; nor has policy been established by Congress.<br />
The vaTue <strong>of</strong> waste used as fuel and tne costs <strong>of</strong> operating such<br />
»ater power plants by industry may not appear in the figures reported<br />
ia the census.<br />
--61—
J<br />
Eowsvsr, the tiro billion dollar research which produced the<br />
boob must inevitably have developed a much larger body <strong>of</strong><br />
related information than has ever before been available at the<br />
initial utilization <strong>of</strong> any previous scientific discovery <strong>of</strong><br />
comparable magnitude, such as the first use <strong>of</strong> fire, the steam<br />
engine, or electricity. Hhile historically one might well<br />
argue that the every-day utilization <strong>of</strong> atomic power would be<br />
two or three generations away, this view takes no account <strong>of</strong> the<br />
acceleration <strong>of</strong> technological application which has developed in the United<br />
States during the past thirty years, and which has almost touched super<br />
sonic rates during the war,<br />
Further there are signs that the possibility <strong>of</strong> more immediate appli<br />
cation <strong>of</strong> some atonic uses must be considered. One source close to the<br />
secret has publicly asserted that a power plant based on atomic energy<br />
couli be constructed for froa "450,000 to $100,000" and could be "running<br />
by next April."4 Ho technical details were given, and,while it may be<br />
accepted as a possibility there is no likelihood that such a plant<br />
will be is operation by April, 1946. The statement, however, does indi<br />
cate that such a development may be years closer than the general scien<br />
tific expectation.<br />
Ihe significance <strong>of</strong> all this to <strong>Georgia</strong> and to the Area lies in<br />
the circumstance that, so far as one can judge, the processes involved<br />
in altering uranium into the desired forms requires the use <strong>of</strong> large<br />
quantities <strong>of</strong> electric current. The Coosa River in <strong>Georgia</strong> and Alabama,<br />
the Chattahoochee Eiver, and the Savannah River are among the last few<br />
places in the United States where relatively large volumes <strong>of</strong> electric<br />
current may be developed by water power at favorable costs. This factor<br />
together Tilth the circumstance that much <strong>of</strong> the .atomic development took<br />
place in adjoining Tennessee,where the power resources <strong>of</strong> the Tennessee<br />
Valley Authority were available, seems to point to the possibility that<br />
when plans for the controlled release and utilization <strong>of</strong> the technical<br />
data already developed are completed by the Federal government^the Coosa,<br />
Chattahoochee, and Savannah Valleys may likely "beeon" a part <strong>of</strong> that<br />
development.<br />
Ihe somewhat unoartain possibility that an organized study <strong>of</strong> the<br />
geology <strong>of</strong> North <strong>Georgia</strong> might lead to the discovery <strong>of</strong> uranium or other<br />
ores useful in connection with atomic energy also exists. The principal<br />
indication <strong>of</strong> this possibility relates to uranium and lies in the fact<br />
that radioactive springs are known to exist in <strong>Georgia</strong>, generally in<br />
association with the underlying granite sheet. A more complete and de<br />
tailed geolo^i al mapping <strong>of</strong> North <strong>Georgia</strong> would provide the basis for<br />
determining whether or not the existence <strong>of</strong> uranium or other atomic ores<br />
was possible and, if so, where and at what depth they might likely.be<br />
found.8<br />
*Busjaess Week, September 15, 1945, quoting from an address by Dr.<br />
Eueben 5. Sustavson, dean <strong>of</strong> faculties <strong>of</strong> the <strong>University</strong> <strong>of</strong> Chicago,<br />
before the Executive Club <strong>of</strong> Chicago.<br />
B See page 63.<br />
—52—
Mineral Industries<br />
Northeast <strong>Georgia</strong> contains a wide variety <strong>of</strong> minerals<br />
ranging from gold to granite, marble, mica, asbestos, divine,<br />
»nd sillimanite to semi-precious stones. Some are present in<br />
large quantities, others are apparently mere curiosities.<br />
The complexity <strong>of</strong> the geology <strong>of</strong> Northeast <strong>Georgia</strong> and lack"<br />
<strong>of</strong> basic knowledge has long limited the scientific study <strong>of</strong> these deposits.<br />
The Dahlonega gold field, for example, appears to be exhausted, but it is<br />
not impossiole that the "pocket" characteristic <strong>of</strong> the known mines could be<br />
interpreted to lead to more substantial veins at greater depth. It is,<br />
however, impossiole to do the necessary interpretation without more exact<br />
knowledge about the formations than now exists. Similarly, mica is present<br />
but elusive. Although in 1943 <strong>Georgia</strong> attained fourth place ic United<br />
States production, deposits are small and quickly worked out. Locating a<br />
now mine is then a matter <strong>of</strong> "guessing."<br />
The lack <strong>of</strong> scientific knowledge illustrated above leads to a recom<br />
mendation that the first and most important step necessary for the more<br />
complete developnent <strong>of</strong> the mineral resources <strong>of</strong> the Northeast <strong>Georgia</strong> Area<br />
is a sound program <strong>of</strong> basic geologic research. Such a program includes:<br />
(1) adequate topographic mapping based on aerial photographs; (2) detailed<br />
large-scale geologic mapping.<br />
The question naturally arises: "Has this not already been done, and<br />
is not the needed information already in the various maps and bulletins<br />
issued by the <strong>Georgia</strong> and United States geological surveys" The answer is<br />
an emphatic "no." Almost all <strong>of</strong> the existing material is <strong>of</strong> a prospecting<br />
or reconnaissance nature and cannot be used either to determine basic<br />
structures, or to forecast "what may be found where." Predominately, such<br />
puDlications represent only a description <strong>of</strong> deposits someone has acciden<br />
tally stumoled onto or observed. Basically, the information they contain<br />
Is useless for detailed correlative work.<br />
Cost <strong>of</strong> Program; The question <strong>of</strong> how much such a program will cost<br />
should be asked, and whether or not that cost will not be greater than the<br />
probable benefits. The answer to this question is that the total cost <strong>of</strong><br />
doing what is recommended for the Northeast <strong>Georgia</strong> Area would be about •<br />
1250,000, <strong>of</strong> which the United States Geologic Survey might assume about<br />
half. Three to five years would be required to complete the work in the<br />
lortheast <strong>Georgia</strong> Area. Five per cent interest on 4250,000 is |12,500. A<br />
single large-scale industry (one producing finished goods selling for<br />
|1 Billion with a payroll <strong>of</strong> about $350,000 and using minerals worth per<br />
haps $150,000) would produce annual direct taxes <strong>of</strong> $10,000 to 415,000. In<br />
directly, taxes on hornet occupied Dy workers, and on increased retail trade<br />
»ould amount to as much more. On the other hand, if the mapping proved<br />
that no new mining operations were practical in some fields, an annual sav<br />
ing would result from avoiding the cost <strong>of</strong> prospecting which leads to no<br />
discovery, or an investment in a plant which fails.<br />
The complete cost <strong>of</strong> mapping a single quadrangle will range from as<br />
Such as 425,000 for a nucleus 1 area down to 412,000 for the last quadrangle<br />
i" a group. The controlling factor in thesa differences is the greater<br />
Uiount <strong>of</strong> information available as the mapping proceeds and the possibility<br />
<strong>of</strong> filling in some parts <strong>of</strong> the structure by extrapolation. The initial<br />
The first quadrangle studied in a larger group.<br />
—63--
investment <strong>of</strong> (25,000 in a single quadrangle can be amortized in<br />
slightly less than fifteen years by an annual allowance <strong>of</strong> ten<br />
per cent or $2,500 (figuring five per cent interest), an annual<br />
amount which can easily be <strong>of</strong>fset by any one <strong>of</strong> several economic<br />
results from the location <strong>of</strong> a single usable deposit. For ex<br />
ample, a mining operation with raw ore sales <strong>of</strong> $50,000 may have<br />
payrolls <strong>of</strong> $20,000 to $30,000. Such a mine would add more than<br />
enough tax revenue to wipe out the investment in a single quad<br />
rangle. The pr<strong>of</strong>its <strong>of</strong> retail stores from sales to mine employees, taxes<br />
on the $75,000 invested in the houses the miners occupied, rent on the<br />
houses, the net pr<strong>of</strong>it <strong>of</strong> $S,000 to $15,000 from the mine, all would be net<br />
additions to the economy.<br />
Effect <strong>of</strong> Existing Methodsi The statement is <strong>of</strong>ten correctly made<br />
. that almost any mineral can be"found in <strong>Georgia</strong>. The list <strong>of</strong> minerals<br />
which have been found runs into the hundreds. Hhile this is truo, it is<br />
also true that the general body <strong>of</strong> knowledge with respect to these minerals<br />
has followed the pattern <strong>of</strong> accidental discovery, local reconnaissance, and<br />
only occasionally the development <strong>of</strong> deposits which are <strong>of</strong> major econonic<br />
importance. The large majority <strong>of</strong> discoveries so made have been either ma<br />
terials which at the point <strong>of</strong> discovery prove to Be deposits <strong>of</strong> small size,<br />
or materials for which the United States or even world market has thus far<br />
been relatively small.<br />
The existing mining industries which have been developed have experi<br />
enced a haphazard and irregular growth which on the oasis <strong>of</strong> the knowledge<br />
produced gives little promise <strong>of</strong> great future expansion. Many <strong>of</strong> the min<br />
eral industries <strong>of</strong> <strong>Georgia</strong> seem to have reached a leveling-<strong>of</strong>f period, •<br />
wherein they must be involuntarily content with existing markets and exist<br />
ing products.<br />
Of course, the present mineral industries <strong>of</strong> this state can continue<br />
to survive and, perhaps, grow very slowly. But it is doubtful that such<br />
industries can reach maximum production under those same conditions. The<br />
attainment <strong>of</strong> such a realization can Be made only if these industries as<br />
sume an active role in the planning <strong>of</strong> their future courses. The prime<br />
requisite for this purpose is a plan <strong>of</strong> active and fundamental research<br />
which will evaluate and integrate the complex proolem <strong>of</strong> the mineral indus<br />
tries in the South.<br />
Research Methods; Research may be classified into two main division*:<br />
first, fundamental research, and second, technologic research. It is ob<br />
viously impossiole to draw a line <strong>of</strong> distinction Between these two divi<br />
sions, for they overlap each other in many directions. -Technologic re<br />
search deals with modifying, improving or designing a process, usually to<br />
relieve soae immediate pressing proolem <strong>of</strong> a partioualr industry. For elample,<br />
an investigation for the recovery <strong>of</strong> iron in an iron ore washing<br />
process is technologic research. Fundamental research, on the other hand,<br />
is an investigation which seeks basic principles which affect the broader<br />
and longer term problems <strong>of</strong> industries. Examples <strong>of</strong> this might Be the de<br />
termination <strong>of</strong> properties <strong>of</strong> a given material, as a means <strong>of</strong> finding nor<br />
uses, or it could be an investigation <strong>of</strong> potential reserves in the light <strong>of</strong><br />
allied materials.<br />
As the nane implies, fundamental research is the foundation upon which<br />
industrial progress can be ouilt. For this reason, such investigations<br />
should oe relatively unrestricted because their ultimate goal is unknown.<br />
That is not to say, however, there should be no direction <strong>of</strong> effort or def<br />
inition <strong>of</strong> purpose, but it is to be urjed strongly that the course <strong>of</strong> in-<br />
—64—
vestigation be unhampered by any restrictive and selfish in<br />
terests. Fundamental research, in other words, must not be sub<br />
ject to the exigencies <strong>of</strong> the moment except ins<strong>of</strong>ar as they may<br />
have some definite bearing on the problems at hand. Sut *<br />
State ....<br />
Eagumriaf<br />
Grorgi'0<br />
TKh<br />
Indutrul . .<br />
. . Economic<br />
Rocarch . .<br />
The geologic research proposed herewith is, basically, fun<br />
damental in scope. It must include, however, because <strong>of</strong> this<br />
fact, a detailed examination <strong>of</strong> the economic values involved in<br />
the mineral resources <strong>of</strong> <strong>Georgia</strong> and their relation to those <strong>of</strong> the United<br />
States and the world as a whole. The proposed investigation should also be<br />
so constituted as to form a broad and stable foundation for suosequent min<br />
eral investigation and industrial mineral application. The attempt to ful<br />
fill the accomplishment <strong>of</strong> these purposes is an ambitious one out not over<br />
ly so.<br />
What Is Required: A first requirement for all mineral industries is<br />
to know how~and where minerals occur. A second most important item is how<br />
such <strong>of</strong> the mineral there may be at a given locality. These questions <strong>of</strong><br />
mode <strong>of</strong> occurrence, location <strong>of</strong> deppsits, and available reserves must al<br />
ways be answered satisfactorily before any consideration may be given the<br />
question <strong>of</strong> industrial application. It is obvious that prospecting must<br />
precede mining, but methods <strong>of</strong> approach to the question <strong>of</strong> prospecting are<br />
not so oovious when such work must yield information necessary for the deteraination<br />
<strong>of</strong> the types and occurrences <strong>of</strong> the various minerals as well as<br />
the tonnage reserves <strong>of</strong> that material in any given deposit.<br />
Prospecting procedures in the past over the entire Berth <strong>Georgia</strong> rejioa<br />
have, in general, followed the line <strong>of</strong> least resistance. That is to<br />
say, there has been no concerted and directed effort toward the finding <strong>of</strong><br />
new deposits. There .has been, on the other hand, an enormous expenditure<br />
<strong>of</strong> time and laoor by individuals and concerns having littis regard for any<br />
integration <strong>of</strong> research knowledge. With few exceptions, prospecting has<br />
oeen pefforaed in a very haphazard manner, especially when seeking new de<br />
posits. This has not necessarily been so in extension <strong>of</strong> known deposits<br />
but it has been true <strong>of</strong> the unknown deposits because <strong>of</strong> a lack <strong>of</strong> knowledge<br />
<strong>of</strong> the conditions and environment <strong>of</strong> ore formations in this region. There<br />
have been numerous investigations <strong>of</strong> the various ore minerals and rocks in<br />
<strong>Georgia</strong>, but these hive seldom oeen conducted on lines which are conducive<br />
to a firm understanding <strong>of</strong> the basic principles <strong>of</strong> ora deposits in these<br />
specific localities. There has been too little attention paid to correla<br />
tive causes and effects, just as there has been too little attention paid<br />
to modification <strong>of</strong> ore deposits in this area oy climate, and weather, vege<br />
tation, and lithologic environment. Each <strong>of</strong> these factors modifies, al<br />
though not to the same degree, all mineral and ore deposits. At present,<br />
«» know little <strong>of</strong> their effects on such deposits in <strong>Georgia</strong>. As a matter<br />
<strong>of</strong> fact, our knowledge <strong>of</strong> the conditions <strong>of</strong> the formation <strong>of</strong> such deposits<br />
is very limited because we know very few <strong>of</strong> the locations <strong>of</strong> deposits. De-<br />
Sailed petrologic and strfttigraphic studies <strong>of</strong> the minerals and rocks <strong>of</strong><br />
this region are very few in number.<br />
In the light <strong>of</strong> more recently developed geologic theory and tech<br />
niques, only the partial quadrangle under way in the Cartersville Section,<br />
the Stone Mountain quadrangle, and the Harm Springs quadrangle are suffi<br />
ciently recent and in sufficient detail and on large enough scale to permit<br />
the accurate correlation which is needed.<br />
Two <strong>of</strong> the three quadrangles mentioned, however, have already produced<br />
tangible results. There has been an increased production <strong>of</strong> barite and<br />
*aganese at Cartersville, directly traceable to the work now in progress<br />
—65—
on the Cartersville sub-quadrangle, -while the Stone Mountain<br />
quadrangle, completed in 1939, disclosed data about the granite<br />
which resulted in considerable aid to a thriving industry pro<br />
cessing granite for chicken grit. The Warm Springs quadrangle<br />
was napped primarily to determine lasic information about the<br />
springs for the Warn Springs Foundation.<br />
Part <strong>of</strong> the State-wide Program; Th.e program <strong>of</strong> geologic<br />
mapping Being proposed here for the Northeast <strong>Georgia</strong> Area is a part <strong>of</strong> a<br />
broader proposal embracing the research <strong>of</strong> this character needed all over<br />
the state. The general plan is this: The areas which appear, on the basis<br />
<strong>of</strong> present knowledge and operation, to De the more important would oe done<br />
first, so that they could serve as nuclei around which additional areas<br />
would be studied in the probaole order <strong>of</strong> their importance.<br />
A general examination <strong>of</strong> the existing maps and information suggests<br />
that eight quadrangles on the eastern side <strong>of</strong> the Area are <strong>of</strong> major impor<br />
tance, while two additional ones on the west should ultimately be included.<br />
These ten quadrangles include parts <strong>of</strong> Forsyth, Dawson, Lumpkin, Banks, anil<br />
Madison counties and all <strong>of</strong> Rabun, Habersham, Stephens, Franklin, Sort, and<br />
White counties.<br />
Basic Study Needed; It is not until we have examined a region thor<br />
oughly and in great detail that we are able to arrive at logical conclu<br />
sions concerning it. The state <strong>of</strong> affairs in the region at present is<br />
chiefly one <strong>of</strong> speculation. The large majority <strong>of</strong> mining activities in the<br />
Northeast <strong>Georgia</strong> Area are based not on factual evidence out upon fortui<br />
tous discoveries. How many good minerals deposits have been overlooked by<br />
this latter projsss cannot be estimated. On the other hand, there is no<br />
guarantee that a detailed investigation such as proposed would be produc<br />
tive <strong>of</strong> additional deposits other than those already known. Such a process<br />
<strong>of</strong> investigation would only permit a more careful and exact evaluation <strong>of</strong><br />
the potential mineral reserves <strong>of</strong> the Area.<br />
Physiography<br />
The Geology <strong>of</strong> the Northeast <strong>Georgia</strong> Area<br />
The Northeast <strong>Georgia</strong> Area occupies portions <strong>of</strong> two main physiographic<br />
provinces; namely, the Piedmont and the Blue Ridge provinces. The Piedmont<br />
province, scrutinies erroneously referred to as the Piedmont plateau, is<br />
characterized by gently to moderately rolling topography in which the ridge<br />
summits and hilltops are generally coincident. The uniformity.<strong>of</strong> the up<br />
land level is broken only by occasional monadnooks2 which stand prominently<br />
aoove the surrounding terrain as isolated hills or mountains. Stream val<br />
leys are commonly rather sharply incised below the upland level so that<br />
gorges are characteristic <strong>of</strong> many <strong>of</strong> the major streams which flow out <strong>of</strong><br />
the Area.<br />
Detailed analyses <strong>of</strong> the topography <strong>of</strong> the region have shown that it<br />
nay be divided into two major divisionss first, on the south, Midland<br />
<strong>Georgia</strong>; and second, on the north, Piedmont <strong>Georgia</strong>. The majority <strong>of</strong> the<br />
Northeast <strong>Georgia</strong> Area lies within the latter section. The southern boun<br />
dary <strong>of</strong> Piedmont <strong>Georgia</strong> extends roughly southwestward from a point Begin<br />
ning on the Savannah River just northeast <strong>of</strong> Toccoa, on a line southwestward<br />
toward Cornelia, then south, <strong>of</strong> Gainesville. and continues southwest-<br />
TJonadnocks A hill <strong>of</strong> resistant rock standing in the midst <strong>of</strong> a<br />
plenaplane.<br />
—66--
mrd toward the Alabama-<strong>Georgia</strong> line. This boundary is an arbi<br />
trary one based primarily on ft rough approximation <strong>of</strong> a given<br />
altitude. In general, north <strong>of</strong> the boundary, elevations range<br />
from about 1400 feet at the south to around 1800 feet at the<br />
north. South <strong>of</strong> this line, elevations are 200 to 300 feet lower<br />
fro subdivisions <strong>of</strong> Piedmont <strong>Georgia</strong> which are important to the<br />
Area as a whole, are, first, the Dahlonega plateau,and second,<br />
the Atlanta Plateau.<br />
The Dahlonega Plateau, typically developed around Dahlonega in Lumpkln<br />
county, extends northeastward to the Savannah River, but forms a small<br />
curved-segment south <strong>of</strong> the city <strong>of</strong> Cornelia where its southern boundary<br />
coincides with the southern boundary <strong>of</strong> Piedmont <strong>Georgia</strong>. Its northern<br />
boundary is the contact between the plateau and the Blue Ridge province or<br />
the Highland section. The Dahlonega Plateau might be termed the only truly<br />
Piedmont section <strong>of</strong> the entire region, because <strong>of</strong> its position at the base<br />
<strong>of</strong> the Highlands. From a width <strong>of</strong> more than twenty miles in western Gilmer<br />
md Piokens counties, it narrows to but only a few miles in western Dawson<br />
county.<br />
Characteristically, the Dahlonega Plateau is a maturely dissected<br />
platform in which the general level <strong>of</strong> the hilltops varies from 1600 to<br />
1800 feet above sea level. It stands, therefore, several hundred feet<br />
higher than the Atlanta Plateau, lying to the southwest, whose surface<br />
ranges from 1000 to 1300 feet in elevation. An abrupt, irregular escarpmeat<br />
about 500 feet high, situated northeast <strong>of</strong> Alto, prominently marks the<br />
contact between the higher Dahlonega Plateau and the lower Midland slope<br />
division <strong>of</strong> Midland <strong>Georgia</strong>.<br />
As has been stated monadnocks are characteristic <strong>of</strong> the Piedmont prov<br />
ince. This is particularly so <strong>of</strong> the Dahlonega plateau in which many prom<br />
inent nobs are known and recognized. Among these arei Yonah, Mount Pint,<br />
•nd Ifoont Walker. Elsewhere, Talona Mountain, Crown Mountain, Sharp Moun<br />
tain, Sal, Pine, Skitt, and Lynch Mountains are among the most conspicuous<br />
features <strong>of</strong> northern <strong>Georgia</strong>. These prominances exist in striking contrast<br />
to the broad, level bottom and fertile valleys <strong>of</strong> the Sautee and Nacoochee<br />
Hivers.<br />
The greater part <strong>of</strong> the Dahlonega plateau is drained by the Chattahoochee<br />
Elver, either directly or through Chestatee, Soque, and Sautee Rivers.<br />
The eastern portion is drained by short streams flowing to the Tugaloo, and<br />
the western is in the basin <strong>of</strong> the Coosawattee River. That part <strong>of</strong> the<br />
plateau lying in the Area in Dawson, and western Lumpkin counties, is<br />
drained by the Etowah River and its tributaries.<br />
The Atlanta Plateau, second <strong>of</strong> the major divisions <strong>of</strong> the Piedmont<br />
province in the Gaiuesville Area, occupies an important position in this<br />
region. The city <strong>of</strong> Gainesville is situated in the northeastern portion <strong>of</strong><br />
the Atlanta Plateau, and the immediate region in the vicinity <strong>of</strong> that city<br />
has been given the name <strong>of</strong> the Gainesville platform. ' This platform is a<br />
distinct subdivision <strong>of</strong> the Atlanta Plateau, being separated from it by<br />
lome 250 feet. There is no sharp escarpment between the Gainesville plat<br />
form and the lower platform, called the Fairburn, but there are broad<br />
slopes which merge the two areas gently. The average altitude <strong>of</strong> the<br />
Gainesville platform, is about 1300 feet above sea level. That <strong>of</strong> the Eairtura<br />
platform averages about 1000 feet. The stream pattern <strong>of</strong> the Gaines<br />
ville area is in general <strong>of</strong> a branch-like pattern, called dendritic. The<br />
>«jor trunk streams, however, fall into two different categoriesj one, the<br />
Chattahoochee., is a subsequent stream; and the second, the Tugaloo, is a<br />
—67--
transverse stream. Secondary and tertiary trioutaries <strong>of</strong> these<br />
trunk streams have developed the characteristic dendritic pat<br />
tern which clsarly marks the grain <strong>of</strong> the country and which has<br />
fundamentally deternined the position and course <strong>of</strong> the major<br />
trunk rivers.<br />
Areal Geology<br />
Statt....<br />
Enparrthf<br />
Evprrinat<br />
Station . . .<br />
Groroti<br />
r«*<br />
Indunul. .<br />
. . EconOHk<br />
Rnni.-b . .<br />
Bed rock in the Gainesville area is comprised basically <strong>of</strong> igneous and<br />
metamorphic rocks <strong>of</strong> very great age, but there are minor amounts <strong>of</strong> consol<br />
idated sands, clays, and gravels which are formed into thin, discontinuous,<br />
veneer-like deposits lying upon the older rocks. Vast lengths and inconprehensiole<br />
numbers <strong>of</strong> years separate the two groups <strong>of</strong> deposits, since the<br />
crystalline rocks are among the oldest known in the world, while the super<br />
ficial deposits are almost recent in age. Both groups <strong>of</strong> rocks <strong>of</strong>fer op<br />
portunities for commercial developnent <strong>of</strong> mineral resources, but it is<br />
likely that the crystalline rocks, being <strong>of</strong> wider spread area, will <strong>of</strong>fer<br />
greater opportunity on that account.<br />
The crystalline rocks <strong>of</strong> the Gainesville area possess characteristics<br />
which are conaon to rocks <strong>of</strong> the Piedmont all along the Atlantic Coast.<br />
They are, however, sufficiently different from those <strong>of</strong> other areas to rarrant<br />
the application <strong>of</strong> distinct names which indicate to the geologist the<br />
inexact equivalency <strong>of</strong> these formations with those elsewhere. As a matter<br />
<strong>of</strong> fact, though, the names applied to the oldest rocks known in this region<br />
have seen derived out <strong>of</strong> the state, for in one case we speak <strong>of</strong> the Roan<br />
gneiss and in another <strong>of</strong> the Carolina schist or the Carolina gneiss. Or m<br />
nay speak <strong>of</strong> the Brevard schist, or the Murphy marble. On the other hand,<br />
we may speak <strong>of</strong> the Stone Mountain granite or the Elberton granite, names<br />
which have oeen derived from localities within the state <strong>of</strong> <strong>Georgia</strong>.<br />
The Carolina gneiss is Dy far the most extensive and the most wide<br />
spread <strong>of</strong> all the crystalline rocks in the Gainesville region. It consists<br />
<strong>of</strong> a highly complax series <strong>of</strong> gneisses and schists which were at one tins<br />
sediments and igneous bodies, • ooth intrusive and extrusive. Now, however,<br />
these original rocks have been altered to their present form Dy several<br />
periods <strong>of</strong> metamorphism as well as to alterations Dy younger injections <strong>of</strong><br />
igneous rocks in later periods <strong>of</strong> g'eol<strong>of</strong>ic time.. The folding and faulting<br />
which the Carolina gneiss has undergone has caused these rocks to be great<br />
ly compacted, which ultimately resulted in the development <strong>of</strong> regional<br />
schistosity.<br />
The Kortheast <strong>Georgia</strong> Area is noteworthy for its geologic complexity.<br />
The regional schistosity noted aoove in the Carolina series is the usual<br />
result frosi preat dynamic earth forces which have caused folding and fault<br />
ing to occur on an unprecedented scale. Such schistosity results from the<br />
reorientation <strong>of</strong> component mineral grains within the various rocks at a<br />
right-angled direction to the direction <strong>of</strong> major thrust. Obviously, close<br />
folding would oe ouite common and faulting would, therefore, be a necessary<br />
supplement. These two processes induced a linear arrangement <strong>of</strong> outcrop<br />
bands which is now so common in this Area. These bands trend northeast and<br />
southwest, but they,too, .are modified in detail and locally by subsequent<br />
periods <strong>of</strong> folding and faulting, thus causing a systematic arrangement<br />
which, up to date, has virtually defied all out the most generalized type<br />
<strong>of</strong> interpretation or, conversely, an extremely limited and restricted lo<br />
cality analysis. That is, we are anle in a oroad way to define general<br />
trends and, at the same time, we have Deen aole in some instances to de<br />
termine the geologic settings for mines and for areas which have very<br />
limited extent.<br />
—53—
There are three good reasons why more detailed information<br />
on geology <strong>of</strong> Northeast <strong>Georgia</strong> is not available. First, the<br />
rocks <strong>of</strong> the Area are so old and have undergone such great<br />
nrtamorphosis that it is almost impossible to decipher their<br />
origin. Second, these rocks have been suojected to such enor-<br />
BOUS amounts <strong>of</strong> weather and erosion that their fresh characters<br />
ere exceedingly difficult to find. Third, dependable correla<br />
tions are impossible to make Because <strong>of</strong> the lack <strong>of</strong> fossils as<br />
well as a lack <strong>of</strong> continuity <strong>of</strong> outcrops. It has, therefore, been possible<br />
to correlate the formations in <strong>Georgia</strong> with those <strong>of</strong> other areas only in a<br />
nost generalized fashion; determinations <strong>of</strong> equivalences within even<br />
limited sections within the Area are not particularly dependaole. Descrip<br />
tions <strong>of</strong> "formations 11 for this Area must consequently, always be Judged in<br />
the light <strong>of</strong> their inexact correlation. It might be more proper to speak<br />
<strong>of</strong> correlation <strong>of</strong> zones rather than formations.<br />
Rocks <strong>of</strong> Northeast <strong>Georgia</strong><br />
The rocks <strong>of</strong> the Northeast <strong>Georgia</strong> Area consist primarily <strong>of</strong> granite,<br />
gneisses, 3 schists,* phyllites,6 low-grade marble, slate, and various vein<br />
naterials. Many <strong>of</strong> these substances are valuable coranercially, but many <strong>of</strong><br />
them have no material application in industry at present.<br />
ir&nites and Gneisses<br />
Granites: There are two major types <strong>of</strong> granite In the Area under discussi'oni<br />
(1) Granular, (2) Forphyritic. The granular granites are those<br />
which are completely crystalline throughout, with the size <strong>of</strong> the indivi<br />
dual component crystals essentially equal. As a result, the rock acquires<br />
« grainy appearance and is oest descrioed as "granular." The porphyritic<br />
granites, on the other hand, are special phases <strong>of</strong> the granular type; all<br />
gradations between the two kinds <strong>of</strong> rock may be noted in the field. The<br />
distinguishing character <strong>of</strong> the porphyritic type is the occurrence <strong>of</strong><br />
rather prominent and strikingly larger crystals or "eyes" <strong>of</strong> feldspar 7 in<br />
the finer "grained" matrix 8 <strong>of</strong> the ordinary granular type.<br />
The colors <strong>of</strong> the granites vary from light-gray to dark blue-gray,<br />
which, in places, may be further modified by the occurrence <strong>of</strong> a reddish<br />
feldspar which adds its color component to the total overall color.<br />
Utility <strong>of</strong> Granitesi One <strong>of</strong> the most important considerations in the<br />
determination <strong>of</strong> the utility <strong>of</strong> a granite deposit is the system and spacings<br />
<strong>of</strong> the joint and rift planes. These are actual fracture planes and<br />
"Gneiss: A metamorphie rock, <strong>of</strong>ten corresponding in composition to<br />
granite or some other feldspathic plutonic rock, but having its consti<br />
tuents, especially mica, arranged in planes .so that it splits rather easily<br />
into coarse slab.<br />
4 Schist: Any metamorphio crystalline rock having a closely foliated<br />
structure and hence admitting <strong>of</strong> division along approximately parallel<br />
plane s .<br />
E Phyllitei Argillaceous schist, intermediate between mica schist and<br />
slate.<br />
6 Porphyritici An igneous rock containing phonocrysts (scattered crys<br />
tals) obviously larger than the surrounding matrix*<br />
7 Feldspar: A mo.it important group <strong>of</strong> rock-forming silicates <strong>of</strong> alumi<br />
num, together with sodium, potassium, calcium, and barium.<br />
"Matrix: The earthy or stony suostance in which an ore or other ma<br />
terial is bedded: the gangue.<br />
--69--
potential fracture planes, respectively. In the former case,<br />
they usually are planes <strong>of</strong> breakage near the vertical; in the<br />
latter, the planes are more or less horizontally disposed. If<br />
the sets <strong>of</strong> joints are approximately at right angles to one an<br />
other so that incipient euoical Blocks are formed, then the<br />
granite is suitable for dressed or dimension stone quarrying.<br />
This is true, <strong>of</strong> course, only if the joints are spaced far<br />
enough apart to permit the removal <strong>of</strong> relatively large masses <strong>of</strong><br />
rock as a single block. It is clear, therefore, that many exposures <strong>of</strong><br />
granite will not conform to these specifications for the fracture planes,<br />
because, usually, the joints are too closely spaced and too irregularly ar<br />
ranged. Granite not possessing these features can <strong>of</strong>ten be used as a<br />
source <strong>of</strong> crushed stone or riprap.'<br />
Itineral Content <strong>of</strong> Granites; The homogeneity <strong>of</strong> the mineral content<br />
<strong>of</strong> the granites is worthy <strong>of</strong> considerable attention, for it has a direct<br />
bearing on the physical properties <strong>of</strong> the stone when finished. In general,<br />
the upper few feet <strong>of</strong> an exposure must be discarded, because <strong>of</strong> weathering<br />
alterations in the rock. Elsewhere within the deposit, the operator must<br />
always be on the watch for the inclusion <strong>of</strong> pegmatites10 or other more or<br />
less abnormal mineral occurrences such as veins, country rock inclusions,<br />
etc. Since these represent changes in the basic character <strong>of</strong> the quarryable<br />
stone, they will affect color, crushing strength, resistance to weatheritgj<br />
and the response to polishing operations. The inclusion <strong>of</strong> larger<br />
phenocrystsV' however, does not materially alter the type <strong>of</strong> rock, if their<br />
occurrence is uniform throughout the deposit. Porphyritic granite is quite<br />
suitaBle for some ouilding uses where contrast with the usual uniform qual<br />
ity <strong>of</strong> the ordinary stone is desirable.<br />
Uses <strong>of</strong> Granite; The largest part <strong>of</strong> the present granite production<br />
in the Southeast; now goes into the building-naterial industry in the fonn<br />
<strong>of</strong> dicension stone and concrete rock. Much <strong>of</strong> it is also used as a road<br />
base for macadamised roads.12 There seem, however, to be other fields <strong>of</strong> use<br />
for granite. For example, the fines from crushing can oe made into a quite<br />
good Duilding brick by the addition <strong>of</strong> cement. They can be used to replace<br />
feldspar in ceramic formulas. Sone attempt has also been made to use these<br />
same fines as a source <strong>of</strong> silica in the" manufacture <strong>of</strong> rook wool. The wide<br />
spread occurrence <strong>of</strong> pranite and the relative ease <strong>of</strong> its production should<br />
make it a desirable material for research. It is likely that such future<br />
work will show that the greatest advantage which this rock possesses is its<br />
density and hardness.<br />
An investigation <strong>of</strong> the granites and gneisses by Thomas L. Tfatson, re<br />
ported in Bulletin 9-A <strong>of</strong> the <strong>Georgia</strong> Geological Survey in 1902, does not<br />
list any granite or gneiss in the Northeast <strong>Georgia</strong> Area. However, this is<br />
a mistake, because granite and gneisses are now known to occur in the Area<br />
Riprap: A foundation formed in water, or on a Bed <strong>of</strong> s<strong>of</strong>t material,<br />
by depositing broken stones loosely. Hence, the material used for such a<br />
bed.<br />
10 Pegmatite: A term originally applied to granitic rocks characterized<br />
by intergrowths <strong>of</strong> feldspar and quartz, as in graphic granite; now applied<br />
to igneous rocks <strong>of</strong> any composition but <strong>of</strong> particularly coarse grain, oc<br />
curring as <strong>of</strong>fshoots fron, or veins in, larger intrusive rock bodies, rep<br />
resenting a flux-rich residuum <strong>of</strong> the original magma.<br />
"phenocrysts: Large crystal, visible to the naked eye, usually <strong>of</strong><br />
perfect crystalline shape found in a fine-grained matrix in igneous roots.<br />
12 liacadaniised road: A road whose surface is formed with broken stones<br />
<strong>of</strong> fairly uniform size rolled into a 6-10 inch layer, gravel in interstices.<br />
--70--
under consideration. A prominent belt <strong>of</strong> granite gneiss is<br />
known to ooour in southeastern Lunpkin county and through the<br />
central section <strong>of</strong> White county. It is considered likely that<br />
the granite gneiss <strong>of</strong> the Delt just described will not fie par<br />
ticularly suitable for building stone, although it prooably<br />
could be utilized to some extent as crushed stone, liany other<br />
types <strong>of</strong> rock occur in the Northeast <strong>Georgia</strong> Area which can oe<br />
used for crushed or ruoole stone. Much <strong>of</strong> this rock has been<br />
Eip
J<br />
dual sold, better known as saprolitic1 * gold; and three, placer<br />
gold or transported gold. All three types <strong>of</strong> occurrences have<br />
been productive in the past. Today, however, value <strong>of</strong> gold pro<br />
duction is relatively negligible when considered in relation to<br />
the value <strong>of</strong> the total mineral production <strong>of</strong> the state <strong>of</strong><br />
<strong>Georgia</strong>.<br />
The thorough and careful investigation to which the gold ___<br />
deposits have Been subjected in Northeast <strong>Georgia</strong> indicates that the major<br />
portioc <strong>of</strong>. the gol*2 deposits in this Area have been discovered. If this IB<br />
so, then there is little opportunity for any great future development <strong>of</strong><br />
gold deposits in this region. Without douot, some gold still exists and IB<br />
some cases pr<strong>of</strong>it can be made in mining it. However, the chances <strong>of</strong> loss<br />
are greater and the probability <strong>of</strong> final pr<strong>of</strong>it less for gold mining than<br />
for alnost any other industrial activity possible in the Area.<br />
Saprolitic: Disintegrated ore, usually more or less decomposed which<br />
lies in its original place.<br />
--72—
Refractories Sutc ....<br />
Engineering<br />
The possibility <strong>of</strong> several high duty refractory industries<br />
in the Northeast <strong>Georgia</strong> Area is indicated in a preliminary<br />
report by the <strong>Georgia</strong> Department <strong>of</strong> Vines, Mining and Geology<br />
on recently discovered deposits <strong>of</strong> sillimanite in Hart and Mad<br />
ison counties (and adjoining Elbert), and other deposits <strong>of</strong> mas<br />
sive kyanite in Towns county (and Clay county. North Carolina)<br />
Experiment<br />
Station . . .<br />
Gtorgia<br />
TKh<br />
Indnttiul . .<br />
. . Economic<br />
Retearcb . .<br />
and in Dawson county (and adjoining Cherokee, Pickens, and Gilmer counties),<br />
The general locations <strong>of</strong> these deposits are shown in Map JJ-I.<br />
Both sillimanite and massive kyanite are employed in the manufacture<br />
<strong>of</strong> refractories for use where temperatures above 1600° C. are encountered,<br />
in processes where rapid temperature changes occur, they are particularly<br />
valuable*<br />
The sillimanite deposits recently discovered in Hart and Madison<br />
counties appear to <strong>of</strong>fer the greater potentiality in the Area. The ulti-<br />
«te production <strong>of</strong> spark plugs, electronic insulators, special chemical<br />
porcelain, or super-duty refractories appears logical if further technical<br />
research justifies the preliminary conclusions drawn by A. S. Furcron, As<br />
sistant State Geologist, and K. H. league, TVA geologist.1<br />
The manufacture <strong>of</strong> super-duty refractories for the glass and metallur<br />
gical industries will lead to the largest tonnage use <strong>of</strong> the apparently<br />
large deposits <strong>of</strong> sillimanite described in subsequent paragraphs.<br />
The manufacture <strong>of</strong> spajrlc plugs, electronic and chemical porcelain may<br />
prove more attractive, because <strong>of</strong> the probably higher value added and rela<br />
tively smaller proportion <strong>of</strong> total costs represented by firing. These in<br />
dustries, however, will<br />
Map M-I<br />
The Location <strong>of</strong> Sllliiiatiite and Massive Kya<br />
Deposits' in the Northeast <strong>Georgia</strong> Area<br />
FANNIN 'CA -<br />
I - Ma-t. r/Ofrt, Mttf Mmdilon<br />
. Counties-liltintonitt from<br />
* •<br />
'aunty, Grorg/*, +nd<br />
Cl*y County, North Cirelin*<br />
~sil!immnitc »rcm<br />
J - Ctvrottff. pictttna, Gitmtr,<br />
fnd Dfttaon Counties -<br />
mifttrr Jkyfnite trfs<br />
Prepared by TVA<br />
—73—<br />
use only small tonnage<br />
<strong>of</strong> sillimanite, but will'<br />
require much skilled la<br />
bor. Establishment <strong>of</strong><br />
the spark plug indus<br />
tries will depend on the<br />
market resulting from<br />
the automotive develop<br />
ments in Atlanta.<br />
The probable use<br />
for the Dawson and Towns<br />
county deposits <strong>of</strong><br />
massive kyanite would be<br />
for super-duty refrac<br />
tories. They do not ap<br />
pear to be as promising,<br />
and, at present, a kya<br />
nite mining operation<br />
appears more probable<br />
than in situ manufacture.<br />
1 Sillimanite and<br />
Massive Kyanite in~<strong>Georgia</strong><br />
(A Preliminary Re<br />
port) ; <strong>Georgia</strong> Department<br />
<strong>of</strong> Mines, Mining, and Goology,<br />
Bul. 51, 1945.
J<br />
The extent <strong>of</strong> the sillimanite deposits is such that, if the<br />
characteristics indicated by the preliminary report are verified,<br />
the eventual result nay well be a large concentration <strong>of</strong> the<br />
high alumina refractory industry in <strong>Georgia</strong>, possibly even one<br />
for all refractories. The location <strong>of</strong> the refractory industries<br />
is governed to a much greater extent by raw materials than by<br />
markets. -7<br />
State ....<br />
E<strong>of</strong>jx.ni<br />
Exptnmmt<br />
Sutioa . . .<br />
Ttcft<br />
buhuntt..<br />
.<br />
Roarcb . .<br />
Tte large industrial markets for refractories are found in the steel<br />
and the glass centers in a belt extending from Hew York to Chicago. Pro<br />
duction is much more widely scattered, as is shown in Table 11-59. Tlhile<br />
there were three clay refractory<br />
Table M-59 plants ' reported . - for - <strong>Georgia</strong> -<br />
in<br />
1939, detailed figures are omitted<br />
by the census to avoid disclosure<br />
<strong>of</strong> figures for one very large<br />
plant. It should be noted that<br />
Missouri, the second state in to<br />
Value <strong>of</strong> Product tal volume <strong>of</strong> production, has the<br />
highest average value per plant,<br />
<strong>of</strong><br />
Per reflecting the presence in Mis<br />
Plants Total Plant souri <strong>of</strong> several very large and<br />
aggressive manufacturers who con<br />
48 »12, 340,613 $257,096 trol extensive deposits <strong>of</strong> dia-<br />
14 9,554,375 655,375 spore. Only Missouri, Kentucky,<br />
33 5,742,612 174,018 and Pennsylvania had per plant<br />
11887 3,915,092 355,917 averages in 1939 above the United<br />
1,541,033 162,629 States average <strong>of</strong> $255,710. In<br />
1,368,077 183,509 each <strong>of</strong> these three states, there<br />
1,322.544 186,077 are two or more plants with sales<br />
135 42,191,454 255,710 <strong>of</strong> more than a million dollars, ao<br />
that it is obvious that somewhat<br />
more than two thirds <strong>of</strong> the 165<br />
plants in the United States are<br />
very small. Altogether, there<br />
were refractory plants in the fol<br />
lowing states in 1939j Pennsyl<br />
Summary for States with Value <strong>of</strong> Product<br />
Over >1 Million in Clay Refractory<br />
Industry, 1939<br />
State<br />
Fennsylvanii<br />
Missouri<br />
Ohio<br />
Kentucky<br />
California<br />
Hew Jersey<br />
Illinois<br />
U. S.<br />
Source: U. 3. Census, Manufac<br />
tures, 1939, Structural Clay Products,<br />
Clay Refractories, Including Refractory<br />
Cement Clay, Table Z.<br />
vania, 48; Ohio, 33; Missouri, 14; Kentucky, 11; California, 8; Hew Jersey,<br />
8; Illinois, 7; Colorado, 4; Alabama, 4; West Virginia, 4; <strong>Georgia</strong>, 3; In<br />
diana, 3; Maryland,-3; Connecticut, 2; New York, 2; South Carolina, 2;<br />
Texas, 2; Washington, 2; Idaho, 1; Massachusetts, 1; Michigan, 1; Nevada,<br />
1; Wisconsin, 1.<br />
TThile these plants are generally adjacent to a fire clay deposit <strong>of</strong><br />
some type, only in California, Nevada, and <strong>Georgia</strong> were plants located In<br />
the same states with deposits <strong>of</strong> either kyanite or andalusite which were<br />
regarded as the superior material for high alumina refractories until the<br />
discovery in <strong>Georgia</strong> <strong>of</strong> sillimanite. For a good many years, a large plant<br />
in Missouri has been mining kyanite in the Rabun-Habersham section.<br />
Hot too much can be derived from a study <strong>of</strong> the census figures, since<br />
the industry includes two broad types <strong>of</strong> production— ordinary fire brick<br />
and other items <strong>of</strong> a similar grade, and high alumina refractories. The<br />
high alumina group may again be divided'into regular and super-duty. Sons<br />
plants nay produce all three types; others, only one; and the differences<br />
<strong>of</strong> relationship which appear in Table M-60 may either reflect these nonoomparable<br />
factors or they may indicate basic advantages which will usually<br />
grow out <strong>of</strong> available raw materials or the availability <strong>of</strong> low cost fuel.<br />
Table M-60 shows for 1939 the highest Margin value «175) for Missouri,<br />
—74—
.<br />
lith the second highest ($138) for "other states" which includes<br />
<strong>Georgia</strong>- Pennsylvania has a Margin value <strong>of</strong> only $84 par $100<br />
<strong>of</strong> Wages and Salaries. Obviously, there is nothing conclusive<br />
.here because <strong>of</strong> the wide range <strong>of</strong> products included, but there<br />
it an indication that the processing <strong>of</strong> refractories in <strong>Georgia</strong><br />
froB sillimanite would vary likely result in a Margin which was<br />
definitely higher than the United States average for 1939 <strong>of</strong><br />
|105, shown in Table H-60.<br />
Experi<br />
Station . .<br />
Txh<br />
ludufrijl . .<br />
. . Ecotwtajc<br />
Rocarch . .<br />
The production <strong>of</strong> the 48 plants in Pennsylvania is predominately <strong>of</strong><br />
the "fire brick" type. Of the total value <strong>of</strong> $12.3 million produced in<br />
1939, |8.5 million was <strong>of</strong> the fire brick type, or about one-third <strong>of</strong> the<br />
national production. Missouri, on the other hand, produced only $5.2 mil<br />
lion out <strong>of</strong> a total <strong>of</strong> |9.5 million, or only slightly over & fifth <strong>of</strong> the<br />
national total <strong>of</strong> $25.2 million, While it has been necessary for the cen<br />
sus to combine states in presenting most <strong>of</strong> the production data on high<br />
alumina, there are indications that present production is concentrated in<br />
Missouri, Pennsylvania, and Ohio; Since Pennsylvania is probably the lar<br />
gest market for high quality refractories and Missouri a relatively small<br />
narket, it is fairly obvious that the quality <strong>of</strong> the product and the skill<br />
<strong>of</strong> the management are probably the controlling factors. All <strong>of</strong> this leads<br />
to the final conclusion that in the event the <strong>Georgia</strong> sillimanite is proved<br />
to possess the qualities indicated by the preliminary work, good management<br />
will be attracted to it.<br />
Preliminary estimates seem to indicate that a mining operation pro<br />
ducing a minimum <strong>of</strong> fifty tons <strong>of</strong> sillimanite a day should be able to price<br />
the ore at about $20 a ton. Since kyanite must be calcined, this price for<br />
sillimanite is likely to be in the order <strong>of</strong> one-third less than calcined<br />
kyinite— a raw material <strong>of</strong> better quality for a lower price. In making<br />
refractories, from ten to twenty per cent <strong>of</strong> fine f rained kaolin is added<br />
to increase plasticity. This, <strong>of</strong> course, is available elsewhere in <strong>Georgia</strong>.<br />
In the manufacture <strong>of</strong> refractories, the fuel requirements are hif-h.<br />
In 1939 the cost <strong>of</strong> fuel was 8.79 per cent <strong>of</strong> the total Value <strong>of</strong> Product,<br />
ihile in Missouri the fuel cost was 8.39 per cent. This seems to indicate<br />
that the firing costs for higher quality refractories are a smaller per<br />
cent <strong>of</strong> Value <strong>of</strong> Product; but considerably higher per ton. The problem <strong>of</strong><br />
plant location in <strong>Georgia</strong> is apt to be determined by the cost <strong>of</strong> fuel. Hefractory<br />
plants <strong>of</strong> the sort suggested may be located in the Northeast Geor<br />
gia Area at Hartwell near the northern end <strong>of</strong> the sillinanite belt, or<br />
along the Southern railroad between Comer and Oarlton in Madison county,<br />
provided the cost <strong>of</strong> fuel does not prove to be excessive. Pr<strong>of</strong>itable min<br />
ing operations are to be expected in any event.<br />
Uses <strong>of</strong> SilHmftnitei Purcron and league point out that sillimanite<br />
has a processing advantage over kyanite for super-duty refractories since<br />
"unlike kyanite it is not necessary to calcine it before use." Refractory<br />
brick and shapes made from acid-washed sillimanite may find service in<br />
[lass tanks and lehrs. Sigh temperature cements containing sillimanito can<br />
probably be worked out. Finely ground sillimanite should prove a valuable<br />
Ingredient in electrical insulators and chemical porcelain. The produc<br />
tion <strong>of</strong> sillimanite enamels for insulation <strong>of</strong> jet-propulsion exhausts<br />
•lould also be considered.<br />
The data discussed by Furcron and league is preliminary. Additional<br />
rtudles designed to develop technical data on apalling and behavior at<br />
*arious temperatures are underway at the TVA laboratory at Horris, Tennes-<br />
>aa.<br />
—75—
More Rasearch Heeded; "The brick that have been made In<br />
the pas- have been fired at 1475° 0. and 1600° 0." Furcron and<br />
league point out, "It is lifcely that the firing temperature<br />
nay be decreased without .ietriasnt to the excellent temperature<br />
resistance shown. This would appear logical .because <strong>of</strong> the<br />
constancy <strong>of</strong> volume <strong>of</strong> the sillimiite.<br />
"Rafractories made fron acid-washed silllaanite are being<br />
tested in glass tanks under service conditions. Further studies are neces<br />
sary to complete the removal <strong>of</strong> iron-containing compounds for all white<br />
products. An investigation <strong>of</strong> the use <strong>of</strong> sillimaite in all types <strong>of</strong> spe<br />
cial ceraoics and refractories, including electrical and chemical porce<br />
lains, is planned."<br />
Uses <strong>of</strong> Kyanite; The uses <strong>of</strong> iyanite are described by the same<br />
authors thus: "Jiassive kyanite fron <strong>Georgia</strong> nay be used in the same gen<br />
eral type <strong>of</strong> refractories as the kyanite now imported from India. Refrac<br />
tories which use kyanite as the principal constituent are classified as<br />
high alumina refractories (approximately 60 per cent A^Oj). Refractories<br />
made from calcined massive kyanite have a low coefficient <strong>of</strong> expansion<br />
under service conditions, comparatively high malting points, and resis<br />
tance to loads at high temperatures, thermal shock, corrosive action <strong>of</strong><br />
certain fluxing agencies and furnace gases."<br />
JfcVay and Wilson2 give the more important uses <strong>of</strong> massive kyanite as<br />
"(l) linings for Ajax-wyatt induction and indirect arc furnaces for meltiag<br />
and refining brass and bronze containing more than 75 per cent <strong>of</strong>- copper<br />
and those metals that require higher temperatures than does yellow brass,<br />
(2) furnaces in which .silica brick can be used for continuous service but<br />
spall during intermittent operation, (3) oil-burner ports and blocks,<br />
(4) super-structure for glass tanks exclusive <strong>of</strong> the silica-brick crowns,<br />
including the forehearth and mechanical feeder parts for forming machines,<br />
and (5) heavily loaded kiln furniture for fast schedules in ceramic fir<br />
ing.'<br />
Discovery <strong>of</strong> Seorgia jjillimnite: In September, 1944, a belt <strong>of</strong> schist<br />
-ich in sillfimnite was discovered in Hart, Elbert, and Ifadison counties<br />
and described by Furcron and Teague. They prospected the better localities<br />
and sent samples to the U. 3. Bureau <strong>of</strong> Vines Southern Experiment Station<br />
at Tuscaloosa, Alabama, where a silliaianite concentrate was prepared.<br />
Types <strong>of</strong> Sillimanite; Five types <strong>of</strong> sillimanite deposits, all found<br />
in K°r^heas^~<strong>Georgia</strong>, are listed in their report:<br />
(1) Sillimanite crystals and bundles <strong>of</strong> crystals dissemi<br />
nated in schist which have been intruded and recrystallized by<br />
granite and pegratite. This type <strong>of</strong> deposit seems to <strong>of</strong>fer<br />
most promise for the conmercial production <strong>of</strong> sillimanite. De<br />
posits in South Carolina, (and) the belt described in this re<br />
port from. Hart, Elbert, and Ifadison counties, <strong>Georgia</strong> ...<br />
belong in this class.<br />
(2) Stringers and lenses <strong>of</strong> fibrolite, or fibrous silli<br />
manite and quartz in schist associated with intrusive pegma<br />
tite and granite; the stringers my or may not be crosscuttiug;<br />
also they may be sufficiently abundant to form zones <strong>of</strong> silli<br />
manite schist which generally parallel pegmatite.intrusions.<br />
2KeVay, T. H-, and Wilson, Hewitt, Substitution <strong>of</strong> Topaz, domestic<br />
Icyanite, and synthetic mullite-coruadum for India kyanite i Jour. Am. Cer.<br />
Soc., Vol. 26, Ho. S, August, 1943, pp. 68-71.<br />
— 76--
States<br />
United States<br />
Alabama<br />
California<br />
Colorado<br />
Illinois<br />
Indiana<br />
Kentucky<br />
Missouri<br />
Heir Jersey<br />
Ohio<br />
Pennsylvania<br />
Other States<br />
Wages<br />
and<br />
Salaries<br />
$14,118<br />
199<br />
431<br />
313<br />
392<br />
136<br />
1.574<br />
2,296<br />
412<br />
2,290<br />
4,623<br />
1,463<br />
Tab la It-SO<br />
Census Data on Refraotory Industries for the United States and by<br />
StatesTo'r 1939 InojCucllng ValueTTeT^lOO <strong>of</strong>~PayrolT<br />
Salaries<br />
$1,794<br />
28<br />
39<br />
42<br />
60<br />
30<br />
176<br />
366<br />
79<br />
269<br />
626<br />
191<br />
1939 Census<br />
(In thousands <strong>of</strong> dollars)<br />
Cost <strong>of</strong><br />
Materials<br />
$13,214<br />
268<br />
683<br />
314<br />
482<br />
124<br />
1,089<br />
3,224<br />
409<br />
1,698<br />
3,827<br />
1,196<br />
Value <strong>of</strong><br />
Products<br />
442,3.91<br />
661<br />
1,641<br />
898<br />
, 1,323<br />
201<br />
3,916<br />
9,564<br />
1,368<br />
5,743<br />
12,341<br />
4,657<br />
Value<br />
Added<br />
$28,978<br />
382<br />
968<br />
684<br />
841<br />
77<br />
2,826<br />
6,330<br />
959<br />
4,044<br />
8,614<br />
3,461<br />
Ifcrgin<br />
$14,860<br />
183.<br />
627<br />
271<br />
449<br />
-68<br />
1,252<br />
4,034<br />
547<br />
1,764<br />
3,891<br />
2,008<br />
Wages<br />
and<br />
Sal<br />
a<br />
ries<br />
$100<br />
100<br />
100<br />
100<br />
100<br />
100<br />
100<br />
100<br />
100<br />
100<br />
100<br />
100<br />
Value Per $100 <strong>of</strong> Payroll<br />
Wages and Salaries<br />
Sal<br />
aries<br />
$13<br />
14<br />
9<br />
IS<br />
15<br />
22<br />
11<br />
16<br />
19<br />
11<br />
11<br />
13<br />
Cost<br />
<strong>of</strong><br />
Mate<br />
rials<br />
$94<br />
'136<br />
135<br />
100<br />
123<br />
91<br />
69<br />
140<br />
99<br />
74<br />
83<br />
82<br />
Value<br />
<strong>of</strong><br />
Prod<br />
uct<br />
$299<br />
327<br />
358<br />
287<br />
338<br />
148<br />
249<br />
416<br />
332<br />
251<br />
267<br />
321<br />
Value<br />
Added<br />
Source; II. 3. Census, Ibnufaotures , 1939, Structural Clay Products, Clay Refractories, 'Including<br />
Refractory Cement Clay, Table 2.<br />
'Represents an operating loss.<br />
$205<br />
192<br />
222<br />
187<br />
215<br />
57<br />
180<br />
276<br />
233<br />
177<br />
184<br />
•238<br />
Ifergin<br />
$106<br />
92<br />
122<br />
87<br />
115<br />
-43*<br />
80<br />
176<br />
133<br />
77<br />
84<br />
138
The deposits described froa the Davy-Uountain-Brasstown<br />
Church area* and from many other isolated occurrences<br />
are <strong>of</strong> this type. These deposits are generally small;<br />
fiae grinding is necessary in order to obtain a oon-<br />
'centrate*<br />
(3) Nodules and segregations <strong>of</strong> massive sillimanite<br />
in schist; local occurrences noted from Davy<br />
Mountain and Hart county.<br />
(4) Button and flattened 'pebble-like' masses<br />
<strong>of</strong> silliaanite (fi&rolite) and quartz in schist. This<br />
Eipcnmat<br />
] Station . . ,<br />
Gtorju<br />
Tnh<br />
|[ lodutrul . .<br />
. Eumonk<br />
I Ruorch . .<br />
SILLIMANITE BEARING SCHIST<br />
IN HART, ELBCRT. AND<br />
MADISON COUNTIES
peculiar type, "pseudo-conglomeratic 1 in character, is<br />
descrioed from the region <strong>of</strong> Amioalola River.<br />
(5) Sillimanite replacing kyanite. Examples <strong>of</strong><br />
this type nay be found in the Davy Mountain-Brasstoim<br />
Church belt. Frindle3 figures an occurrence <strong>of</strong> this<br />
type from Hyatt Hill Creek, 3 miles south <strong>of</strong> Hayesville,<br />
North Carolina.<br />
State ....<br />
Ezptriaal<br />
SutioD . . .<br />
Iidutrii] .<br />
..Eo»oi<br />
Rtmnb .<br />
The first two types are found abundantly in Hart, Hadi-<br />
SOB and adjoining Elbert counties. Some <strong>of</strong> these deposits<br />
appear to be better than those'thus far found in South Caro<br />
lina. Host <strong>of</strong> the recently-discovered deposits in these<br />
three counties occur in a belt <strong>of</strong> schist extending about 23<br />
miles southwestward from Hartwell through Hart county, across<br />
Elbert county, east and south <strong>of</strong> Bowman, and across the eas<br />
tern end <strong>of</strong> Madison county to the Oglethorpe. county line.<br />
Between Hartwell and Bowman, the belt is approx<br />
imately two miles wide, and the sillimanitebearing<br />
schist zone near its southwestern termi<br />
nus is about a mile wide, although the exact<br />
boundaries are difficult to trace because <strong>of</strong><br />
weathering. "The richest zone is found near the<br />
middle <strong>of</strong> the belt between Little Coldwater<br />
I* Creek, south <strong>of</strong> Hartwell and Holly Creek just<br />
southwest <strong>of</strong> the Elbert-Ifadison county line,"<br />
according to the report. "Isolated occurrences<br />
<strong>of</strong> sillimanite-bearing schist<br />
have been found beyond the bor<br />
der <strong>of</strong> this belt, and detailed<br />
prospecting in the future may<br />
discover other belts with a<br />
high sillljnanlte content in<br />
this same general area."<br />
Transportation: The sillimanite<br />
belt is well served by<br />
railroads and highways.<br />
State Highway 36 crosses<br />
the southern end <strong>of</strong> the<br />
belt between Comer and<br />
Carlton parallel to the<br />
Seaboard Railway. Geor<br />
gia Highway 17, -between<br />
Bowman and Elberton and<br />
connecting with U. S. 29<br />
at Royston, is paralleled<br />
by the Southern railroad.<br />
1 graded soil road paral<br />
lels the eastern side <strong>of</strong><br />
the belt between Elber<br />
ton and Hartwell. Ifap<br />
If- II shows a network <strong>of</strong><br />
secondary roads which<br />
—79--<br />
a Prindle, Lewis 1C.,<br />
and others, Kyanite and<br />
Yermioulite Deposits <strong>of</strong><br />
<strong>Georgia</strong>, Ga. Gaol. Surv.<br />
Bul. 46, 1935.
connect the belt with the railways and improved roads. Hartwell,<br />
at the northern terminus <strong>of</strong> the celt, is connected with<br />
the Southern Railway by the Bartwell Branch.<br />
Sute ....<br />
Engineering<br />
Experiment<br />
Surion . . .<br />
Gtoeaia<br />
Tnh<br />
ladnitrial . .<br />
. . Economk<br />
Rocarcb . .<br />
Description <strong>of</strong> Sill
ations. A spark plug manufacturer prospected kyanite deposit<br />
in Towns county on Gumlog Mountain as far back as 1931. Little<br />
ore vas produced as a result.<br />
Son ....<br />
EnfinMTUI|<br />
Experiment<br />
Station ,<br />
"Veins and lenses <strong>of</strong> coarsely-bladed kyanite occur in mica vW<br />
schist, and locally are associated with quartz lenses. Deposits<br />
<strong>of</strong> this type are usually small veins, or smaller lenses and nod<br />
ules that are quite resistant to weathering; thus dornicks and<br />
boulders <strong>of</strong> kyanite from such occurrences may be found locally in the<br />
lodnittul . .<br />
. . Ecowxnic<br />
Rcitvcb . .<br />
break-dov.il over the primary schist and gneiss. Very little kyanite <strong>of</strong> this<br />
type has been mined in the state, probably because the deposits are small<br />
tnd lack continuity."<br />
Massive kyanite found on the property <strong>of</strong> A. J. Elldns in Daws on county<br />
led to the discovery <strong>of</strong> numerous deposits in Daws on, Fiokens, Cherokee, and<br />
Gilmer counties. Furcron and league report that "as far as is known, this<br />
is the only occurrence <strong>of</strong> this massive type <strong>of</strong> kyanite discovered thus' far<br />
outside <strong>of</strong> India. The massive kyanite described ... is unique in that<br />
the individual crystals seldom exceed an eighth <strong>of</strong> an inch in length. Also<br />
the crystals are tightly interlocked to form dense, compact masses with<br />
little or no pore space. . . (unlike most kyanite which) when calcined<br />
. . . becomes friable, ... the massive variety remains dense and tough.<br />
Boulders <strong>of</strong> massive kyanite are bluish gray to grayish white in color; they<br />
nay be confused in the field with massive barite, but are much tougher and<br />
more difficult to break than barite; also massive kyanite frequently con<br />
tains corundum. The index <strong>of</strong> refraction <strong>of</strong> kyanite is from 1.712 to 1.728<br />
thus distinguishing it from sillimonite with refractive indices <strong>of</strong> 1.659 to<br />
1.680."<br />
Types <strong>of</strong> Kyanite Deposits: Four types <strong>of</strong> kyanite deposits were noted<br />
by Furcron and league in the Northeast <strong>Georgia</strong> Area. Kyanite seems to be<br />
formed at a lower temperature than sillimanite, although both minerals are<br />
similar in origin and occurence.<br />
1. Kyanite crystals disseminated in mica schist or quartzite.<br />
The commercial deposits worked in Virginia, North Caro<br />
lina, and <strong>Georgia</strong> are <strong>of</strong> this type.<br />
2. Lenses, stringers, and vein-like masses <strong>of</strong> interlock<br />
ing blue-bladed kyanite crystals associated with quartz veins<br />
and stringers, and pegmatities. This type was worked west <strong>of</strong><br />
Ball Ground and ... on Gumlog Mountain, but, thus far, has<br />
not been mined on a commercial scale because the deposits are<br />
snail and local in distribution.<br />
3. Kodules or segregations <strong>of</strong> dense massive interlock<br />
ing crystals <strong>of</strong> blue gray kyanite in biotite schist; sices<br />
range from 800-pound boulders to small button-like masses; as<br />
sociated with pegmatites and intrusive quartz veins.<br />
4. Kyanite showing alteration to sillimanite.<br />
Ifessive Kyanite Deposits: The ore occurs as lumps and boulders,<br />
thickly scattered through the soil and sub-soil. The size <strong>of</strong> individual<br />
deposits vary from a few scattered fragments to several acres thickly<br />
covered with kyanite lumps. None <strong>of</strong> the deposits have been prospected, so<br />
i* is difficult to estimate the available tonnage, although it is not re<br />
ported as large. Kyanite "may be found practically anywhere in the area<br />
underlain by the kyanite-bearing Amicalola gneiss. Local concentrations<br />
occur at many places."<br />
—31—
Brick and Tile SB«....<br />
<strong>Georgia</strong> is one <strong>of</strong> the larger producers <strong>of</strong> brick and tile,<br />
ranking seventh in total production <strong>of</strong> red burning brick in the<br />
United States for 1939. Five <strong>of</strong> the eight Southeastern states<br />
were among the sixteen states producing over 100 million such<br />
brick during 1939. For many years, <strong>Georgia</strong> has been shipping<br />
brick into other states, particularly Florida (where there is no<br />
EnfinKrinf<br />
Experiment<br />
Station .<br />
Grorow<br />
T«k<br />
Indmtrial . .<br />
. . Economic<br />
Rouicb .<br />
production except for two or three small plants), north along the Atlantic<br />
Coast as far as Washington, and into adjoining Tennessee, Alabama, and the<br />
Carolinas.<br />
The manufacture <strong>of</strong> brick and tile is feasible In Hall and several<br />
counties in the Northeast <strong>Georgia</strong> Area if (1) adequate supplies <strong>of</strong> clay can<br />
be secured and (2) plants <strong>of</strong> economic size are established. On the basis<br />
<strong>of</strong> the one known deposit,it would probably be necessary to import some<br />
shale to improve both the green and fired strength and absorption <strong>of</strong> water.<br />
This is true despite the fact that for years the <strong>Georgia</strong> production <strong>of</strong><br />
brick and tile has been very largely confined to three sections, (1) the<br />
Rome Area (and adjoining counties), (2) Atlanta, and (3) along the" fall<br />
line at Columbus, llacon, Hilledgeville, and Augusta. Natural gas is<br />
available in n three sections.except at Augusta. From time to time,<br />
brick and tile have been croduced at many other points in the state since<br />
available clays are rather widespread in distribution. The concentration<br />
in these three sections appears to have resulted from cost and transporta<br />
tion factors, since most <strong>of</strong> the plants which have failed appear to have<br />
had costs which were too high to meet competition, a condition which<br />
usually resulted from small capacity, under 50 thousand brick per day.<br />
While only one clay deposit is shown in Shales and Brick Clays <strong>of</strong><br />
<strong>Georgia</strong>1 for the entire Areayit is believed possible that other deposits<br />
<strong>of</strong> colluvial clay might be found along the major streams in Habersham,<br />
Banks, Stephens,and Franklin counties. The one deposit reported is in<br />
Hall county. This deposit, formerly operated by the Hudson Brick Co., is<br />
at Gainesville near the right <strong>of</strong> way <strong>of</strong> the Southern Railway. The small<br />
capacity <strong>of</strong> this plant (25 thousand brick per day) probably caused its<br />
discontinuance.<br />
Some <strong>of</strong> the larger plants in <strong>Georgia</strong> are doubling their present capa<br />
city in anticipation <strong>of</strong> increased markets. The indicated volume <strong>of</strong> indus<br />
trial construction and home building requirements is generally expected<br />
to at least double and possibly triple the Southeastern demand for brick,<br />
tile, and other heavy clay products used iri construction.<br />
More Plants Heeded; The large volume <strong>of</strong> construction forecast for<br />
<strong>Georgia</strong> indicates that if clays are available, one or more plants with a<br />
capacity <strong>of</strong> 100 thousand brick per day located in Northeast <strong>Georgia</strong> would<br />
probably find a pr<strong>of</strong>itable market. In addition to the Area market (which<br />
would not absorb the production <strong>of</strong> one plant), rail connections would per<br />
mit sales in western North Carolina, South Carolina,or in the Atlanta<br />
market which now imports about two-thirds <strong>of</strong> the brick and tile used.<br />
Economic Problems<br />
The major economic problem <strong>of</strong> the brick and tile industry is one which<br />
is an outgrowth <strong>of</strong> war dislocations in the labor force. While it is a<br />
Saith, R. W-, Bulletin U5, Geological Survey <strong>of</strong> <strong>Georgia</strong>.<br />
—82—
national problem, apparently affecting the industry in all <strong>of</strong> thi<br />
large centers <strong>of</strong> production, it must be faced in any plans for<br />
expansion <strong>of</strong> the industry in <strong>Georgia</strong>. Whether the existence <strong>of</strong><br />
a serious labor limitation is one which will disappear in a<br />
short time or one which will require major adjustments is diffi<br />
cult to determine.<br />
Tiro T.I *H ting Factors; Two problems relating to the postwar<br />
composition <strong>of</strong> the labor force can limit the possibilities already de<br />
scribed. Brick and tile plants in <strong>Georgia</strong> and, in general, in all <strong>of</strong> the<br />
major brick producing areas <strong>of</strong> the United States,are today operating at<br />
about forty per cent <strong>of</strong> capacity solely because <strong>of</strong> inability to secure<br />
coinion labor in sufficient quantity. Orders are booked for six months or<br />
more ahead. Then there are not enough brick-layers and other construction<br />
craftsmen to lay the brick and tile, do the carpenter work and other jobs<br />
necessary to utilize the vast quantity <strong>of</strong> materials which contractors and<br />
industrial firms with expansion plans are unsuccessfully attempting to<br />
place. The apparent shortage <strong>of</strong> common labor which is limiting brick and<br />
tile production will increase as the volume <strong>of</strong> building increases, so<br />
that it seems to be the view <strong>of</strong> material producers and large contractors<br />
that these two labor situations, if they continue, may be expected to pre<br />
vent planned construction to such an extent that when construction reaches<br />
a point where between sixty-five and seventy-five per cent <strong>of</strong> existing clay<br />
products capacity is being used,the supply <strong>of</strong> brick layers will be exhausted.<br />
The obvious result will be that only a little more than a third <strong>of</strong> the<br />
planned construction actually can be built without long delay. This criti<br />
cal point may be reached before April, I°li6.<br />
Price Level Lows Because <strong>of</strong> generally lower costs and a higher proportion<br />
<strong>of</strong> "common 1' brick in relation to total production, prices in<br />
<strong>Georgia</strong>' are the lowest in the United States. This fact must be taken in<br />
to account in evaluating the 1939 data on the brick and tile industry from<br />
the census shown in Tables M-39 and Jt-kO and M-W-.<br />
Table H-bO shows the values per $100 <strong>of</strong> manufacturing Wages and, Sala<br />
ries (described on page 87 ) for the United States, the Southeast, and the<br />
individual states in the Southeast. AH comparisons in Table M-bO are in<br />
terms <strong>of</strong> the expenditure for manufacturing Salaries and Wages. The items<br />
have been selected from those shown in the bottom half <strong>of</strong> Table V-39.<br />
Gross Margin and Value Added; The most significant items in Table<br />
H-39 are, in order, Gross Margin (last line), Value Added, Value <strong>of</strong> Product,<br />
and Cost <strong>of</strong> Materials. The Gross Margin item and the Value Added should be<br />
considered together since the Value Added is uniformly $100 greater than<br />
the Gross Margin (Gross Margin is the difference between Value Added and<br />
the sum <strong>of</strong> Manufacturing Wages and Salaries). The United States value for<br />
Gross Margin is $90 for each $100 <strong>of</strong> Wages and Salaries. The <strong>Georgia</strong> value<br />
is $70, the lowest Gross Margin shown in Table M-UO. This <strong>Georgia</strong> Gross<br />
Margin value probably is close to the lower limit for a satisfactory pr<strong>of</strong>it<br />
situation. Only the values for the United States, the Southeast, and for<br />
Alabama, South Carolina, and Tennessee should be considered for comparison<br />
since the total Value <strong>of</strong> Product for Louisiana and Mississippi are rela<br />
tively small and the North Carolina values appear distorted. The high<br />
ralue <strong>of</strong> $185 for North Carolina reflects apparently the peculiar circum<br />
stance that in North Carolina for the 1)1 plants reported,there are also<br />
reported 3k "Proprietors and firm members.» In such cases the census prac<br />
tice -is to exclude from the Wage and Salaries items any payments to such<br />
Proprietors or firm members (in partnerships). One <strong>of</strong> the largest plants<br />
—83—
in North Carolina is operated as a proprietorship rather than a<br />
corporation. The effect <strong>of</strong> this rule is to transfer any such<br />
payments from the Wage and Salary items to Gross Margin so that<br />
in calculating the per $100 values, a double distortion occurs<br />
since the divisor is reduced and,in the case <strong>of</strong> Gross Margin,<br />
the figure to be divided is increased. For this reason, all<br />
values shown in Table M-ljO for North Carolina are higher than<br />
they should be, although it is not practical to estimate the<br />
extent <strong>of</strong> the distortion. This factor also affects the values for Missis<br />
sippi where 3i proprietors and firm members are shown with 11* plants and<br />
in Louisiana where 5 are shown for 13 plants. These three states account<br />
for 52 <strong>of</strong> the 86 proprietors shewn for 133 plants.<br />
Another factor which contributes to variation between the figures<br />
frost state to state in the Southeast is the fluctuation in the composition<br />
<strong>of</strong> the total production. The brick and tile industry actually produces<br />
eighteen different types <strong>of</strong> material (not including any size variations),<br />
<strong>of</strong> which at least fifteen are produced in the Southeast. Costs and prices<br />
anong these products nave a very wide range. Face brick and some glazed<br />
specialties may be priced as much as two to four times common brick. The<br />
volume in <strong>Georgia</strong> is very high in low cost, ccomon brick and structural tile<br />
which tend to move at a closer price than face brick. In general, indus<br />
tries in which the Gross Margin value is between $65 and $135 are apt to<br />
have a highly favorable situation. Higher or lower values tend to reflect<br />
sone condition which limits pr<strong>of</strong>it by either restricting price or inflat<br />
ing overhead through some unusual item. Since the Gross Margin for Georg<br />
ia in 1939 was $70 and since the wages in <strong>Georgia</strong> were at a low level, it<br />
is to be anticipated that increased wages if accompanied by the efficiency<br />
<strong>of</strong> mass methods such as the mechanical handling <strong>of</strong> material would result<br />
in increased Gross Margins with only moderate price increases.<br />
Value <strong>of</strong> Product; The values for Value <strong>of</strong> Product shown in Table<br />
V-UO are fairly constant over the Southeast in comparison with the United<br />
States as is shown in the following comparison:<br />
Per<br />
The only states with large varia-<br />
Yalue Cent tions from 100 are North Carolina and<br />
oo7Louisiana where the data appear to be<br />
Product United distorted.<br />
Per $100 States<br />
Payroll Value<br />
Cost <strong>of</strong> Material: The principal<br />
item in the Cost <strong>of</strong> Materials group is<br />
United States $267 100 that <strong>of</strong> mining clays. As is indicated<br />
Southeast 319 119 by the figures for the Cost <strong>of</strong> Materials<br />
Alabama 313 117 group and for the four sub-items, the<br />
<strong>Georgia</strong> 267 100 effect <strong>of</strong> the 1939 wage structure which<br />
Louisiana 357 13U was below the United States average<br />
Mississippi 305 llli appears. The values for the group are<br />
North Carolina U06 152 above the United States figure <strong>of</strong> $76 for<br />
South Carolina 30k Ilk " n states except non-significant Louisi-<br />
Tennessee 252 -9U ana, while for the Materials and Supplies<br />
item <strong>of</strong> $23 for the United States only,<br />
Korth Carolina (where the data are distorted) has a value above this level.<br />
The fuel item (with a value <strong>of</strong> $1»3) is half or more higher than the United<br />
States value in all states except Tennessee ($Ui) and Louisiana ($U5)><br />
Hhile this is in part due to the series <strong>of</strong> variations already mentioned,<br />
the dollar figures In Table M-39 indicated that, probably efficient mining<br />
operations have in part contributed to lowering the cost and that differ-<br />
—84--
ences in basic accounting procedures hove inflated the result.<br />
For the United States, the fuel item is approximately twice the<br />
raw materiEls and supplies; for <strong>Georgia</strong> and the Southeast, the<br />
fuel is seven times, yet firing costs are known t o be lower in<br />
<strong>Georgia</strong> and Southeastern plants than elsewhere. This suggests<br />
ttet different accounting procedures were probably employed.<br />
In <strong>Georgia</strong> and the Southeast, mining costs are generally inte<br />
grated with plant costs. Possibly in other regions the mined<br />
Sme . . .<br />
Enjii<br />
Experiment<br />
Station . . .<br />
CfOfffia<br />
T«*<br />
ladmtiiil . .<br />
..Economic<br />
Roareb . .<br />
clay was in many cases purchased from a subsidiary, resulting in an in<br />
crease in the Cost <strong>of</strong> Materials and a. reduction in Wage totals.<br />
Labor Costs; The general pattern <strong>of</strong> brick manufacture in <strong>Georgia</strong> was<br />
established on the basis <strong>of</strong> low-wage labor employed in the moving <strong>of</strong><br />
naterial fron the mine to the plant and within the plant.<br />
Bricks were moved from place to place in the plant by tossing four<br />
at a time. Even under low wage conditions, small wage increases <strong>of</strong>ten<br />
forced costs above selling price for plants with small capacity. The<br />
natural result was the closing <strong>of</strong> most plants with a capacity <strong>of</strong> less than<br />
fifty thousand brick a day since they usually lacked the capital necessary<br />
to substitute conveyor belts, lift trucks,and similar mechanical material<br />
noving equipment. This condition has been somewhat aggravated by wart.ime<br />
changes in wage levels, and even more by upgrading <strong>of</strong> skills. At the<br />
present wage ceiling <strong>of</strong> 65 cents for common labor, even the larger plants<br />
cannot find enough labor because <strong>of</strong> the competition <strong>of</strong> less arduous jobs<br />
at equal or hisher pay. Estimates indicate, for example, that it would be<br />
more pr<strong>of</strong>itable to pay from $1.00 to $1.25 Per hour for a li.f.t truck opera<br />
tor moving 500 bricks at a time than 65 cents for tossing four at a tim e,<br />
even while writing <strong>of</strong>f the thousand dollar investment in the lift truck<br />
in four years.<br />
Plant Locations; The relatively low price <strong>of</strong> brick as compared to its<br />
weight (a thousand brick weigh about two tons) makes material handling the<br />
key factor in all costs. For this reason, a greater economy in operation<br />
can be secured by locating a heavy clay plant directly on a railroad in<br />
order to permit direct loading onto cars. The plant site should also be<br />
accessible to a paved highway. The clay pit should, if possible, be close<br />
enough to the plant to permit convey or belt transportation <strong>of</strong> the clays.<br />
Fuel; In the Northeast <strong>Georgia</strong> Area kilns would have to be fired by<br />
coal, since natural gas is not available.<br />
1939 Values; The data in Tables M-39 and M-ljl cannot be directly<br />
related to costs per thousand brick in <strong>Georgia</strong> and the Southeast. Only<br />
brick from "red burning clays" are shown for the Southeastern states (ex<br />
cept Florida which has only minor production). Table M-ld. gives the pro<br />
duction for selected states with totals for this class (which includes<br />
most common brick) for brick produced in 1939,for total value,and for<br />
value per thousand. For the sixteen states which produce over 100,000<br />
thousand brick, <strong>Georgia</strong> shows the lowest sales value per thousand brick.<br />
This figure <strong>of</strong> $8.87 per thousand brick, at the brickyard, is about onequarter<br />
less than the average price in 1939 for all plants in the United<br />
States. The low value in <strong>Georgia</strong> apparently reflects the higher propor<br />
tion <strong>of</strong> "common" brick in the <strong>Georgia</strong> production, the lower firing costs<br />
resulting from climatic conditions,and the generally efficient -operation<br />
<strong>of</strong> the large volume plants.<br />
—85--
Item<br />
Number '<strong>of</strong> Plants<br />
'roprietors<br />
Salaried Officers<br />
Mfg. Total<br />
Salaried<br />
Wage Earners<br />
listribution<br />
Oonstruotion<br />
Jther<br />
Salaries and<br />
Wages, Total ,<br />
Salaried Officers'<br />
Manufacturing*<br />
Salaries<br />
Wages<br />
Distribution<br />
Construction<br />
Other3<br />
Cost <strong>of</strong> Materials<br />
Materials<br />
Fuel<br />
Eleotrio Energy<br />
Contract Work<br />
Value <strong>of</strong> Products<br />
Value Added^<br />
Margin*<br />
U.S.<br />
800<br />
330<br />
698<br />
30,848<br />
1,779<br />
29,069<br />
1,096<br />
276<br />
46<br />
133,877,863<br />
2,642,630<br />
29,258,645<br />
2,909,199<br />
26,349,346<br />
1,691,060<br />
246,909<br />
38,119<br />
22,469,697<br />
6,996,528<br />
12,660,149<br />
2,726,259<br />
87,661<br />
78,163,227<br />
55,683,630<br />
55,652,782<br />
general Statistioi for Brick and Hollow Structural Tile Industry<br />
in Detail for UnTEedUtates and SouEheast State sTor 1$$9<br />
S.E.<br />
133<br />
86<br />
108<br />
6,047<br />
2 75<br />
6,772<br />
238<br />
56<br />
5<br />
$ 4,634,293<br />
647,802<br />
3,710,085<br />
422,262<br />
3,287,833<br />
321,394<br />
49,790<br />
6,222<br />
3,607,499<br />
726,001<br />
2,399,944<br />
468,407<br />
13,147<br />
11,854,213<br />
8,246,714<br />
8,240,667<br />
Ala.<br />
20<br />
10<br />
14<br />
897<br />
51<br />
846<br />
104<br />
__<br />
$ 635,599<br />
58,621<br />
657,554<br />
78,820<br />
478,734<br />
16,724<br />
2,800<br />
„<br />
534,252<br />
95,564<br />
357,666<br />
81,032<br />
._<br />
1,749,798<br />
1,216,546<br />
1,214,649<br />
Ga.<br />
• 13<br />
2<br />
20<br />
1,036<br />
61<br />
985<br />
94<br />
29<br />
—<br />
| 876 ;902<br />
116,219<br />
646,208<br />
70,771<br />
574,437<br />
93,160<br />
21,316<br />
__<br />
620,537<br />
66,736<br />
452,532<br />
101,270<br />
-_<br />
1,723,107<br />
1,102,670<br />
1,101,534<br />
La.<br />
13<br />
6<br />
12<br />
414<br />
19<br />
395<br />
22<br />
._<br />
1<br />
1331,702<br />
107,300<br />
207,479<br />
21,706<br />
186,773<br />
16,373<br />
«<br />
650<br />
132,814<br />
35,255<br />
93,507<br />
4,062<br />
--<br />
741,692<br />
608,878<br />
608,464<br />
Miss.<br />
14<br />
14<br />
11<br />
463<br />
22<br />
441<br />
8<br />
11<br />
--<br />
|306,550<br />
36,610<br />
847,469<br />
31,064<br />
216,395<br />
14,203<br />
8,898<br />
480<br />
830,397<br />
76,014<br />
135,776<br />
19,607<br />
—<br />
756,884<br />
626,487<br />
526,084<br />
N.C.<br />
41<br />
34<br />
30<br />
1,495<br />
65<br />
1,430<br />
4911<br />
11,176,042<br />
141,606<br />
949,678<br />
91,259<br />
858,419<br />
81,238<br />
2,270<br />
1,250<br />
1,151,549<br />
260,362<br />
771,464<br />
129,083<br />
650<br />
3,862,387<br />
2,710,838<br />
2.709,343<br />
S.C.<br />
16<br />
13<br />
9<br />
833<br />
•32<br />
801<br />
309<br />
1<br />
| 628,377<br />
31,700<br />
453,884<br />
64.890<br />
388,994<br />
36,227<br />
6,116<br />
1,460<br />
472,068<br />
95,773<br />
301,886<br />
65,409<br />
9,000<br />
1,379,984<br />
907,916<br />
907,083<br />
Tenn.<br />
17<br />
•LQ IP<br />
909<br />
35<br />
874<br />
9C<br />
Zo<br />
1<br />
2<br />
t 780,121<br />
66,946<br />
648,823<br />
63,742<br />
586,081<br />
64,569<br />
8,391<br />
1,392<br />
466,882<br />
107,308<br />
287,123<br />
67,964<br />
3,497<br />
1,640,361<br />
1,174,479<br />
1,173,570<br />
Souroei IT. 3. Census. Manufactures, 1939, Brick and Hollow Structural Tile Industry, 'And firm .. .<br />
members (partnerships). 80f corporations. "^Included in Value Added and in Margin. *This item is the • £ o g^B<br />
iivisor used in Table M-40. Includes supplies, oontraot work, fuel, and purchased eleotrio energy. 1 lojljj | 'jjj '*<br />
'And Supplies. 7puroha3ed. 8By manufacture. BThis figure, not shown by census. Is calculated by ll •§ =•'*•: I!'.'<br />
subtracting tha aum <strong>of</strong> manufacturing Salaries and Wage payments from Value Added. II ' ft*' • *•" ' li<br />
1S1<br />
V wto
Table M-40<br />
o>
State<br />
or<br />
Group<br />
United States<br />
Southeast<br />
Table U-41 f5£^i<br />
Eipuiaat<br />
Bunber and Value it Brick froia Red Burning Clays &£,»' '<br />
and Value <strong>of</strong> Product for B rick and Hollow Ttcfc<br />
—— Structural Tile foTll.S., S.lT"aSa ——— WSH:i<br />
Selected States Tor 1979"" Roeucfc . .<br />
01<br />
4><br />
C<br />
a<br />
747<br />
144<br />
Brick from Red<br />
Burning Clays<br />
K<br />
Brick<br />
4,209,797<br />
967,436<br />
Value<br />
149,136,085<br />
10,151.487<br />
Per<br />
11<br />
Brick<br />
$11.37<br />
10.49<br />
Brick and Hollo*r Structure<br />
Tile Industry<br />
P]<br />
1 £<br />
800<br />
133<br />
Value<br />
<strong>of</strong><br />
Product1<br />
$78,153,227<br />
11,854,213<br />
States producing over 100,000 II Brick from Red Burning Clays:<br />
Sew York<br />
Pennsylvania<br />
31. Carolina<br />
Ohio<br />
Illinois<br />
Virginia<br />
<strong>Georgia</strong><br />
JLlabaxa<br />
Te^as<br />
California<br />
S- Carolina<br />
Tennessee<br />
New Jersey<br />
Maryland<br />
Jiichigan<br />
Indiana<br />
33<br />
61<br />
47<br />
58<br />
36<br />
31<br />
14<br />
20<br />
30<br />
35<br />
17<br />
18<br />
11<br />
16<br />
10<br />
23<br />
593,668<br />
333,584<br />
298,087<br />
272,762<br />
272,457<br />
193,350<br />
168,394<br />
148,332<br />
145,318<br />
139,963<br />
135,502<br />
127,453<br />
120,999<br />
116,235<br />
112,112<br />
102,357<br />
Other Southeastern States:<br />
Mississippi<br />
Louisiana<br />
17<br />
11<br />
65,537<br />
24,131<br />
5,838,624<br />
4,320,033<br />
3,618,692<br />
3,159,476<br />
3,124,677<br />
2,434,449<br />
1,493,057<br />
1,382,411<br />
1,303,360<br />
1,553,246<br />
1,364,110<br />
1,367,379<br />
1,553,032<br />
1,584,931<br />
1,709,229<br />
1,254,500<br />
673,860<br />
251,978<br />
9.84<br />
12.35<br />
12.14<br />
11.58<br />
11.47<br />
12.32<br />
8.87<br />
9.32<br />
8.97<br />
11.10<br />
10.07<br />
10.73<br />
12.84<br />
13.34<br />
15.25<br />
12.26<br />
10.28<br />
10.44<br />
37<br />
72<br />
41<br />
75<br />
48<br />
30<br />
13<br />
20<br />
37<br />
29<br />
15<br />
17<br />
14<br />
16<br />
10<br />
27<br />
14<br />
13<br />
6,314,214<br />
7,048,830<br />
3,862,387<br />
11,939,903<br />
5,861,107<br />
2,788,022<br />
1,723,107<br />
1,749,798<br />
2,876 A007<br />
2,009,173<br />
1,379,984<br />
1,640,361<br />
2,393,122<br />
1,670,924<br />
1,946,375<br />
3,143,078<br />
756,884<br />
741,692<br />
Value<br />
<strong>of</strong> Tile,<br />
Other<br />
Brick<br />
etc. 2<br />
29,017,142<br />
1,702,726<br />
475,590<br />
2,728,797<br />
243,695<br />
8,780,427<br />
2,736,430<br />
303,573<br />
230,050<br />
367,387<br />
1,572,647<br />
455,927<br />
15,874<br />
272,982<br />
840,090<br />
85,993<br />
237,446<br />
1,888,578<br />
83,024<br />
489,714<br />
Source: B. S. Census, Manufactures, 1939, Brick and Hollow<br />
Structural Tile Industry.<br />
i(This is the sane Value <strong>of</strong> Product shonn in Table H-33.<br />
EThe difference between Col. 6 and..col. 3. This nay be an entirely<br />
accurate figure since the values shown in Cols. E and 3 include some<br />
brick produced in plants not included in Col. 6,and in some cases<br />
plants are included in Col. 6 which are not included in Cols. 2 and 3.<br />
However, this colum approximates the value <strong>of</strong> all buff brick (including<br />
face brick), all types <strong>of</strong> glazed brick,and all types <strong>of</strong> structural tile.<br />
—83—
Structural Tile Values: The 1939 values for structural<br />
tile, buff brick, glazed brick and other heavy clay products<br />
shown in the last column <strong>of</strong> Table M-U1 are almost altogether<br />
structural tile for <strong>Georgia</strong> and the other Southeastern states.<br />
The volume <strong>of</strong> structural tile has increased very considerably<br />
since 1939j and current demands indicate that the value <strong>of</strong><br />
structural tile will continue at about one-fourth <strong>of</strong> the total<br />
production <strong>of</strong> the industry.<br />
Exptaoat<br />
Sation . . .<br />
lodutiul . .<br />
. . Eco«nic<br />
Ratarch . .<br />
Size <strong>of</strong> Plant Versus Cost; Table M-ll clearly indicates the effect<br />
<strong>of</strong> size <strong>of</strong> plant on cost per thousand bricks..' The total ualue <strong>of</strong> product<br />
for 1939 shown for the Hi plants in Mississippi was $756,881), an average<br />
<strong>of</strong> t£U,063 per plant. For the 13 <strong>Georgia</strong> plants the same average was<br />
$132,SL6 per plant. The average plant price in Mississippi for brick from<br />
red burning clay was $10.28; for <strong>Georgia</strong>, $8.87.<br />
Price Structure; Brick and tile are priced by a system <strong>of</strong> discounts<br />
from a base price. For common brick, this base price had been $l£ per<br />
thousand (increased by OPA as a base ceiling to $17 in September, 191i5),<br />
irith most quantity discounts in the Southeast between thirty per cent and<br />
fifty per cent .<br />
Modular Dimensions; ill the brick and tile plants in <strong>Georgia</strong> and the<br />
Sou.the.ast which are members <strong>of</strong> the Southern Brick and Tile Manufactures'<br />
Association are in the process <strong>of</strong> changing sizes <strong>of</strong> all material produced<br />
to conform to the modular dimensions recently established through the<br />
American Standards Association1 for all types <strong>of</strong> building material. These<br />
sizes are based on a standard unit in place <strong>of</strong> four inches or multiples<br />
there<strong>of</strong> and are designed to eliminate all cutting <strong>of</strong> units in construction.<br />
The effect <strong>of</strong> using modular dimensions is in general to reduce the labor<br />
cost in laying brick or tile as well as cost <strong>of</strong> material,since none is<br />
wasted through cutting.<br />
The following is the technical data on the Hudson deposit at Gainesville,<br />
based on Bulletin USt Veatch describes the deposit as contain<br />
ing "Hi feet <strong>of</strong> red clay, underlain by 5 feet <strong>of</strong> bluish-white, more<br />
plastic clay. These clays are not in place, but are typical colluvial<br />
deposits." It was probably derived from a micaceous schist. The labo<br />
ratory tests on this deposit are as follows:<br />
Chemical Analysis<br />
Loss on ignition .......... 7-02<br />
Soda (Na,Ql ............ .38<br />
Potash (Lo). ........... .67<br />
Lime (CaO* ............ .00<br />
Magnesia (UgO) ........... trace<br />
Alumina (&e03). .......... 19.08<br />
Ferric oxide (FezOj) ......... 6.9U<br />
Titanium dioxide (TiO z) ........ .91<br />
Sulphur trioxide (80s) ........ .00<br />
PhospfTorus pentori.de (P^O.). ...... trace<br />
Silica-(SiOu) .......... . 65.22<br />
100.22<br />
-The work <strong>of</strong> establishing the Modular Standards was done by Coantittes<br />
A-62. The report may be secured by writing American Standards Association,<br />
70 East U5th Street, Heir York 17, H«w York<br />
—89—
Cone<br />
36<br />
Oli<br />
02<br />
1<br />
3<br />
5<br />
Linear<br />
Firing<br />
Shrink<br />
age<br />
(based on<br />
dry<br />
length)<br />
per cent<br />
1.3<br />
l.U<br />
2.7<br />
2.6<br />
2. it<br />
2.9<br />
Total<br />
linear<br />
Shrink<br />
age<br />
(based on<br />
plastic<br />
length)<br />
per cent<br />
5.6<br />
6.0<br />
7.7<br />
7.0<br />
7-0<br />
7-3<br />
ibsorption<br />
per cent<br />
21.5<br />
20. h<br />
18.6<br />
19.1<br />
19.1<br />
18.1<br />
Modulus<br />
<strong>of</strong><br />
Rupture<br />
lib. per<br />
sq.in.<br />
286<br />
369<br />
1;60<br />
339<br />
Ii07<br />
552<br />
Color<br />
Salmon<br />
Salmon<br />
Salmon<br />
red<br />
light<br />
red<br />
Fair<br />
red<br />
Good<br />
red<br />
Warpage<br />
Little or<br />
none<br />
little or<br />
none<br />
Little or<br />
none<br />
Very<br />
slight<br />
Slight<br />
Slight<br />
Stale ....<br />
Engineering<br />
Ezperimnr<br />
Station . . .<br />
<strong>Georgia</strong><br />
7-«A<br />
Indnnrial . .<br />
. . Economic<br />
Research . .<br />
——— • —— —.
Glass and Sand<br />
Deposits <strong>of</strong> sand and gravel are found in widely scattered<br />
j«rts <strong>of</strong> the Northeast <strong>Georgia</strong> Area. Although little has been<br />
used for commercial purposes, the sand and gravel are <strong>of</strong> fair<br />
quality, and are generally suitable for concrete construction,<br />
taiUiag mortar and plaster, and road construction. No foundry<br />
or moulding sands have been reported in the Area. One large dejosit<br />
suitable for glass is found in Towns county.<br />
Glass<br />
State ....<br />
Engineering<br />
Experiment<br />
Station . . .<br />
Grown<br />
TV*<br />
lodnttrul . .<br />
. . Economic<br />
Research .<br />
The deposit referred to as suitable for glass making is the white<br />
quartzite found in large quantity at the crest <strong>of</strong> the highest peak <strong>of</strong> Bell<br />
Hountain, 2 miles north <strong>of</strong> Eiwassee. The upper part <strong>of</strong> the quartzite is<br />
the purest; most <strong>of</strong> it snow white, with only a few ferruginous stains run<br />
ning through it. Analyses <strong>of</strong> the purer quartz (l) and <strong>of</strong> the stained<br />
quartz (2) are as follows i<br />
Analysis <strong>of</strong> Bell Mountain<br />
Moisture at 100°C<br />
Loss on ignition<br />
Ferric oxido(Fe2 Os)<br />
Ifanganous oxide (MnO)<br />
Silica (SiO£ )<br />
Total<br />
Samples<br />
(1) (2)<br />
This upper portion <strong>of</strong> the quartzite<br />
is suitable for the manufacture<br />
<strong>of</strong> quality glass. The iron oxide con<br />
tent ranks it as sixth quality, but,<br />
if this should decrease on further<br />
analysis, the manganous oxide is low<br />
0.03 enough that it might become fifth<br />
0.19 quality, suitable for plate glass<br />
0.38 (soe Table M-53, page 93 ). The<br />
0.66 chief problem to be considered is the<br />
____ 98.73 inaccessibility <strong>of</strong> the deposit, which<br />
0.00<br />
0.00<br />
0.12<br />
0.00<br />
99.85<br />
99.97 99.9^ is located at the top <strong>of</strong> a mountain.<br />
Eiwassee, the nearest town, presents some difficulties as a possible<br />
site for glass manufacture, because <strong>of</strong> its distance from large centers,<br />
its lack <strong>of</strong> a railroad, and the probably higher fuel cost. Mining <strong>of</strong> the<br />
quartzite and its shipment to glass plants elsewhere in <strong>Georgia</strong> should<br />
not be impossible, in view <strong>of</strong> its apparent quality. It would seem pos<br />
sible to work out a system <strong>of</strong> gravity transportation to move the quart<br />
zite from the mountain top to the highway and then truck it to Blue Ridge,<br />
the nearest point on the L. & H. railroad, or a little farther to Gainesville<br />
on the Southern railroad. The first step in developing this de<br />
posit would be further prospecting. If this confirms the analysis quoted,<br />
then an engineering study should be made to determine if the idea <strong>of</strong> grav<br />
ity transportation suggested is economically feasible, and, finally,<br />
mrkets in -which it may be sold should be located.<br />
Class Sands"<br />
Composition: An ideal glass sand is made up entirely <strong>of</strong> the mineral<br />
quartz which is free from inclusions <strong>of</strong> foreign substances. Sands con<br />
taining 100 per cent silica, however, are not found in nature, although<br />
some very nearly approach this composition. Minute inclusions <strong>of</strong> foreign<br />
substances are sometimes present in the quartz grains themselves. These<br />
•ay be divided into gaseous, liquid, and solid, the latter usually con<br />
sisting <strong>of</strong> minerals <strong>of</strong> various kinds. The gases and liquids which are<br />
soaetines included in quartz, generally have little effect on total<br />
x reas, L. P., Preliminary Report on the Sand and Gravel Deposits <strong>of</strong><br />
, <strong>Georgia</strong> Geological Survey, BuTT 577 T55T-<br />
"91—
composition, but the solid inclusions are <strong>of</strong>ten responsible for<br />
the rejection <strong>of</strong> the material as a source <strong>of</strong> glass-making mate- Salt....<br />
rial. Some <strong>of</strong> the common solid inclusions are: rutile, apa Experiment<br />
tite ilmenite and also actinolitef chlorite epidote<br />
Station . . .<br />
tremolite f and tourmaline^ Besides the mineral inclusions in<br />
quartz grains themselves, there are a considerable number <strong>of</strong> Indnniu!..<br />
other minerals that may be present either as individual grains . . Econonk<br />
or as thin films upon the surface <strong>of</strong> the quartz grains. Among ___<br />
these have been identified a great number <strong>of</strong> common minerals, but some <strong>of</strong><br />
the mors common and heavier materials <strong>of</strong> this type are as follows: garnet,<br />
hematite" hornblende" ilmenite, limonitej 2 magnetite, various micas,<br />
rutile, staurolite, 3 etc.<br />
When a complete chemical analysis <strong>of</strong> a glass sand is made, there are<br />
almost Invariably found to be present, in addition to the silica which<br />
constitutes the bulk <strong>of</strong> the sand, minute quantities <strong>of</strong> alumina, ferric and<br />
ferrous oxides, lime, magnesia, titanium oxide, traces <strong>of</strong> the alkalies,<br />
varying amounts <strong>of</strong> water, and occasionally a little organic matter in the<br />
fora <strong>of</strong> coal or decayed vegetation. Some <strong>of</strong> these constituents are harm<br />
less, while others have a very deleterious effect upon the glass.<br />
According to the American Ceramics Society committee on glass stand<br />
ards, the chief criteria for a good glass sand are that it should be prac<br />
tically all silica and should contain very little iron. The sand must no^<br />
be contaminated with stripping dirt or contain any fresh stone or pebbles,<br />
for such impurities are <strong>of</strong>ten insoluble in the melting process.<br />
Aluminai Alumina is generally present in glass sands in the form <strong>of</strong><br />
clay or kaolinite. It may, however, also occur as one <strong>of</strong> the micas or as<br />
feldspar. Such clay, as well as much <strong>of</strong> the mica, can usually be largely<br />
eliminated by careful washing <strong>of</strong> the sand, but alumina present as feldspar<br />
cannot be removed in this manner. If the clay content <strong>of</strong> a sand is high,<br />
the iron content also is apt to be high, as the clay is very likely to<br />
have limonite associated with it.<br />
The presence <strong>of</strong> small amounts <strong>of</strong> alumina in a glass sand is not<br />
necessarily detrimental in the manufacture <strong>of</strong> the ordinary types <strong>of</strong> glass.<br />
In sone instances it is not only harmless but actually beneficial. At<br />
rSutiles Titanium dioxide.<br />
3Apatite: Naturally occurring phosphate <strong>of</strong> calcium, with chloride or<br />
fluoride <strong>of</strong> calcium.<br />
*Ilme.iitei An oxide <strong>of</strong> iron and titanium.<br />
BActinolite: A monoclinic amphibole. Amphibolesi An important<br />
group <strong>of</strong> dark-colored, rock-forming silicates, <strong>of</strong> which hornblende is tho<br />
commonest.<br />
8 Chlorites» A group <strong>of</strong> allied minerals which may be regarded as hydrated<br />
silicates <strong>of</strong> aluminum, iron, and magnesium.<br />
Epidote: Common secondary mineral in igneous rocks.<br />
8 Tremolite: A silicate <strong>of</strong> calcium and magnesium.<br />
9Touraaline: A complex silicate <strong>of</strong> boron and aluminum, with, in ad<br />
dition, magnesium, iron, or the alkali metals, and fluorine in small<br />
amounts.<br />
10 Eenatito: Oxide <strong>of</strong> iron.<br />
^Hornblende: The common .b_lack, dark green, or brown variety <strong>of</strong> alumi<br />
num a^phibole. It contains considerable iron and occurs in columnar, fi<br />
brous, and granular form.<br />
J^Limonite: An amorphous hydratsd oxide <strong>of</strong> iron.<br />
Staurolite: Silicate <strong>of</strong> aluminum and iron.<br />
--92—
present, there is a tendency among many glass manufacturers to<br />
use more alumina in their glass than in the past. This is done<br />
because it has been discovered that alumina decreases the solu<br />
bility <strong>of</strong> glass in water, weak acids, and other chemical re<br />
agents. Furthermore, considerable amounts <strong>of</strong> alumina in glass<br />
result in comparatively low coefficients <strong>of</strong> expansion. Alumina<br />
also is an aid in preventing devitrification.<br />
Sute ....<br />
Engiiiecruig<br />
Experiment<br />
Station . . .<br />
<strong>Georgia</strong><br />
T>d><br />
ImfDStruI . .<br />
. . Economic<br />
Reuarcb . .<br />
Iron Oxides; Iron, either in the ferrous or ferric state, because <strong>of</strong><br />
its coloring effect upon the glass, is the most detrimental impurity found<br />
in glass sand. Ferrous iron imparts a green tint to glass, while ferric<br />
iron produces a yellow tint which is not nearly so. noticeable. Since most<br />
glass is made under reducing conditions, the green color is the one usually<br />
developed. Hhen the amount <strong>of</strong> iron present is small, this coloring effect<br />
can in part be overcome by the use <strong>of</strong> a deeolorizer, such as manganese<br />
dioxide, nickel oxide, or selenium.<br />
American glass manufacturers in recent years have been demanding an in<br />
creasingly smaller iron oxide content in the sand they use. The sand at<br />
present used in the manufacture <strong>of</strong> optical glass contains from 0.014 per<br />
cent to 0.016 per cent <strong>of</strong> ferric oxide, that used for chemical glassware be<br />
low 0.02 per cent, while for good colorless bottles and containers the sand<br />
should preferably not exceed 0.04 per cent. Plate glass manufacturers use<br />
sand containing from 0.05 per cent to 0.15 per cent <strong>of</strong> ferric oxide, al<br />
though usually the percentage does not exceed 0.10 per cent. Some window,<br />
glass manufacturers now demand sand containing less than 0.08 per cent <strong>of</strong><br />
ferric oxide. For ordinary green and amber bottles, sand containing from<br />
0.3 per cent to 1.0 per cent or even more <strong>of</strong> ferric oxide can be used.<br />
Iron may be present in the sand in the form <strong>of</strong> limonite, hematite,<br />
nagnetite, ilmenite, biotite, hornblende, fluorite, or some other iron bear<br />
ing mineral. A. little may also be introduced as metallic iron from the ma<br />
chinery which is used in crushing the sand. If it is present as limonite<br />
or hematite closely associated with kaolinite or clay, it may in large part<br />
be removed by washing. If, on the other hand, the limonite or hematite<br />
adheres closely as a coating to the quartz grains, washing is <strong>of</strong> no avail.<br />
Metallic iron, magnetite, and limonite can be removed from sand by means<br />
<strong>of</strong> a magnetic separator.<br />
Table M-53<br />
Percentage Composition <strong>of</strong> Sands <strong>of</strong> Various Qualities<br />
(based on ignited samples)<br />
Si02 A1 203 Fe a0 3 MgO<br />
Win. Ifax. Max. Ifax.<br />
Krst quality, optical glass ........ 99.8 0.1 0.02 0.1<br />
Second quality, flint glass containers<br />
and tableware ............. 98.5 0.6 0.035 0.2<br />
Third quality, flint glass ........ 95.0 4.C 0.03S 0.5<br />
Fourth quality, sheet glass, rolled<br />
and polished plate .......... 98.5 0.5 0.06 Fifth quality, sheet glass, rolled<br />
0.5<br />
and polished plate .......... 95.0 4.0 O.C6 0.5<br />
Sixth quality, green glass, containers<br />
and window glass ........... 93.0 0.5 0.3 0.5<br />
Seventh quality, green glass ........ 95.0 4.0 0.3 0.5<br />
Eighth quality, amber glass, containers .... 98.0 0.5 1.0 0.5<br />
Hinth quality, amber ........... 95.0 4.0 1.0 0.5<br />
--93--
Lime and Magnesium: The amount <strong>of</strong> lime present In most<br />
glass sands is so snail that it has no detrimental effects on<br />
the glass. Jfagnesium, however, is much more apt to be intro<br />
duced into the glass natch through the limestone used than<br />
through the sand. The composition <strong>of</strong> the former, therefore,<br />
must be -Hatched with respect to this constituent.<br />
State ....<br />
Experiment<br />
Sution . . .<br />
Cnraia<br />
Tub<br />
ladutriat . .<br />
. . Ecoaottk<br />
Raejrch . .<br />
Alkalies! Alkalies enter into the composition <strong>of</strong> all or<br />
dinary types <strong>of</strong> glass,and the minute traces occasionally present in the<br />
sand are not harmful. Titanium oxide probably rarely occurs in glass sand<br />
in sufficient amounts to have any detrimental effects on the glass. It<br />
may oe present as individual grains <strong>of</strong> rutile, ilmenite, or titanite, or<br />
as inclusions in the quartz itself. Grains <strong>of</strong> zircon, which are occasion<br />
ally found in glass sand, are very undesirable Because <strong>of</strong> their refracto<br />
riness.<br />
Organic liatter: Organic matter is occasionally present in small<br />
amounts in glass sand, either in the form <strong>of</strong> fragments <strong>of</strong> coal or as de<br />
cayed vegetable matter. In the glass sands <strong>of</strong> <strong>Georgia</strong>, it is quite likely<br />
that partially decayed material <strong>of</strong> this type will be found, particularly<br />
in those regions where the glass sands have accumulated along stream ter<br />
races or old sea terraces.<br />
Sands used in the manufacture <strong>of</strong> lead glasses must be free from or<br />
ganic matter Because <strong>of</strong> the reducing action which it exerts upon l«ad COBpounds.<br />
Manufacturers <strong>of</strong> high-grade and special glasses made in pot fur<br />
naces also usually demand an absence <strong>of</strong> organic matter in their sands. IE<br />
the case <strong>of</strong> glasses in which salt cake is used as a source <strong>of</strong> sodium, soce<br />
form <strong>of</strong> carbon has to be added to the batch to enable the silica to decom<br />
pose the sulfates.<br />
Size <strong>of</strong> grains; Uniformity in size <strong>of</strong> grains is perhaps <strong>of</strong> more i«-<br />
portance irTa glass sand than the actual size <strong>of</strong> the grains themselves, al<br />
though it is very essential that the sand be neither too coarse nor too<br />
fine. Grain size has a very definite effect on the manufacturing process<br />
<strong>of</strong> various types <strong>of</strong> glass. For example, the production <strong>of</strong> soda-lime glass<br />
is conducted in three stages. In the first stage, the raw materials are<br />
melted. In the second stage, the temperature is raised above the melting<br />
point, and the so-called "fining" process occurs. In the third stage, the<br />
glass is allowed to cool down to a working viscosity.<br />
If the sand grains are too fine, the first reaction will take place<br />
so rapidly that large volumes <strong>of</strong> caroon dioxide are liberated which cause<br />
the ba-ch to foam badly; too-fine sand may also be responsiole for the<br />
formation <strong>of</strong> a fine persistent seed in the glass. On the other hand, the<br />
coarser the sand used.the greater is the tendency for the formation <strong>of</strong><br />
batch scum. If the sand grains are uniform in size, the attack on then<br />
will be approximately unifonr., and, consequently, they will decrease in<br />
size at a uniform rate in the melting process. The recommended specifi<br />
cations for grain size are as follows:<br />
Limiting Percentages <strong>of</strong> Various Sizes <strong>of</strong> Sand Grains<br />
Through a Ho. 20 screen . . . . 100 per cent<br />
Through a Ko. 20 and remaining on a<br />
No. 40 screen ....... Hot more than 60 per cent or<br />
less than 40 per cent.<br />
—94--
Limiting Percentages <strong>of</strong> Various Sizes <strong>of</strong> Sand Grains, Cont.<br />
Through a No. 40 and remaining on a<br />
No. €0 screen<br />
Through a No.-60 and remaining on a<br />
No. 100 screen<br />
Not more than 40 per cent<br />
or less than 30 per cent.<br />
Not more than 5 per cent.<br />
Screen tests shall be made with sand dried at 110° C., using United<br />
States Bureau <strong>of</strong> Standards standard screen sizes.<br />
State ....<br />
Engineering<br />
Experiment<br />
Station . . .<br />
<strong>Georgia</strong><br />
Industrial . .<br />
. . Economic<br />
Preparation; The method <strong>of</strong> preparation <strong>of</strong> sand used depends on the<br />
character <strong>of</strong> the crude rock or sand, as well as on the grade <strong>of</strong> sand de-<br />
Eired. All sand has to be washed. With unconsolidated sand, the sand and<br />
rater may be delivered through revolving screens covered with 12 to 18<br />
mesh ilre-cloth, the oversize being taken away by drags or conveyors. The<br />
sand <strong>of</strong> desired texture and the clay pass through the screens, and the ex<br />
cess water carries <strong>of</strong>f the clay.<br />
The report <strong>of</strong> the Geological Survey <strong>of</strong> <strong>Georgia</strong> on the sand and gravel<br />
deposits <strong>of</strong> <strong>Georgia</strong> was issued in 1921, and while certain references may<br />
no longer apply, and certain landmarks may no longer exist, it is the most<br />
complete and informative study <strong>of</strong> the subject. Descriptions <strong>of</strong> the sand<br />
and gravel deposits in the Northeast <strong>Georgia</strong> Area have been consolidated<br />
fron this report into Table M-52. No chemical analyses were available<br />
except for the quartzite deposit on Bell Mountain.<br />
Table M-52<br />
Sand and Gravel Deposits in the Northeast Ceorgia Area<br />
1Deposit<br />
No.<br />
Location<br />
Banks County<br />
Description<br />
<strong>of</strong> Deposit<br />
Use<br />
Economic<br />
Possibility<br />
Workable Thickness in Ft..<br />
1<br />
2<br />
TOiere Caraesville-Homer road<br />
crosses Webb Creek, 2 mi. E<br />
<strong>of</strong> Homer<br />
Ballast pit £ mi. N <strong>of</strong> Alto,<br />
71 <strong>of</strong> So. Ey.<br />
Very good coarse<br />
grained sand, contain<br />
ing some mica, schist<br />
and feldspar; fine<br />
ness modulus <strong>of</strong> 2.52;<br />
90 per cent retained<br />
on the 48-mesh sieve<br />
6 or 7, acres <strong>of</strong><br />
quartz schist, or<br />
friable quartzite<br />
with a little mica<br />
and feldspar<br />
Concrete ag<br />
gregate<br />
—95—<br />
_
.1<br />
o<br />
•p<br />
-H<br />
aoo.<br />
c<br />
a<br />
3<br />
4<br />
5<br />
6<br />
7<br />
8<br />
9<br />
10<br />
11<br />
12<br />
Location<br />
Barrow County<br />
Marburg Creek, 3 mi. S <strong>of</strong><br />
Kinder, on Monroe road<br />
Shallow Creek, 5 mi. S <strong>of</strong><br />
Kinder, on the Itonroe road<br />
Dawson County<br />
Table lf-52 (continued) Sand and Gravel<br />
10 acres \ mi. E <strong>of</strong> Yellow Excellent coarse<br />
Creek post <strong>of</strong>fice, and along grained yellow quartz<br />
Anicalola Creek<br />
sand, 'indarlain by<br />
blue clay<br />
A branch <strong>of</strong> Thompson Crsek,<br />
just S <strong>of</strong> DiJcon<br />
Chest-itee River above<br />
Glover's Kill<br />
Forsyth County<br />
Eig Creek and a branch <strong>of</strong><br />
Vickery Creek, 1 mi. iT <strong>of</strong><br />
Cicming on Canton road<br />
Chattahoochee River, on<br />
eastern boundary <strong>of</strong> county<br />
Franklin County<br />
7.1iere ths Bowersville-<br />
Caraesville road crosses the<br />
rrorth Fork <strong>of</strong> Broad River<br />
Stephens Creek, S and SE <strong>of</strong><br />
Carnesville<br />
Hudson River, forming<br />
southern boundary <strong>of</strong> county<br />
Description<br />
<strong>of</strong> Deposit<br />
Small bars <strong>of</strong> coarse<br />
grained muddy sand,<br />
with at least 10 per<br />
cent <strong>of</strong> the grains<br />
composed <strong>of</strong> schist,<br />
feldspar and limonite<br />
Coarse-grained sand<br />
Coarse-grained sand<br />
underlain by red clay<br />
Coarse-grained sand<br />
Uediunt- to coarse<br />
grained sand with<br />
large percentage <strong>of</strong><br />
feldspar, liaonite.<br />
and mica<br />
Much coarse- and<br />
fine-grained sand<br />
Some muddy, fine<br />
grained sand in streai<br />
bed. Sand having<br />
large percentage <strong>of</strong><br />
mica and limonite ex<br />
tends along bank<br />
SQall deposits <strong>of</strong><br />
fairly coarse sand<br />
Coarse-grained sand<br />
<strong>of</strong> very good quality<br />
1 1 1<br />
Use<br />
Economic<br />
Possibility<br />
Local building<br />
Local building<br />
Concrete<br />
Concrete<br />
Concrete<br />
Concrete<br />
Concrete building<br />
Building<br />
Concrete<br />
a<br />
OB<br />
H
Table M-52 (continued) Sand and Gravel<br />
1Deposit<br />
No.<br />
Location<br />
Habersham County<br />
Description<br />
<strong>of</strong> Deposit<br />
Use<br />
Economic<br />
Possibility<br />
10<br />
«> n<br />
rH O<br />
m fc-H<br />
0^30<br />
tt«H<br />
13<br />
Eazel Creek, 1 mi. from<br />
Clarice svi lie on Tallulah<br />
Palls road<br />
Reddish-yellow sand;<br />
schist and feldspar<br />
make up 50 per cent<br />
<strong>of</strong> the particles over<br />
14 mesh; mica common<br />
in coarse flakes;<br />
modulus <strong>of</strong> 2.61; 84<br />
per cent retained on<br />
the 48-mesh sieve.<br />
14<br />
Chattahoochee River, on<br />
road between Clarkesville<br />
and Helen<br />
Sand and gravel;<br />
fineness modulus <strong>of</strong><br />
4.42; 37 per cent<br />
retained on the 4-<br />
mesh sieve<br />
15<br />
Hazel Creek and its branches<br />
Little Eazel Creek near<br />
Mount Airy<br />
Hall County<br />
Natural concrete ag<br />
gregate<br />
Construction<br />
<strong>of</strong> bridges and<br />
other concrete<br />
structures<br />
16<br />
17<br />
18<br />
Deposits north <strong>of</strong> Gainesvilli<br />
from one to two miles on or<br />
near Dahlonega road, and 1-g<br />
miles north <strong>of</strong> Gainesville<br />
Chestateo River, ten miles<br />
wast <strong>of</strong> Gainssville, on<br />
Dawsonville road, for almost<br />
a mile above dam at Glover's<br />
Mill<br />
Chattahoochee River, in its<br />
course through the county<br />
Grayish-white sand<br />
with large percent<br />
ages <strong>of</strong> silt; finer<br />
ness modulus <strong>of</strong> 1.99;<br />
70 per cent coarser<br />
than the 48-mesh<br />
sieve. Brains al<br />
most entirely <strong>of</strong><br />
angular quartz<br />
Coarse-grained,<br />
quartz sand, contain<br />
ing a few black par<br />
ticles <strong>of</strong> schist and<br />
limonite; some largei<br />
pebbles up to 1 or 2<br />
inches in diameter<br />
Coarse-grained quartz<br />
sand<br />
Concrete _____<br />
State ....<br />
Engineering<br />
Erprrimcnc<br />
Station . . .<br />
Gnrffia<br />
Tick<br />
Indnitrul . .<br />
. . Economic<br />
Rcuarco . .<br />
Concrete<br />
19<br />
Hart County<br />
Llghtwood Log Creek, NPf <strong>of</strong> Excellent coarse<br />
Hartwell on Bowersville road grained quartz sand<br />
near railroad crossing with some mica<br />
—97 —<br />
Concrete 2
[Deposit No.<br />
19<br />
20<br />
21<br />
22<br />
23<br />
24<br />
25<br />
26<br />
26<br />
27<br />
Location<br />
Hart County (cent.)<br />
(continued)<br />
Big Cedar Creek, Z miles<br />
fron Barfcwell on Elberton<br />
road<br />
Savannah River bed near<br />
Etephenson's and Green's<br />
islands<br />
Jackson County<br />
Mulberry Fork <strong>of</strong> Qconee<br />
River at Mulberry<br />
22.ddle Oeonee River, 3 mi.<br />
STT <strong>of</strong> Jefferson on Winder<br />
road<br />
Indian and Buffalo Creeks,<br />
S <strong>of</strong> Jefferson<br />
Curry Creek, 1^ mi. E <strong>of</strong><br />
Jefferson, above da<br />
Lumpkin County<br />
Yahoola Creek, on upper<br />
Gainesvills road<br />
Etowah Hiver, near Dawsonville<br />
road bridge, at<br />
Ajraria<br />
Table il-SZ (continued) Sand and Gravel<br />
—93—<br />
Description<br />
<strong>of</strong> Deposit<br />
flakes up to £ In.<br />
in size; fineness<br />
modulus <strong>of</strong> 2.62; 84<br />
per cent coarser than<br />
48-nesh sieve<br />
Medium to coarsegrained<br />
sand contain<br />
ing large flakes <strong>of</strong><br />
mica up to 1 in.<br />
across; numerous<br />
grains <strong>of</strong> schist and<br />
some linonite<br />
Coarse sand, gravel<br />
on the bed rock<br />
Quartz sand with con<br />
siderable schist and<br />
limonite; fineness<br />
modulus <strong>of</strong> 2.71 and<br />
85 per cent retained<br />
on the 48-mesh sieve<br />
Fine-grained sand<br />
icith layers <strong>of</strong> coarse<br />
grained sand and<br />
gravel<br />
Coarse-grained white<br />
jiuartz sand<br />
Coarse-grained clean<br />
quartz sand<br />
large bars <strong>of</strong> coarse<br />
sand and quartz<br />
Clean, coarse-grained<br />
quartz sand; fineness<br />
modulus <strong>of</strong> 2.39; 95<br />
per cent coarser than<br />
43-nesh<br />
tfse<br />
Economic<br />
Possibility<br />
Concrete<br />
Concrete<br />
Building<br />
Workable Thlokn ea<br />
State ....<br />
Engin*rrioi<br />
Expfrimtnt<br />
Concrete Station .. . .<br />
Gtoraia<br />
Tub<br />
fadaftfu! . •<br />
. . Economic<br />
Roetrch . .<br />
•<br />
1-li<br />
3-6<br />
-
Table M-52 (continued) Sana and Gravel<br />
I[Deposit<br />
No.<br />
Location<br />
Description<br />
<strong>of</strong> Deposits<br />
Use<br />
Economic<br />
Posibility<br />
Ifortoble Thickness ft. in<br />
Madison County<br />
28<br />
Broad River, above bridge<br />
on Berkely-filberton road<br />
Excellent sand<br />
Concrete<br />
Eabun County<br />
29<br />
Banks <strong>of</strong> Tallulah River<br />
below Wiley almost to dam<br />
White floe-grained<br />
sand<br />
Building<br />
3-6<br />
30<br />
Along Timson Creek, from<br />
Tallulah River to a point 6<br />
miles above<br />
Probably best sand In<br />
county, clean,<br />
noarsa-grained, gray<br />
quartz sand<br />
Concrete<br />
31<br />
Stekoa Creek, near Tallulah<br />
Falls road, 1 mi. S <strong>of</strong><br />
Clayton<br />
Fineness modulus <strong>of</strong><br />
2.59 and 76 per cent<br />
coarser than 48-mash<br />
32 Tiger Creek<br />
Stephens County<br />
Good, coarse-grained,<br />
white sand; ten per<br />
cent exceeds j| in. in<br />
size; coarser par<br />
ticles made up <strong>of</strong> 25<br />
per cent quartz rest<br />
schist and feldspar<br />
33<br />
A. number <strong>of</strong> points in Tugalo<br />
River<br />
Sand <strong>of</strong> excellent<br />
quality<br />
Concrete<br />
34<br />
North Broad River southward<br />
from Dick's Hill road<br />
Coarse-grained sand;<br />
fineness modulus <strong>of</strong><br />
1.93; 67 per cent<br />
coarser than 48-nesh<br />
Concrete<br />
2-4<br />
Towns County<br />
35<br />
io<br />
•7<br />
Along course <strong>of</strong> Hog Creek, 2<br />
mi. from Hiwassee on Clayton<br />
road<br />
Hiwassee Siver, from a point<br />
about 4 mi. SE <strong>of</strong> Hiwassee<br />
Bell, Mill, Scattaway, and<br />
Cabin Creeks<br />
Coarse sand and<br />
gravel . Sample<br />
showed fineness modu<br />
lus <strong>of</strong> 1.56 and 58<br />
per cent coarser than<br />
4-mesh<br />
Concrete aggregate<br />
Pairly good sand and<br />
gravel<br />
lr= —— |<br />
1 Sut*<br />
Concrete I Enca«riij<br />
II Eipirimtnt<br />
1 Surra, . . .<br />
Ctoqfa<br />
1 T"h<br />
I Induirill . .<br />
1! P ———— I.<br />
-99- I^L"" ' '
Table lf-52 (continued) Sand and Gravel<br />
o<br />
-P<br />
W<br />
i-i 0><br />
•SSf<br />
Is4<br />
O.CC<br />
38<br />
Highest peak <strong>of</strong> Bell Mountain<br />
Heavy-bedded white<br />
quartz which grades<br />
into a more impure<br />
granular guartzite.<br />
underlain by horn<br />
blende schist, over<br />
lain by garnetiferous<br />
rock<br />
Glass, lining<br />
furnaces, and<br />
flux<br />
Union County<br />
39<br />
Young Cane Creek, in SW part<br />
<strong>of</strong> county<br />
Bars <strong>of</strong> fairly good,<br />
coarse-grained sand<br />
Concrete<br />
40<br />
Nottely River, S <strong>of</strong> Blairs<br />
ville<br />
Some fine-grained<br />
sand deposited in<br />
small quantities<br />
tl<br />
Coosa Creek, 3 mi. S <strong>of</strong><br />
Blairsville<br />
Fairly good sand and<br />
gravel<br />
12<br />
Butternut Creek, 1 mi. HE <strong>of</strong><br />
Blairsville<br />
Small bars <strong>of</strong> very<br />
good sand and gravel<br />
43<br />
44<br />
White County<br />
Along course <strong>of</strong> Chattahoochee<br />
River<br />
Along Dukes Creek^ particu<br />
larly near the Helen-<br />
Cleveland road<br />
Much coarse sand and<br />
gravel<br />
Gravel<br />
ir^~^"~"<br />
State ....<br />
Experiment<br />
Station . . ,<br />
G7v£fl<br />
Industrial . .<br />
. . Economic<br />
RtKJrcb . .<br />
Sources Toas, L. p., Prelifflinary Report on the Sand and Gravel Deposlts<br />
<strong>of</strong> <strong>Georgia</strong>, <strong>Georgia</strong> Geological Survey, 3ul. 37, 1921,<br />
—100—
Timber<br />
Forest trees are one <strong>of</strong> the obvious natural resources <strong>of</strong><br />
the Northeast <strong>Georgia</strong> Area. Slightly over sixty-one per cent<br />
<strong>of</strong> .all the land is in forests. A somewhat smaller proportion<br />
<strong>of</strong> land ia faras is in woodland, 40.8 per cent. The Chattahooshse<br />
National Forest contains much <strong>of</strong> the best forest land<br />
in the Area. Th« Area has a somewhat higher proportion <strong>of</strong><br />
hardwoods than <strong>Georgia</strong> as a whole.<br />
State ....<br />
Engineering<br />
Experiment<br />
Station . . .<br />
Giorgla<br />
Tteh<br />
Industrial . .<br />
. . Economic<br />
Research . .<br />
The data in Table M-22 is taken from Forest Planning - <strong>Georgia</strong>, the<br />
only source which gives county totals. The more mountainous northern<br />
Bounties <strong>of</strong> Lumpkin, Dawson, Kftbun, Towns, Union, and White all have nore<br />
than eighty per cent <strong>of</strong> their total land area in forests. Counties with<br />
lass than half their land area in forests are Franklin, Ball, Jackson,<br />
Ifedison, Barrow, und Hart, while Forsyth has less than one third.<br />
Barrow county had the highest return per acre, $3.82, shown for 1937.<br />
Eabersham was second with J2.19 and Jfedison, third with $2.17, The only<br />
other county with a 1937 return above |2.00 was Franklin with |2.06 per<br />
acre. The fact that these four are among the better farming counties<br />
probably has significance, although one reason for the low returns shown<br />
Table 11-22<br />
land in Forests in the Northeast <strong>Georgia</strong> Area, 1937, by Counties<br />
Summary<br />
and<br />
Counties<br />
Area Total<br />
Banks<br />
Barrow<br />
Dawson<br />
Forsyth<br />
Franklin<br />
aabersham<br />
Ball<br />
Hart<br />
Jackson<br />
Lumpkin<br />
Ifedison<br />
Bibun<br />
Stephens<br />
Towns<br />
Onion<br />
Khite<br />
Total<br />
Land<br />
Area<br />
Acres<br />
2,739,200<br />
148,480<br />
108,800<br />
135,680<br />
154,880<br />
174,080<br />
180,480<br />
274,560<br />
163,200<br />
218,880<br />
177,920<br />
179,840<br />
236,800<br />
115,200<br />
110,080<br />
204,800<br />
155,520<br />
Total .<br />
Forest Area<br />
Acres<br />
1,693,543<br />
93,929<br />
41,127<br />
122,019<br />
48,803<br />
83,169<br />
123,381<br />
124,109<br />
55,801<br />
96.460<br />
161,298<br />
68,621<br />
208,295<br />
60,972<br />
96,044<br />
179,633<br />
129,882<br />
Per<br />
Cent<br />
61.8<br />
63.3<br />
37.8<br />
89.9<br />
31.5<br />
47.8<br />
68.4<br />
45.2<br />
34.2<br />
44.1<br />
90.7<br />
38.2<br />
38.0<br />
52.9<br />
87.3<br />
87.7<br />
83.5<br />
I/ind for Re<br />
forestation<br />
Acres<br />
152,323<br />
13,269<br />
12,561<br />
3,934<br />
2,798<br />
17,093<br />
9,173<br />
11,290<br />
8,203<br />
28,200<br />
7,396<br />
17,528<br />
4,776<br />
5,252<br />
2,477<br />
5,780<br />
2,593<br />
Per<br />
Cent2<br />
5.6<br />
8.9<br />
11.6<br />
2.9<br />
1.3<br />
9.8<br />
5.0<br />
4.1<br />
5.0<br />
12.9<br />
4.2<br />
9.8<br />
2.0<br />
4.6<br />
2.3<br />
2.8<br />
1.7<br />
Annual Value<br />
<strong>of</strong> Primary<br />
Forest Produots<br />
Total<br />
42,346,970 $1.39<br />
158,710<br />
157,110<br />
135,740<br />
94,600<br />
171,530<br />
270,050<br />
145,680<br />
78,400<br />
160,950<br />
168,130<br />
148,930<br />
179,770<br />
89,120<br />
98,450<br />
82,020<br />
207,730<br />
Per<br />
Acre<br />
1.69<br />
3.82<br />
1.11<br />
1.94<br />
2.0S<br />
2.19<br />
1.17<br />
1.40<br />
1.67<br />
1.04<br />
2.17<br />
0.86<br />
1.46<br />
1.03<br />
0.46<br />
1.60<br />
Source: <strong>Georgia</strong> Planning Board, Forest Planning, <strong>Georgia</strong>, 1939,<br />
pp. 42 and 43. Cols. 3 and 5, per cent <strong>of</strong> total land aeres'TTn each<br />
county.<br />
glncludes woodland in farms.<br />
Per Cent <strong>of</strong> total land acres in each county.<br />
—101—
in many <strong>of</strong> the othor oounties is probably that during 1937<br />
both the Chattahoochee national Forest and other large timber<br />
owners ware limiting cutting in order to accumulate standing<br />
timber. The figures for 1937, however, do indicate that oppor<br />
tunities to improve forest income by increased application <strong>of</strong><br />
maintained yield operations are possible.<br />
Table M-58 shows that 78.1 per cent <strong>of</strong> all standing timber<br />
in 193S was pine, chiefly loblolly and shortleaf.<br />
Sate<br />
Engineering<br />
Experiment<br />
Suci<strong>of</strong>l . . .<br />
Groraia<br />
Tid,<br />
Indnstriil . .<br />
. . Economic<br />
Retejicb . .<br />
The cutting and processing <strong>of</strong> timber, the production <strong>of</strong> pulpwood, the<br />
manufacture <strong>of</strong> consumer goods from timber and paper from pulpwood are the<br />
ways in which this natural resource can contribute to the economic growth<br />
<strong>of</strong> the Northeast <strong>Georgia</strong> Area.<br />
It is necessary to discuss much <strong>of</strong> the problem <strong>of</strong> forost use in tenas<br />
<strong>of</strong> all <strong>Georgia</strong> simply because census data on individual industry types are<br />
only occasionally available by counties and because much <strong>of</strong> the forest<br />
data are available only for large groups <strong>of</strong> counties, or for the state as<br />
a whole.<br />
Estimate <strong>of</strong> the total 1936 cutting in the Northeast <strong>Georgia</strong> Area and<br />
the amount <strong>of</strong> standing timber in the Area's forssts are shown in Tables<br />
Jt-26 and JJ-58. These estimates are calculated from Forest Service tables<br />
by multiplying by 33.74 per cent the results shown in the tables in<br />
<strong>Georgia</strong> Forest Resources and Industries. This figure represents .the per<br />
cent which the forests in the Northeast <strong>Georgia</strong> Area are <strong>of</strong> the total <strong>of</strong><br />
those in the counties in the Forest Service's North Central <strong>Georgia</strong> Unit<br />
in 1934 as shown in Forest Planning - <strong>Georgia</strong>, the only source which gives<br />
county totals.<br />
.<br />
More Processing Seeded: Logging and rough processing operations ara,<br />
<strong>of</strong> course, essential, but they result in much smaller total payrolls and<br />
less total pr<strong>of</strong>it to the<br />
Table lf-26<br />
Estimated Saw Timber Production for the<br />
Northeast <strong>Georgia</strong> Area, 1936<br />
Type <strong>of</strong><br />
Commodity<br />
Lumber<br />
Cross ties<br />
Poles and piles<br />
Veneer<br />
Cooperage<br />
Miscellaneous<br />
manufacturing<br />
Fuel wood<br />
Fence posts<br />
Domestic farm use<br />
Land clearing<br />
Total<br />
Pine<br />
11 B Ft.<br />
33,065<br />
236<br />
978<br />
34<br />
1,080<br />
27,228<br />
34<br />
2,193<br />
1,046<br />
65,894<br />
Hard<br />
wood<br />
11 B Ft.<br />
4,150<br />
877<br />
2,396<br />
675<br />
169<br />
5,027<br />
337<br />
202<br />
304<br />
14,137<br />
All Species<br />
Per<br />
Cent<br />
a B Ft.<br />
37,215<br />
1,113<br />
978<br />
2,396<br />
709<br />
1,248<br />
32,255<br />
371<br />
8,396<br />
1,350<br />
80,031<br />
46.50<br />
1.39<br />
1.23<br />
2.99<br />
0.89<br />
1.56<br />
40.30<br />
0.46<br />
3.00<br />
1.69<br />
100.00<br />
Source: Forest Service, Department <strong>of</strong> Agri<br />
culture, <strong>Georgia</strong> Forest Resources and Industries,<br />
Miscellaneous publication No. 501. Calculated<br />
from Table 53, page 67.<br />
--102--<br />
community than the suc<br />
ceeding steps which con<br />
vert these raw materials<br />
for final use in indus<br />
try and by the consuming<br />
public. Much <strong>of</strong> this<br />
conversion should logi<br />
cally be carried on in<br />
the Area.<br />
The Value <strong>of</strong> Prod<br />
uct produced for Geor<br />
gia by all plants in<br />
the sawmill, veneer<br />
mill, and cooperage<br />
stock industry in 1939<br />
was $18, 175,000. The<br />
cost <strong>of</strong> raw material<br />
was $8,183,000 and the<br />
Value Added 19,992,000.<br />
"Figures for indi<br />
vidual industries are<br />
published by the census<br />
for areas smaller than<br />
states in only a few<br />
cases.
This production was responsible for the payment <strong>of</strong> $4,754,000<br />
in nages and provided the management with a margin fund <strong>of</strong><br />
$5,238,000 for the payment <strong>of</strong> taxes, purely management sala<br />
ries, sales expense, and pr<strong>of</strong>it. These are sizable sums, but<br />
if the 418 nillion worth <strong>of</strong> rough lumber had all been processed<br />
further in <strong>Georgia</strong>, the added sales value would have been $40.3<br />
million. Of this, $22.7 million would have been Value Added,<br />
providing an additional sum <strong>of</strong> wages amounting to $13.5 million<br />
which would have been paid out in the state and a further margin <strong>of</strong> $9.2<br />
million which would have been disbursed in taxes, management, sales costs,<br />
and pr<strong>of</strong>it. Actually, in 1939, the total subsequent wood processing for<br />
<strong>Georgia</strong> fell far short <strong>of</strong> these figures. The actual 1939 processing, sumitarized<br />
from Tables 11-28 and It-29 shows a total Value <strong>of</strong> Product <strong>of</strong> only<br />
|22.5 million. The Wages and Salaries amounted to only $5.8 million, the<br />
Ifcrgin was $5.7 million and the Value Added $11.5 million.<br />
It is easily possible to more than doable the normal production <strong>of</strong><br />
timber in <strong>Georgia</strong> without endangering the future supply. The prevailing<br />
drain on the total growth is considerably more than twice the part going<br />
into lumber and pulpwood. This excess drain represents fire loss, mor<br />
tality, and other destruction <strong>of</strong> trees due to poor forest management.<br />
Since the rate <strong>of</strong> growth has for a number <strong>of</strong> years exceeded the total<br />
drain, elimination <strong>of</strong> half the losses due to fire and other causes would<br />
permit increasing the cut more than enough to provide raw materials for<br />
Tree<br />
Species-<br />
Groups<br />
Table It-58<br />
Ket Board-root Volume <strong>of</strong> Live Trees in Northeast <strong>Georgia</strong><br />
Area. 1936, (Green Lumber Tally Based on International<br />
j-Inch Rule) la the Various forest Conditions<br />
Pines<br />
Loblolly<br />
Shortleaf<br />
Longleaf2<br />
Total pines<br />
Hardwoods :<br />
Yellow-poplar<br />
Red gum.<br />
Black gum5<br />
Bed oaks<br />
White oaks<br />
Other hardwoods<br />
Total hardwoods<br />
Total all<br />
species<br />
Per Cent <strong>of</strong> total<br />
Old Growth<br />
Unout<br />
38,430<br />
25,305<br />
2,260<br />
65,995<br />
12,079<br />
7,693<br />
4,217<br />
6,343<br />
11,876<br />
14,711<br />
56,919<br />
122,914<br />
5.9<br />
Partly<br />
out<br />
21,557<br />
23,179<br />
13,328<br />
57,864<br />
12,619<br />
4,319<br />
4,656<br />
10,021<br />
10,763<br />
11,033<br />
53,411<br />
111,275<br />
5.3<br />
Second Growth<br />
Sawloe Size Partly Under<br />
Sawlog<br />
Uncut Cut 1 Slzei Total<br />
In Thousa. ads <strong>of</strong> Board-fe tl<br />
579,889<br />
453,432<br />
34,212<br />
1,067,633<br />
70,382<br />
37,856<br />
19,974<br />
33,268<br />
31,987<br />
51,116<br />
244,583<br />
1,312,116<br />
63.C<br />
176,966<br />
181,892<br />
9,818<br />
368,676<br />
21,088<br />
11,472<br />
3,374<br />
17,106<br />
17,207<br />
13,968<br />
84,215<br />
452,891<br />
21.7<br />
34,347<br />
27,633<br />
4,791<br />
66,771<br />
4,386<br />
1,316<br />
1,147<br />
3,172<br />
2,733<br />
5,027<br />
17,781<br />
84,552<br />
4.1<br />
850,989<br />
711,441<br />
64,409<br />
1,626,839<br />
120,554<br />
62,656<br />
33,368<br />
69,910<br />
74,566<br />
95,855<br />
456,909<br />
2^083,748<br />
100.0<br />
Source: A. R. Spillers, Forest Resources <strong>of</strong> North Central <strong>Georgia</strong>,<br />
Forest Survey Release, No. 44, The Southern Forest Experiment Station,<br />
Hew Orleans, La., Table 6, page 12.<br />
^'Includes the reproduction and clear-cut condition.<br />
BAnd other.<br />
And tupelo.<br />
—103--<br />
Per<br />
Cent<br />
<strong>of</strong><br />
TotU<br />
40.9<br />
34.1<br />
3.1<br />
78.1<br />
5.8<br />
3.0<br />
1.6<br />
3.3<br />
3.6<br />
4.6<br />
21.9<br />
100.0
Table U-23<br />
Produotira Fbrest Areas In »orth
Shortleaf-loblolly<br />
hardwoods<br />
Old growth i<br />
Uncut<br />
Partly out<br />
Total<br />
Second growtht<br />
Sawlog size i<br />
Vncut<br />
Partly out<br />
Under sawlog size<br />
Reproduction<br />
Total<br />
Clear out<br />
H o All conditions<br />
7,300<br />
6,500<br />
13,800<br />
118,400<br />
86,300<br />
265,400<br />
33,300<br />
502,400<br />
--<br />
516,200<br />
1.4<br />
1.3<br />
2.7<br />
22.7<br />
16.6<br />
51.4<br />
6.6<br />
97.3<br />
—<br />
100.0<br />
7.1<br />
4.7<br />
5.7<br />
18.1<br />
17.5<br />
23.2<br />
19.1<br />
20.4<br />
19.1<br />
102,600<br />
138,700<br />
241,300<br />
655,900<br />
487,000<br />
1,143,100<br />
173,900<br />
2,469,900<br />
7,200<br />
2,708,400<br />
All types<br />
Old growth i<br />
Unout<br />
Partly out<br />
Total<br />
Second growtht<br />
Sawlog size:<br />
Unout<br />
Partly out<br />
Under sawlog size<br />
Reproduction<br />
Total<br />
Clear out<br />
All conditions<br />
50,300<br />
77,100<br />
127,400<br />
797,700<br />
437,400<br />
1,084,200<br />
98,200<br />
2,417,600<br />
4,100<br />
2,549,000<br />
2.0<br />
3.0<br />
5.0<br />
31,3<br />
17.1<br />
42.5<br />
3.9<br />
94.8<br />
0.2<br />
100.0<br />
5.1<br />
4.9<br />
5.0<br />
12.6<br />
17.7<br />
14.0<br />
8.8<br />
13.7<br />
0.6<br />
12.1<br />
990,100<br />
1,564,700<br />
2,554,803<br />
6,334,900<br />
2,477,600<br />
7,732,600<br />
1,112,000<br />
17,657,000<br />
823,700<br />
21,035,500<br />
Sourcei A. R. Splllers, <strong>Georgia</strong> Forest Resources and Industries, Itisoellaneous Publication No, 501, The<br />
Southern Forest Experiment Station, Hew Orleans, La., Table 33, pages 44 and 45.<br />
1Per eent''<strong>of</strong> Georeia total for forest condition. Col. 4,<br />
ra w » cr a<br />
r— n cr rrm "-d<br />
i<br />
WH-rftJO* H-O.BW Wg<br />
tNrt-{P»0 OO H-ci- >r3P<br />
B*tr« *o&,»i wo *tfow<br />
*"* B>^>oo6g. OH-OI'M eaaooorrcMp'dorol-j'pF.cD H- 5* % S. 3 o I<br />
tf PO.g4O
Graph lf-24-25<br />
Production and Consumption <strong>of</strong> Limber<br />
Sf<strong>Georgia</strong>, 1922-j.s35~<br />
1936<br />
1934<br />
1932<br />
All lumber groim<br />
in <strong>Georgia</strong><br />
All lumber consumed<br />
ia <strong>Georgia</strong><br />
Lumber grown in<br />
<strong>Georgia</strong> which is<br />
also consuced in<br />
<strong>Georgia</strong><br />
1930<br />
1928<br />
1926<br />
1S24<br />
1922<br />
300,000 600,000 900,000 1,200,000 1,500,000<br />
--106--<br />
II feet b.m.
on rough lumber. This tends to limit the distance over which a<br />
plant can pr<strong>of</strong>itably ship by rail, and may as a result, make it<br />
unpr<strong>of</strong>itable to attempt to compete with High Point for the con<br />
centrated markets in the Bast. Ibny firms in these fields em<br />
ploy their own trucks for shipments up to four or five hundred<br />
miles. This procedure might be pr<strong>of</strong>itable over even greater<br />
distances if a return cargo <strong>of</strong> as much as half a load could be<br />
contracted for. Some difficulty in finding such a contract car<br />
State ....<br />
Eniinnrinf<br />
Experiment<br />
Station . . .<br />
<strong>Georgia</strong><br />
Tec*<br />
fadaitiul . .<br />
. . Economic<br />
Research . .<br />
go Kith sufficient uniformity <strong>of</strong> load and destination would be expected,<br />
and relatively few manufacturers may find this device practical. Where, as<br />
is only occasionally the case, the product is relatively heavy, this prob<br />
lem becomes less acute. The freight rate is somewhat lower, and the<br />
Graph M-2U, 25a<br />
Lumber Distribution and Consumption, <strong>Georgia</strong>, 1936<br />
Total Produced - 876,863<br />
Produced<br />
in <strong>Georgia</strong> Elsewhere<br />
T Produced<br />
Export - 10)3,7U3<br />
All Lumber<br />
Consumed in <strong>Georgia</strong>] - 526,066<br />
Produced in <strong>Georgia</strong> -<br />
Import<br />
______U33.1ZO<br />
1<br />
<strong>Georgia</strong> - W,035 I—<br />
Export -<br />
rgia - 60,500<br />
«— Import -<br />
J 1S,U65<br />
iiio 200 o 260<br />
11 feet b.m.
greater ratio <strong>of</strong> weight to volume makes the cargo more attrac<br />
tive to common carrier trucks and even to barges and coastwise<br />
boats. TTater transportation does not find light bulky cargo at<br />
tractive, and, in consequence, their rate structures do not<br />
favor this class <strong>of</strong> goods.<br />
Table U-2l*<br />
Distribution <strong>of</strong> Lumber Produced in <strong>Georgia</strong> by Destina<br />
tion foj-nseieeted Years, 1922 to 1936, In Total and<br />
by_ Types i£ Thousands <strong>of</strong> Feet Board Measure<br />
All Lumber<br />
Luicber grown In<br />
<strong>Georgia</strong> and<br />
shipped to:<br />
<strong>Georgia</strong><br />
,Vew England<br />
SJiddle Atlantic<br />
Lakes<br />
Central<br />
Prairie<br />
South Atlantic<br />
East Gulf<br />
Lower Mississippi<br />
North Pacific<br />
South Pacific<br />
Kortli Rocky llountain<br />
Foreign (exports):<br />
To Canada<br />
To other foreign<br />
Unspecified<br />
Total distribution<br />
<strong>Georgia</strong><br />
New England<br />
Kiddle Atlantic<br />
Lakes<br />
Central<br />
Prairie<br />
South Atlantic<br />
East Gulf<br />
Lower Jlississiopi<br />
North Pacific<br />
South Pacific<br />
Ncr'h Rocky Mountain<br />
Foreign (exports):<br />
To Canada<br />
To other foreign<br />
Unspecified<br />
Total distribution<br />
1922<br />
U feet b.n.<br />
196,123<br />
100,983<br />
1*72,088<br />
33,570<br />
181,305<br />
1,975<br />
10l*,827<br />
258,861<br />
1*1*9<br />
3,105<br />
—<br />
—<br />
—<br />
—<br />
5,235<br />
1,162,758<br />
1930<br />
21!;, 671<br />
1*3,366<br />
31*0,983<br />
20,573<br />
112,11*3<br />
522<br />
51*,193<br />
225,679<br />
1,861*<br />
—<br />
71*1*<br />
—<br />
1,733<br />
21,181<br />
—<br />
822,899<br />
192k<br />
M feet b.m.<br />
33li,689<br />
96,1,90<br />
1*88,701*<br />
31,377<br />
011,773<br />
561*<br />
132,655<br />
1*99,097<br />
—<br />
———<br />
—<br />
—<br />
1*,1*06<br />
1,365,516<br />
1932<br />
90,391<br />
• 27,336<br />
115,1*36<br />
15,1*01*<br />
39,109<br />
1*23<br />
U*,l«7<br />
98,251<br />
—<br />
266<br />
663<br />
—<br />
18<br />
8,179<br />
—<br />
319,562<br />
1926<br />
M feet b.m.<br />
361*, 305<br />
50,696<br />
636,070<br />
1*1,507<br />
122,987<br />
—<br />
11*0,751<br />
1*81,672<br />
—<br />
———<br />
—<br />
—<br />
8,718<br />
1,1*82,1*01<br />
1931*<br />
136,51*1*<br />
11*,06U<br />
191,81*6<br />
l*l*,l*l*2<br />
97,989 56<br />
23,91*0<br />
11*3,029<br />
—<br />
_<br />
1,918<br />
—<br />
—<br />
1*,509<br />
—<br />
521,793<br />
Su» ....<br />
Engineering<br />
Experiment<br />
Sution . . .<br />
<strong>Georgia</strong><br />
Ttcfc<br />
Industrial . .<br />
. . Economic<br />
Research . .<br />
1928<br />
11 feet b.m.<br />
296,531<br />
126,550<br />
1*62,92<br />
51*, 351*<br />
212,811*<br />
273<br />
113,030<br />
303,938<br />
112<br />
156<br />
—<br />
118<br />
11,019<br />
23,181<br />
—<br />
1,313,1*72<br />
1936<br />
1*33,120<br />
37,192<br />
163,201*<br />
31,135<br />
11*1*, 302<br />
789<br />
51*, 897<br />
1*1*1*. 903<br />
Ulil<br />
_<br />
——<br />
—<br />
——<br />
876,863<br />
Source: E. 7. Reynolds, A. H. Pierson, Forest Products Statistics<br />
<strong>of</strong> the Southern States, U. S. Dept. <strong>of</strong> Agriculture, Statistical<br />
Bulletin No. 69, June 1939, op. 1*3, 1*1*.<br />
"Includes <strong>Georgia</strong>.<br />
—108—
Sales Costsi Lower sales costs nay be expected from deal-<br />
Ing with a more compact market. Small size plants can frequent<br />
ly arrange with a few outlets to handle their entire production,<br />
thereby making unnecessary a more elaborate sales organization<br />
to deal with a large number <strong>of</strong> customers.<br />
Ectent <strong>of</strong> Forests» Hie fact that about 78 par cent <strong>of</strong> the<br />
forests in tKe" Area are in pine, mostly slash and longleaf, has<br />
perhaps caused the Area to concentrate on the less pr<strong>of</strong>itable parts <strong>of</strong> the<br />
timber market. Much <strong>of</strong> the Area production has gono into rough lumber for<br />
Lumber grown in<br />
<strong>Georgia</strong> and<br />
shipped to:<br />
Seorgia<br />
Table M-2l* (continued)<br />
Table M-2U, Distribution <strong>of</strong> Lumber Produced In <strong>Georgia</strong><br />
lew England<br />
addle Atlantic<br />
jkes<br />
Central<br />
Prairie<br />
South Atlantic<br />
Bast Gulf1<br />
Lower Mississippi<br />
North Pacific<br />
South pacific<br />
lorth Rocky Mountain<br />
Foreign (exports):<br />
To Canada<br />
To other foreign<br />
Onspecified<br />
Total distribution<br />
<strong>Georgia</strong><br />
dew England<br />
Middle Atlantic<br />
.akes<br />
Central<br />
Prairie<br />
South Atlantic<br />
tast Gulf *<br />
Lower Mississippi<br />
North Pacific<br />
louth Pacific<br />
!orth Hocky Mountain<br />
Foreign (exports):<br />
To Canada<br />
To other foreign<br />
Unspecified<br />
Total distribution<br />
1922<br />
M feet b.m.<br />
185,127<br />
95,662<br />
129,159<br />
32,516<br />
163,671*<br />
1,902<br />
99,1*59<br />
21.6,501*<br />
293<br />
3,1*15<br />
—<br />
—<br />
—<br />
—<br />
2,1*1*8<br />
1,075,232<br />
1930<br />
199,621<br />
38,531*<br />
315,725<br />
19,750<br />
89,51*2<br />
522<br />
23,086<br />
210, 3l
uilding purposes. Some <strong>of</strong> this lumber, when exported, has been —<br />
further processed elsewhere and may even have been returned to |«£»tiini<br />
the Area in the fora <strong>of</strong> finished lumber or consumer goods. Experiment<br />
Tables M-24 and It-25 show the geographic distribution <strong>of</strong> lumber Stlc«r';«''<br />
sales for the <strong>Georgia</strong> cut and the sources from which lumber used 7>rf!°<br />
in <strong>Georgia</strong> are drawn. '"^Ecotonk<br />
Rocucb<br />
<strong>Georgia</strong> is apparently supplying the bulk <strong>of</strong> the timber •—<br />
actually used within the state. In 1922, the total imports shown in Table<br />
M-25 were 93,118 thousand ioard feet. For 1936, the same figure was<br />
92,946 thousand board feet. In 1922, however, the total was divided ioto<br />
approximately one-third s<strong>of</strong>twoods , and two-thirds hardwoods. By 1936,<br />
Table M-21* (continued)<br />
Table M-21*, Distribution <strong>of</strong> Lumber Produced in <strong>Georgia</strong><br />
Lunber grown in<br />
<strong>Georgia</strong> and<br />
shipped to:<br />
<strong>Georgia</strong><br />
New England<br />
Kiddle Atlantic<br />
Lakes<br />
Central<br />
Prairie<br />
South Atlantic<br />
East Gulf1<br />
Lower Kississippi<br />
North Pacific<br />
South Pacific<br />
Foreign (exports):<br />
To Canada<br />
To other foreign<br />
Unspecified<br />
Total distribution<br />
<strong>Georgia</strong><br />
New England<br />
Middle Atlantic<br />
Lakes<br />
Central<br />
Prairie<br />
South Atlantic<br />
East Gulf1<br />
Lower Mississippi<br />
North Pacific<br />
South Pacific<br />
Foreign (exports):<br />
Tc Canada<br />
To other foreign<br />
Unspecified<br />
Total distribution<br />
1922<br />
M feet b.m.<br />
11,001<br />
5,321<br />
142,929<br />
1,051*<br />
I7,lt3i<br />
73<br />
5,368<br />
12,357<br />
156<br />
—<br />
—<br />
—<br />
—<br />
2,837<br />
87,526<br />
1930<br />
15,050<br />
U.832<br />
25,258<br />
828<br />
22,601<br />
—<br />
31,112<br />
15,33k<br />
37<br />
——<br />
650<br />
900<br />
7,552<br />
—<br />
109,101;<br />
—110—<br />
Hardwood Lumber<br />
1921*<br />
M feet b.m.<br />
1*1,205<br />
3,091<br />
23,273<br />
2,679<br />
36,151*<br />
—<br />
7,1*06<br />
U3.383<br />
—<br />
—<br />
—<br />
—<br />
2,886<br />
118,872<br />
1932<br />
6,753<br />
3,976<br />
7,880<br />
761*<br />
1*,700<br />
35<br />
6,800<br />
6,990<br />
—<br />
_<br />
663<br />
18<br />
7,898<br />
—<br />
39,721*<br />
1926<br />
M feet b.m.<br />
37,035<br />
2,797<br />
1*2,529<br />
3,871<br />
17,912<br />
—<br />
- 15,1*16<br />
1*1,205<br />
—<br />
—<br />
—<br />
—<br />
3,936<br />
127,666<br />
1931*<br />
12,1*85<br />
1,899<br />
18,536<br />
1,158<br />
1*,561*<br />
56<br />
19,685<br />
13,022<br />
—<br />
„ _<br />
1,918<br />
__<br />
It, 509<br />
65,31.7<br />
1928<br />
U feet b.m<br />
1*2,11*1*<br />
9,917<br />
1*1,1.58<br />
9,1*75<br />
1*1*, 372<br />
11*5<br />
28,369<br />
I*3,7li9<br />
61*<br />
_<br />
9,371<br />
23,12<br />
—<br />
210,01*2<br />
1936<br />
1*2,035<br />
199<br />
3,01*1<br />
867<br />
25,399<br />
1*1*, 900<br />
1*2,617<br />
—<br />
__<br />
__<br />
_<br />
_—<br />
117,023
this internal distribution <strong>of</strong> <strong>Georgia</strong>'s timber imports had be<br />
come about one-tenth s<strong>of</strong>twoods and nine-tenths hardwoods. In<br />
1935, <strong>Georgia</strong> consumed almost half <strong>of</strong> all the timber out in the<br />
state.<br />
Hardwoods Are Important> Khile pines are the major type<br />
<strong>of</strong> tree found in the forests <strong>of</strong> the Northeast <strong>Georgia</strong> Area, the<br />
hardwoods are important. Table tt-58 shows that 78.1 per cent <strong>of</strong><br />
Table 11-25<br />
. for<br />
Statt ....<br />
Experiment<br />
Station . . .<br />
Groegia<br />
TnA<br />
lodutrul . .<br />
.. Ei<br />
Rourch .<br />
Lumber shipped<br />
to <strong>Georgia</strong><br />
and grown in:<br />
<strong>Georgia</strong><br />
New England<br />
Middle Atlantic<br />
Lakes<br />
Central<br />
South Atlantic<br />
East Gulf1<br />
Lower Mississippi<br />
North Pacific<br />
South Pacific<br />
North Rocky Mountain<br />
Foreign (imports):<br />
From Canada<br />
Total consumption<br />
Per Capita, feet<br />
<strong>Georgia</strong><br />
New England<br />
Middle Atlantic<br />
Lakes<br />
Central<br />
South Atlantic<br />
East Gulf1<br />
£o»2i- Mississippi<br />
North Pacific<br />
South' Pacific<br />
(forth Rocky Mountain<br />
Foreign (imports):<br />
From Canada<br />
Total consumption<br />
Per Capita, feet<br />
All Lumber<br />
1922<br />
1921* 1926 1928<br />
121 ,_<br />
__ _<br />
28U.958 122,822 185,660 526,066<br />
98 1*2 6U 172<br />
M feet b.m. 11 feet b.m. M feet b.ra. M feet b.m.<br />
• 196,128 33li,689 36!i,305 296,531<br />
_<br />
758 _<br />
— _ ~29U<br />
21* 1*82<br />
987<br />
1,1*66<br />
626 1,0X3<br />
61i6<br />
15,870 8,U18 3,992 12,87!i<br />
263,71*6 39U.S53 l»19,02li 396.5U5<br />
7,1.85<br />
8,1*1*5 16,025 9,3l»9<br />
510<br />
1*60<br />
86<br />
533<br />
11*5 Iii6 351 1,350<br />
___<br />
_<br />
__. _<br />
289.2U6 1OU,1S8 UO.,656 1*21,591<br />
100<br />
1143<br />
152<br />
UiS<br />
1930 2U*,671 1932<br />
90,391 1931* 136,5Ui 1936<br />
B3.120<br />
__ _<br />
~570<br />
2<br />
—<br />
U22<br />
72 376<br />
• 6U<br />
2U6<br />
2,597 127<br />
152 11,911<br />
10,709<br />
739 1U.817 36,515<br />
266,1*61; 118,320 165,316 1*67,726<br />
2,373 l,kSk 2,878 5,81*7<br />
1,519<br />
879 I,3li3 2,761*<br />
1,103<br />
1;7S<br />
520<br />
958<br />
,__<br />
57<br />
Source: R. V. Reynolds, A. H. Pierson, Forest Products Statistics<br />
Jf the Southern States . " u. t>. " itept. . or . Agriculture, . . . Statistical Bulletin<br />
'o.~i$9,- June 1939, pp. 59, 60.<br />
Includes <strong>Georgia</strong> •<br />
—111—
the standing timber in the Area's forests are pines and other<br />
conifers and 21.9 per cent, hardwoods. Oaks and yellow poplar<br />
are the predominant types. The standing volume <strong>of</strong> old growth<br />
hardwoods, 110,330 thousand feet is slightly exceeded by the<br />
123,359 thousand feet <strong>of</strong> pine and other conifers.<br />
Stale ....<br />
Engnittruif<br />
Eip.rimtat<br />
Station . . .<br />
G«orjr«<br />
Ttrf,<br />
Indutriil . .<br />
. . Economic<br />
Rorarcb .<br />
The hardwood second growth timber was reported as 244,583<br />
thousand board feet which was in uncut areas and 84,215 thou- ,____ —<br />
sand board feet in partly cut areas. There was also a total <strong>of</strong> 17,731<br />
thousand board feet <strong>of</strong> second growth hardwood described as not <strong>of</strong> saw-loir<br />
size.<br />
6<br />
Lumber shipped<br />
to <strong>Georgia</strong><br />
and grown in:<br />
<strong>Georgia</strong><br />
New England<br />
Lakes<br />
Central<br />
South Atlantic<br />
East Gulf1<br />
Lower Mississippi<br />
North Pacific<br />
South Pacific<br />
North Rocky Mountain<br />
Foreign (imports):<br />
From Canada<br />
Total consumption<br />
Per Capita, feet"<br />
<strong>Georgia</strong><br />
New England<br />
Lakes<br />
Central<br />
South Atlantic<br />
East Gulf1<br />
Lower Mississippi<br />
Worth Pacific<br />
South Pacific<br />
forth Rocky Mountain<br />
Foreign (imports):<br />
Froa Canada<br />
Total consumption<br />
er Capita, feet"<br />
Table 11-25 (continued)<br />
Table It-25, Consumption <strong>of</strong> Lumber in <strong>Georgia</strong><br />
S<strong>of</strong>twood Lumber<br />
1922<br />
1921* 1926<br />
101 _^ _<br />
263,363 113,865 170,1*11*<br />
91 39 59<br />
M feet b.m. 185,127 M feet b.m. 293, l*8U V. feet b.m.<br />
327,270<br />
__ 758<br />
— 395<br />
——.<br />
122<br />
9,779 l*,70l* 1,939<br />
150,555 31*5,989 379,975<br />
5,857 6,760 11*,520<br />
510<br />
1*60<br />
86<br />
11*5<br />
11*6 351<br />
_<br />
_,^<br />
178<br />
_<br />
„__<br />
267,214! 358,817 397,171<br />
92<br />
12lt<br />
137<br />
1930 199,621 1932<br />
83,633 1931*<br />
12U,059<br />
_<br />
__<br />
__ 87 _<br />
10,6<br />
_<br />
9,951 510 11*,063<br />
21*9,032 110,663 152,158<br />
1,211 1,251 2,330<br />
1,519<br />
879 I,3li3<br />
1,103<br />
1*75<br />
520'<br />
_._<br />
1928<br />
11 feet b.m.<br />
251* ,387<br />
25<br />
6^996<br />
352,000<br />
8,139<br />
533<br />
1,350<br />
371,01*3<br />
128<br />
1936<br />
391,085<br />
_<br />
_<br />
35,573<br />
1*22,631<br />
3,583<br />
2,761*<br />
958<br />
57<br />
_<br />
1*65,565<br />
152<br />
1 Includes <strong>Georgia</strong>. _<br />
—112—
More Value Can Be Realized; While the $2,346,970 shown in<br />
Table M-S2 represents~only the value <strong>of</strong> lo£s and pulpwood, and<br />
does not include any subsequent value added through further<br />
processing, the variation in the average return per acre from<br />
county to county, apparently points to the conclusion that the<br />
value <strong>of</strong> primary forest products is much less than it should be<br />
By dividing.the total annual value <strong>of</strong> primary forest products<br />
shown in column 6 <strong>of</strong> Table M-22bythe number <strong>of</strong> acres in forest<br />
Sou ....<br />
Engineering<br />
Experiment<br />
Station . . .<br />
<strong>Georgia</strong><br />
TKh<br />
Industrial . .<br />
. . Economic<br />
Research . .<br />
(column 2), an average <strong>of</strong> $1.89 an acre results. In contrast with this,<br />
the same calculation for Barrow county results in an average <strong>of</strong> $3.82 per<br />
acre, -while for Union county, the result is only $0.46 per acre. If the<br />
Area average were increased to •squal the Barrow county rate, the $2,346,970<br />
estimated by the Forest Service would increase 2.26 times this amount or<br />
|5,304,152. Compared with estimates for sustained yield operations which<br />
have been made by the Forest Service, even this Barrow county average ap<br />
pears low when considered as a goal.<br />
Table M-25 (continued)<br />
Lumber shipped<br />
to <strong>Georgia</strong><br />
and grown in:<br />
<strong>Georgia</strong><br />
New England<br />
saddle Atlantic<br />
Lakes<br />
Central<br />
South Atlantic<br />
East Gulf1<br />
Lower Mississippi<br />
Foreign (imports):<br />
From Canada<br />
Total consumption<br />
Per Capita, feet<br />
<strong>Georgia</strong><br />
New England<br />
Middle Atlantic<br />
Lakes<br />
Central<br />
South Atlantic<br />
East Gulf1<br />
Lower Mississippi<br />
Foreign (imports):<br />
From Canada<br />
Total consumption<br />
Per Capita, feet<br />
•"•Includes <strong>Georgia</strong>.<br />
Table 11-2$, Consumption <strong>of</strong> Lumbar in <strong>Georgia</strong><br />
1922<br />
M feet b.n.<br />
11,001<br />
—<br />
———<br />
2k<br />
1,071<br />
6,091<br />
13,191<br />
1,628<br />
__<br />
22,005<br />
8<br />
1930<br />
15,050<br />
—<br />
_ —<br />
72<br />
2,151<br />
758<br />
17,1*32<br />
1,162<br />
20<br />
21,595<br />
7<br />
—113--<br />
Hardwood Lumber<br />
1921* 1926<br />
M feet b.ra. M feet b.m.<br />
1*1,205 37,035<br />
—<br />
—<br />
———<br />
—— Ii82<br />
665<br />
626 1,013<br />
3,711* 2,053<br />
1*8, 861* 39,01*9<br />
1,685 1,505<br />
»<br />
——<br />
55,371 1*1*,1*85<br />
19<br />
15<br />
1932<br />
1931*<br />
6,753 12,1*85<br />
1*22<br />
570<br />
. 289<br />
6k<br />
127<br />
152<br />
229<br />
751.<br />
7,657 13,158<br />
233<br />
51*8<br />
——<br />
•—-<br />
8,957 I5,2lt6<br />
3 5<br />
1928<br />
M feet b.m.<br />
1*2,11*1*<br />
—<br />
—<br />
269<br />
61*6<br />
3,878<br />
1*1*, 51*5<br />
1,210<br />
——<br />
5o,5U8<br />
17<br />
1936<br />
1*2,035<br />
2<br />
"286<br />
11,911<br />
91*2<br />
U5,095<br />
2,261*<br />
• ——<br />
60,500<br />
20
II<br />
3 = i<br />
" :lil!<br />
T3 t ;T ^<br />
*' 51 nlol ml<br />
fi5[ti<br />
C|M|<br />
PI5 t<br />
B |tn<br />
ml<br />
rf<br />
3<br />
£<br />
Pu<br />
n<br />
§^<br />
CO £<br />
O Vt O<br />
O O -P<br />
§ 1 «*<br />
r- 1 CM O o<br />
« 0 fct 3<br />
> P- *CJ<br />
(0 I<br />
£ w*d<br />
0><br />
ic<br />
a QO<br />
V T3<br />
3 G)<br />
rH TJ<br />
^ i-S<br />
£°£.g<br />
(0<br />
n ^<br />
O T3 f-<br />
eo<br />
J<br />
•a - CM CM CO r-l O<br />
NO f>- NO \O CO rH<br />
«* • rt<br />
C-- CM CM CO r-l O<br />
NO f>- NO VOCO rH<br />
«-» rH fH H H CM<br />
"^ O CM -Zt rH CM<br />
rH H rH H rH~<br />
O-=I tA CM r- CM<br />
CO O -J CO r-!CO<br />
CM m CM CM f\
Table M-28<br />
Census Data for United States, Southeast and Southeastern 5taV.es for<br />
Forest Product'Industries Producing; II Seiai'-finihed<br />
'Pfoduc'ts"and Rough'fndusfrial Ooods for 1939<br />
1939 Census<br />
In Thousands <strong>of</strong> Dollars<br />
Value per $100 <strong>of</strong> Payroll 1<br />
Industry<br />
and<br />
Area<br />
Wages<br />
and<br />
Salaries<br />
Value <strong>of</strong><br />
Product<br />
Cost <strong>of</strong><br />
Material<br />
Value<br />
Added<br />
Margin<br />
Wages<br />
and<br />
Sala<br />
ries<br />
Value<br />
<strong>of</strong><br />
Pro<br />
duct<br />
Cost<br />
<strong>of</strong> Ma<br />
terial<br />
Value<br />
Added<br />
Mar<br />
gin<br />
O)<br />
I<br />
Planing Mills<br />
United States<br />
Southeast<br />
<strong>Georgia</strong><br />
$80,395<br />
11*, 356<br />
1,753<br />
$320,6llt<br />
70,211<br />
10,282<br />
$177,735<br />
lt2,3U3<br />
6,315<br />
$11)2,879<br />
27,909<br />
2,1814<br />
$62,1,81,<br />
13,5.53<br />
2,937<br />
100<br />
100<br />
100<br />
$399<br />
1*89<br />
587<br />
$221<br />
295<br />
362<br />
$178<br />
19U<br />
225<br />
$78<br />
93<br />
125<br />
Plywood Ullls<br />
Unitsd States<br />
Southeast<br />
Cooperage<br />
United States<br />
Southeast<br />
<strong>Georgia</strong><br />
11,591;<br />
1,661<br />
8,205<br />
352<br />
72<br />
38,879<br />
5,633<br />
38,261<br />
1,670<br />
5U3<br />
18,325<br />
2,593<br />
2lj,3l8<br />
1,111<br />
Ii03<br />
20.55U<br />
3,01*1<br />
13,9U3<br />
560<br />
lUO<br />
8,960<br />
1,380<br />
5,738<br />
208<br />
68<br />
100<br />
100<br />
100<br />
100<br />
100<br />
335<br />
339<br />
1,66<br />
Irtli<br />
751,<br />
158<br />
156<br />
1<br />
296<br />
316<br />
560<br />
177<br />
183<br />
170<br />
159<br />
19U<br />
77<br />
83<br />
70<br />
59<br />
9U<br />
Cigar Boxes, Wooden<br />
and Part Wooden<br />
United States<br />
Southeast<br />
2.53U<br />
579<br />
6,331<br />
l,3Ut<br />
2,1*83<br />
510<br />
3.8U8<br />
833<br />
1,311,<br />
25U<br />
100<br />
100<br />
250<br />
232<br />
98<br />
88<br />
152<br />
lUli<br />
52<br />
W*<br />
Wood Preserving<br />
United States<br />
Southeast<br />
<strong>Georgia</strong><br />
11.77U<br />
2,385<br />
397<br />
106,295<br />
21,610<br />
3,622<br />
77.U77<br />
15,620<br />
2,791<br />
28,818<br />
5,989<br />
831<br />
17,Ol»U<br />
3,601,<br />
li3U<br />
(continued on p. 116.)<br />
100<br />
100<br />
100<br />
903<br />
906<br />
912<br />
658<br />
671<br />
703<br />
2U5<br />
252<br />
209<br />
Ilt5<br />
152<br />
109
Table U-2ft (continued)<br />
H<br />
H<br />
O)<br />
I<br />
I<br />
Industry<br />
and<br />
Area<br />
Wooden Boxes,<br />
except Cigar<br />
United States<br />
Southeast<br />
Qsorgla<br />
Baskets for Fruits<br />
and Vegetables<br />
United States<br />
Southeast<br />
<strong>Georgia</strong><br />
Rattan and<br />
Willoimare<br />
United States<br />
Southeast<br />
Excelsior<br />
United States,<br />
Southeast<br />
Census Data for United States, Southeast and Southeastern States for<br />
Forest Product Industries Producinni II Somi-finished<br />
Products and RouKh Indus_trial goods for'1939<br />
Wages<br />
and<br />
Salaries<br />
$23,3W*<br />
5.U35<br />
1,222<br />
5,286<br />
1,130<br />
191<br />
1,381<br />
61<br />
1939 Census<br />
In Thousands <strong>of</strong> Dollars<br />
Value <strong>of</strong><br />
Product<br />
987,35k<br />
19,963<br />
It, 102<br />
1U,286<br />
2,867<br />
U21.<br />
3,918<br />
217<br />
872 2,987<br />
69 32U<br />
Cost <strong>of</strong><br />
Material<br />
&5,757<br />
9.U05<br />
1,655<br />
5.7U9<br />
1,239<br />
132<br />
1.67U<br />
113<br />
1,382<br />
179<br />
Source: U. S. Census, Manufactures, 19UO.<br />
Value<br />
Added<br />
31)1,597<br />
10,559<br />
2.W.8<br />
8,538<br />
1,630<br />
293<br />
2.2M<br />
10U<br />
1,606<br />
lliU<br />
Margin<br />
Value per 0100 <strong>of</strong> Payroll*<br />
Wage:) Value<br />
and <strong>of</strong> Cost<br />
Sala Pro <strong>of</strong> Ma Value<br />
ries duct terial Added<br />
1<br />
$100 »371i $196 $178<br />
100 367 173 19h<br />
100 336 135 200<br />
100 270 109 162<br />
100 25U 110 lltlt<br />
100 222 69 153<br />
863 100 28U 121 162<br />
1»3 100 356 185 170<br />
73k 100 3U3 158 18U<br />
75 100 1»70 259 209<br />
418,253<br />
5,121;<br />
1,226<br />
3,252<br />
500<br />
102<br />
Mar<br />
gin<br />
$78<br />
9h<br />
100<br />
62<br />
Ut<br />
53<br />
62<br />
70<br />
8U<br />
109
Table M-29<br />
Census Data for United States, Southeast and Southeastern<br />
States for Forest Product Industries Producing;<br />
III Consumer Goods for 1939<br />
1939 Census<br />
In Thousands <strong>of</strong> Dollars<br />
Value per $100 <strong>of</strong> Payroll 1<br />
Industry<br />
and<br />
Area<br />
Household Furniture<br />
United States<br />
Southeast<br />
<strong>Georgia</strong><br />
Upholstered Household<br />
Furniture<br />
United States<br />
Southeast<br />
<strong>Georgia</strong><br />
Office Furniture<br />
United States<br />
Southeast<br />
Caskets, C<strong>of</strong>fins,<br />
Burial Cases, etc.<br />
United States<br />
Southeast<br />
<strong>Georgia</strong><br />
Wood Products<br />
United States<br />
Southeast<br />
<strong>Georgia</strong><br />
Wages<br />
and<br />
Salaries<br />
$101,, 519<br />
17,393<br />
1,353<br />
37,11,5<br />
U.203<br />
, 267<br />
17,319<br />
U75<br />
18,621,<br />
1,518<br />
352<br />
22,691<br />
3,003_<br />
Value <strong>of</strong><br />
Product<br />
$323,630<br />
58,1,65<br />
U.086<br />
128,721,<br />
11,, 338<br />
980<br />
5U,750<br />
l,5U,<br />
70,353<br />
5,999<br />
1.39U<br />
69,186<br />
10,087<br />
310<br />
Cost <strong>of</strong><br />
Material<br />
$155,193<br />
28,389<br />
1,816<br />
65,977<br />
7,290<br />
501<br />
22,570<br />
803<br />
31,862<br />
3,052<br />
665<br />
30,291<br />
Mot<br />
Value<br />
Added<br />
$173, U38<br />
30,071,<br />
2,270<br />
62,71,6<br />
7,01,8<br />
1,80<br />
32,180<br />
71*2<br />
38,1,91<br />
2,91,8<br />
729<br />
38,895<br />
5'83<br />
Margin<br />
$68,919<br />
12,681<br />
917<br />
25,601<br />
2,81,5<br />
213<br />
11,, 861<br />
267<br />
19,867<br />
1,1,30<br />
377<br />
16,201,<br />
2,U3,6<br />
(Continued on p, 118)<br />
Wages,<br />
Sala<br />
ries<br />
$100<br />
$100<br />
100<br />
100<br />
100<br />
100<br />
100<br />
100<br />
100<br />
100<br />
100<br />
100<br />
100<br />
100<br />
Value<br />
Pro<br />
duct<br />
I31U<br />
336<br />
302<br />
3li7<br />
103<br />
367<br />
316<br />
325<br />
378<br />
395<br />
396<br />
305<br />
336<br />
279<br />
Coat<br />
<strong>of</strong> Ma<br />
terial<br />
$1W<br />
163<br />
13U<br />
178<br />
173<br />
188<br />
130<br />
169<br />
171<br />
201<br />
189<br />
131,<br />
1i<br />
Value<br />
Added<br />
$166<br />
173<br />
168<br />
169<br />
168<br />
180<br />
186<br />
156<br />
207<br />
19U<br />
207<br />
171<br />
$<br />
Mar<br />
gin<br />
$66<br />
73<br />
68<br />
69 68<br />
80<br />
86 56<br />
107 9lt<br />
107<br />
71<br />
8
I<br />
H<br />
Industry<br />
and<br />
Area<br />
Store Fixtures 1<br />
United States<br />
Southeast<br />
<strong>Georgia</strong><br />
Public Building Fixtures<br />
United States<br />
Venetian Blinds<br />
United States<br />
Southeast<br />
Window Shades<br />
United States<br />
Screens 8<br />
United States<br />
Lasts'<br />
United States<br />
Table M-29 (continued)<br />
Census Data for United States, Southeast and Southeastern<br />
States for Forest Product Industrie's Producing!<br />
Ill Consuitiiner Ooods~for 1939"<br />
1939 Census In Thousands <strong>of</strong> Dollars<br />
Wages<br />
and<br />
Salaries<br />
$23,510<br />
1.55<br />
1U6<br />
8,1(97<br />
6,165<br />
117<br />
U.32U<br />
U.062<br />
2.60U<br />
Value <strong>of</strong><br />
Product<br />
170,718<br />
1,255<br />
U30<br />
26,679<br />
25,965<br />
U17<br />
27,071<br />
15,22)4<br />
6,672<br />
Cost <strong>of</strong><br />
Material<br />
$30,507<br />
U81<br />
206<br />
11,1*38<br />
13,665<br />
198<br />
15, U10<br />
7.8U2<br />
2,026<br />
Value<br />
Added<br />
$fjO,212<br />
775<br />
22)i<br />
15, 2m<br />
12,300<br />
219<br />
11,661<br />
7,319<br />
U,6U6<br />
Margin<br />
116,702<br />
320<br />
78<br />
6,7Ut<br />
6,135<br />
102<br />
7,337<br />
3,319<br />
2,0!j2<br />
'Wages<br />
and<br />
Sala<br />
ries<br />
$100<br />
100<br />
100<br />
100<br />
100<br />
100<br />
100<br />
100<br />
100<br />
Value per $100 <strong>of</strong> Payrolls*<br />
Value<br />
<strong>of</strong> Cost<br />
Pro <strong>of</strong> Ma Value<br />
duct terial Added<br />
0301<br />
276<br />
295<br />
31U<br />
Ij21<br />
356<br />
626<br />
375<br />
256<br />
$130<br />
106<br />
llil<br />
t<br />
135<br />
222<br />
169<br />
356<br />
193<br />
78<br />
«171<br />
170<br />
153<br />
179<br />
200<br />
187<br />
270<br />
182<br />
178<br />
Mar<br />
gin<br />
171<br />
70<br />
53<br />
79<br />
100<br />
87<br />
170<br />
82<br />
78<br />
Source: U. S. Census, Manufactures, 19liO. ,____<br />
^Partitions, etc. . —....<br />
For windows and doors, includes weather strips.<br />
Includes related products .<br />
* Calculated. See page 1 51t for explanation <strong>of</strong> formulas.<br />
S3 ' 3" H fDtTJcrt<br />
iipgH^fSfi<br />
S"S • r6 3" *!-: £.3 I|: a 3
Wood Industries; The 1939 Census <strong>of</strong> Manufactures data on<br />
wood processing industries, grouped on a basis <strong>of</strong> their nearness<br />
to the forests on the one hand, and the extent to which finished<br />
consumer good: are produced on the other, are "shown in Taoles<br />
t-27, M-28, and lf-29, and present the 1939 census data for<br />
these industries for the United States, the Southeast, and<br />
<strong>Georgia</strong>, together with the Value <strong>of</strong> Product, Cost <strong>of</strong> Material,<br />
Value Added, and Margin per $100 <strong>of</strong> Payroll, for each industry.<br />
These are arranged according to the following scheme:<br />
SUM ....<br />
Engineering<br />
Experiment<br />
Station . . .<br />
<strong>Georgia</strong><br />
Tee*<br />
Industrial . .<br />
. . Economk<br />
Research . .<br />
I. Raw Materials (Table M-27)<br />
II. Semi-finished products and rough industrial good's (Table M-28)<br />
III. Consuner goods (Table M-29)<br />
Throughout the three preceding tables it is shown that generally<br />
<strong>Georgia</strong> has higher 1939 margins resulting from the expenditures <strong>of</strong> $100 in<br />
payrolls compared with the United States and the Southeast. The <strong>Georgia</strong><br />
figures are higher than those for either the Southeastern States or for the<br />
United States for the sawmill, veneer mill, and cooperage stock industry,<br />
in Sroup I; the planing mill, the wooden box, and cooperage industries in<br />
Pine<br />
1,000,000<br />
900,000<br />
800,000<br />
700,000<br />
600,000<br />
500,000<br />
400,000<br />
Graph lf-30<br />
Production <strong>of</strong> Leadin, •ing Types <strong>of</strong><br />
Lumber T5~] for Geo" :ia7~l909-193'57<br />
Hard<br />
woods<br />
100,000<br />
90,000<br />
80,000<br />
70,000<br />
60,000<br />
50,000<br />
40,000<br />
300,000<br />
30,000<br />
200,000<br />
20,000<br />
100,000<br />
90,000<br />
80,000<br />
70,000<br />
60,000<br />
50,000<br />
40,000<br />
30,000<br />
191 1920<br />
— 119--<br />
1930<br />
10,000<br />
9,000<br />
8,000<br />
7,000<br />
6,000<br />
5,000<br />
4,000<br />
3,000<br />
.
1<br />
Table 11-30<br />
Lumber Production and Prices<br />
for <strong>Georgia</strong> for Selected<br />
• — — ^—<br />
State ....<br />
Engineering<br />
Experiment<br />
Station . . .<br />
Ct<strong>of</strong>ffia<br />
Tee*<br />
Industrial . .<br />
. . Economk<br />
Retcarcb . .<br />
Kind <strong>of</strong> Wood1<br />
1899<br />
1909<br />
1910<br />
1911<br />
1912<br />
1913<br />
S<strong>of</strong>twood<br />
Cedar<br />
Cypress<br />
price<br />
Eenlock<br />
Spruce<br />
White Pine<br />
price<br />
Tellow Pine<br />
price<br />
Total<br />
Hardwood<br />
Ash<br />
price<br />
Bassirood<br />
Eeec!-.<br />
Birch<br />
Cherry<br />
Chestnut<br />
price<br />
Cottonwood<br />
price<br />
Elffi<br />
Hickory<br />
Uagnolia<br />
Maple<br />
price<br />
Oak<br />
price<br />
Red Gum<br />
price<br />
Sycamore<br />
price<br />
Tupelo<br />
price<br />
Walnut<br />
Tellow Poplar<br />
price<br />
All Other<br />
Total<br />
Grand Total<br />
—<br />
14,545<br />
$18.81<br />
—<br />
—<br />
——<br />
1,251,636<br />
$8.47<br />
1,266,181<br />
1,320<br />
$18.06<br />
35<br />
—<br />
—<br />
75<br />
$20.00<br />
—<br />
—<br />
—<br />
163<br />
—<br />
155<br />
$12.15<br />
30,lt8l<br />
$10.07<br />
2,850<br />
$10.87<br />
—<br />
—<br />
—<br />
—<br />
100<br />
10,1*1*7<br />
$10.89<br />
110<br />
45,736<br />
1,311,917<br />
• 1,61,8<br />
27,517<br />
$21-39<br />
966<br />
2,789<br />
31,321*<br />
$13.43<br />
1,194,987<br />
$12.26<br />
1,259,231<br />
3,106<br />
123.76<br />
88<br />
67<br />
20<br />
15<br />
2,429<br />
—<br />
2,260<br />
$15-1.6<br />
274<br />
1,171<br />
—<br />
535<br />
$3.40<br />
46,329<br />
$15.68<br />
4,828<br />
$12.46<br />
80<br />
—<br />
286<br />
—<br />
48<br />
21,472<br />
$18.80<br />
10<br />
83,018<br />
1,342,249<br />
9,929<br />
27,081<br />
$17.57<br />
870<br />
2,080<br />
34,610<br />
$11.76<br />
901,035<br />
$12.80<br />
975,605<br />
2,859<br />
$18.98<br />
118<br />
80<br />
19<br />
—<br />
1,343<br />
$11-85<br />
644<br />
$16.75<br />
330<br />
1,098<br />
—<br />
599<br />
$18.80<br />
32,705<br />
$14.13<br />
5,540<br />
$11.1,4<br />
162<br />
—<br />
720<br />
$14.75<br />
99<br />
19,633<br />
$16.99<br />
63<br />
66,012<br />
1,041,617<br />
4,300<br />
40,847<br />
$19-63<br />
—<br />
3,982<br />
—<br />
701,135<br />
$13-39<br />
750,264<br />
1,987<br />
$17-94<br />
60<br />
381<br />
10<br />
—<br />
755<br />
$12-43<br />
387<br />
212<br />
1,079<br />
—<br />
776<br />
$12.67<br />
25,033<br />
$15-20<br />
3,120<br />
$12-75<br />
76<br />
—<br />
982<br />
—<br />
31<br />
16,447<br />
$20.14<br />
11<br />
51,347<br />
801,611<br />
2,829<br />
62,941<br />
—<br />
—<br />
—<br />
3,087<br />
—<br />
799,370<br />
$14-34<br />
868,227<br />
2,838<br />
—<br />
277<br />
184<br />
17<br />
—<br />
861<br />
—<br />
248<br />
—<br />
203<br />
1,274<br />
—<br />
367<br />
—<br />
38,135<br />
—<br />
9,711)<br />
—<br />
110<br />
—<br />
8,887<br />
—<br />
82<br />
16,736<br />
—<br />
1,131<br />
73,064<br />
941,291<br />
—<br />
74,818<br />
—<br />
55<br />
3.123<br />
662,043<br />
—<br />
740,039<br />
3,088<br />
300<br />
70<br />
—<br />
—<br />
1,250<br />
—<br />
200<br />
—<br />
306<br />
2,465<br />
—<br />
310<br />
—<br />
45,294<br />
—<br />
19,367<br />
—<br />
315<br />
—<br />
1,250<br />
—<br />
5<br />
30,005<br />
—<br />
20<br />
io4,2li5<br />
844,234<br />
Source: U. S. Bept. <strong>of</strong> Agriculture, Statistical Bulletin No. 69,<br />
Table 4, pp. 15, 16, 17, and Table 49, p. 99-<br />
Price data are presented only for those kinds <strong>of</strong> wood which were<br />
reported in quantities sufficient to give rational average values.<br />
Prices are per 11 board feet, and quantities are in II board feet.<br />
—120—
Group II; the wood products not elsewhere classified, the cas<br />
ket and the upholstered household furniture industries in<br />
Group III*<br />
For the excelsior, the rattan and willow-ware, the cigar<br />
iox, the <strong>of</strong>fice furniture, and the Venetian blinds industries,<br />
data for <strong>Georgia</strong> are not available, and, in consequence, this<br />
comparison cannot be made, although most <strong>of</strong> these are repre<br />
State ....<br />
Engineering<br />
Experiment<br />
Snrion . . .<br />
Gtargia<br />
T«*<br />
Indmtrixl . .<br />
. . Economic<br />
Raeatch . .<br />
sented in the state fay a few plants. Only United States data are available<br />
for public building fixtures, match, and window shade industries.<br />
Kind <strong>of</strong> Wood1<br />
S<strong>of</strong>twood<br />
Cedar<br />
Cypress<br />
price<br />
Hemlock<br />
Spruce<br />
Unite Pine<br />
price<br />
Yellow Pine<br />
price<br />
Total<br />
Table 11-30, continued: <strong>Georgia</strong> Lumber Production and Prices<br />
Hardwood<br />
Ash<br />
price<br />
Basswood<br />
Beech<br />
Birch<br />
Cherry-<br />
Chestnut<br />
price<br />
Cottonwood<br />
price<br />
Elm<br />
Hickory<br />
Magnolia<br />
Maple<br />
price<br />
Oak<br />
price<br />
Red QUID<br />
price<br />
Sycamore<br />
price<br />
Tupelo<br />
price<br />
Walnut<br />
Yellow Poplar<br />
price<br />
All Other<br />
Total<br />
Grand Total<br />
1911*<br />
—<br />
1*9,153<br />
—<br />
1,10.7<br />
__<br />
l*,2l*l*<br />
893,316<br />
918,130<br />
2,1*37<br />
—<br />
60<br />
162<br />
10<br />
—<br />
3,631<br />
115<br />
—<br />
h22<br />
506<br />
—<br />
216<br />
—<br />
35,779<br />
13,070<br />
—<br />
376<br />
__<br />
1,300<br />
—<br />
—<br />
19,878<br />
—<br />
99<br />
78,061<br />
1,026,191<br />
1915<br />
Uo<br />
1*9,703<br />
$17.61<br />
1,500<br />
«<br />
3,11*1*<br />
$13-63<br />
525,7U7<br />
$11.93<br />
580,13li<br />
2,605<br />
$21.56<br />
115<br />
152<br />
61<br />
—<br />
U,7l*3<br />
$13-97<br />
211<br />
$15-72<br />
271<br />
Ull<br />
——<br />
236<br />
—<br />
20.W7<br />
$16.06<br />
5,927<br />
$12.97<br />
11(9<br />
—<br />
589<br />
$12.92<br />
133<br />
20,3lt3<br />
$19.36<br />
—<br />
56,103<br />
636,51*7<br />
—121—<br />
1916<br />
10<br />
51*, 305<br />
$20.06<br />
5!*o<br />
_-.<br />
i,lt5o<br />
621,109<br />
$12.96<br />
677,721*<br />
i*,3l5<br />
— •<br />
285<br />
21(6<br />
71*<br />
—<br />
1,1*55<br />
—<br />
1,077<br />
—<br />
31*1*<br />
712<br />
—<br />
1*01<br />
—<br />
21*, 006<br />
$17.91<br />
12,306<br />
$ll*.80<br />
355<br />
__<br />
1,850<br />
—<br />
100<br />
28,569<br />
$18.17<br />
111<br />
76,206<br />
753,930<br />
1917<br />
12<br />
51,219<br />
$26.05<br />
80<br />
__<br />
1,575<br />
51*7,870<br />
$16.59<br />
600,756<br />
5,361<br />
• —<br />
—<br />
2063<br />
—<br />
331<br />
622<br />
—<br />
196<br />
1,317<br />
——<br />
531<br />
—<br />
18,936<br />
12,392<br />
$16.75<br />
275<br />
—<br />
2,125<br />
"~35<br />
28,252<br />
$22.1*3<br />
190<br />
70,772<br />
671,528<br />
1918<br />
—<br />
1O,836<br />
$30.90<br />
702<br />
__<br />
2,631.<br />
3521682<br />
$22.08<br />
397,901*<br />
2,897<br />
—<br />
1(7<br />
21d*<br />
9<br />
—<br />
2,668<br />
$29.32<br />
777<br />
—<br />
181*<br />
1.71O<br />
— -<br />
305<br />
—<br />
21,529<br />
$27-1(3<br />
7,723<br />
$21.7lT<br />
321<br />
—<br />
2,210<br />
—<br />
17<br />
21,538<br />
$37.63<br />
358<br />
65,568<br />
1*63.1*72<br />
1919<br />
—<br />
1(3,1*1(0<br />
$10-85<br />
821<br />
__<br />
1,857<br />
$37-10<br />
767,217<br />
$21*. 51*<br />
813,335<br />
3,656<br />
$63.02<br />
82<br />
235<br />
' 8<br />
—<br />
2.1O3<br />
$29-61<br />
368<br />
—<br />
322*<br />
1,138<br />
—<br />
1(00<br />
$31.97<br />
31*, 537<br />
$32.1(0<br />
15,510<br />
$31.37<br />
397<br />
——<br />
2,1(85<br />
$29-96<br />
2<br />
18,575<br />
$39-77<br />
500<br />
80,630<br />
893,965
,<br />
The basic indication from these tables is that wood pro<br />
cessing can generally be made more pr<strong>of</strong>itable in <strong>Georgia</strong> than<br />
elsewhere in the Southeast or elsewhere in the United States.<br />
The household furniture industry and the upholstered fur<br />
niture industry together, are examples <strong>of</strong> this probability. In<br />
the case <strong>of</strong> upholstered furniture, <strong>Georgia</strong> plants have a margin<br />
advantage <strong>of</strong> til per $100 <strong>of</strong> payroll over the United States and<br />
Sure ....<br />
Encijimulf<br />
Experiment<br />
Stition . . .<br />
<strong>Georgia</strong><br />
TVcfc<br />
Indutrul . .<br />
. . Ec<strong>of</strong>lonk<br />
Remicb<br />
|12 over the Southeast. In the case <strong>of</strong> upholstered furniture, this margin<br />
advantage would be likely to increase.<br />
Table M-30, continued: <strong>Georgia</strong> Lumber Production and Prices<br />
Kir.d <strong>of</strong> Wood1<br />
S<strong>of</strong>twood<br />
Cedar<br />
Cypress<br />
price<br />
Hemlock<br />
Soruce<br />
Fnite Fine<br />
price<br />
Yellow Pine<br />
price<br />
Total<br />
Hardwood<br />
Ash<br />
price<br />
Sasswood<br />
Beach<br />
Birch<br />
Cherry<br />
Chestnut<br />
price<br />
Cottonwood<br />
price<br />
Elm<br />
Hickory<br />
ITagnolia<br />
Maple<br />
price<br />
Oak<br />
price<br />
Red jmr. .<br />
price<br />
Sycanore<br />
price<br />
Tupelo<br />
price<br />
Walnut<br />
lellow Poplar<br />
price<br />
All Other<br />
Total<br />
Grand Total<br />
1920<br />
12<br />
1*5,863<br />
$53.13<br />
1*25<br />
——<br />
2,253<br />
$36.31<br />
1*78,51*7<br />
$26.3U<br />
527,100<br />
l*,89l*<br />
$55-37 50<br />
10k<br />
20<br />
—<br />
2,561<br />
$31*. 57<br />
133<br />
$26.39<br />
270<br />
960<br />
—<br />
303<br />
$38-. 25<br />
26,003<br />
$37.79<br />
17,991<br />
$35-51<br />
5iH<br />
$25-00<br />
1,518<br />
$32-97<br />
3<br />
17,169<br />
$62.86<br />
119<br />
72,639<br />
599,739<br />
1921<br />
1<br />
60,668<br />
$36.61<br />
103<br />
__<br />
2,157<br />
$19.1*3<br />
660,826<br />
$16.88<br />
723,755<br />
U,859<br />
$3S.2I»<br />
—<br />
720<br />
2<br />
—<br />
263<br />
$22.00<br />
11,6<br />
—<br />
20li<br />
885<br />
—<br />
521<br />
$23-20<br />
18,2«6<br />
$2U-6l<br />
21,51*1<br />
$23-21*<br />
227<br />
—<br />
. 3,360<br />
$23.71<br />
1<br />
17,767<br />
$26.16<br />
82<br />
68,821*<br />
792,579<br />
--122—<br />
1922<br />
23<br />
68,828<br />
$Ui.07<br />
671<br />
__<br />
ii,530<br />
$25.70<br />
659,025<br />
$18.62<br />
733,127<br />
5,975<br />
$32.81<br />
—<br />
37<br />
13<br />
—<br />
1,550<br />
$23.85<br />
31*5<br />
—<br />
l*5o<br />
700<br />
—<br />
708<br />
$27.10<br />
21,516<br />
$26.20<br />
21*, 197<br />
$2lj.3l*<br />
322<br />
—<br />
6,191*<br />
$21*.36<br />
10<br />
lit, 162<br />
$31.59<br />
85<br />
76,261,<br />
309. 391<br />
1923<br />
5<br />
75,799<br />
$UU-35<br />
817<br />
__<br />
U.773<br />
$33-99<br />
967,636<br />
$21.90<br />
1,010,030<br />
5,707<br />
$1*9-81<br />
1*7<br />
265<br />
327<br />
—<br />
1,139<br />
$2!,. 28<br />
217<br />
—<br />
1*1*2<br />
1,066<br />
—<br />
1,575<br />
$26.95<br />
26,621<br />
$31*. 96<br />
23,865<br />
$30.98<br />
516<br />
—<br />
i*,371<br />
$25-i*3<br />
29<br />
31*,052<br />
$51.27<br />
122<br />
100,361<br />
l.lliO.^qi<br />
1921*<br />
10<br />
68,899<br />
$Ul.02<br />
1,017<br />
__<br />
3,677<br />
$22.30<br />
1,010,930<br />
$20.23<br />
1,081*. 533<br />
6,167<br />
$1*3-35<br />
58<br />
179<br />
8<br />
—<br />
1,1*29<br />
$20.29<br />
618<br />
$25.38<br />
911*<br />
1,163<br />
—<br />
1,062<br />
$31.99<br />
36,391<br />
$31.23<br />
29,307<br />
$23.05<br />
607<br />
$27.19<br />
7,103<br />
$22-73<br />
20<br />
36,383<br />
$1*2.36<br />
657<br />
122,066<br />
l.O6. 99<br />
1925<br />
6<br />
62,709<br />
$39-91<br />
521*<br />
, _<br />
2,302<br />
$32. 1*7<br />
1,172,61*0<br />
$21.80<br />
1,238,181<br />
6,lS9<br />
$1*9-72<br />
133<br />
61<br />
12<br />
—<br />
I,0li2<br />
$25-00<br />
730<br />
$20.83<br />
199<br />
1*93<br />
—<br />
1,302<br />
$31.63<br />
39,839<br />
$1*2.1*3<br />
35,095<br />
$U2.85<br />
1,281<br />
$22.1*0<br />
3,215<br />
$26. $7<br />
__<br />
37,032<br />
$38.63<br />
300<br />
126,993<br />
1,^,1 7k
The more reliable statistical data on timber production<br />
are largely on a statewide basis. Table M-30 and Graph M-30<br />
present for <strong>Georgia</strong>, as a whole, the annual cuttings by species<br />
for selected ye'ars beginning with 1399. A by-county inventory<br />
<strong>of</strong> the quantity and species <strong>of</strong> forests in <strong>Georgia</strong> is being made<br />
by the School <strong>of</strong> Forestry at Athens. The study, however, has'<br />
just been started, and it will be some time before the data will<br />
be available. Tfhat field work has been done, however, indicates<br />
that the apparently heavy cutting during the past four years has not par<br />
ticularly affected the increasing supply <strong>of</strong> most woods.<br />
Table 11-30, continued: <strong>Georgia</strong> Lumber Production and Prices<br />
State ....<br />
Engineering<br />
Experiment<br />
Station . . .<br />
<strong>Georgia</strong><br />
Tich<br />
Industrial . .<br />
. . Economic<br />
Research . .<br />
Kind <strong>of</strong> Wood 1<br />
1926<br />
1927<br />
1928<br />
1929<br />
1930<br />
S<strong>of</strong>twood<br />
Cedar<br />
Cypress<br />
price<br />
Hemlock<br />
Spruce<br />
Ihite Pine<br />
price<br />
lellow Pine<br />
price<br />
Total<br />
Hardwood<br />
Ash<br />
price<br />
Basswood<br />
Beech<br />
Birch<br />
Cherry<br />
Chestnut<br />
price<br />
Cottonwood<br />
price<br />
Elra<br />
Hickory<br />
Uagnolia<br />
Maple<br />
price<br />
Oak<br />
price<br />
Red Gum<br />
price<br />
Sycamore<br />
price<br />
Tupelo<br />
price<br />
Walnut<br />
Yellow Poplar<br />
price<br />
ill Other<br />
Total<br />
3rand Total<br />
11<br />
1*0,91(6<br />
too. 61<br />
389<br />
—<br />
1,738<br />
$31-79<br />
982,2l;5<br />
$20.06<br />
1,025,329<br />
7,5!0i<br />
$i.8.39 U6<br />
116<br />
21<br />
—<br />
2,737<br />
$31-29<br />
893<br />
$31-59<br />
385<br />
802<br />
—<br />
788<br />
$31;. 6k<br />
29,623<br />
$32.87<br />
37,91*9<br />
$28.1,3<br />
663<br />
$25.26<br />
3,811<br />
$27.00<br />
h<br />
31t,5l7<br />
$1(0.32<br />
261<br />
120,160<br />
1,116,1*39<br />
8<br />
3U.U37<br />
$1*1.01<br />
153<br />
—<br />
1.U83<br />
$31-11;<br />
998,359<br />
$17.72<br />
1,031;, 1*35<br />
11,515<br />
$U9.!i2<br />
132<br />
67<br />
57 1<br />
3,2li3<br />
$28.92<br />
2,727<br />
$29-77<br />
36<br />
73)4<br />
—<br />
802<br />
$37. 61*<br />
1*1,337<br />
$33-1*8<br />
57,815<br />
$38.25<br />
917<br />
$26.19<br />
6,009<br />
$39.07<br />
3<br />
1*0,031*<br />
$1*1-51<br />
815<br />
166,573<br />
1,201,008<br />
10<br />
18,630<br />
$30.61<br />
322<br />
—<br />
1,022<br />
$23-52<br />
868, U53<br />
$18.33<br />
838, 1*37<br />
5,05<br />
$1(1-31;<br />
35<br />
150<br />
201<br />
—<br />
5,789<br />
$29- 111<br />
1,205<br />
$30.1*8<br />
609<br />
791*<br />
—<br />
3,705<br />
$31-98<br />
31*, 122<br />
$28.71<br />
1(8,296<br />
$29-20<br />
1,118<br />
$26.10<br />
1(,173<br />
$2lj.07<br />
_<br />
I0t,098<br />
$30. 2k<br />
1,233<br />
151,038<br />
1,039,1(75<br />
2<br />
23,095<br />
$1(6.17<br />
1*36<br />
—<br />
779<br />
$23.00<br />
1,165,527<br />
$18.15<br />
1,189,339<br />
6,303<br />
$U2.91<br />
1(3<br />
11(2<br />
10;<br />
—<br />
1,360<br />
$29-00<br />
2,189<br />
$33-98<br />
1,396<br />
610<br />
—<br />
3,270<br />
1(7,21*5<br />
$26.89<br />
61,21(0<br />
$35.25<br />
1,861<br />
$29-13<br />
9,862<br />
$25-63<br />
83<br />
56,14(1<br />
$33.50<br />
it, 317<br />
196, itll<br />
1,386,250<br />
13<br />
19,317<br />
$32.1(0<br />
8<br />
—<br />
i,l(05<br />
$12-53<br />
611,321<br />
$1U.73<br />
632,561*<br />
6,31*1*<br />
$1.3.22<br />
170<br />
123<br />
62<br />
—<br />
716<br />
$15-37<br />
3,366<br />
$18-57<br />
933<br />
653<br />
506<br />
2,l*3!t<br />
$32,36<br />
25,067<br />
$22. Ul<br />
hk,h22<br />
$28.25<br />
2,080<br />
$21.22<br />
6,581*<br />
$19.73<br />
15<br />
26,739<br />
$29-76<br />
206<br />
120,920<br />
753,1*81;<br />
—123—
Yellow pine has aluays been the largest item in timber<br />
production in <strong>Georgia</strong>, with an average production about three<br />
times that <strong>of</strong> all other connercial woods.<br />
Between 1927 and 1936, red gum wood was the second largest<br />
item, with the exception <strong>of</strong> two years, 1931 and 1932, when cy<br />
press was second. Cypress, however, is the second largest on<br />
the basis <strong>of</strong> long term averages', having been in second place<br />
from 1911 to 1927. In 1910, white pine was second (the first year that<br />
this wood appeared among the first five) and previously oak was second.<br />
Graph V-30 shows the fluctuations in the production <strong>of</strong> the five leading<br />
types <strong>of</strong> lumber in <strong>Georgia</strong> for the twenty-seven year period, 1909-1936.<br />
Kind <strong>of</strong> Wood 1<br />
S<strong>of</strong>twood<br />
Cedar<br />
Cypress<br />
price<br />
Hemlocfe<br />
Spruce<br />
White Pine<br />
price<br />
Yellow Pine<br />
price<br />
Total<br />
Hardwood<br />
AST<br />
price<br />
Basswood<br />
Beech<br />
Birch<br />
Cherry<br />
Chestnut<br />
price<br />
Cottonwood<br />
price<br />
Elm<br />
Hickory<br />
Magnolia<br />
Haple<br />
price<br />
Oak<br />
price<br />
3ed Sum<br />
price<br />
Sycamore<br />
price<br />
Tupelo<br />
price<br />
Walnut<br />
Yellow Poplar<br />
price<br />
ill Other<br />
Total<br />
3rand Total<br />
Table lf-30, continued: <strong>Georgia</strong> Lumber Production and Prices<br />
1931<br />
13<br />
19,862<br />
$29-13<br />
8<br />
—<br />
612<br />
112.00<br />
379,868<br />
$13.15<br />
1*00,353<br />
3,328<br />
$39.38<br />
122<br />
38<br />
2k<br />
—<br />
2U1<br />
—<br />
1*13<br />
—<br />
520<br />
87<br />
3k<br />
766<br />
$32.13<br />
17,379<br />
$18. ",9<br />
16,1*1*3<br />
$22.97<br />
1,311<br />
$19.51<br />
5,170<br />
$19-32<br />
7<br />
12,795<br />
$22.23<br />
76<br />
59.25U<br />
1,59,617<br />
1932<br />
22<br />
6,812<br />
$23.03<br />
—<br />
—<br />
697<br />
$13.09<br />
235,01*2<br />
$10.58<br />
2U2.573<br />
1,605<br />
$23-83<br />
1<br />
30<br />
13<br />
—<br />
31<br />
—<br />
127<br />
—<br />
ItO<br />
58<br />
12<br />
283<br />
—<br />
6,125<br />
$16.01<br />
6,381,<br />
$ll(.28<br />
296<br />
—<br />
1,061<br />
$16.73<br />
—<br />
1..792<br />
$11.. 91.<br />
225<br />
21,083<br />
263,656<br />
—124—<br />
1933<br />
281<br />
7,1.00<br />
$30.11<br />
—<br />
—<br />
32<br />
—<br />
10.2,737<br />
.$13-91<br />
1*20,1*50<br />
5,61,3<br />
$28.1*9<br />
__<br />
1*7<br />
—<br />
—<br />
56<br />
—<br />
2,665<br />
—<br />
370<br />
83<br />
336<br />
1*50<br />
$23-97<br />
10,613<br />
$22.87<br />
15,520<br />
$25.53<br />
616<br />
$21.36<br />
5, h8h<br />
$21.00<br />
—<br />
10,913<br />
$21.91*<br />
—<br />
52,796<br />
1*73, 2ti6<br />
193U<br />
—<br />
10,366<br />
$30.1*2<br />
—<br />
575<br />
1)06,169<br />
$15-29<br />
1*17,610<br />
8,053<br />
$1(8.10<br />
—<br />
2<br />
3<br />
—<br />
—<br />
__<br />
695<br />
—<br />
199<br />
226<br />
51*1.<br />
1,173<br />
$28.1*3<br />
13,686<br />
$20.1*2<br />
Ui,l*59<br />
$25.15<br />
Ii66<br />
$26.95<br />
h,9Z<br />
$20.58<br />
3<br />
11*, 156<br />
$30.95<br />
21<br />
58,611<br />
1*76,221<br />
1935<br />
—<br />
21,021<br />
$25- 1J*<br />
—<br />
—<br />
605<br />
$11*. Ul<br />
610.616<br />
$li*-19<br />
632,2i*2<br />
6,660<br />
$32.86<br />
_„<br />
16<br />
10<br />
—<br />
—<br />
_<br />
183<br />
—<br />
363<br />
60<br />
271<br />
2,566<br />
$23-91<br />
U*,282<br />
$20.39<br />
29,360<br />
$17-51*<br />
286<br />
$2!*-95<br />
8,225<br />
$18.16<br />
—<br />
19,31*9<br />
$26.71<br />
8M36<br />
713,878<br />
1936<br />
26<br />
26,31*5<br />
$27-82<br />
—<br />
—<br />
1,1*90<br />
.$17.06<br />
738,11*9<br />
$16.1,2<br />
766,010<br />
1*,952<br />
$33.23<br />
10<br />
161,<br />
1*2<br />
—<br />
58<br />
_<br />
719<br />
$23.25<br />
1,90<br />
11*2<br />
392<br />
3,61*8<br />
$25-33<br />
19,1,33<br />
$18. l£<br />
3!*, 591<br />
$21. ho<br />
811.<br />
$21.03<br />
U.Slli<br />
$19.53<br />
1<br />
29,191<br />
$21.26<br />
106,1*65<br />
872.1*76
Ihese five timber species are yellow pine, cypress, oak, yellow<br />
poplar, and red gum. The average per year production <strong>of</strong> these<br />
same five types is shown for the 1909-1936 period in Graph M-30a<br />
on a statewide basis.<br />
* *<br />
jmpregnated Woods<br />
Another source for the wood qualities which characterize<br />
the hardwoods is to be found in the processes for impregnation<br />
SUM ....<br />
Encmcfrinf<br />
Elplrimmt<br />
Station . . .<br />
<strong>Georgia</strong><br />
Ttch<br />
Indutriil . .<br />
. . ECOBOBK<br />
Rtturtb . .<br />
<strong>of</strong> woods which are emerging from research laboratories. In general, these<br />
processes (already in limited industrial use) are intended to make possibli<br />
the same exact engineering <strong>of</strong> wood applications in industry as is the case<br />
Graph M-30a<br />
Long Tern Average Production <strong>of</strong> Leading Timbers<br />
in Thousands <strong>of</strong> Board Feet<br />
M ————————————————————————— Oak 27,<br />
1 ————————————————————————— Yellow<br />
1 ' '<br />
Yellow Pine 725,908<br />
22,428<br />
40,512<br />
619<br />
Poplar 24,862<br />
1 I i<br />
0 140 280 420 560 720 8«<br />
Thousands, V Board feet.<br />
with plastics and light metals. Wood has many defects that must be <strong>of</strong>fset.<br />
It seasons slowly, it warps, splits, checks; it rots, stains, swells and<br />
shrinks, pro/ides food for fungi molds and insects, and it has to be care<br />
fully handled and finished before it becomes usable. Quality woods grow<br />
slowly and in lir.ited areas, whereas s<strong>of</strong>t low quality woods grow rapidly<br />
and over extensive parts <strong>of</strong> much <strong>of</strong> the country, particularly in the South.<br />
S<strong>of</strong>t Woods Used; By impregnating the s<strong>of</strong>t woods with the proper chem<br />
ical, many <strong>of</strong> their defects can be inhibited or <strong>of</strong>fset in a large measure.<br />
Through such a means all wood so impregnated becomes <strong>of</strong> better quality.<br />
The application <strong>of</strong> these impregnation processes will mean that Southern<br />
s<strong>of</strong>twoods can compete with finer quality hardwoods in the manufacture <strong>of</strong><br />
specialties and furniture and that new uses may also be expected to be de<br />
veloped in order to provide competition with plastics and light metals.<br />
Phenol-formaldehyde has been the most widely used impregnator to date. It<br />
i« the means <strong>of</strong> obtaining the highest quality and product so far developed.<br />
However, its high cost has limited its application to a rather marked de<br />
gree. From a standpoint <strong>of</strong> cost, the use <strong>of</strong> urea-formaldehyde now seems<br />
aore advisable, though it does not give quite as high a quality product as<br />
does the phenol-formaldehyde.<br />
Ithat is probably the most advanced development project in the entire<br />
country on the urea process <strong>of</strong> wood impregnation is now under way at the<br />
State Engineering Experiment Station, <strong>Georgia</strong> School <strong>of</strong> Technology. Plants<br />
<strong>of</strong> several different sizes in the pilot plant range have been built and op-<br />
«rated in an effort to determine the best plant lay-out and means <strong>of</strong> comwrcially<br />
treating wood with urea, as well as to develop operating data,<br />
in acceptable degree <strong>of</strong> success in this work has been achieved by the State<br />
Engineering Experiment Station. However, much remains to be done before<br />
—125--<br />
1<br />
,
urea treated wood can be marketed in any appreciable quantities,<br />
but it is anticipated that after several months,limited amounts "<br />
will be used in industry.<br />
Expcrimal<br />
Station<br />
Problems Being Studied; Ftadamental problems involving the ~ •<br />
correct mixtures <strong>of</strong> chemicals, adequate pressures and tempera<br />
tures, and variations <strong>of</strong> other factors all are in the process <strong>of</strong><br />
being worked out. At the sane time wood has beeo treated for<br />
Indutiiil . .<br />
. . EconMUc<br />
Research .<br />
use in electrolyte tanks, furniture, gears, textile spindles, instrument<br />
boxes, tripod legs, end s<strong>of</strong>t drink crates. Each <strong>of</strong> these items, when made<br />
fron treated lunber, will be put into actual use in order to determine its<br />
effectiveness by comparison with materials now being utilized.<br />
There are proMems involved in the impregnation treatment <strong>of</strong> particu<br />
lar woods which are in the process <strong>of</strong> being solved. Some species will not<br />
accept treatment at all. Others will treat only in sapwood. So that a<br />
consistent and predictable outcome may be had by a commercial treating<br />
plant, ireans must be found whereby all woods can be treated with a consis<br />
tently successful result.<br />
When these problems have been overcome to a reasonable degree, it will<br />
be possible for <strong>Georgia</strong> end southern s<strong>of</strong>twoods to be utilized, in specialty<br />
and high priced items heret<strong>of</strong>ore entirely made from other woods. Wider<br />
utilization and higher prices for marketable products can be expected to<br />
improve the economic position <strong>of</strong> the Area considerably. At the same time,<br />
the use <strong>of</strong> the cheaper, fast growing s<strong>of</strong>twoods in furniture, textile parts,<br />
instrument boxes, show cases and many other similar items, possibly will<br />
brjng about a lowering <strong>of</strong> the final cost <strong>of</strong> all <strong>of</strong> these with a consequent<br />
increase in number <strong>of</strong> units <strong>of</strong> any one item used*<br />
Inquiries; The State Engineering Experiment Station, <strong>Georgia</strong> School<br />
<strong>of</strong> Technology, will be glad to discuss these processes and their applica<br />
tion with any interested industrialist, inquiries should be directed to<br />
Dr. Gerald A. Kosselot, Director.<br />
Koisture Control<br />
Wood grown in the Northeast <strong>Georgia</strong> Area has a high moisture content<br />
whenit is freshly cut or green. This moisture content varies from 34 per<br />
cer.t for heartwood to more than 100 per cent for sapwood. For almost any<br />
use, and particularly for most processing uses, the moisture content must<br />
be reduced and controlled during the processing in order to avoid later<br />
shrinking.<br />
The t»io general methods <strong>of</strong> accomplishing this control are air ssasocing<br />
and kiln drying. Air seasoning, in general, consists merely in storage<br />
under conditions where air may freely circulate around each board. The<br />
lumber should be under a rain-pro<strong>of</strong> ro<strong>of</strong>. In kiln drying the lumber is<br />
placed in a chamber or moved through a tunnel kiln where heat is applied.<br />
This cethod is much more rapid than air seasoning. If the rate <strong>of</strong> drying<br />
is properly adjusted to the condition and character <strong>of</strong> the lumber, the re<br />
sults are generally more satisfactory.<br />
The advantages <strong>of</strong> air seasoned over green lumber and summarized in<br />
the Wood Handbook3 by the Forest Products Laboratory as "reduction in<br />
weight, with a resulting decrease in shipping costs; reduction in the<br />
Per cent <strong>of</strong> bone-dry weight.<br />
''Wood Handbook, 1935, United States Department <strong>of</strong> Agriculture, Forest<br />
Products Laboratory.<br />
—3.26—
shrinkage, checking, honeycombing^ and warping occurring in serrlce;<br />
decrease in the tendency for blue stain and for other<br />
forms <strong>of</strong> fungi to develop; reduction in liability to some forms<br />
<strong>of</strong> insect attack; increase in strength; and improvement in the<br />
o»pacity <strong>of</strong> the stock to hold paint or to receive preservation<br />
treatment. 1"<br />
State ....<br />
Enginrcriag<br />
Experiment<br />
Station . . .<br />
Groroia<br />
TKh<br />
Industrial . .<br />
. . Economic<br />
Research .<br />
In the same way, the advantages <strong>of</strong> kiln drying over air<br />
seasoning are described as: "Greater reduction in weight, and consequently<br />
in shipping charges; reduction in moisture content to any desired value,<br />
nhich may be lower than that obtainable through air seasoning; reduction in<br />
drying time below that required in air seasoning; and the killing <strong>of</strong> any<br />
stain or decay fungi or insects that may be in the wood."<br />
The trade terms shipping-dry, air-dry, and kiln-dried indicate the<br />
three general methods <strong>of</strong> seasoning lumber rather than an exact standard <strong>of</strong><br />
noisture content; these terms have several interpretations. Shipping-dry<br />
lumber tieans lumber that is partially air-dried to reduce freight charges.<br />
Air-dry lumber is lumber that has been expTbsed to the air for some<br />
length <strong>of</strong> time. There appears to be no specification <strong>of</strong> how long the dry<br />
ing should take. In extremely arid climatesjby.this method the moisture<br />
content may be reduced to 6 per cent; for the United States as a whole, to<br />
a possible minimum <strong>of</strong> 12 to 15 per cent.<br />
Kiln-dried lumber is lumber that has been kiln-dried for any length <strong>of</strong><br />
tine. Properly Win-dried lumber in the upper grade s<strong>of</strong>twoods and in the<br />
upper and lower grade hardwoods will have a moisture content <strong>of</strong> 6 to 8 per<br />
cent.<br />
For most <strong>of</strong> the United States, climatic conditions establish an aver<br />
age equilibrium for the moisture content <strong>of</strong> wood.in use at about 8 per<br />
cent, in the Northeast <strong>Georgia</strong> Area this point <strong>of</strong> equilibrium is close to<br />
the United States average but in coastal areas in the Southeast the average<br />
is close to 11 per cent. In processing wood for any use where tight fits<br />
or close tolerances are at all important,this difference should be taken<br />
into account. For example, furniture could be made for use in South<br />
<strong>Georgia</strong> and Florida by merely kiln-drying it to slightly below 11 per cent.<br />
or use in inland points in <strong>Georgia</strong> and the Southeast, however, air condi<br />
tioning <strong>of</strong> the factory might be required, in addition to kiln-drying to<br />
slightly below 8 per cent.<br />
—127—
Uses <strong>of</strong> Woods<br />
The preponderance <strong>of</strong> pine in the forests <strong>of</strong> the Northeast<br />
<strong>Georgia</strong> Area tends to obscure the smaller volume <strong>of</strong> hardihoods<br />
which hare a much greater industrial importance than is indi<br />
cated by the percentage <strong>of</strong> total forest acreage which they<br />
occupy.<br />
Suu ....<br />
Enfuteriflf<br />
Expcrinnt<br />
Station . . .<br />
Gforpu<br />
T«J,<br />
Imfemul..<br />
. . Econoaic<br />
Rocarcli .<br />
The non-pine timber in the Area is largely located on fertile sroicp<br />
soils or along the larger streams. Compared to the ever-present pine,<br />
these hardwoods are extremely scattered, a circumstance which limits the<br />
available information regarding the exact location, <strong>of</strong> each species. It is<br />
probably true that individual specimens <strong>of</strong> almost every one <strong>of</strong> the fifty<br />
different forest species usually listed as growing in <strong>Georgia</strong>, are to be<br />
found in the Northeast <strong>Georgia</strong> Area. More than a dozen species exist in<br />
merchantable quantities although woodsmen and manufacturers are apt to have<br />
considerable hunting to do in order to locate some <strong>of</strong> the "pockets" <strong>of</strong><br />
hardwood in the overwheljning mass <strong>of</strong> pine. These hardwoods <strong>of</strong>ten are fousd<br />
in groups <strong>of</strong> only a few tregs which are scattered through large areas <strong>of</strong><br />
pine.<br />
The woods available in varying quantities in the Northeast <strong>Georgia</strong><br />
Area include:<br />
I. S<strong>of</strong>twoods II. Hardwoods<br />
Pine<br />
Longleaf<br />
Short leaf<br />
Pitch<br />
Pond<br />
Loblolly -<br />
Red Oak<br />
Southern Hod<br />
Black<br />
Blackjack<br />
Bluejack<br />
Laurel<br />
Shumard<br />
Water<br />
Turkey<br />
Willow<br />
White Oak<br />
Post<br />
Overcup<br />
Live<br />
Swamp Chestnut<br />
Red and Sap Gum<br />
Tupelo<br />
Cotton Gum<br />
Black Gum<br />
Swamp Gum<br />
Yellow Poplar<br />
Cottonwood<br />
Ash<br />
Sycamore<br />
S<strong>of</strong>t Ifeple<br />
Elm<br />
Hickory<br />
Beech<br />
The generally available information4 about the industrial uses and<br />
general characteristics <strong>of</strong> these -roods is to be found in the following<br />
pages.<br />
The following sources <strong>of</strong> information have, in general, been used in<br />
this compilation: <strong>Georgia</strong> Forest Resources and Industries, Forest Service,<br />
United States department <strong>of</strong> Agriculture, Publication Ho. SOI; Forest Resourees<br />
<strong>of</strong> North <strong>Georgia</strong>, Forest Service, United States Department <strong>of</strong>~T£r:<br />
culture,~~P~ublication No- 45; Native Trees <strong>of</strong> <strong>Georgia</strong>, G. Norman Bishop.<br />
School <strong>of</strong> Forestry, <strong>University</strong> <strong>of</strong> <strong>Georgia</strong>;~][merican Hardwood, United States<br />
Department <strong>of</strong> Commerce; Southern Hardwoods, Southern Hardwood Producers,<br />
Inc., Kemphls, Tennessee; Forest 'PlanningT <strong>Georgia</strong>, State Planning Board.<br />
—123—
pines I. S<strong>of</strong>twoods<br />
Yellow pine has long been the chief source <strong>of</strong> timber pr<strong>of</strong><br />
its in <strong>Georgia</strong>. Production has averaged over three times as<br />
jiuch as all other merchantable woods combined.<br />
State ....<br />
Engineering<br />
Experiment<br />
Station . . .<br />
Ctoryia<br />
Tec*<br />
Indutrul . .<br />
. . Economic<br />
Rocatch . .<br />
The longleaf, slash, loblolly and shortleaf pines have<br />
nich the same characteristics and uses. The wood <strong>of</strong> the longleaf<br />
is light reddish yellow; that <strong>of</strong> the slash is dark orange in the<br />
heart with white sapwpod. The loblolly is brittle and not as strong as<br />
other pines. The pitch and the pond pines are less <strong>of</strong>ten converted into<br />
luniber, being more generally used as fuel and pulp or material for charcoel.<br />
Uses for Pine<br />
Low priced furniture<br />
Kitchen furniture, cabinets, etc.<br />
Chairs<br />
Store fixtures<br />
Truck bodies<br />
Freight cars<br />
Plywood<br />
Woodenware<br />
Wagon bodies<br />
Caskets, c<strong>of</strong>fins<br />
Ship masts, spars, decking,<br />
head blocks and deck beams<br />
Telephone poles<br />
Insulator pins<br />
Reels for rope and wire<br />
Silos<br />
Braces<br />
Veneer<br />
Handles<br />
Patterns<br />
Templates<br />
Excelsior<br />
Cooperage<br />
Toys, signs<br />
Corner post«<br />
Poultry orates<br />
Pouring blocis<br />
Railroad ties<br />
Bridge timbers<br />
Residential construction, trim,<br />
structural members, sheathing,<br />
flooring, etc.<br />
Forms for concrete<br />
Temporary construction<br />
Boxes<br />
Shipping containers<br />
—129—
Oaks<br />
II. Hardwoods<br />
Oak is a general purpose hardwood and few other hardwoods<br />
can equal it in the number <strong>of</strong> structural uses. It is strong,<br />
bends and turns well, and takes a beautiful finish.<br />
State ....<br />
Experiment<br />
Station . . .<br />
Cnraia<br />
Tnh<br />
Industrial . .<br />
. . Economic<br />
Research<br />
The principal species <strong>of</strong> oaks occurring in North <strong>Georgia</strong><br />
are the black, southern red, blackjack, bluejack, laurel, live, overeup,<br />
post, turkey, shumard, swamp chestnut, water, rhite (rare), and willow.<br />
Classed usually as red oaks are the southern red, black, blackjack, blue-<br />
jack, laurel, shumard, water, turkey and willow. Classed as white oaks<br />
are the post, overeup, live (really a distinct type), and the swamp<br />
chestnut oak.<br />
Bed Oaks: Among the red oaks the two more valuable species are the<br />
southern red and the shunard. The others are occasionally used in con<br />
struction but chiefly as fuel.<br />
Uses for Red Oak<br />
Household furniture<br />
Lawn furniture<br />
Office furniture<br />
Toilet seats<br />
Staves for barrels and kegs<br />
Patterns and flasks<br />
Bridge timbers, railroad ties<br />
Heavy timbers for construction<br />
Locomotive bumpers<br />
Girders and templates<br />
Toys<br />
Coops<br />
Floors<br />
Veneers<br />
Derricks<br />
Elevators<br />
Insulator pins<br />
Telephone boxes<br />
Cider-presses<br />
Ifachine parts<br />
Planing mill products<br />
Agricultural implements<br />
Incubators<br />
Tannin from bark<br />
Tihite Oak; Although white oak is scattering in the Northeast <strong>Georgia</strong><br />
Area, it is listed because <strong>of</strong> ito inany important uses and characteristics.<br />
TChite oak is hard, heavy, quite tough, very strong, durable, almost impen<br />
etrable to liquids. Live oak, chestnut oak and overeup oak are very simi<br />
lar to white oak in both characteristics and uses.<br />
Uses for White Oak<br />
Household furniture,<br />
affice furniture<br />
Pjultry crates, billiard cues,<br />
wicker hampers<br />
Wagon wheels, gear parts, bodies<br />
Handles and parts for plows,<br />
cultivators, corn planters,<br />
cotton and peanut planters,<br />
other agricultural implements<br />
Plywood for furniture and panels<br />
Splint-bottom chairs<br />
Radiator covers<br />
Loom parts, fence posts<br />
Saw-handles<br />
Pulleys, rollers<br />
Pumps<br />
Meat blocks<br />
Tight boxes<br />
Brackets<br />
Derricks<br />
Dowels and hubs<br />
Insulator pins *<br />
Oars<br />
Toys<br />
Beams<br />
Hurdles<br />
Stair treads<br />
Surgical splints<br />
Toboggans, sleds<br />
Curtain poles<br />
Coat hangers<br />
Interior trim, doors, panels, etc.<br />
—130—
Uses for White Oat (Continued)<br />
Tight barrels<br />
Kegs, tubs, and vats<br />
Car construction<br />
Flooring<br />
Railroad ties<br />
State . v .<br />
Engineering<br />
Experiment<br />
Station . . .<br />
<strong>Georgia</strong><br />
Tid><br />
Industrial . .<br />
. . Economic<br />
Research . .<br />
Post Oak: The humble post oak has several <strong>of</strong> the quali<br />
ties <strong>of</strong> the white oak. It is close grained, resistant against<br />
weather conditions, and slow in seasoning. " The wood is a darker brown<br />
than that <strong>of</strong> the white oak. The familiar sight <strong>of</strong> the scrub post oak on<br />
the dry, gravelly or sandy upland, may lead us to overlook the fact that<br />
down in the rich soils <strong>of</strong> the swamps and river bottoms, these oaks fre<br />
quently grow to good sawlog size.<br />
Uses <strong>of</strong> Post Oak<br />
Fence posts<br />
Eailroad ties<br />
Rough construction<br />
Barrels and other cooperage<br />
Other Oaksi Three other oaks, the overcup, live, and chestnut, have<br />
much the same characteristics as the white oak. The live oak is very<br />
tough. The swamp chestnut oak is not only tough but splits easily. The<br />
overcup oak is strong, tough and very durable*<br />
Uses for Live Oak<br />
Hauls<br />
Meat blocks<br />
Pulleys, rollers<br />
Railroad ties<br />
Other uses similar to white oak<br />
Uses for Chestnut Oak<br />
Cooperage<br />
Easkets<br />
Agricultural implements<br />
Uses for Overc Oak<br />
Furniture<br />
Tight cooperage<br />
Beams<br />
Veneer<br />
Car construction<br />
Veneer<br />
Fence posts<br />
Cooperage<br />
Agricultural implements<br />
Wheels<br />
Splints for chairs<br />
Other uses similar to white oak<br />
Handles<br />
Crossties<br />
Insulator pins<br />
Agricultural implements<br />
Other uses similar to white oak<br />
Red and sap gum lumber together constitute our most important allsouthern<br />
hardwood. Both are from the same species <strong>of</strong> tree, but may not<br />
com-! from the same individual, tree. A young tree, even <strong>of</strong> saw-log size,<br />
•ay be all sap wood. Most <strong>of</strong> the high grade red gum lumber is produced by<br />
the tree <strong>of</strong> three feet or more in diameter.<br />
Because the larger gum trees are scarce and the average run-<strong>of</strong>-tha-<br />
"111 log contains more sap than heart, the sap gum leads in volume manu<br />
factured, and the price is cheaper than that <strong>of</strong>, the red gum. If gum is<br />
thoroughly dried by a slow process, the inclination to warp is much re-<br />
—131--
duced. Inside rather than outside use is preferred generally.<br />
Some industries use sap gum entirely. The smooth light surface<br />
stains well and is an excellent base for any paint or enamel.<br />
Sap gutt is used in large quantity by manufacturers <strong>of</strong> inexpen<br />
sive to medium priced lines, while the red gum is used for both<br />
the medium priced and higher priced items.<br />
The shipping container manufacturers depend much upon the<br />
supply <strong>of</strong> the lower grades <strong>of</strong> re
Uses for Blank Gum<br />
Household furniture<br />
Office furniture<br />
Veneer for furniture<br />
Ifallets and mauls<br />
Wagon wheels<br />
Shipping containers<br />
Rollers<br />
Clothes pins<br />
Rough floors<br />
Hoppers<br />
Uses for Swamp Gum<br />
Turning and shaping<br />
Woodenware<br />
Artificial limbs<br />
Ship and plane models<br />
Soles for play shoes<br />
Yellow Poplar<br />
Wood tills<br />
Paving blocks<br />
Brake blocks<br />
Toys<br />
Rug poles<br />
Signs<br />
Interior trim<br />
Ro<strong>of</strong> trusses<br />
Hubs<br />
Curtain stretchers<br />
Drawing boards and tables<br />
Wood bicycles for children<br />
Toys<br />
Sat. ....<br />
EnfUctriiif<br />
Expf<br />
Station<br />
bdonriil . .<br />
. .Eeooo-ic<br />
Romcb . .<br />
Yellow poplar is light, s<strong>of</strong>t, sometimes brittle and is easily worked.<br />
The color varies from light yellowish to greenish brown. Because it is so<br />
pleasingly responsive to the use <strong>of</strong> hand tools, poplar has been called our<br />
most versatile wood.<br />
Uses for Yellow Poplar<br />
Carving, wood blocks<br />
Molding<br />
Chairs, fixtures<br />
Caskets, veneer<br />
Trunks<br />
Patterns<br />
Churns<br />
Kitohenware<br />
Ironing boards<br />
Baby carriages<br />
Aeroplane parts<br />
Camera cases<br />
Tobacco hogsheads<br />
Shell cases<br />
Boxes and crates<br />
Clocks<br />
Cottonwood<br />
Mirror backing<br />
Carpet sweepers<br />
Wooden novelties<br />
Vegetable baskets<br />
Woodenware<br />
Light cooperage<br />
Core stock (furniture)<br />
Poultry crates<br />
Incubators<br />
Egg carriers<br />
Interior trim, banisters,<br />
cornices^ sash, screen doors<br />
wall panels, columns<br />
Siding<br />
Sheathing<br />
Piano rims<br />
Swamp cottonwood makes up the bulk <strong>of</strong> southern cottonwood timber.<br />
Quantities are not very great but are found in mixtures with other hard<br />
woods, notably red gum, oaks, and sycamores along the river swamps.<br />
The wearing qualities <strong>of</strong> cottonwood may be exemplified by the fact<br />
that this wood won first place in a recent contest sponsored by the na<br />
tional Wooden Box Manufacturing Association. Cottonwood is light, s<strong>of</strong>t,<br />
weak, even-grained. The heart is prayish to dark brown. The wood resists<br />
splitting and lends itself to nailing. Plywood use <strong>of</strong> cottonwood takes<br />
r-133—<br />
.
advantage <strong>of</strong> the qualities <strong>of</strong> light weight and strength. Manu<br />
facturers are using this wood for agricultural implements,<br />
laundry appliances and planing mill products.<br />
Ash<br />
Sun ....<br />
Eflfiami<strong>of</strong><br />
Experiment<br />
Station<br />
Uses for Cottonwood CT!$>©<br />
Industrial . .<br />
. Eamnuc<br />
Low priced furniture Vehicle parts Rmi^b""<br />
Trunks Templates, excelsior<br />
Inside trunk parts Veneer<br />
S<strong>of</strong>t drink and sample cases Toys, matches, cheese heads<br />
Laundry appliances Mill products<br />
Woodenware Boxes, crates<br />
Brush backs Low grade lumber<br />
Agricultural implements<br />
<strong>Georgia</strong> has two species <strong>of</strong> ash, the white and the green. The lumber<br />
industry lists both as white ash and makes a distinction according to tex<br />
ture. The white ash produces a larger proportion <strong>of</strong> tough material than<br />
the green ash. More <strong>of</strong> the wood <strong>of</strong> the green ash is coarse grained,<br />
brittle and <strong>of</strong> poorer quality. This does not mean that a tough textured<br />
board cut from a white ash is superior to a tough textured board cut from<br />
the green ash.<br />
The two commercial grades <strong>of</strong> white ash are known as cabinet grade and<br />
tough texture. The lumber is separated into these two classes when cut.<br />
There are fe*r large ash trees. The specialized uses, however, Justi<br />
fy seeking them out, and, since ash produces a good average grade <strong>of</strong> timber<br />
lumbermen find it pr<strong>of</strong>itable to handle this hardwood from small trees.<br />
The fact that young ash burns well even when green has encouraged its<br />
use as fuel and reduced the lumber possibilities.<br />
Uses for Ash<br />
Cabinet work, refrigerators Plumber's material<br />
Trim for public buildings Billiard table rails<br />
Furniture frames Vehicle parts<br />
Tea room chairs Wheelbarrows<br />
• Ifusical instruments Tackle boxes<br />
Play ground equipment Baseball bats<br />
Kitchen equipment Tennis rackets<br />
Brush backs Auto parts<br />
Flooring Airplane parts<br />
Hill work Locomotive cabs<br />
Tool handles Ladders<br />
Food containers Elevators<br />
Venetian blinds Churns<br />
Cooperage Butter tubs<br />
Machine frames<br />
The usual <strong>Georgia</strong> sycamore is the button-ball, a typical stream bank<br />
species. The wood is moderately heavy hard, strong, tough, difficult to<br />
season, retains its shape after bending, and resists splitting, warping<br />
--1M--
tnd cupping* Surfacing sycamore requires a high speed cutting<br />
head. At low apeed the surface nay chip. Vegetables, fruits,<br />
and eggs packed in sycamore containers acquire no odor from the<br />
wood. The possibilities <strong>of</strong> sycamore utilization have never<br />
been thoroughly explored. Good effects are secured with.quar<br />
tered slice veneers.<br />
Uses for Sv<br />
Turning (for shaping and turning,<br />
one <strong>of</strong> the best <strong>of</strong> woods)<br />
Furniture, bedroom, living room<br />
Display cases for dresses<br />
Containers for foods<br />
Butcher's blocks<br />
Rotary-cut plywoods for trunk<br />
shelving and floor boards<br />
Cooperage<br />
Tpys, handles<br />
Ship building<br />
Veneer<br />
Woodenware<br />
Panel stock<br />
Vehicle parts<br />
Musical instruments<br />
Sun ....<br />
EnfiaraiBf<br />
E»f riant<br />
Surio. . . .<br />
Indutriil . .<br />
Rocarcb .<br />
S<strong>of</strong>t maple is likely to be located in damp, low ground. Warping,<br />
twisting, or cupping <strong>of</strong> this beautiful wood is unusual. The texture is<br />
fairly hard and strong. It glues easily and is one <strong>of</strong> the best to stay<br />
in place. In the furniture industry, s<strong>of</strong>t maple has long been in great<br />
demand.<br />
Uses for S<strong>of</strong>t Maple<br />
Living room furniture<br />
Cocktail tables<br />
Breakfast room furniture<br />
"Parlor frames" for upholstered<br />
chairs and davenports<br />
Bobbins<br />
Die blocks<br />
Wood type<br />
Hosiery forms<br />
Parasol handles<br />
Blueprint frames<br />
Shoe forms, lasts, heels<br />
Bowling alleys<br />
Cot frames<br />
Coat hangers<br />
Curtain poles<br />
Yard sticks<br />
Butter ladles<br />
Crates for eggs, fruits<br />
vegetables (Ash, freer<br />
from odor and taste)<br />
Butter tubs<br />
Shipping containers<br />
Elm<br />
The American or white elm is known to lumbermen as Southern s<strong>of</strong>t elm.<br />
It is a rapid grower and the production has been increasing since the ear<br />
ly thirties. Elm is fairly hard and tough but s<strong>of</strong>ter than the tupelos.<br />
The shock resistance is high and it is difficult to split. The elm is not<br />
plentiful in this Area but is found in moist fertile soils near streams,<br />
associated with s<strong>of</strong>t maples, pecan and sycamores. Blm is an excellent<br />
bending wood.<br />
Uses for Elm<br />
Athletic equipment<br />
Sporting goods<br />
Shoe heels and lasts<br />
Toy wagons and kiddy-cars<br />
Woodenware<br />
—135—<br />
Shocks<br />
Food containers<br />
Trim for low-cost construction<br />
Hay racks<br />
Slack cooperage
Uses for Elm (Continued)<br />
Veneers<br />
Hubs<br />
Ladders<br />
Elevators<br />
Agricultural implements<br />
Kitchen cabinets<br />
Broom handles<br />
Auto parts<br />
Boat building<br />
Baskets, boxes, crates<br />
(lower grades nay be<br />
used for these)<br />
State . . .<br />
&,,».««,<br />
Elpcniuu<br />
Station . .<br />
Ttc*<br />
Igdmtrul . .<br />
RtMireh . ,<br />
If hickory had ever existed in large, pure stands, there might be no<br />
sizable hickory standing today. Nature's protection against destruction<br />
is in scattered distribution. Among the well known qualities that have<br />
created a steady denand for this wood are strength, elasticity and tough<br />
ness.<br />
Uses <strong>of</strong> Hickor<br />
Bandies for striking tools<br />
Kagon parts<br />
Ladder rungs<br />
Run implements<br />
Gymnastic bars<br />
Men's clubs, stores and dens<br />
Lasts<br />
Tripods<br />
Trunk slate<br />
Solf clubs<br />
Insulator pins<br />
Brackets<br />
Ifallets<br />
Loom parts<br />
Tent poles<br />
Sucker rods for pumps<br />
Police clubs<br />
Archer's bows<br />
Grain cradles<br />
Auto and truck parts<br />
Dowels and skewers<br />
Poultry crates<br />
Incubators<br />
Beech<br />
Beech is not plentiful in this Area but is included because <strong>of</strong> its<br />
rare qualities. In two respects, at least, it tops the list <strong>of</strong> southern<br />
hardwoods, in maximum tensile strength and in ability to hold nails and<br />
screws. Beech is restricted to moist, well-drained soils, usually near<br />
streams. The wood is hard, heavy, strong, tough and not durable in con<br />
tact with the soil. It turns well and responds with satisfactory results<br />
to machine tools. The low pries <strong>of</strong> beech, its excellent properties and<br />
its smooth, hard surface are likely to insure a growing demand for the<br />
products <strong>of</strong> this wood.<br />
Basswood<br />
Uses for Beech<br />
Bedroom furniture<br />
Showcases and fixtures<br />
Brush backs and handles<br />
Laundry appliances<br />
Interior finish<br />
Boxes and baskets<br />
Clothes pins<br />
Flooring<br />
Paneling<br />
Cabinets<br />
Spools<br />
Bobbins<br />
Tops<br />
ffoodenware<br />
Basswood is one <strong>of</strong> the s<strong>of</strong>test <strong>of</strong> the hardwoods, and demand has in<br />
creased rapidly for it during recent years. This demand may be due largc-<br />
—136—
jy to its increased use by the navy for making patterns, but it<br />
it also the best excelsior wood known. The wood is s<strong>of</strong>t, light,<br />
fise-grained, and practically free from warping.<br />
Uses for Basswood<br />
Drawing boards<br />
Picture frames<br />
Holding<br />
Templates<br />
Woodenware<br />
Veneer<br />
Honey-comb frames<br />
Food containers<br />
Wash boards<br />
' Ironing boards<br />
Venetian blinds<br />
Trunks, luggage<br />
Pianos<br />
Cigar boxes<br />
Toys<br />
Excelsior<br />
State ....<br />
Eoginmuif<br />
Experimtnt<br />
Station . . .<br />
Gtorgia<br />
Txh<br />
Indaitrial . .<br />
. . Economic<br />
Rtacaicb . .<br />
Dogwood is found on fertile, well-drained soils throughout <strong>Georgia</strong>.<br />
The wood is heavy and very hard, strong, close-grained, and light brown,<br />
tiaged with red. Because <strong>of</strong> these qualities, the demand for dogwood has<br />
been great, and <strong>of</strong>ten it is not allowed to grow to large size where it is<br />
accessible. The usual diameter is from two to four inches. A few trees<br />
are found thirty to forty feet high, having a diameter <strong>of</strong> one to one and<br />
ons-half feet.<br />
Uses for Dog<br />
Shuttle blocks<br />
Die blocks<br />
Bobbins<br />
Dominoes<br />
Gunstocks<br />
Insulator brackets, pins<br />
Novelties<br />
Pulleys<br />
Hedges<br />
Rollers<br />
Shoe heels and trees<br />
Spindles<br />
Tenpins<br />
Indian clubs<br />
Dowel's<br />
Mallet heads<br />
Golf stick heads<br />
Gavels<br />
Black Walnut<br />
Black walnut is the most valuable single tree species growing in<br />
Gflfcrgia. It rarely grows in pure stands, a natural condition which has<br />
helped prevent its extinction. Walnut takes a beautiful finish, resists<br />
•arping if properly seasoned, and is moderately easily worked. The wood<br />
has about the hardness <strong>of</strong> the tupelo class, endures well, is even-grained.<br />
and has the quality <strong>of</strong> staying in plaoe. The beautiful dark, chocolatecolored<br />
grain is generally admired.<br />
Uses for Black Walnut<br />
Furniture—beds, tables, cabi<br />
nets, desks, chairs<br />
Musical instruments, record con<br />
tainers<br />
Show cases and fixtures<br />
Closet poles, bathroom shelves<br />
Picture frames and molding<br />
Caskets<br />
Drop-leaf tables and type<br />
writer desks<br />
Silver and china chests<br />
Veneer and panel construction<br />
Interior finish<br />
Gun stocks<br />
Sewing DKchines<br />
—137—
A<br />
Catalpa or aatawba, origir-ally native only to. the south<br />
western part <strong>of</strong> the State, is rare in saw-log size and grows<br />
chiefly in cultivation. The native tree is <strong>of</strong> slow growth, in<br />
contrast with the rapid growth <strong>of</strong> cultivated specimens. Catalpa's<br />
chief interest lies in the fact that its wood is quite<br />
different from any other. farmers prize it for fence posts,<br />
and it is used for general construction purposes on many farms.<br />
Uses for Catalpa<br />
Fence posts Road construction<br />
Out-door construction Plumber's woodwork<br />
Ground sills Crossties<br />
Conduits in the soil Troughs and vats<br />
Eoney Locust<br />
Except to an experienced eye, locust lumber resembles red oak. It<br />
weighs about the same but is harder, has freater bending strength, and<br />
greater shock resistance than red oak. The locust is armed with thorns<br />
which have tended to discourage its use. The wood is fairly durable in<br />
contact with the soil, and is strong.<br />
Uses for Honey Locust<br />
Fence posts Tlindow frames<br />
Hheel hubs Exterior doors<br />
Ties Sills<br />
Construction Lawn furniture<br />
Porch flooring<br />
Persimmon<br />
Persimmon is one <strong>of</strong> the hardest, heaviest and strongest <strong>of</strong> American<br />
hardwoods. Although white oak is a little heavier, persimmon is much<br />
harder, and in addition, remains smooth under continuous wear. Only the<br />
sapwood is used in industry, but the heart usually composes only a small<br />
part. The wood turns easily, planes smoothly, and takes an excellent<br />
polish. It does not respond to gluing, and is subject to splitting from *<br />
nails and screws. When green, it should be worked in winter only.<br />
Willow<br />
Uses for Persimmon<br />
Gulf cluo heads Billiard cues<br />
Shuttle blocks Ibllets<br />
Machinery brush handles Children'.= vj'iicles<br />
Shoe lasts Pulleys<br />
Skewers Toys<br />
Willow is s<strong>of</strong>t-textured, light in weight, strong for its weight, and<br />
easily worked. It is one <strong>of</strong> the best woods for gluing, remains flat, and<br />
resists shrinkage. The variable color <strong>of</strong> the wood adds to its attractive<br />
ness. Its light weight, 2800 pounds per 1000 feet, makes it economical to<br />
chip to distant markets.<br />
--138--
The qualities <strong>of</strong> "to splinter" and "no check" have added<br />
to itS value. Trees large enough for lumber are found only in<br />
remote swamps and river bottoms.<br />
Uses for Willow<br />
Wall paneling<br />
Veneer pieces<br />
Table tops<br />
Fancy suites<br />
Light chairs and beds<br />
Shipping containers<br />
Beverage boxes<br />
Interior trim<br />
Artificial limbs<br />
Toys<br />
Apiarist's supplies<br />
Barn and cellar floors<br />
--139--
Paper Industries<br />
The Northeast <strong>Georgia</strong> Area possesses five advantages which<br />
should jcake it attractive to paper industries. These are:<br />
1. Ample supplies <strong>of</strong> pulpwood<br />
2. Water<br />
3. Ample rail and highway transportation<br />
4. Accessible supplies <strong>of</strong> kaolin for filler<br />
Sutc , m...<br />
Eafiucriai<br />
Experiment<br />
Surion . . .<br />
<strong>Georgia</strong><br />
Ttdt<br />
Indnitriil . .<br />
. . Economic<br />
Research .<br />
Table M-22 indicates that within the Northeast <strong>Georgia</strong> Area there are<br />
1,693,882 acres <strong>of</strong> timber-land—all irithin less than seventy-five miles <strong>of</strong><br />
Gainesville. Very conservatively, this timber-land can produce from<br />
£00,000 to 800,000 cords <strong>of</strong> pulpwood annually. This is sufficient to pro<br />
vide raw material for the production <strong>of</strong> pulp at the rate <strong>of</strong> from 800 to<br />
1,500 tons a day.<br />
Predominately, the timber involved is longleaf, although slightly over<br />
twenty per cent <strong>of</strong> the standing timber represents various hardwoods. The<br />
only basic pulpwood drain existing is represented by pulpwood being shipped<br />
at the. present time to Savannah.<br />
Stable Supply; The pine pulpwood described represents a stable annual<br />
supply so that transportation costs from the forest to the mill will not<br />
tend to increase from year to year as is the case with -sources whioh have<br />
a lower annual rate <strong>of</strong> growth. The demand for wood pulp for paper and<br />
other uses has increased rapidly in recent years. In 1920 the United<br />
States production <strong>of</strong> pulpwood was only 3.E million tons; less than half a<br />
million tons <strong>of</strong> this were produced in the entire South. Under war condi<br />
tions the 1944 United States pulpwood quota was approximately fourteen<br />
million tons. More than half, or eight million tons, <strong>of</strong> this had been as<br />
signed to the South.<br />
This war bulge from the 10.4 million tons required nationally in 1942<br />
results from the huge total <strong>of</strong> Army and Navy supplies and munitions. This<br />
does not, however, imply that a demand <strong>of</strong> this order will disappear with<br />
the peace. For years, the major part <strong>of</strong> the paper supply has gone into<br />
various packaging uses. A postwar shift from munitions to civilian goods<br />
will cause relatively little change in national productivity if the nation<br />
al productivities are maintained at some level comparable with the war<br />
period. Better packaging <strong>of</strong> civilian goods is already being resumed and<br />
the extent to which individual items now are being given special protective<br />
wrapping may well be expected to increase. War developed methods used will<br />
require more paper.<br />
Postwar Market: The extent to which postwar consumption may be expected<br />
to rise in comparison with pre-war levels is indicated by Table If-12<br />
quoted from the Monthly Eeview <strong>of</strong> the Federal Reserve Bank <strong>of</strong> Atlanta for<br />
September 30, 1944.<br />
In contenting on this table, the Heserve Bank publication says:<br />
TCiat does the postwar future hold for the pulp and paper industry<br />
The United States Department <strong>of</strong> Commerce has made forecasts <strong>of</strong> estimated<br />
domestic product. The department took 1946 as the assumed first postwar<br />
normal year and calculated production <strong>of</strong> wood pulp for various levels <strong>of</strong><br />
gross national product ranging from 145 to 154 billion dollars. The sta<br />
tistical projection indicates that, with a gross national product <strong>of</strong> 145<br />
billion dollars, domestic production <strong>of</strong> pulpwood would be 10.89 million<br />
—140--
short tons, imports would total 3.J5 Billion short tons, and do<br />
mestic consumption would be 14.24 million short tons. On the<br />
optimistic assumption <strong>of</strong> 165 billion dollars gross national<br />
product in 1946, all these factors would increase. Eomestic<br />
production <strong>of</strong> wood pulp would then bo 12.00 Billion short tons<br />
with'imports <strong>of</strong> 3.68 million short tons and approximate domestic<br />
consumption <strong>of</strong> 15.69.<br />
Table 31-12<br />
Estimated Production <strong>of</strong> Paper and Paperboard iff 1946<br />
at Various Levels <strong>of</strong> Gross National Product1<br />
(Levels <strong>of</strong> gross<br />
national product in<br />
billions <strong>of</strong> dollars)<br />
Item<br />
Paperboard ....<br />
Wrapping paper ...<br />
Book paper . . . .<br />
Tissue paper ....<br />
All other paper > . ,<br />
1941<br />
(Actual)<br />
119.20<br />
17.30<br />
8.25<br />
1.05<br />
2.75<br />
2.02<br />
.96<br />
2.27<br />
145.00<br />
Estimated for 1946 at various<br />
levels in Billions <strong>of</strong> Dollars<br />
In<br />
21.00<br />
10.44<br />
.57<br />
3.65<br />
2.18<br />
1.22<br />
2.94<br />
150.00 155,00 160.00 165.00<br />
Production<br />
Millions <strong>of</strong> Short Tons<br />
21.62<br />
10.75<br />
.58<br />
3. 73<br />
2.25<br />
1.25<br />
3.03<br />
22.24<br />
11.05<br />
.60<br />
3.88<br />
2.31<br />
1.29<br />
3.11<br />
22.85<br />
11.36<br />
.62<br />
3.98<br />
2.37<br />
1.33<br />
3.19<br />
23.47<br />
11.67<br />
.63<br />
4.08<br />
2.44<br />
1.36<br />
3.29<br />
Source: Domestic Commerce, June 1943, p. 26.<br />
Gross national product includes total expenditures for consumers 1<br />
goods and services, capital formation by private enterprise, and the prod<br />
uct <strong>of</strong> Government.<br />
z Although domestic newsprint production displays a downward trend at<br />
estimated production levels in 1946, this does not necessarily indicate a<br />
falling-<strong>of</strong>f in consumption <strong>of</strong> newsprint. From eighty to eighty-five per<br />
cent <strong>of</strong> all paper imported into the United States is composed <strong>of</strong> news<br />
print.<br />
"... In the years just preceding the war, the pulp and paper industry<br />
as a whole had a good bit <strong>of</strong> excess capacity, and there were a number <strong>of</strong><br />
marginal plants, i.e. plants that could operate only on a high market.<br />
During the war, this capacity has almost all come into production and the<br />
problem has been that <strong>of</strong> meeting rising denands. It ssems likaly that<br />
total demand will fall somewhat at the end <strong>of</strong> the war, but the experience<br />
<strong>of</strong> the Southarn branch <strong>of</strong> the Industry seemingly will differ from that <strong>of</strong><br />
the industry as a whole. In the first place. Southern plants are newer and<br />
larger, and Iwve lower unit costs than tha average plant in the country,<br />
and, in the second place, the development <strong>of</strong> successful processes for<br />
bleaching sulphate pulp nafces it likely that the paper industry will con<br />
tinue to neve South so that the fall in production will probably be concen<br />
trated in the Northern plants. Another favorable factor, at least so far<br />
as Southern plants are concerned, is the increasing stress upon attractive<br />
packaging. Jraft japer and paperboard made from pine pulp thus have a<br />
bright future in the development <strong>of</strong> new outlets for packaging materials in<br />
postwar America. 1*<br />
—141—
Existing Plantsi Three paper plants are already established<br />
in <strong>Georgia</strong>.Three more are located just across the<br />
Florida line. All six <strong>of</strong> these plants have tidewater locations.<br />
Two <strong>of</strong> the three in <strong>Georgia</strong> produce a finished productj while<br />
one produces only the raw pulp. The Union Bag and Paper Corpor<br />
ation <strong>of</strong> Savannah, established in 1936, and the St. Mary's Kraft<br />
Corporation <strong>of</strong> St. Mary's established in 1S41, produce a Kraft<br />
wrapping paper. The Savannah plant converts its production into<br />
Stair .<br />
Expc<br />
Sution . . .<br />
GfOrffu<br />
T*h<br />
Indumiil . .<br />
. . EeoBoraic<br />
Rcttarcb . .<br />
bags. The Brunswick plant produces pulp which is finished By mills in<br />
Pennsylvania. In general, these plants tend to show a more pr<strong>of</strong>itable op<br />
eration than the United States industry average. One factor in this is<br />
that these plants being new installations are probably more modern and ef<br />
ficient. Other factors, however, may contrioute to this result. These<br />
arei (1) the availability <strong>of</strong> a more stabilized source <strong>of</strong> wood pulp as al<br />
ready discussed, (2) the availability <strong>of</strong> water transportation, (3) likely<br />
lower power costs, and (4) more progressive policies.<br />
Census Comparisons; In 1939 there were only two paper mills in<br />
<strong>Georgia</strong>, so that direct census data were not published. Operating condi<br />
tions were, however,<br />
Table lf-13 Tery similar to those<br />
for Florida. Compari<br />
Paper and Paperboard Industry<br />
sons between Florida<br />
and the United States<br />
United States Florida are shown in Table 11-13.<br />
Item<br />
Wages and Salaries<br />
Salaries Only<br />
Value <strong>of</strong> Product<br />
Cost <strong>of</strong> Material<br />
Value Added<br />
Margin<br />
Thou<br />
sands<br />
<strong>of</strong><br />
Dollars<br />
$175,540<br />
32,930<br />
933,016<br />
532,261<br />
400,755<br />
225,215<br />
Per<br />
$100<br />
Pay<br />
roll<br />
$100<br />
19<br />
513<br />
303<br />
228<br />
128<br />
Thou<br />
sands<br />
<strong>of</strong><br />
Dollars<br />
$ 1,406<br />
219<br />
14,125<br />
' 7,335<br />
6,790<br />
5,384<br />
Per<br />
$100<br />
Pay<br />
roll<br />
$ 100<br />
15<br />
1,005<br />
522<br />
483<br />
382<br />
The general indica<br />
tion from the margin<br />
items in the table at<br />
the left is that paper<br />
mills in the <strong>Georgia</strong>-<br />
Florida pine area have<br />
an advantage in margin<br />
equal to the difference<br />
between the United<br />
States figure <strong>of</strong> $128<br />
and the Florida fig<br />
ure <strong>of</strong> (382, or $254<br />
per $100 <strong>of</strong> payroll.<br />
Finished Paper: The inclusion <strong>of</strong> finishing as well as pulp making<br />
in a paper operation is a definite advantage to the community since the<br />
finishing operations greatly increase the Value Added and in consequence<br />
require plant payrolls several times those <strong>of</strong> the pulp mill or mills which<br />
supply the finishing plant. This factor contributes in part to the Gross<br />
Margin advantage for Florida plants already mentioned. All <strong>of</strong> the Florida<br />
plants are producing finished Eraft wrapping paper.<br />
Tlearly all the kaolin used as a filler in paper finishing is produced<br />
in <strong>Georgia</strong>—largely along the fall line between Macon and Aiken, South<br />
Carolina, just east <strong>of</strong> Augusta. The Northeast <strong>Georgia</strong> Area has direct<br />
rail connections with Macon, a circumstance which should provide some ad<br />
vantage in the manufacture <strong>of</strong> low—priced bond and book papers.<br />
—142—
Handicraft Industries<br />
numerous small handcraft industries producing items such as<br />
hand-made novelty jewelry, hoolced rugs, hand-made furniture t pot<br />
tery, and novelties <strong>of</strong> many kinds appear possible in counties<br />
such as Eabun, Babera'ham, Stephens, Unite, Lumpkin, Towns, and<br />
Onion. Their pr<strong>of</strong>itable development would largely be dependent<br />
on the expansion <strong>of</strong> a tourist business in the Area, since tour<br />
ists are the natural market for such items.<br />
Expcruuac<br />
Sutiog . . .'<br />
Tidi<br />
bducrul . .<br />
. . Eeomomif<br />
Raenth . .<br />
The basic economics <strong>of</strong> such a development, however, are difficult to<br />
describe. In many eases the successful efforts appear to grow spontane<br />
ously as the result'<strong>of</strong> an idea, or casual circumstance, rather than out<br />
<strong>of</strong> deliberate plan. Capital does not appear to be important in the be<br />
ginning, and probably should not be employed extensively until sales have<br />
attained a stable level, since this will tend to minimize possible losses.<br />
It is only after such enterprises have made considerable progress<br />
r-jth tourist sales that any attempt should be made to establish a market<br />
through retail outlets at points outside the Area. Then, occasionally,<br />
such items nay find a market which justifies factory methods and which<br />
nay lead to a national market through department stores, gift shops,<br />
antique shops,or decorators,depending on the nature <strong>of</strong> the idea itself.<br />
Such varying raw materials as native stone, pine cones, wood, clay,<br />
semi-precious stones, feathers, or almost any common thing may be the<br />
starting point. Skills as varied as whittling or modeling may be em<br />
ployed. There is no rule to describe how to start. One simply makes<br />
something out <strong>of</strong> the materials at hand for any <strong>of</strong> a dozen reasons, some<br />
one else happens to see and like it,and perhaps a brisk demand develops.<br />
Only with crafts like hooked rugs, hand-weaving or pottery is there<br />
initial need for any formal business organization; or for equipment to<br />
start. Either hooked rugs or hand weaving require looms. Both require<br />
purchased materials and designs. Some sort <strong>of</strong> "factoring" may provide<br />
materials and designs, make loom building instructions available,and<br />
finally buy the product. This is in effect the way the bedspread in<br />
dustry got its start in northwest <strong>Georgia</strong>.<br />
A pottery, on the other hand, requires only a source <strong>of</strong> clay, a<br />
pug mill, a kiln and a pottery wheel— plus skill and a feeling for<br />
design. Ware should be glazed, a procedure nowhere as difficult as is<br />
sonetines thought. Highway display and tourist sales are the obvious<br />
backbone <strong>of</strong> sales, but if the design is sound and the turning skillful,<br />
>. narket in department stores or decorators' shops is possible.<br />
—143--
Plastics and Rayons Sm,<br />
The Northeast <strong>Georgia</strong> Area <strong>of</strong>fers raw material, power, and<br />
labor advantages for the expansion <strong>of</strong> cellulose plastics and<br />
rayon manufacture in the Southeast. Additional rayon production<br />
will likely be desirable, because <strong>of</strong> the increasing demand for<br />
this fiber by <strong>Georgia</strong>, South Carolina, and Alabama textile<br />
mills.<br />
Engineering<br />
Experiment<br />
Station . .<br />
Groroia<br />
Tid,<br />
Indtutrul . .<br />
. . Economic<br />
Ranrch . .<br />
There are three general types <strong>of</strong> plastics—natural, semi-synthetic,<br />
and synthetic. The natural plastics include those substances whose basic<br />
chemical structure has been created by nature, such as rosin. The semisynthetic<br />
plastics make use <strong>of</strong> natural chemical structures but modify or<br />
regenerate these by further chemical reaction or treatment} in this class<br />
fall the cellulose and protein plastics. The third class, that <strong>of</strong> the<br />
synthetic plastics or resins, comprises those polymeric materials which<br />
are created by chemical reaction from organic chemicals capable <strong>of</strong> such<br />
interaction; it includes such plastics as Bakelite, Saran, and Plexiglas.<br />
Plastics and fibers are closely related on the basis <strong>of</strong> chemical<br />
structure and constitution. Acetate rayons, for example, differ only<br />
slightly from the corresponding plastics, while such synthetics as Saran<br />
may be extruded as a fiber or molded as a plastic. Even Nylon finds use<br />
as a plastic.<br />
Cellulose Plastics; The cellulose plastics are made either from cot<br />
ton lir.ters or pulpwood, both <strong>of</strong> which are available in the Area. The<br />
other principal raw materials required, depending on the plastic, are<br />
nitric acid, sulfuric acid, acetic acid, and acetic anhydride. Sulfuric<br />
acid is produced in <strong>Georgia</strong> by the lead chamber process but only in con<br />
centrations suitable for use in fertilizers. None <strong>of</strong> the other chemicals<br />
are produced in <strong>Georgia</strong>. Strong sulfuric acid, however, is produced at<br />
Copperhill, Tennessee, and nitric acid at Muscle Shoals, Alabama. Typi<br />
cal cellulose plastics include the celluloid type (nitrocellulose), cel<br />
lulose acetate, and other cellulose esters and ethers, many <strong>of</strong> which can<br />
be molded, extruded as fibers, etc. Rayons fall in this class, as does<br />
cellophane.<br />
Natural Plastics; <strong>Georgia</strong> is the largest producer <strong>of</strong> naval stores in<br />
the Ifaited States. While this industry is not in the Northeast <strong>Georgia</strong><br />
Area, its accessible location in South <strong>Georgia</strong> might <strong>of</strong>fer a raw material<br />
advantage. Two possibilities exist, both <strong>of</strong> which should be considered:<br />
(1) the development <strong>of</strong> new plastics from rosin and turpentine through re<br />
search, and (2) the manufacture <strong>of</strong> ester gum resins from rosin and glycerol.<br />
Ester gums are important in the paint industry.<br />
•<br />
Glycerol, necessary for the manufacture <strong>of</strong> ester gums, is a by<br />
product <strong>of</strong> soap manufacture. This is significant in that the establish<br />
ment <strong>of</strong> a soap plant would add glycerol to the already available rosin,<br />
and, while the soap industry is highly competitive, the Southeast pro<br />
vides a good soap market. Because <strong>of</strong> the availability <strong>of</strong> vegetable oils<br />
and rosins required, various graces or soap can Be produced at a competi<br />
tive cost for sale both in the regional market and in the populous East.<br />
If the advantage <strong>of</strong> a local source <strong>of</strong> glycerol could be added to that<br />
inherent in being adjacent to the naval stores belt, the manufacture <strong>of</strong><br />
ester gums might prove attractive. A sound source <strong>of</strong> ester gums might<br />
begin the concentration in the Southeast <strong>of</strong> the widely scattered paintindustry.
Protein Plastics; The manufacture <strong>of</strong> protein plastics from<br />
casein, soybeans, and similar agricultural products should also<br />
be considered, even though tonnages are not comparable to the<br />
cellulose plastics.<br />
Plastic Processing; While plant investments in plastic<br />
processing will range upward from $2,500 per manufacturing em<br />
ployee, production rates per machine are high, and, in conse<br />
quence, the turn-over <strong>of</strong> working capital can be rapid.<br />
State ....<br />
Eafiaccriaf<br />
Experiment<br />
Station . . .<br />
G*oryia<br />
Ttth<br />
lodutrul . .<br />
. . Ecoaomu<br />
Rcwjrcb . .<br />
The production <strong>of</strong> finished articles from all types <strong>of</strong> plastics is<br />
certain to continue to be one <strong>of</strong> the nation's expanding industries. The<br />
Chicopee Hills have already engaged in the production <strong>of</strong> woven plastic<br />
screen cloth and are preparing to build a plastic processing plant at<br />
Cornelia. While this industry is extremely "foot-loose" and may in<br />
consequence be established in a great many places, the Northeast <strong>Georgia</strong><br />
Area has two advantages: a favorable electric power cost for the opera<br />
tion <strong>of</strong> die presses and potential market in the automotive plant expan<br />
sion at Atlanta. Other markets for more general consumer goods such as<br />
kitchen gadgets and novelties are also available in the Southeast, where<br />
there would be an advantage from the viewpoint <strong>of</strong> distribution.<br />
Basic management requirements call for alert chemical and mechanical<br />
engineers in both production and sales, and sound art design by qualified<br />
artists is definitely required for the production <strong>of</strong> consumer goods. The<br />
cost differences between superior and "just average" products are <strong>of</strong>ten<br />
slight, and, as a consequence, continued sales and pr<strong>of</strong>it depend on tech<br />
nical imagination.<br />
Of these plastics and fibers, the purely synthetic types appear to<br />
<strong>of</strong>fer no special opportunity in the Area, since neither coal nor petroleuE—<br />
the chief raw materials— are available in Northeast <strong>Georgia</strong> on<br />
a competitive basis.<br />
As mentioned, the textile industry in the South provides a ready<br />
market for synthetic fibers, either for use alone or for blending with<br />
cotton or flax.<br />
—145—
Clothing Industries<br />
One <strong>of</strong> the probable opportunities for industrial expansion<br />
In the northeast <strong>Georgia</strong> Area is in the clothing industries,<br />
nationally this group represented a total production <strong>of</strong> over<br />
three billion dollars and employed about 720,000 wage earners in<br />
1939. As an industry it is concentrated in the Greater New York section,<br />
in St. Louis, in Rochester, K. T., in Chicago, and to a lesser degree in<br />
las Angeles. Production in the Southeast has been expanding in recent<br />
years, particularly in <strong>Georgia</strong> and Tennessee and in smaller volume in North<br />
Carolina^ Mississippi, and Louisiana. Table 11-55 (page 148) shows the lo<br />
cation by states <strong>of</strong> the 300 establishments in the 31 types <strong>of</strong> clothing<br />
industries found in the Southeast in 1939.<br />
The 1939 value <strong>of</strong> clothing produced in <strong>Georgia</strong> is believed to be be<br />
tween $36 and $40 million,although direct figures are not available in the<br />
census for" either <strong>Georgia</strong> or other Southeastern states in sufficient de<br />
tail to permit a very accurate summary. The <strong>Georgia</strong> employment exceeded<br />
seven thousand,although an exact figure is not available from the census.<br />
Employment and value have both increased during the war period. While the<br />
total value in the Southeast is still a small proportion <strong>of</strong> the United<br />
States total, signs <strong>of</strong> growth are evident, particularly in <strong>Georgia</strong>, which<br />
justify an examination <strong>of</strong> the possibilities <strong>of</strong> further growth and the<br />
probable direction which it may be expected to take.<br />
The complexity <strong>of</strong> the apparel industry is indicated by its division<br />
into 57 separate industry types by the Census <strong>of</strong> Manufactures. For 1939,<br />
data were published in six major groups in which these 57 industry types<br />
were divided into 13 sub-groups as summarized in Table K-54.<br />
Group<br />
Table 11-54<br />
General Summary <strong>of</strong> Apparel Industries<br />
Tor united States in j.959 ~<br />
Men's Wear<br />
Ken's Eats<br />
ffomen's and Misses'<br />
Outerwear<br />
Children's, Infants'<br />
Outerwear<br />
Wor-en's Accessories<br />
and Millinery<br />
Furs and Miscel<br />
laneous<br />
Grand Totals<br />
<strong>of</strong> Number Sub-groups<br />
5<br />
2<br />
1<br />
1<br />
2<br />
2<br />
13<br />
CO<br />
q><br />
»w<br />
11<br />
/="<br />
13<br />
7<br />
10<br />
6<br />
7<br />
14<br />
57<br />
Total<br />
Average<br />
Wage<br />
Earners<br />
318,214<br />
23,739<br />
207,642<br />
23,604<br />
87,472<br />
55,721<br />
716,592<br />
Value<br />
<strong>of</strong><br />
Product<br />
(Add<br />
000)<br />
$1,099,769<br />
77,927<br />
1,015,757<br />
96,484<br />
373,463<br />
371,230<br />
$3,034,630<br />
Source: U. S. Census, Manufactures, 1939.<br />
—146—<br />
The future <strong>of</strong> the<br />
industry in the South<br />
east may continue a-<br />
long the lines which<br />
have concentrated over<br />
half the labor em<br />
ployed in making work<br />
shirts in the South<br />
east, and, in <strong>Georgia</strong>,<br />
<strong>of</strong> over ten per cent<br />
<strong>of</strong> the employment in<br />
the "semi-dress trou<br />
sers, wash suits and<br />
washable service ap<br />
parel" industry, and<br />
over 5 per cent <strong>of</strong> the<br />
employment in "work<br />
clothing (except<br />
shirts)." Almost all<br />
the blanket-lined<br />
coats in 1939 were<br />
made in <strong>Georgia</strong>. The<br />
question <strong>of</strong> entering<br />
the style field, how<br />
ever, should be raised.<br />
The current trend in<br />
Southern textiles to-
nurd mixed fiber fabrics, the more intensive promotion <strong>of</strong> cot<br />
ton as a style fabric by the Cotton Textile Institute, and the<br />
recent entry <strong>of</strong> m«iiH into the fashion market as a center <strong>of</strong><br />
origination, all point to the possibility that a new fashion<br />
alignment nay be in the making.<br />
The war has upset the fashion dominance <strong>of</strong> the Paris dress<br />
makers. Hollywood has been an entry in .the field for several<br />
years and is apparently solidifying its position through aggressive mer<br />
chandising based on the use <strong>of</strong> designs from Hollywood dress salons by the<br />
moving picture industry. New York has a firm background <strong>of</strong> museum material<br />
and con-petent designers working with established manufacturers, but lacks<br />
the particular glamour that is a requisite for setting fashions. Miami at<br />
tracts the select group whose approval makes a good design become "the<br />
fashion," as well as the equally important and larger group who "accept"<br />
the "approval" <strong>of</strong> the select group.<br />
It is very doubtful if any other point in the Southeast could provide<br />
a similar background for a new fashion promotion, without which fashion<br />
garments could not be added to the productive enterprises <strong>of</strong> the region.<br />
Opportunities may well begin to develop in <strong>Georgia</strong>—and the Northeast<br />
<strong>Georgia</strong> Area—for the manufacture <strong>of</strong> fashion garments, particularly in the<br />
loner and middle price ranges, which are based on Miami fashion trends and<br />
merchandised through showings at the Miami style show which was inaugurated<br />
last fall.<br />
Such operations must <strong>of</strong> necessity be built around a combination <strong>of</strong> a<br />
good designer, a competent fashion merchandiser,and an intelligent produc<br />
tion Ban. A sound capital position is always desirable, but design is the<br />
factor which makes or breaks in this field.<br />
The position <strong>of</strong> <strong>Georgia</strong>—in the center <strong>of</strong> the cotton te;rtile industry<br />
and halfway between a developing style center and the major consuming mar<br />
kets— and an increasing emphasis on finished fabrics, provide interest-<br />
Ing possibilities. From a distributive view, fashion garments manufac<br />
tured in <strong>Georgia</strong> can reach retailers in all major cities east <strong>of</strong> the Mis<br />
sissippi and in most <strong>of</strong> the South in two days by express and overnight by<br />
air. Twenty-four hour delivery in New York, Chicago, St. Louis, and De<br />
troit is possible. From the fabric viewpoint,style fabrics are being in<br />
creasingly finished in <strong>Georgia</strong> and the Southeast. The development <strong>of</strong> ade<br />
quate design resources, then, is the heart <strong>of</strong> the problem. At the present<br />
time, it must be admitted, good designers are scarcer in the Southeast<br />
than elsewhere. This simply reflects the fact that,in general, industry<br />
has made less use <strong>of</strong> skilled designers <strong>of</strong> all kln'ds than it should. In<br />
creased demand which recognizes that good design costs real money will<br />
find those who have the skill. Design material is, however, well repre<br />
sented in the various college libraries in Atlanta and'in the Atlanta Car<br />
negie Library. Museum items (other than paintings), however, are very<br />
limited and largely confined to private collections, or scattered in non-<br />
Buseum public buildings.<br />
As has already been pointed out, much <strong>of</strong> the existing apparel indus<br />
try in the Southeast was originally attracted on the presumption <strong>of</strong> low<br />
wges. Garment industry wages hav« always been somewhat higher than tex<br />
tile wages, as is shown by a study <strong>of</strong> the averages published by the United<br />
States Department <strong>of</strong> Labor. 1 The present trend is for the average for<br />
Figures n.gures quoted are from Survey <strong>of</strong> or Current C Business issued monthly by<br />
the United States Department <strong>of</strong> Commer"ce7<br />
—147—
Table M-55<br />
Hunber <strong>of</strong> Plants In Southeast by States<br />
"for Apparel Industries, T831T<br />
Industry Type<br />
Total Hunber <strong>of</strong> Plants ....<br />
Ken's and boys' suits, coats, and<br />
Hen's and boys' shirts, collars, and<br />
Contract factories 1 ......<br />
Trousers (semi-dress), wash suits, and<br />
Sport garments (except leather) and other<br />
Hen's and boys' hats and caps (except fell<br />
Bat bodies and hats - fur felt ...<br />
Finishing <strong>of</strong> Hen's and boys' hats.<br />
Women's, children's, and infants'<br />
underwear and nightwear <strong>of</strong>i<br />
Cotton and flannelette-woven fabrics .<br />
Silic and rayon woven fabrics ...<br />
Corsets and allied garments ....<br />
Work gloves and mittens, cloth, cloth<br />
and leather combined .....<br />
Suspenders, garters, other goods from<br />
purchased elastic material ....<br />
Robes, lounging garments, dressing gowns<br />
Trimmings, stamped art goods, and art<br />
Children's, infants' wear, If.E.C . .<br />
Women's and misses' dresses (except<br />
House dresses, uniforms and aprons . .<br />
Coats, suits, skirts (except fur coats)<br />
Women's and misses' clothing H.E.C . .<br />
nK *»<br />
• O<br />
WE-.<br />
300<br />
31<br />
4<br />
27<br />
6<br />
19<br />
30<br />
77<br />
5<br />
9<br />
Z<br />
1<br />
1<br />
1<br />
6<br />
4<br />
2<br />
3<br />
3<br />
8<br />
8<br />
4<br />
1<br />
3<br />
1<br />
2<br />
2<br />
10<br />
5<br />
16<br />
4<br />
6<br />
•<br />
A<br />
19<br />
1<br />
4<br />
2<br />
2<br />
5<br />
1<br />
2<br />
1<br />
1<br />
£<br />
• •<br />
S<br />
90<br />
7<br />
1 8<br />
1<br />
2 9<br />
4<br />
4 27<br />
3<br />
1<br />
1<br />
1<br />
2<br />
1<br />
1 5<br />
1<br />
3<br />
2 6<br />
5<br />
S<br />
5<br />
21<br />
2<br />
4<br />
A<br />
42<br />
13<br />
3<br />
4<br />
9<br />
5<br />
1<br />
2<br />
1<br />
1<br />
2<br />
1<br />
0<br />
.<br />
X<br />
40<br />
1<br />
6<br />
1<br />
4<br />
10<br />
1<br />
1<br />
3<br />
2<br />
1<br />
1<br />
3<br />
2<br />
1<br />
1<br />
2<br />
0<br />
w<br />
16<br />
3<br />
2<br />
1<br />
1<br />
2<br />
2<br />
1<br />
2<br />
2<br />
in<br />
72<br />
i •<br />
5<br />
1<br />
1<br />
20<br />
21<br />
1<br />
1<br />
1<br />
1<br />
3<br />
1<br />
1<br />
1<br />
4<br />
Source: D. S. Census, Manufactures, 1939.<br />
1 1 proeessing notarial owned by customer.<br />
2Sot elsewhere classified.<br />
—143—
women's clothing to be higher than for men's clothing. The<br />
July, 1945, average wages per hour werei women's clothing,<br />
fl.026; men's clothing, $0.891; and all textile wages averaged<br />
|0.763 per hour. In January, 1942, these same hourly rates<br />
werei women's clothing, |0.627; men's clothing, (0.663; and all<br />
textile wages, JO.571. On a slightly different basis in Janu<br />
ary, 1940, all wearing apparel had an average hourly rate <strong>of</strong><br />
|0.634 and all textiles, |0.4-99. Going back still further,<br />
yearly averages in 1935 were again on a slightly different basis, for men's<br />
clothing, JO.580, and for cotton textiles, $0.78 per hour.<br />
The increase indicated for women's clothing (from $0.627 in January,<br />
1942, to (1.G26 in July, 1945) over the other classes seems to reflect a<br />
greater scarcity <strong>of</strong> available labor. One probable cause <strong>of</strong> this scarcity<br />
is found in the failure, <strong>of</strong> the industry, particularly in the large cen<br />
ters, to provide for the training <strong>of</strong> young replacements in the higher<br />
skilled hand-sewing jobs. This results in there being few workers in the<br />
largest producing areas who are under forty. The establishment <strong>of</strong> adequate<br />
training programs for these skills, essential to the production <strong>of</strong> all<br />
fashion lines above the lowest price classes, could possibly be accom<br />
plished more easily in the Northeast <strong>Georgia</strong> Area where practically all<br />
workers would have to be trained than where an already trained labor force<br />
<strong>of</strong> considerable size already exists, even though such a labor force is<br />
deficient in key skills.<br />
These comments are <strong>of</strong> necessity somewhat general. This is largely<br />
because the complexity <strong>of</strong> the available data and the constant change in<br />
herent in the detail <strong>of</strong> almost every phase <strong>of</strong> the industry make it some<br />
what hazardous for those who have not learned by hard experience to ap<br />
praise the whims <strong>of</strong> fashion and their dependence on the unchanging prin<br />
ciples <strong>of</strong> design.<br />
—149--
Agricultural Industries<br />
The processing <strong>of</strong> agricultural products, particularly for<br />
food, is one <strong>of</strong> the fields in which new industries may be in<br />
troduced into Northeast <strong>Georgia</strong>.<br />
Food Processing<br />
The rather limited production <strong>of</strong> vegetables indicated by Table A-37<br />
on page 211 does not mean that it is impractical to grow vegetables for<br />
canning, quick-freezing, or dehydration. This low existing production<br />
simply means that up to this time no satisfactory market has existed which<br />
would justify engaging in large-scale vegetable production. This absence<br />
<strong>of</strong> previous large-scale vegetable growing might even be regarded as a<br />
favorable factor for the development <strong>of</strong> either a canning or freezing in<br />
dustry in the Area. In sections where fresh market production is estab<br />
lished a conflict is apt to develop between the level contract price for<br />
processing and the fluctuating price for fresh market sale. The pr<strong>of</strong>it<br />
able growing <strong>of</strong> vegetables is a decidedly intensive form <strong>of</strong> agricultural<br />
specialization.<br />
If a market were available, it appears probable that sufficient acre<br />
age might be secured for the growing <strong>of</strong> vegetable crops in nearly all<br />
counties to justify the establishment <strong>of</strong> several canning or quick-freezing<br />
plants in the Area. Hall, Habersham, Habun, Stephens, Jackson, and Hart<br />
counties are the more logical locations which should be considered.<br />
For example, the following crops appear to have greater probability<br />
<strong>of</strong> being grown for canning in the Northeast <strong>Georgia</strong> Area than elsewhere in<br />
the states<br />
1. English peas in Union, Towns, Wiite, Rabun, and part<br />
<strong>of</strong> Habersham counties.<br />
2. T.ima beans in all counties.<br />
3. String beans in all counties.<br />
U- Tonatoes in an counties.<br />
5- Asparagus in all counties.<br />
The production <strong>of</strong> any or all <strong>of</strong> these crops for either canning or<br />
freezing, to be successful, would require:<br />
1. The provision <strong>of</strong> agricultural supervision by the<br />
processing company.<br />
2. The development <strong>of</strong> auxiliary irrigation to provide<br />
a more even supply <strong>of</strong> moisture, even though some <strong>of</strong><br />
the counties have annual rainfall <strong>of</strong> as much as 6<br />
inches. The quality <strong>of</strong> crops, however, is more depen<br />
dent on even supply <strong>of</strong> water than on any particular<br />
total. Without the highest quality <strong>of</strong> crops, neither<br />
canned nor frozen foods will pay.<br />
The physical investment in a canning plant with a capacity <strong>of</strong> approxi<br />
mately 2,hOO cases per day would range from $hO,000 to $60,000, including<br />
land and buildings, the difference depending on the varying types <strong>of</strong> prod<br />
ucts processed and on their specific equipment requirements. Depending<br />
on the grade and quality <strong>of</strong> the product, such a production would require,<br />
—ISO—
in addition, processing working capital ranging from $50,000 to<br />
$225,000, and merchandising working capital ranging from $50,000<br />
to possibly $UOO,000. These working capital requirements, how<br />
ever, would be relatively short-term. The maximum amount would<br />
probably not be required for over three or four months; working<br />
capital ordinarily would only be needed for a total period <strong>of</strong><br />
not over nine months.<br />
SUM ....<br />
Engineering<br />
Experiment<br />
Station . . .<br />
Grorgia<br />
Ttch<br />
Industrial . .<br />
. . Economk<br />
Resutcb . .<br />
Crop conditions frequently limit the effective operating period in<br />
any particular canning plant to between two and four months. For those<br />
plants which operate primarily to process some particular crop with a one<br />
to three months' season, the addition <strong>of</strong> some product which can utilize<br />
all or a part <strong>of</strong> the canning equipment and which is not dependent on the<br />
completion <strong>of</strong> canning within twenty-four hours <strong>of</strong> harvest will reduce over<br />
head ratios, increase pr<strong>of</strong>its, and permit paying higher prices for raw<br />
materials.<br />
A cooked product from dry rather than fresh materials is one <strong>of</strong> the<br />
obvious solutions. Products such as baked beans, canned spaghetti, and<br />
soups indicate the general type for this possibility. Communities in<br />
terested should consult the Food Preservation Prospectus published by the<br />
State Engineering Experiment Station in 19/il.<br />
Census Data and Ratios; The canning industry in the Southeast<br />
lacked $d <strong>of</strong> equalling the 1939 U. S. average gross margin <strong>of</strong> $192, while<br />
<strong>Georgia</strong> lacked $130. The following are the 1939 census figures and the<br />
values per $100 <strong>of</strong> plant wages and salaries described on page $\ '. The<br />
low gross margin for 1939 reflects crop conditions in <strong>Georgia</strong> <strong>of</strong> that<br />
year. For 1937, the gross margin value per $100 <strong>of</strong> payroll was $155 for<br />
the U. S. and $165 for <strong>Georgia</strong>. .<br />
Item<br />
1939 Census Totals and Ratios Per $100 <strong>of</strong> Payroll<br />
Wages and Salaries<br />
Salaries only<br />
Value <strong>of</strong> Product<br />
Material<br />
Value Added<br />
Gross Margin<br />
U.S.<br />
(Add<br />
000)<br />
$ 79,OW.<br />
13,806<br />
587,3ii3<br />
356,281<br />
231,062<br />
152,022<br />
1939<br />
S.S.<br />
(Add<br />
000)<br />
$ 3,6W><br />
597<br />
21,882<br />
!U,li83<br />
10,U27<br />
7,399<br />
Ga.<br />
(Add<br />
000)<br />
$ 1*67<br />
117<br />
2,OU6<br />
1,288<br />
758<br />
291<br />
Per $100 <strong>of</strong><br />
Wages and Salaries<br />
U.S. S.S. Ga.<br />
$100<br />
17<br />
7ii3<br />
U51<br />
292<br />
192<br />
$100<br />
16<br />
601<br />
398<br />
286<br />
186<br />
$100<br />
25<br />
1)38<br />
276<br />
162<br />
62<br />
The average expenditure for purchased electricity was $2.90 and<br />
for fuel was $6.00 per $100 <strong>of</strong> payroll<br />
Hoick-Freezing<br />
The broiler industry probabjy provides the largest quick-freezing op<br />
portunity in the Northeast <strong>Georgia</strong> Area. A specialized plant, freezing<br />
only chicken, is probably the most economic operation, since the investment<br />
in plant would be less than for a plant freezing fruits and vegetables in<br />
late summer and early fall and broilers in the fall, winter, spring, and<br />
early summer. There would be an economy, too, in processing only one<br />
product. Such an operation should preferably buy, kill and dress as well<br />
—151--
as freeze, since this provides a closer control over quality.<br />
Freezing broilers should tend to stabilize the price and increase<br />
total annual sales for the reason that excess production can be<br />
carried forward for sale when the supply may be less than the<br />
demand. This will require the availability <strong>of</strong> considerable zero<br />
storage. In general, a part <strong>of</strong> this should be at the plant and<br />
a part in scattered public cold storage plants. Since the ex<br />
pansion <strong>of</strong> cold storage facilities has not kept pace itith the<br />
Stite ....<br />
Enguieerinf<br />
Experiment<br />
Station . . .<br />
Croegia<br />
Tieh<br />
Indnstrial . . t<br />
. . Economic<br />
Resurch . .<br />
general increase in denand, a new operator should make sure that the storage<br />
at distant markets is available.<br />
Freezing chickens, whole, is practical by any <strong>of</strong> the processes dis<br />
cussed later. Because <strong>of</strong> the bulk <strong>of</strong> a chicken, there is little cost dif<br />
ference. Cut-up chicker,, however, can be processed more rapidly by the<br />
inversion or air-blast processes.<br />
The principal advantage <strong>of</strong> the quick-freezing process over an ordinary<br />
freezing process lies in the fact that, because <strong>of</strong> the extremely short tine<br />
involved in freezing, the ice crystals formed within the cell structure are<br />
very small, and on thawing, the damage to appearance and physical structure<br />
due tc cell rupture is reduced to a minimum. Bacteria and mold growth are<br />
prevented, and the foods are preserved in essentially the fresh state. The<br />
principal types <strong>of</strong> quick-freezing are: direct immersion, indirect immer<br />
sion, air blast, indirect contact, multiple spray or fog freezing, and<br />
other methods.<br />
Hhile considerably more than half <strong>of</strong> the quick-frozen foods now on the<br />
retail market are being frozen by the indirect contact process, the direct<br />
icmersion method is potentially interesting from both a production and a<br />
merchandising viewpoint. Both freezing and thawing each require only a<br />
fraction <strong>of</strong> the time needed for most other quick-freezing processes since<br />
fruits and vegetables are frozen individually rather than in a compressed<br />
package.<br />
One <strong>of</strong> the problems connected with a quick-freezing operation is that<br />
<strong>of</strong> securing sufficient volume to maintain the plant in operation for a<br />
considerable period each year. There is an obvious difference between<br />
plants specializing in a single crop, which may not be available for more<br />
than six weeks to two months, and those freezing a combination <strong>of</strong> crops<br />
and poultry, meat, or fish, permitting every-day operation throughout the<br />
year. The enployment <strong>of</strong> mobile plants which nay be moved from one area to<br />
ar.other affords one solution. If production were confined to fruits and<br />
vegetables, however, it would not be possible to prolong operations by<br />
this method over nore than four to six months. For this reason, considera<br />
tion should be given to the utilization <strong>of</strong> production time not otherwise<br />
ecployed; for example, a mobile plant could be icoved to the coast, and<br />
fish could be frozen during the winter. Fixed-location freezing plants<br />
car. process crops growr. within a radius <strong>of</strong> not more than an hour's travel.<br />
As a maximum, they could possibly serve a farmer producing large tonnage<br />
located as far away as two hours, but his crops would be subject to risk<br />
<strong>of</strong> wilt and other deterioration.<br />
Census Data and Ratios; The following are the 1939 census figures<br />
arc the value per $100 <strong>of</strong> plant wages and salaries described on page 5k.<br />
The average expenditure for purchased electricity was $10.90 and for<br />
fuel was 81.60 per $100 <strong>of</strong> payroll.<br />
--15K—
1939 Census Totals and Ratios Per $100 <strong>of</strong> Pa<br />
Item<br />
Salaries and Wages<br />
Salaries only<br />
Value <strong>of</strong> Product<br />
Material, etc.<br />
Vd.ue Added<br />
Sross Margin<br />
U.S.<br />
(Add<br />
000)<br />
$ 1,937<br />
281<br />
10.107<br />
6,183<br />
3,925<br />
1,988<br />
1939<br />
S.S. 1 Ga.<br />
(Add (Add<br />
000) 000)<br />
Data<br />
available<br />
lot<br />
Per $100 <strong>of</strong><br />
Wages and Salaries<br />
U.S. $100 1U<br />
522<br />
319<br />
203<br />
102<br />
S.E. $100 Ga.<br />
$100<br />
Sure ....<br />
Engineering<br />
Experiment<br />
Station . . .<br />
<strong>Georgia</strong><br />
TVcft<br />
Industrial . .<br />
. . Economic<br />
RewJtcb . .<br />
Sharp-Freezirg; The sharp-freezing process is accomplished by keeping<br />
the product in a refrigerated room at temperatures <strong>of</strong> 0°F, -ltf"F, or -20°F,<br />
Titf. or without air circulation. While not a quick-freezing process, this<br />
method possesses certain advantages for fruits which are to be used for the<br />
isaking <strong>of</strong> jams, jellies, and filling for pies and pastry; for vegetables for<br />
sauces sj)d some soups, and for freezing meat. These advantages are chiefly<br />
those <strong>of</strong> lower cost, both in processing and packaging. However, sharpfrozen<br />
foods do not compare with quick-frozen foods in the possible return<br />
to the fanner for Ids crops, nor in appearance and table-appeal, because<br />
<strong>of</strong> destruction <strong>of</strong> cell walls.<br />
Locker plants; The locker plant represents an effort to provide a<br />
cornbina.tion <strong>of</strong> quick-freezing, sharp-freezing, and zero storage for the<br />
farmer. In its inception, the central idea was that the farmer would<br />
utilize the plant as a basis for preserving, by freezing and storing, such<br />
<strong>of</strong> his crops and meats as were desired for his own use. At first, however,<br />
the plants were chiefly located in larger towns, which made them more<br />
convenient to townspeople than to farmers, and urban users tended to ex<br />
ceed rural ones. Now, however, with the spread <strong>of</strong> rural electrification,<br />
they are beginning to appear in smaller towns and. even at crossroads; and<br />
individual farms or groups <strong>of</strong> farms are putting in small installations.<br />
Locker plants afford an indirect source <strong>of</strong> farm income, since their princi<br />
pal use is to preserve farm-grown food for farm consumption.<br />
It is probable that the present locker plant will ultimately develop<br />
two special functions: (1) a processing service for the preparation and<br />
freezing <strong>of</strong> meats, and the quick-freezing and packaging <strong>of</strong> fruits and<br />
vegetables for the farmer, and (2) bulk cold storage.<br />
Having learned the advantages <strong>of</strong> freezing, it seems probable that many<br />
farmers will eventually have some type <strong>of</strong> refrigeration which will provide<br />
ooth IjCPF and 0°F storage sufficient for a month or more, and will use the<br />
locker^plant only for bulk storage. Others may find it practical to install<br />
sufficient cold storage to take care <strong>of</strong> their entire requirements.<br />
—153--
Taxes<br />
Scan ....<br />
Engineering<br />
Experiment<br />
Station . . .<br />
lo the industrialist the tax rate <strong>of</strong> a county or state may<br />
be <strong>of</strong> real significance despite the fact that it is not a mjor<br />
item <strong>of</strong> his expenses. It is a reasonably accurate indication<br />
<strong>of</strong> the attitude <strong>of</strong> the local government, demonstrating its<br />
friendliness, or lack <strong>of</strong> it, towards industry, its progressiveness,<br />
and its desire to render those services which make a com<br />
Indaitria! . .<br />
. . Economic<br />
Rettarcb<br />
munity a desirable business location. Thus a low tax rate, although it<br />
perhaps appears attractive at first glance, may indicate a lack <strong>of</strong> services<br />
which would constitute a definite drawback or added expense to industry.<br />
On the other hand, a relatively high tax rate is sometimes more favorable<br />
than appears on the surface, since it may indicate that the local govern<br />
ment renders better-than-average service to industry.<br />
In order to determine the effect <strong>of</strong> taxes on industry, the State En<br />
gineering Experiment Station is making a detailed study <strong>of</strong> tax practices<br />
in <strong>Georgia</strong> and the adjoining states. Some <strong>of</strong> the data collected for the<br />
tax report for counties in the Northeast <strong>Georgia</strong> Area are presented here<br />
IB preliminary form.<br />
The total tax rate, including the state levy (5 mills in <strong>Georgia</strong>),<br />
county levy, school, and<br />
Table T-l other levies applying to<br />
an industrial site out-<br />
Total State and County Tax Rates for Industrial side <strong>of</strong> but within one<br />
plants in the No ____ 'st <strong>Georgia</strong> Zrea Located<br />
" OatsicEe ~oFJ but Within<br />
argest City in<br />
Counties<br />
Total<br />
Tax<br />
Rate .<br />
Kills<br />
Banks 39.5<br />
Barrow 28.5<br />
Daws on 28.0<br />
Forsyth 43.0<br />
Franklin 30.0<br />
Habersham 21.0<br />
Ball 39.5<br />
Hart 26.0<br />
Jackson 35. C<br />
Lumpkin 10.0<br />
Hadiscn 30.0<br />
Ratun 34. C<br />
Stephens 37.5<br />
Towns 20.0<br />
tnion 20.C<br />
Hhite 38.8<br />
Assessment,<br />
Per Cent <strong>of</strong><br />
Actual Value<br />
Tax Index2<br />
Plant<br />
Real Inven<br />
Estate tory<br />
26.33 19.75<br />
14.25 14.25<br />
B.40 14.00<br />
25.80 21.50<br />
7.50 15.00<br />
8.40 15.75<br />
26.33 26.33<br />
10.40 10.40<br />
14.00 14.00<br />
2.50 2.50<br />
18.00 18.00<br />
11.33 11.33<br />
18.75 18.75<br />
10.00 10.00<br />
10.00 10.00<br />
50 19.40 19.40<br />
Plant<br />
Real Inven<br />
Estate tory<br />
66 2/3 SO<br />
50 50<br />
30 50<br />
60 50<br />
25 50<br />
40 .75<br />
66 2/3 66 2/3<br />
40 40<br />
40 40<br />
25 25<br />
60 60<br />
33 1/3 33 1/3<br />
50 50<br />
50 50<br />
SO 50<br />
£0<br />
1Ineludes the state tax levy <strong>of</strong> 5 mills.<br />
TJhe tax index gives the mills per dol<br />
lar <strong>of</strong> actual value. It is the product <strong>of</strong><br />
the total tax rate and the rate <strong>of</strong> assessment.<br />
—154-<br />
mile <strong>of</strong> the largest torn<br />
in the county, is given<br />
for counties in the<br />
Northeast <strong>Georgia</strong> Area<br />
in Table T-l. This<br />
table also presents the<br />
various rates <strong>of</strong> asses<br />
sment on real estate<br />
and plant inventory;<br />
in the last column the<br />
product <strong>of</strong> the total<br />
tax rate and rate <strong>of</strong><br />
assessment is presented<br />
as the tax index for<br />
each county. This<br />
index is given as mills<br />
per dollar <strong>of</strong> full<br />
value.<br />
A comparison <strong>of</strong><br />
these indices reveals<br />
wide variations from<br />
county to county. Tax<br />
on real estate varies<br />
from 2.50 mills in<br />
Lumpkin to 26.33 in<br />
Ball and Banks, and, on<br />
plant inventory, from<br />
2.50 mills in Lumpkin<br />
county to 26.33 mills<br />
in Hall county. These<br />
assessments are typical<br />
<strong>of</strong> other <strong>Georgia</strong> counties
The individual industrialist is, <strong>of</strong> course, primarily in<br />
terested in knowing approximately the taxes he would have to<br />
pay should he locate his plant in a given county. This infor<br />
mation may be obtained from the various sections <strong>of</strong> Table T-2,<br />
wf.ich were derived from balance sheets reflecting the actual op<br />
erations <strong>of</strong> <strong>Georgia</strong> firms, v;ith the figures disguised. They<br />
serve to show approximately what taxes industries <strong>of</strong> similar<br />
size or operation would pay in the counties for which informati<br />
TTBS received.<br />
Numerous apparent inequalities between individual counties appear<br />
in Table T-2. Some <strong>of</strong> these without doubt arise from the fact that at<br />
present practically all taxes in some counties are assessed against land<br />
and retail firms since little industry exists in the county. The addition<br />
<strong>of</strong> several industries, in such cases, would so alter the revenue picture<br />
that new policies might be expected which would tend to wash out some <strong>of</strong><br />
these apparent differences.<br />
• Table T-2<br />
Typical Balance Sheets for Representat ive Industries and<br />
TotaT~Taxes Applying to the Saae Industries, by~<br />
Counties, for Hortheast <strong>Georgia</strong> Area<br />
Candy Manufacture<br />
Typical Balance Sheet No. 1<br />
Corporate Ownership<br />
Assets<br />
Liabilities<br />
Cash<br />
Accounts Receivable<br />
Inventory<br />
0. S. War Bonds<br />
Total Current Assets<br />
Fixed Assets t<br />
Real Estate<br />
Equipment<br />
Investments i<br />
Cash Value Life Ins.<br />
Prepaid and Deferred<br />
Treasury Bonds<br />
Total Assets<br />
$149,247.72<br />
123,413.41<br />
121,749.89<br />
3,892.07<br />
398,303.09<br />
19,050.73<br />
38,101.45<br />
4,943.98<br />
17,510.64<br />
22,090.11<br />
500,000.00<br />
Accounts Payable<br />
Reserve Income Taxes<br />
Funded Debt Current<br />
Total Current<br />
Liabilities<br />
Comcon Stock<br />
Surplus<br />
Funded Debt<br />
Total Liabilities<br />
Net Working Capital<br />
Current Ratio<br />
Tangibla Net Worth<br />
Net Pr<strong>of</strong>it<br />
$ 11,624.75<br />
48,434.65<br />
11,571.01<br />
71,630.41<br />
105,191.00<br />
195,897.48<br />
127,281.11<br />
500,000.00<br />
326,672.67<br />
5.85<br />
301,088.61<br />
52,920.79<br />
Total Taxes by Counties: Banks $3,921.49; Barrow $2,564.28; Daws on<br />
12,430.65; I^orsyth $3,94 3.24; Franklin $1.356.68; Eabersham $2,692.61;<br />
Hall $4,726.01; Hart $1,875.51; Jaclcson $2,786.27; Lumplcin $462.17;<br />
Madison $3,235.16; Katun $2,042.48; Stephens $3,369.33; Towns $1,603.94;<br />
Union $1,803.94; White $3,503.51.<br />
—155—
Table T-2 (continued)<br />
State ....<br />
Engineering<br />
Typical Balance Sheets for Representative Industries and Experiment<br />
Total Taxes Applying to the Same Industries, by<br />
Station . . .<br />
<strong>Georgia</strong><br />
Counties, for Northeast <strong>Georgia</strong> Area<br />
Tech<br />
Industrial . .<br />
_ .. , • . Economic<br />
Knit Fabrics<br />
Cotton Yarn Rejeirdi . .<br />
Typical Balance Sheet No. 3<br />
Assets<br />
Typical Balance Sheet No. 4<br />
Corporate Ownership<br />
Assets<br />
Cash<br />
Arcc-nts Receivable<br />
Inventory<br />
Total Current Assets<br />
Fixed Assets:<br />
Real Estate, Buildings<br />
l&chinery, Equipment<br />
Investments:<br />
Cash Value <strong>of</strong> Life Ins.<br />
Prepaid<br />
Total Assets<br />
Liabilities<br />
Accounts Payable<br />
Accrjals<br />
A/C Payable Affiliate<br />
Reserve - Income Taxes<br />
Total Current<br />
Liabilities<br />
Common Stock<br />
Surplus<br />
Total Liabilities<br />
Ket Working Capital<br />
Current Ratio<br />
Tangible Net Forth<br />
Ket Sales<br />
Net Pr<strong>of</strong>it<br />
Div: desds<br />
$ 13,649.54<br />
7,454.19<br />
15,360.22<br />
36,464.52<br />
7,454.50<br />
14,909.63<br />
825.14<br />
345.98<br />
60,000. CO<br />
$ 5,791.74<br />
2,003.53<br />
4,712.56<br />
9,272.63<br />
21,780.46<br />
14,369.37<br />
23,850.17<br />
60,000.00<br />
14,684.15<br />
1.60<br />
38,219.72<br />
277,00.48<br />
8,082.25<br />
5,747.82<br />
Total Taxes by Counties: Banks $905. 84<br />
{!arrov.- $551.22;Dawso& $507. CO; Forsyth<br />
f856.79; Franklin $296.58;Eabersham.<br />
$553.C2;EaIl $1,007.07; Hart<br />
$405.99; Jackson $646.16; Lumpkin<br />
$145.24; Kadisor. $692.69; Rabun<br />
$441.20; Stephens $767.58; Towns<br />
$415.7S;Dnion $415.75;TVhite$797.74.<br />
— 15S--<br />
Cash<br />
Accounts Receivable<br />
Ir.ventory<br />
U. S. Treasury Notes<br />
Margin Deposits<br />
Total Current<br />
Assets<br />
Fixed Assets:<br />
Real Estate, Bldgs.<br />
lichinery, Equip.<br />
Investments :<br />
Cash Value Life Ins.<br />
Total Assets<br />
Liabilities<br />
Accounts Payable<br />
Reserve - Income Taxes<br />
Total Current<br />
Liabilities<br />
Common Stock<br />
Surplus<br />
Total Liabilities<br />
Ket Working Capital<br />
Current Ratio<br />
Tangible Net Worth<br />
$ 346,825.23<br />
145,076.93<br />
61,090.20<br />
148,893.01<br />
25,779.78<br />
727,765.15<br />
67,894.42<br />
155,738.84<br />
9,120.09<br />
4,085.67<br />
1,000,000.00<br />
$ 31,624.99<br />
396,778.55<br />
428,403.94<br />
138,814.20<br />
432,781.86<br />
1,000 000 .CO<br />
299,361.21<br />
1.68<br />
571,601.05<br />
Total Taxes': Banks $6,604.87; Barrow<br />
$3,807.72:Dawson $3,424 .56; Forsyth<br />
$S,019.26;Frankl5.a$2,02 0.19;Habersha»<br />
$3,705.83;Hall$7,007.05 ;Hart$2,788.32<br />
Jacks on$4 , 692 . 03 ; L'Joipki n$698.62;Madi-<br />
3on$4,800.60;Habun $3,0 35 .45; Stephens<br />
$4,999.13; Toras $2,632 .41; Union<br />
$2, 632. -11; TOiits £5,197.75.
laDie r-z ^uonnnuea^<br />
Typical Balance Sheets for Representative Industries and<br />
Total Taxes Applying to the Same Industries, by<br />
Counties, for Northeast <strong>Georgia</strong> Area<br />
Brick Manufacturing<br />
Typical Balance Sheet No. 5<br />
Corporate Ownership-<br />
Assets<br />
Cash<br />
Accounts Receivable<br />
Inventory<br />
War Stamps<br />
Total Current Assets<br />
Fixed Assets:<br />
Real Estate, Buildings<br />
Machinery, Equipment<br />
Furr.iture, Fixtures<br />
Investments:<br />
Cash Value <strong>of</strong> Life Ins.<br />
Treasury Stock<br />
Prepa id<br />
Total Assets<br />
Li&tilities<br />
Accounts Payable<br />
Accruals<br />
Reserves for Taxes<br />
Total Current<br />
Liabilities<br />
Common Stock<br />
Surplus<br />
Total Liabilities<br />
$ 9,930.32<br />
27,596.98<br />
43,017.17<br />
37.28<br />
80,581.75<br />
74,226.00<br />
138,325.00<br />
53.23<br />
3, 136. CO<br />
1,657.10<br />
2 jVJcU npn • op y
Table T-2 (Continued) II =<br />
I -v •<br />
Typical Balance Sheets for Representative Industries and |! Ei'tmnoit<br />
Total Taxes Applying to the Same Industries, by<br />
Counties, for Northeast <strong>Georgia</strong> Area<br />
Canning and Food<br />
Typical Balance Sheet No. 7<br />
Corporate Ownership<br />
Assets<br />
Cash<br />
Accounts Receivable<br />
Inventory<br />
U. S. Treasury Securities<br />
Total Current Assets<br />
Fixed Assets:<br />
Real Estate<br />
Equipment<br />
Miscellaneous Receivables<br />
Investments »<br />
Cash Value <strong>of</strong> Life Ins.<br />
Supplies<br />
Total Assets<br />
Accounts Payable<br />
Accruals<br />
Reserves - Taxes<br />
Total Current<br />
Liaoilities<br />
Comcon Stock<br />
Preferred Stock<br />
Surplus<br />
Liabilities<br />
Total Liabilities<br />
Net Working Capital<br />
Current Ratio<br />
Tangible Net Worth<br />
$ 40,881.63<br />
6,077.12<br />
16,735.23<br />
9,964.78<br />
73,658.76<br />
60,498.71<br />
30,249.35<br />
719.71<br />
260.27<br />
3,712.45<br />
5,300.75<br />
175,000.00<br />
$ 3,628.14<br />
40.90<br />
1,876.82<br />
5,545.86<br />
19,830.40<br />
54,533.60<br />
95,090.14<br />
175,000.00<br />
68,112.87<br />
13.18<br />
169,454.95<br />
Total Taxes: Baaks $2,724.31;Barrow<br />
Jl,535.73;Da.wson $1,226.52; orsyth<br />
$2,S7E.13;Franklin$810.21;Babershajn<br />
$l,252.23;Hall$2,834.48;Bart$l,121.92<br />
Jacks on$l , 720 . GO ; Lumpkin$2 72 . 80 ; Jfod i-<br />
son $l,938.79;Rabun$l,222.24;Stephens<br />
$2,019.41; Towns $1,078.92; Union<br />
$1.078.92: White $2.100.02.<br />
—158—<br />
1 Station . . .<br />
1 <strong>Georgia</strong><br />
1 TVch<br />
Kitchen Furniture II . . Economic<br />
Manufacturing [] Rnorch . .<br />
Typical Balance Sheet No. 8<br />
Corporate Ownership<br />
Assets<br />
Cash<br />
Accounts Receivable<br />
Inventory<br />
Total Current<br />
Assets<br />
Fixed Assets:<br />
Real Estate<br />
Equipment<br />
llisc. Receivables<br />
Investments t<br />
Bank Stock<br />
Prepaid<br />
Post War Tax Refund<br />
Total Assets<br />
Liabilities<br />
Accounts Payable<br />
Accruals<br />
Notes Payable-Officers<br />
Taxes<br />
Total Current<br />
Liabilities<br />
Comcon Stock<br />
Surplus<br />
Total Liabilities<br />
Net Working Capital<br />
Current Ratio<br />
Tangible Net Worth<br />
$ 7,981.47<br />
23,618.09<br />
50,678.24<br />
82,277.60<br />
1,728.47<br />
3,456.94<br />
489.22<br />
98.27<br />
333.14<br />
1,566.16<br />
90,000.00<br />
t 5,365.97<br />
946.92<br />
9,955.70<br />
20,102.75<br />
36,371.34<br />
30,464.32<br />
23,164.34<br />
90,000.00<br />
45,906.47<br />
2.22<br />
53,629.09<br />
Net Sales<br />
425.-377.39<br />
Net Pr<strong>of</strong>it<br />
8,695.63<br />
Total Taxes:8anks$l,135.25;BarroTr<br />
$796.35;Dawson $774.83; Forsyth<br />
$l,209.29;Franklin$419.78;flabershan<br />
$867.95;Hall $l,471.S8;Hart $581.73<br />
Jackson$307.10;Lu3ipkin $140.46;ifc.di<br />
son$l,006.34;Rabun $633. 92; Stephens<br />
$1,048.25; Towns $559.43; Union<br />
$559.43; TThite $1.090.15.
7/ater . sm...<br />
Ordi<br />
Engineering<br />
Experiment<br />
Station . . .<br />
_. _ _ _ _ _ - <strong>Georgia</strong><br />
Water Is necessary for almost every human activity.<br />
nary living, the growing <strong>of</strong> crops, and manufacturing all require<br />
water in some form, frequently in large quantities.<br />
1 Indmtnal<br />
. .Economic<br />
Rcmrcb . .<br />
The available information on water in the Northeast <strong>Georgia</strong><br />
Area comes from three sources. Stream gaging reports give an<br />
indication <strong>of</strong> the volume <strong>of</strong> water ordinarily originating as rain water,<br />
which moves over the surface <strong>of</strong> the land and flows in its streams. The<br />
second source <strong>of</strong> information deals with water which is flowing within the<br />
ground and which is a normal source <strong>of</strong> supply through wells. The third<br />
source <strong>of</strong> information deals with the chemical characteristics <strong>of</strong> the avail<br />
able water, particularly that from underground sources. In «n three cases,<br />
the volume <strong>of</strong> available information is much less than it should be for an<br />
adequate discussion <strong>of</strong> the Area's water problems, but this is a condition<br />
which exists in many parts <strong>of</strong> <strong>Georgia</strong>.<br />
Source <strong>of</strong> Data; The information contained in this section is based on<br />
available reports and investigations made by the Department <strong>of</strong> liines, Min<br />
ing and Geology, <strong>Georgia</strong> State Division <strong>of</strong> Conservation, in co-operation<br />
with the Geological Survey, United States Department <strong>of</strong> the Interior. Sys<br />
tematic investigation <strong>of</strong> the ground-water resources <strong>of</strong> the state has been<br />
in progress since 1938, but, owing to limited funds, the studies in this<br />
Area have been on a small scale. Further successful development <strong>of</strong> the<br />
ground-water resources <strong>of</strong> the Area will require more detailed investigation<br />
than has hitherto been possible. Requests for additional information or<br />
field investigations should be addressed to Captain Garland Peyton, Direc<br />
tor, Department <strong>of</strong> Mines, Mining and Geology, Ij25 State Capitol, Atlanta<br />
3, <strong>Georgia</strong>.<br />
Recommendations ; A much expanded program <strong>of</strong> water research is a defi<br />
nite need, not only for this Area, but also for the state as a whole. Uuch<br />
larger funds should be made available for co-operation with the U. S. Geo<br />
logical Survey in its three fields <strong>of</strong> water activity so that sufficient in<br />
formation will be at hand to answer the necessary questions with respect to<br />
the supply and quality <strong>of</strong> water for its various uses. Additional streamflow<br />
data is desirable so that recurrent flood problems can be properly<br />
dealt with and as a means <strong>of</strong> evaluating the possibilities <strong>of</strong> increasing<br />
crop values through supplementary irrigation. Further information about<br />
underground water supplies will contribute to the solution <strong>of</strong> problems af<br />
fecting drinking water for cities and towns and water for use in industrial<br />
processing and for supplemental irrigation.<br />
Surface Water<br />
The Northeast <strong>Georgia</strong> Area lies in the mountain and upper Piedmont<br />
regions where the streams generally carry substantial quantities <strong>of</strong> water.<br />
Eecause the supply <strong>of</strong> ground water in the Area is generally limited, most<br />
<strong>of</strong> the larger municipal and industrial water supplies come from streams.<br />
Information regarding the flow <strong>of</strong> streams is collected and published<br />
by the Geological Survey in cooperation with the Department <strong>of</strong> Mines, Min<br />
ing and Geology <strong>of</strong> the <strong>Georgia</strong> Division <strong>of</strong> Conservation. The basic streamflow<br />
information consists <strong>of</strong> the daily record <strong>of</strong> the flow at gaging sta<br />
tions on the rivers and smaller streams. At the present time, 30 gaging<br />
stations are maintained in the Northeast <strong>Georgia</strong> Area or on streams that<br />
drain jjart <strong>of</strong> the Area.' Map G-5 shows the locations <strong>of</strong> the gaging stations.<br />
—159—
Table 3-5 lists the gagir.g stations and gives -a. summary <strong>of</strong> the<br />
extremes and the average flows.<br />
Stream-Flow: Streac-flow data are presented as discharge<br />
in "second-feet" (c.f.s.), an abbreviation <strong>of</strong> cubic feet per<br />
second. For comparisons between stations, or for applying the<br />
data from the gaging station to other areas, it is convenient to<br />
use the terc. "second-feet per square mile" (c.s.m.) which is the<br />
State ....<br />
Engineering<br />
Experiment<br />
Station . . .<br />
Industrial . .<br />
. . Economic<br />
Research .<br />
discharge at the station divided by the number <strong>of</strong> square miles in. the drain<br />
age basin above the station. It should be borne in mind that this is an<br />
average value and night be presumed to imply a uniform contribution <strong>of</strong> flow<br />
free each part <strong>of</strong> the drainage basin. This is not generally true, especi<br />
ally in this A.raa where the run<strong>of</strong>f from the mountain region is much greater<br />
per unit <strong>of</strong> area than that from the Piedmont region. For comparison with<br />
rainfall, it is convenient to use the term "run<strong>of</strong>f in inches", which is the<br />
depth in inches to which an area would be covered if all the water draining<br />
froc it in a given period were unifonnly distributed over its surface.<br />
River Gaging Stations; For each gaging station listed in Table G-5<br />
the nap number is given to identify it with Map G-5- The stations are<br />
listed by drainage basins in downstream order, mainstream stations first,<br />
followed by the stations on tributary streams. Following the station name<br />
is the drainage area in square miles. This value is essential to the use<br />
and interpretation <strong>of</strong> stream-flow records, as the drainage area is the<br />
principal factor that determines the size and discharge <strong>of</strong> the stream. In<br />
order to apply to ungaged streacs the stream-flow data from the gaging<br />
stations, it is first necessary to know the drainage area at the site on<br />
the ungaged stream. Within certain limits, the discharge for the ungaged<br />
stream may be found by multiplying its area by the appropriate discharge<br />
in second-feet per square miles at the gaging stations.<br />
Following the drainage area in the table there is shown the number <strong>of</strong><br />
years <strong>of</strong> record that are available at the station. The longer the station<br />
has been operated, the tore reliable and complete will be the information<br />
regarding the stream flow at that place. Many <strong>of</strong> the station recoras are<br />
short, and many <strong>of</strong> the longer records are for broken periods.<br />
Discharge; The information concerning the maximum discharge relates<br />
to the highest flood during the period <strong>of</strong> record or for the highest known<br />
flood for which definite information is available. At some stations, the<br />
discharge has not yet been determined for the maximum flood <strong>of</strong> record. It<br />
is very certain that, for every station listed, the maximum flood shown<br />
has beer, or can be exceeded; longer and more complete records <strong>of</strong> stream<br />
flow in other parts <strong>of</strong> the Southeast have attested to this. In general,<br />
the floods in the mountain region tend to be greater than those in the<br />
Fiedzsnt region, and flood flows on snail streams are relatively more<br />
severe in proportion to their drainage areas than are floods on larger<br />
streams.<br />
The information on minimum discharge is for the lowest flow daring<br />
the period <strong>of</strong> record. The three gaging stations that were in operation in<br />
1925 show much lower miniraums than do those stations for which information<br />
concerning the 1925 drought is lacking. It is unfortunate that more com<br />
plete records <strong>of</strong> the 1925 conditions in <strong>Georgia</strong> are not available, but,<br />
since the existing records show that the 1925 conditions have occurred only<br />
once (or possibly twice) in the past century, the deficiency in records is<br />
not as serious as it would be if similar conditions were to be expected<br />
more frequently. In general, the minimum flow <strong>of</strong> streams in the mountain<br />
—160—
egion is much greater than is the minimum flow <strong>of</strong> Piedmont<br />
streams. For most water-supply purposes, the information regard<br />
ing minimum discharges is the most important, as the data show<br />
the continuous flow that is available without the construction<br />
<strong>of</strong> storage reservoirs. The information in Table 3-5 is a sum<br />
mary <strong>of</strong> what is known about the major streams in the Area. The<br />
subject, as it pertains to smaller streams, is further discussed<br />
below.<br />
Sut« ....<br />
Engineering<br />
Experiment<br />
Sution . . .<br />
TVcft<br />
Induitria! . ;<br />
. . Economic<br />
Research . .<br />
Five-Year Averages The information on the 5-year average discharge<br />
is based on the period from October 1, 1938, to September 30, 19U3, for<br />
which complete records were available for most <strong>of</strong> the stations. The records<br />
for some stations were too brief to permit their being used to show the<br />
Table G-U<br />
Map Number,<br />
River and<br />
Gaging Station<br />
1. Chattooga R.<br />
near Clayton,Ga<br />
6. Broad B.<br />
near Bell, Ga.<br />
. Oconee R. near<br />
Greensboro, Ga.<br />
10. Apalachee E.<br />
near Buckhead,G<<br />
11. Chattahoochee E<br />
near Leaf, Ga.<br />
12. Chattahoochee E<br />
near Gainesvill<<br />
Hi. Chattahoochee R<br />
near Norcross<br />
18. Chestatee R.<br />
near Eahlonega<br />
19. Etowah R. near<br />
Dawsonville,Ga.<br />
20. Etowah R. at<br />
Canton, Ga.<br />
21. Arnica] ola R.nea<br />
Dawsonviile, Ga<br />
25. Nottely R. near<br />
Ivylog, Ga.<br />
29. Toccoa R. near<br />
Dial, Ga.<br />
Minimum Stream Flow in the Northeast <strong>Georgia</strong> Area<br />
Drain<br />
age<br />
Area<br />
Square<br />
Miles<br />
.<br />
203<br />
11.20<br />
3090<br />
1.36<br />
i5o<br />
559<br />
1170<br />
153<br />
103<br />
605<br />
81.7<br />
215<br />
177<br />
Years<br />
<strong>of</strong><br />
Record<br />
191.0-10. 169<br />
1927,<br />
1929-31<br />
1937-U3<br />
1901.-13<br />
1915-31<br />
1937 -hi<br />
1937-13<br />
1902-08<br />
191.0-1.1.<br />
1937-Ut till<br />
1903-1.3 725<br />
1929-31<br />
191.0-U.<br />
191.0-1U.<br />
1897-99<br />
1901-0l(<br />
3937-Wi<br />
1939-10.<br />
1937-1.1<br />
1911t-lUi 11.3<br />
Normal<br />
Minimum<br />
Cubic Feet<br />
Per Second<br />
1,06<br />
311.<br />
102<br />
107<br />
96<br />
80<br />
315<br />
66<br />
108<br />
Per<br />
Square<br />
Mile<br />
0.83<br />
.29<br />
.29<br />
.23<br />
.71<br />
-73<br />
.62<br />
.63<br />
.78<br />
.52<br />
.78<br />
.50<br />
.81<br />
10-Year<br />
Minimum<br />
Cubic Feet<br />
Per Second<br />
11.6<br />
170<br />
172<br />
hh<br />
72<br />
275<br />
Uio<br />
1.9<br />
55<br />
211,<br />
58<br />
79<br />
lilt<br />
Pei-<br />
Souare<br />
Mile<br />
0.73<br />
.12<br />
.16<br />
.10<br />
.1.8<br />
.1*9<br />
.35<br />
.32<br />
.53<br />
.35<br />
.68<br />
.37<br />
.61.<br />
1925 Minimum<br />
Cubic Feet<br />
Per Second<br />
_<br />
—<br />
60<br />
—<br />
—<br />
—<br />
132<br />
_<br />
—<br />
—<br />
—<br />
—<br />
60<br />
Per<br />
Scuare<br />
iaie<br />
_<br />
—<br />
.06<br />
—<br />
—<br />
—<br />
.11<br />
_<br />
—<br />
—<br />
—<br />
—<br />
.31.<br />
Fre<br />
quency<br />
Source: Prepared by U. S. Geologic Survey, Water Resources Branch.<br />
—1S1--<br />
_<br />
—<br />
1-1(<br />
—<br />
—<br />
_<br />
1.2<br />
_<br />
—<br />
—<br />
—<br />
_<br />
1.6
5-year average. At other stations, one or two <strong>of</strong> the years were missing,<br />
but it was possible to estimate the average from the available record.<br />
The average discharge on streans in the mountain region is greater than<br />
on Piednont streams. Thus, the average discharge on the main rivers<br />
which head in the mountains tends to be higher than that on the rivers<br />
the North<br />
rg<br />
ge Fe<br />
Di Se<br />
Discharge<br />
Fe Second<br />
r- -<br />
OJ CM<br />
30<br />
c c<br />
It<br />
05 O\ CO CJ W £ ra<br />
ft ."^-<br />
Number, iap<br />
and River<br />
OCOi-H<br />
^4Jr-i<br />
ooo<br />
-P >, «<br />
CO .-H in<br />
>O<br />
Ov<br />
1 1 1<br />
I<br />
£<br />
*-!°<br />
££33<br />
pjooajj<br />
JO SOBSJ<br />
^H a7ccti!>r-iC<br />
O 1 1 -=f<br />
CO 1 1 CO<br />
K O 0<br />
T> «oo<br />
OIrHC'<br />
or-io<br />
1<br />
1<br />
O<br />
C^<br />
r-t<br />
CO*<br />
8 i-5<br />
ON 1<br />
j1 I<br />
CO<br />
O<br />
f^<br />
CM<br />
O<br />
^co<br />
—162- -
•nhich lie wholly within the Piedaont region. This information<br />
shoirs the continuous flow that might be developed by means <strong>of</strong><br />
complete storage regulation. In order to produce the average<br />
discharge as a continuous flow, enough storage must be provided<br />
o 1 p- 1<br />
ft<br />
CM<br />
1A r- 1<br />
H<br />
en m<br />
\o vo<br />
8 8<br />
CVI OJ<br />
U\ *A<br />
l-l r-1<br />
CO I CVJ<br />
CO 1 V<br />
NO V\<br />
CVJ CVJ<br />
CO 1 CO<br />
O\ I CO<br />
rH rH<br />
S<br />
^OJ<br />
s<br />
rH<br />
\o<br />
en<br />
s<br />
o<br />
u\<br />
rH<br />
o CM<br />
8<br />
CO<br />
I !<br />
! !<br />
1 c*-<br />
1 \o<br />
Cvl<br />
CVJ<br />
1 s<br />
rH<br />
!<br />
!<br />
———————<br />
State ....<br />
Engineering<br />
Experiment<br />
Station . . .<br />
Indmtml . .<br />
. . Economic<br />
Rourcb . .<br />
1<br />
O 1<br />
CO 1<br />
o<br />
m rH<br />
-3 vO<br />
CM O<br />
-=t 1A<br />
3 ^<br />
-s o<br />
U\ CM<br />
,8 |<br />
O r-t<br />
m OJ<br />
< <<br />
CO OJ<br />
•O rn<br />
CA O<br />
l-f\ VO<br />
s<br />
rH<br />
-3 O<br />
£ £<br />
$<br />
rH rH<br />
H rr\<br />
CM m ^1<br />
co<br />
» ^<br />
^^ O<br />
r- -O<br />
-a rH<br />
O O<br />
3 3<br />
o\<br />
rH CM<br />
$ ><br />
H CVJ<br />
-3<br />
O O<br />
C— t^t<br />
rH rH<br />
. . 10<br />
>0> . e8 -O • CS<br />
«-HKc3«05lS<br />
IIll<br />
loll<br />
i si i<br />
O C o C<br />
H r-f<br />
O O O fc<br />
| o-gjj<br />
* S a 3<br />
O C O C<br />
-a 1A<br />
rH r-i<br />
CO 1 CO<br />
O I CO<br />
'*' t<br />
CVJ \O CVJ<br />
rH f- n<br />
n-v<br />
S ° S<br />
»<br />
rH<br />
+3<br />
* S<br />
c o<br />
s<br />
I2<br />
£ •u<br />
0)<br />
3CJ
5-Year Average<br />
Annual<br />
—<br />
398<br />
U65<br />
Per<br />
Square<br />
Mile<br />
—<br />
2.25<br />
2.00<br />
Run<strong>of</strong>f<br />
in<br />
Incheu<br />
—<br />
30.5U<br />
27.15<br />
c* Q, e+<br />
' W CD p1<br />
>* ft) S<br />
Map Number,<br />
River and<br />
Qaging Station<br />
Ohio River Basins - Continued<br />
28. Ivylog Cr. near<br />
Ivy log, Oa.<br />
29. Toccoa R. r.ear<br />
Dial, Qa.<br />
30. Toccoa R. near<br />
Blue Ridge, Ga.<br />
Drain-<br />
Area<br />
Square<br />
Miles<br />
16.7<br />
177<br />
233<br />
^<<br />
0) O<br />
2<br />
31<br />
31<br />
Maximum Discharge<br />
Date<br />
2/ltf<br />
7/16<br />
7/16<br />
Table Q-5 - Continued<br />
Discharge in<br />
Second Feet<br />
Total<br />
797<br />
9,200<br />
13,900<br />
Per<br />
Square<br />
Kile<br />
L8<br />
52<br />
60<br />
Minimum Discharge<br />
Date<br />
8/1,2<br />
9/25<br />
Source: Prepared by U. S. Geologic Survey, Water Resources Branch.<br />
—<br />
Discharge in<br />
Second Feet<br />
Total<br />
8.2<br />
60<br />
—<br />
Per<br />
Square<br />
Mile<br />
.U9<br />
.3lt<br />
—
value <strong>of</strong> the minimums i'or an tne years ol' record. For some<br />
star/ions oruy 5 years ol' record was available; the longest rec<br />
ord w^s i'or iu years. The normals based on tne longer periods<br />
are much more reliable than those on short periods, but the<br />
latter are probably not seriously in error. For areas between<br />
gaging stations, the values were computed from the data I'or the<br />
gaging stations as given in the table, even though different<br />
periods <strong>of</strong> years were used for the two adjacent stations.<br />
Sutc<br />
Engineering<br />
Experiment<br />
Station . . .<br />
Croroia<br />
TiA<br />
Industrial . .<br />
. . Economic<br />
Rociich . .<br />
Ten-Year Minijaums ; The ID-year minimum discharge represents the low<br />
flew that would occur, on the average, one year out <strong>of</strong> ten, or ten times a<br />
century. Tills value was obtained by statistical analysis <strong>of</strong> all the minimums<br />
<strong>of</strong> record. In most cases, it closely approximates the low flow <strong>of</strong><br />
J.9U1. That the iy'ui minimum can be tajten as a 10-year minimum with some<br />
confidence is shown by its frequency as determined from the three longest<br />
records in the Area.<br />
Per Cent Difference<br />
1.9m. Frequency in Between i9iu Minimum<br />
Years Per Century and lU-Year Minimum<br />
Oconee River near Greensboro, Ga. It. 2 . -8 per cent<br />
Chattahoochee River near Norcross B.6 -6 per cent<br />
Toccoa Kiver near Dial 32 tih per cent<br />
The 10-year minimum may generally be accepted as the dependable yield<br />
<strong>of</strong> a stream without the use <strong>of</strong> storage, since more severe droughts rarely<br />
occur. The relative severity <strong>of</strong> droughts <strong>of</strong> varying frequencies may be<br />
estimated by comparison between the 10-year minimum and tne normal minimum.<br />
Where tne two minimums are near the same magnitude, it is reasonable to ex<br />
pect that the 100-year minimum would not be much less than the 10-year min<br />
imum. On the other hand, if the 10-year minimum is proportionally much<br />
lower than the normal minimum, the lUU-year drought may oe expected to be<br />
very severe.<br />
The iS'i'y Minimum; That this may be expected is borne out by the com<br />
parison at tne three stations wflere l9 cannot now be ascertained.<br />
Fortunately, the duration <strong>of</strong> severe low-water conditions in the North<br />
east <strong>Georgia</strong> Area is generally not vary long. For example, on tne Apaiachee<br />
River near BucKnead, <strong>Georgia</strong> the minimum day was U01 second-feet in<br />
l9lU; tne minimum weeK averaged >8 second-feet, 21 per cent greater; the<br />
minimum 2-weeK period averaged ol second-feet, 'if per cent greater; ana tne<br />
air.invm jO-aay period averaged /i socond-feet, or ub per cent greater.<br />
Caution should be used in applying the information on Map G-ij to small<br />
—165—
drainage areas. A number <strong>of</strong> estimates that were made <strong>of</strong> the<br />
19U. minimum flow from small drainage areas within the larger<br />
drainage basins used for this analysis showed that some yields<br />
were as little as one-half <strong>of</strong> the average. Lacking other in<br />
formation, this factor <strong>of</strong> safety Bay well be applied to the<br />
10-year cir.Li.ua values shown.<br />
Start ....<br />
Engineering<br />
Experiment<br />
Suiion . . .<br />
Gtoegia<br />
Tick<br />
Industrial . .<br />
. . Economic<br />
Retearcb . .<br />
Further Details; Complete records <strong>of</strong> discharge are pub<br />
lished in the "annual surface water-supply papers <strong>of</strong> the Geological Survey.<br />
Those for the Northeast <strong>Georgia</strong> Area appear either in the series for Part 2,<br />
"South Atlantic Slope and Eastern Gulf <strong>of</strong> Mexico Basins", or for Part 3,<br />
"Ohio River Basin". Original records for the stations in Part 2 may be<br />
consulted at the <strong>Georgia</strong> <strong>of</strong>fice <strong>of</strong> the Geological Survey, U.1 Grand Theatre<br />
Building, Atlanta, or at the <strong>of</strong>fice <strong>of</strong> Captain Garland Peyton, Director,<br />
<strong>Georgia</strong> Department <strong>of</strong> Mines, Kining and Geology, 1^5 State Capitol, Atlanta.<br />
Original records for Part 3 may be consulted at the Tennessee <strong>of</strong>fice <strong>of</strong> the<br />
Geological Survey, hii2 Post Office Building, Chattanooga, Tennessee.<br />
River Gaging Stations in the<br />
Northeast <strong>Georgia</strong> Area<br />
—166—
Map G-U<br />
Uinimm Yields <strong>of</strong> Selected River Basins<br />
jCn" the NorEEeast <strong>Georgia</strong> Area<br />
State ....<br />
Enfiaccriiif<br />
Exptrimtnt<br />
Station . . .<br />
Cforgia<br />
Txh<br />
Indoitrial . .<br />
. . Economic<br />
Rocjrcb . .<br />
Key:<br />
The upper figure within<br />
the drainage area is the<br />
normal minimum discharge in<br />
second feet per square<br />
mile.<br />
The lower figure is the<br />
ten-year minimum discharge.<br />
•Gaging station (see<br />
Table G-U).<br />
—167—
Agricultural Summary<br />
In 1940, the Northeast <strong>Georgia</strong> Araa was predominantly rural<br />
la population since, <strong>of</strong> the total population <strong>of</strong> 197,373, the<br />
rural total was 174,868. Of these, 130,456 lived on farms which<br />
numbered 23,551. yor seven counties (see Table A-61, page 205),<br />
more than 70 per cent <strong>of</strong> these farms W3re occupied by subsistence<br />
operators who consumed more than half <strong>of</strong> the total value pro<br />
duced.<br />
Table A-lia<br />
S:.--na"y<br />
a.-.d<br />
GounV>.s<br />
Area Cotal<br />
Panel I<br />
Panel II<br />
County<br />
Total<br />
Land Use Averages Per Farm in the<br />
Area for 1939, b^jr Panels<br />
All<br />
Fares<br />
73-8<br />
69-2<br />
75-9<br />
Average Number <strong>of</strong><br />
Acres Per Farm in<br />
P10»7-<br />
a'ole<br />
Pas<br />
ture<br />
5-S<br />
h.6<br />
5.9<br />
Wood<br />
land<br />
30.1<br />
21.6<br />
3u.2<br />
Crop<br />
land<br />
26.3<br />
31-9<br />
23-6<br />
Source: Caloi^Lat-sd fron Table A-li.<br />
Banks<br />
Barrow<br />
Dawson<br />
Forsyth<br />
Franklin<br />
Habersham<br />
Hall<br />
Hart<br />
Jackson<br />
LuEpkin<br />
Madison<br />
Habur.<br />
Stephens<br />
TOTCIS<br />
Union<br />
Tlhite<br />
Table A.-57<br />
Idle<br />
land<br />
h.2<br />
2.3<br />
U.8<br />
Kunber and Acreage <strong>of</strong> Farms, 19UQ and Preliminary<br />
for 19S57 In Northeast <strong>Georgia</strong> Area py Counties<br />
Number <strong>of</strong> Fams<br />
19U5<br />
2U,U6l<br />
1,232<br />
1,502<br />
702<br />
1,731<br />
2,267<br />
1,5^8<br />
2,809<br />
2,i4lU<br />
2,«Jt<br />
899<br />
1,879'<br />
955<br />
901<br />
811<br />
1,297<br />
1,050<br />
19UO<br />
23,551<br />
1,370<br />
1,W8<br />
61U<br />
2,009<br />
2,139<br />
1,386<br />
2,U05<br />
2,308<br />
2,223<br />
810.<br />
1,876<br />
1,037<br />
895<br />
710.<br />
1,325<br />
92k<br />
19U5<br />
Farm Acreage<br />
1,782,U55<br />
108,135<br />
9h,5kh<br />
77,301<br />
123,281<br />
!Ji8,709<br />
105,398<br />
21U.285<br />
1)49, 18U<br />
191,302<br />
79,073<br />
15U.972<br />
51,31:5<br />
73,028<br />
1»0,OU1<br />
86,81*2<br />
8U,515<br />
19UO<br />
1,736,893<br />
118,035<br />
9h,h9i<br />
6U,3U<br />
133,192<br />
150,905<br />
99,159<br />
187,712<br />
U»9,311<br />
176,873j<br />
75,375<br />
152, hkO<br />
56,981<br />
73,503<br />
37,616<br />
9U,732<br />
72,235<br />
Source: U. S. Census, Press Release L-U5-6U.<br />
—168—<br />
Suu ....<br />
Engineering<br />
Experiment<br />
Station . . .<br />
Ctorgie<br />
Tah<br />
Indnttrial . .<br />
. . Economic<br />
Rewjrcb . .<br />
The average farm in the<br />
Northeast <strong>Georgia</strong> Area con<br />
tained 75.9 acres in 1940. Of<br />
this, only 23.6 acrss were<br />
used for crops in 1939. Table<br />
A-4a gives in detail the 1940<br />
division into various uses,<br />
both for the Aroa and for<br />
Panel I and Panel II counties.<br />
Between the 1940 census<br />
and the 1945 census (some<br />
preliminary figures for which<br />
are available), the total<br />
land in farms in the North<br />
east <strong>Georgia</strong> Area increased<br />
by 45,562 acres and the num<br />
ber <strong>of</strong> farms by 910, resultiae<br />
in a reduction in size <strong>of</strong><br />
lumber Farm<br />
Df Farms Acreage<br />
Change Change<br />
4910<br />
-138<br />
t hh<br />
+ 88<br />
-228<br />
+128<br />
+162<br />
+UOU<br />
4-106<br />
+191<br />
+ 58<br />
+ 3<br />
- 82<br />
+ 6<br />
4 70<br />
- 28<br />
4126<br />
4U5,562<br />
- 9,901;<br />
4 50<br />
+12,987<br />
- 9,911<br />
- 2,196<br />
4 6,239<br />
+26,573<br />
- 127<br />
+1U,29<br />
+ 3,698<br />
+ 2,521;<br />
- 5,636<br />
- Ii75<br />
+ 2,1£5<br />
- 7,890<br />
412,276
Table A-U<br />
Farm Land by_ Use in Acres for the Northeast <strong>Georgia</strong><br />
Area, 1939, by Panels and Counties by<br />
Subsistence Groups<br />
£<br />
i<br />
C<br />
-H<br />
1<br />
|<br />
iis<br />
r-( .0 a 3<br />
PU «0 P4 -t-'<br />
mvO H CO rH O\ r*-1A<br />
COiH p-lTivO 0\rH O<br />
CM H H r-l -3 f,<br />
COCUCMNOOX^O^OON<br />
OJOJC--CO OeOONO-=t<br />
OsOH OaoOlAOJlr\<br />
O 1A f1^ f1 * rH CM NO ON D—<br />
_ _ , . ,\A O t*\ CM -J<br />
P- ON H CM OMACO en NO NO r^ir\NO co<br />
3 cou\N U\NO C<br />
NO i-1 P—1A H CO 1A<br />
HHHHHHCMH<br />
f-H O\>OCO O O-CNJ<br />
CMCMrHOJ(-(Cyc\JC\J<br />
--<br />
CMHONOf-NOCONOrHcn<br />
O (Jv O i-l f*"» H U\<br />
CMCOCO f\CVl ONOJ P-tANO<br />
n-\ oj OJ OJ <<br />
-<br />
-S-=Jco (-1 Mao<br />
ONONONP-COIAXAtACO P-<br />
mrr\co P-NO CM rH Q-=r-=t<br />
J-p-O rH CO O1AC5«-lUN<br />
XAP— rH CO -^ CM O OH<br />
fi -^ CM ON CO NO CO<br />
CO<br />
CNO NO c*\ H H <br />
P-co O\cO OSCM<br />
-3-O\vO<br />
HIArH "<br />
—169—<br />
-<br />
-=Tf^<br />
O H ON<br />
H-=TNO<br />
NO OJ m<br />
ON CM r—<br />
NOXAH<br />
O CMCO<br />
NO ON r-<br />
C^l CM O<br />
P-tA CM<br />
•d<br />
&H<br />
|«<br />
1 =<br />
5 nj<br />
ti.»<br />
C T3<br />
-H T»<br />
• W *^<br />
^2i<br />
^S •><br />
•a o-s<br />
EH J3 ffl<br />
.^ s<br />
to ^-i<br />
0) O •*<br />
n<br />
co cn T3<br />
> ctl H<br />
> J= -d<br />
s: 1 .§£•<br />
9<br />
•a<br />
\& 'I<br />
on to<br />
O t. rt<br />
.38<br />
o> o<br />
&3 1"<br />
i> p Q)<br />
3SS<br />
e s<br />
l« .rj H<br />
«J|<br />
•> 0) 0)<br />
3g«<br />
Sll 1<br />
0) rU t«<br />
o o •<br />
0 0}<br />
• O T3 Jj<br />
co c c 3<br />
2<br />
(0 -P<br />
n<br />
^fi-ja<br />
»S§ c<br />
Q) T3 r^ 'H<br />
^ fl> O -P<br />
II 6§<br />
•V •*<br />
0) *O<br />
!M
the average farm to 72.8 acres. Table A-57 presents the county<br />
detail <strong>of</strong> this 1940-1945 comparison. It will be noted that in<br />
creases in number <strong>of</strong> farms occurred in all counties but four<br />
(Banks, Forsyth, Kabua and Union), while nine counties had in<br />
creases in the total land in farms, and seven had decreases.<br />
Table A-l, in three parts, presents a standard series <strong>of</strong><br />
agricultural conparisons <strong>of</strong> the censuses <strong>of</strong> 1940, 1930, and 1920.<br />
Table A-l<br />
Item<br />
Trends <strong>of</strong> Important Agricultural Factors for the Periods<br />
I9l9",~l929, and~l939 for the Northeast <strong>Georgia</strong><br />
Area by Panels in Numbers and Per Cents<br />
Rural population<br />
Rural farm population<br />
Total land, acres<br />
Land in farms, acres<br />
Number <strong>of</strong> farms<br />
Average size <strong>of</strong><br />
farms, acres<br />
Cotton, acres<br />
Corn, acres<br />
Wheat, acres<br />
Oats, acres<br />
Watermelons, acres<br />
Sweet potatoes, acres<br />
Tobacco, acres<br />
Rays, acres<br />
Snap beans, acres<br />
Cabbage, acres<br />
Tomatoes, acres<br />
Total vegetables, acres<br />
Sugarcane, acres<br />
Peanuts, acres1<br />
Peanuts, acres8<br />
lorses and miles<br />
Total cattle<br />
Sows and gilts<br />
Sheep<br />
Ihickens<br />
For the TOiole Area<br />
1939<br />
171,, 863<br />
130,1,56<br />
2,71i3,OliO<br />
1,736,893<br />
23,551<br />
73-8<br />
168,21,5<br />
2li8,722<br />
36,126<br />
60,890<br />
330<br />
5,357<br />
156<br />
37,367<br />
1,6SU<br />
397<br />
77<br />
3,688<br />
h<br />
1,31,3<br />
102<br />
31,673<br />
51,93k<br />
3,211<br />
1,563<br />
627,102<br />
Values for<br />
1929<br />
167,126<br />
133,518<br />
2,772,ii80<br />
1,733,733<br />
26,751<br />
61i.8<br />
306,916<br />
227,200<br />
11,279<br />
30,835<br />
351,<br />
2,91,8<br />
68<br />
8,807<br />
573<br />
353<br />
112<br />
1,782<br />
1<br />
5io<br />
75<br />
35,292<br />
1*5,791,<br />
2,990<br />
lt,007<br />
51.0,356<br />
1919<br />
185,395<br />
*<br />
2,772,1,80<br />
1,920,599<br />
30,609<br />
62.7<br />
371*, 312<br />
281,708<br />
27,338<br />
10,1*98<br />
150<br />
6,198<br />
123<br />
26,761<br />
159<br />
130<br />
70<br />
590<br />
110<br />
l*3lrf<br />
#<br />
1*1*,895<br />
76,OliO<br />
9.71J*<br />
6,290<br />
71*6,168<br />
State ....<br />
Experi<br />
Station . . .<br />
Grorgia<br />
TVck<br />
Indutrul . .<br />
..Economic<br />
Roeardi . .<br />
Per Cent Tear<br />
is <strong>of</strong> 19203<br />
1939<br />
91*. 32<br />
97.71<br />
98. 9U<br />
90.1j3<br />
76.9k<br />
117.70<br />
tOt.95<br />
88.29<br />
132.15<br />
580.02<br />
220.00<br />
86.1,3<br />
126.83<br />
139.63<br />
1,01*0.25<br />
305-38<br />
110.00<br />
625-08<br />
3-6ii<br />
309-U5<br />
136.00<br />
70.55<br />
68.30<br />
33.06<br />
2U.85<br />
8U.Oii<br />
Source: U. S. Census, Agriculture and Population for 191,0, 1930,<br />
and 1920. The population, land and animal figures are for the Census<br />
year; crop acreage figures are for the preceding crop year, i.e. 1939,<br />
1-929, 1919.<br />
•^Information not available.<br />
#The U. S- Census, 1920, gives only one figure for peanuts.<br />
'•Planted solid. *Tnterplanted.<br />
*In cases nhere the 1920 figure was not available, the 1930 figure<br />
ras used as a base.<br />
—170—<br />
1929<br />
90.15<br />
100.00<br />
90.27<br />
87.1jO<br />
103.35<br />
81.99<br />
80.65<br />
Ul. 26<br />
293-72<br />
236.00<br />
1,7-56<br />
55-28<br />
32.91<br />
360-38<br />
271-514<br />
160.00<br />
302.03<br />
0-91<br />
117.51<br />
78.61<br />
60.22<br />
30.78<br />
63-70<br />
72.1,2
The first section presents Area totals, and the second and third<br />
sections give totals for counties in Panel I and Panel II. Ex<br />
amination <strong>of</strong> these tables shows that the 1940 farm population<br />
and the total rural population have decreased since 1920, but<br />
represent an increase over 1930. The average size <strong>of</strong> farm in<br />
1940 increased over both Z930 and 1920, while the total land in<br />
farms in 1940 is less than in 1920 and about the same as in 1930,<br />
Table A-l (continued)<br />
Suit. . . .<br />
Experiment<br />
Station . . .<br />
<strong>Georgia</strong><br />
Tidf<br />
bufaitrul . .<br />
. . Economic<br />
Racarch . .<br />
Item<br />
1919, 1929, and 1939 for the Northeast <strong>Georgia</strong><br />
Area by Panels in Numbers and Per Cents<br />
Rural population<br />
Rural farm population<br />
Total land, acres<br />
Land in farms, acres<br />
Number <strong>of</strong> farms<br />
Average size <strong>of</strong><br />
farms, acres<br />
Cotton, acres<br />
Corrij acres<br />
V!heat, acres<br />
Oats, acres<br />
Watermelons, acres<br />
Sweet potatoes, acres<br />
Tobacco, acres<br />
Hays, acres<br />
Snap beans, acres<br />
Cabbage, acres<br />
Tomatoes, acres<br />
Total vegetables, acres<br />
Sugarcane, acres<br />
Peanuts, acres 1<br />
Peanuts, acres2<br />
Horses and mules<br />
Total cattle<br />
Sows and gilts<br />
Sheep<br />
Chickens<br />
1939<br />
1*9,355<br />
141,851<br />
609,280<br />
529,IJ*5<br />
7,651<br />
69-2<br />
78,901<br />
85,258<br />
19,107<br />
29,061<br />
133<br />
1,801<br />
8<br />
13,667<br />
110<br />
2<br />
8<br />
695<br />
2<br />
1*30<br />
51*<br />
11,728<br />
i5.ol.Ji<br />
739<br />
158<br />
195,581*<br />
For Panel I Counties<br />
Values for<br />
1929<br />
ii9,837<br />
1*3,867<br />
611*, 1*00<br />
Ii8l,09l*<br />
9,221)<br />
52.2<br />
133,61*6<br />
69,639<br />
1*,121<br />
11*, 217<br />
112<br />
1,032<br />
**<br />
2,612<br />
1*0<br />
10<br />
12<br />
2liO<br />
—<br />
1552<br />
12,975<br />
13,605<br />
897<br />
181<br />
163,U*2<br />
1919<br />
58,355<br />
*<br />
611*, 1*00<br />
513,853<br />
10,588<br />
1*8.5<br />
159,568<br />
85,736<br />
8,950<br />
1*,682<br />
36<br />
2,161<br />
1*<br />
8,1M 1136<br />
59<br />
59<br />
15J*#<br />
if<br />
U*,93li<br />
21.673<br />
1,051*<br />
72<br />
231,559<br />
Per Cent Year<br />
is <strong>of</strong> 19293<br />
1939<br />
81*. 58<br />
95-1*0<br />
99-17<br />
103.03<br />
72.26<br />
11*2.68<br />
1*9.1*5<br />
99.1*1*<br />
213- Ii9<br />
620.70<br />
369.1*1*<br />
83-31*<br />
200.00<br />
167.82<br />
1,000.00<br />
66.67-<br />
133-33<br />
1,177-97<br />
3-39<br />
279-22<br />
2,700.00<br />
78.53<br />
69.1*1<br />
70.11<br />
219- 111*<br />
811.1*6<br />
1929<br />
85.1*0<br />
100.00<br />
93.62<br />
87.12<br />
107.63<br />
83-75<br />
81.22<br />
l*6.oli<br />
303.65<br />
311.11<br />
1*7.76<br />
32.07<br />
363-61*<br />
333-33<br />
200.00<br />
1*06.78<br />
100.65<br />
86.88<br />
62.77<br />
85.10<br />
251-39<br />
70.1,5<br />
Sources U. 3. Census, Agriculture and Population for 191*0,<br />
1930, arid 1920. The population, land and animal figures are for the<br />
Census year; crop acreage figures are for the preceding crop year.<br />
i- e. 1939, 1929, 1919.<br />
•Information not available.<br />
#The U. S. Census, 1920, gives only one figure for peanuts.<br />
**Less than three farms reporting.<br />
Planted solid. sjnterpianted.<br />
•in cases where the 1920 figure was not available, the 1930<br />
figure was used as a base.<br />
—171—
There has been a general decrease in the acreage planted<br />
with cotton. The 1919 total <strong>of</strong> 374,312 acres fell to 305,916 in<br />
1929 and, further, to 168,245 acres in 1939. This has been bal<br />
anced "oy an increase in yield per acre, by increased acreage in<br />
other crops such as -wheat, oats, hay, and vegetables, and, since<br />
1930, by an increase in the nunber <strong>of</strong> livestock, especially pigs I Indmtrul._<br />
and hogs. The large decrease in livestock numbers between 1920 II • • Ec
The value <strong>of</strong> products sold, traded, or consumed in 1939 by<br />
the 23,551 farms was $13,223,225, a per farm average <strong>of</strong> $561.<br />
For the Area as a whole, 44.72 per cent <strong>of</strong> the farms were Sub<br />
sistence farms, which produced an average <strong>of</strong> $404 per farm, <strong>of</strong><br />
which they consumed, on the average, $265. Nonsubsistence farms<br />
on the average, consumed |175 <strong>of</strong> their total production.<br />
Enterprise<br />
Cotton<br />
Corn<br />
ffiisat<br />
Co.nnercial vegetables 8<br />
Peanuts 3<br />
Peanuts4<br />
Total Labor Needs<br />
for Crops<br />
Horses and mules 6<br />
Cattle6<br />
Sows and<br />
Shsepe<br />
Chickens (per hundred) 6<br />
Total Labor Needs<br />
for Livestock<br />
Total Labor Needs<br />
for All Enter<br />
prises<br />
Table A-la<br />
Man Labor Needs for Principal Farm Enterprises<br />
in the Northeast <strong>Georgia</strong> Area<br />
~Igl9, 1929~and 193<br />
Labor<br />
Needs Per<br />
Unit1<br />
10-Hour<br />
Days<br />
13-7<br />
3.1<br />
1.1*<br />
13.5<br />
7.7<br />
3.0<br />
15.9<br />
1.0<br />
3.8<br />
0.8<br />
26.1<br />
1939<br />
Total<br />
Labor<br />
Needs, 10-<br />
Units 1 Hour Days<br />
168,2W<br />
21(8,722<br />
36,126<br />
3,688<br />
1,31*3<br />
102<br />
1(58,226<br />
31,673<br />
51,931*<br />
3,211<br />
1,563<br />
6,271<br />
2,30l*,957<br />
771,033<br />
50,576<br />
1*9,788<br />
10,3kl<br />
306<br />
3,187,006<br />
503,601<br />
51,931*<br />
12,202<br />
1,250<br />
163,673<br />
732,660<br />
3,919,666<br />
Sutr ....<br />
Engineering<br />
Experiment<br />
Station . . .<br />
Grorgia<br />
Ttch<br />
Indottru] . .<br />
. . Economic<br />
Reseircn . .<br />
1929<br />
Total<br />
Labor<br />
Needs, 10-<br />
Units 1 Hour Days<br />
371»,'312<br />
281,708<br />
27,338<br />
590<br />
1*31*#<br />
681*, 382<br />
1*1*, 895<br />
76,01(0<br />
9,711*<br />
6,290<br />
7,lt62<br />
5,128,071*<br />
873,295<br />
38,273<br />
7,965<br />
3,3U2<br />
6,050,91(9<br />
713,331<br />
76,01(0<br />
36,913<br />
5,032<br />
19U.758<br />
1,026,571*<br />
7,077,523<br />
Source: This table is based on Distribution <strong>of</strong> Man Labor for<br />
Various <strong>Georgia</strong> Enterprises, a mimeographed report by Firor, King, Camp<br />
bell, and Harper, College <strong>of</strong> Agriculture, <strong>University</strong> <strong>of</strong> <strong>Georgia</strong>, 191(0,<br />
1The unit for crops is one acre; the unit for livestock is one<br />
animal (except poultry for which it is 100 birds).<br />
2Not including watermelons.<br />
'Peanuts planted solid.<br />
4 Peanuts interplanted. 1939 acreage is used as base, since no data<br />
are available for 1919. Labor requirements estimated. Labor needs<br />
will vary according to proportion "hogged <strong>of</strong>f" (hogging <strong>of</strong>f is the usual<br />
purpose for interplanting peanuts).<br />
6 Inventory numbers on Census enumeration dates. Labor needs for<br />
livestock include only labor used directly with the livestock, i. e.,<br />
"eeding, and do not include labor used in producing feed, or repairing<br />
fences, livestock barns, etc.<br />
U. S. Census, 1920, gives only one figure for peanuts._______<br />
—173—
The development <strong>of</strong>. the broiler industry during the war pe<br />
riod is the most outstanding'item in the agriculture <strong>of</strong> North<br />
east <strong>Georgia</strong>, even though it affects only four counties and a<br />
snail proportion <strong>of</strong> the farms in these counties.<br />
Trends in Agricultural Labor Needs<br />
Stju ....<br />
EnginKriflg<br />
Experiment<br />
Sutioa . . .<br />
<strong>Georgia</strong><br />
Tali<br />
IndniRu! . .<br />
. . Economic<br />
Rocarcb . .<br />
Man labor needs for the principal farm enterprises in the<br />
Kortheast <strong>Georgia</strong> Area decreased from 7,077,523 in 1919 to 3,919,666 in<br />
1939. The most significant labor need changes occurred for cotton and com<br />
mercial vegetables. Labor needs for cotton declined by more than half,<br />
while they increased over six times for coa-nercial vegetables production.<br />
Shifts in the acreages <strong>of</strong> various crops resulted in decreased labor<br />
needs for cotton and corn. The important enterprises requiring more labor<br />
were coasereial vegetables, wheat, and peanuts.<br />
Decreasing numbers <strong>of</strong> animals have resulted in lower labor needs for<br />
horses and miles, cattle, sows and gilts, and sheep. Labor needs for<br />
poultry, particularly broilers, have increased.<br />
Table A-la gives details <strong>of</strong> labor requirement for the principal crops<br />
and livestock for 1919 and 1939. The decreases for the listed items re<br />
flect a probable increase in maintenance work, transfer from cotton to<br />
vegetables and other nore pr<strong>of</strong>itable items, and a decrease in the total<br />
farm population. Since 1939 there has been an increase in vegetable grow<br />
ing in the northern counties which may ultimately affect the economic pat<br />
tern.<br />
In 1939, the agricultural labor force in the Northeast <strong>Georgia</strong> Area<br />
was 33,221. The 1946 estimate <strong>of</strong> the agricultural labor force is set at<br />
35,216, practically unchanged although some changes in composition are<br />
indicated.<br />
As already mentioned, there is considerable farm labor need for work<br />
outside <strong>of</strong> that covered by the principal enterprises shown in Table A-la.<br />
Tliis other labor need will include small farm enterprises such as orchards,<br />
home gardens, green feed crops, soil building crops, and farm nafhtenauce<br />
work such as building and machinery repair work, construction and main<br />
tenance <strong>of</strong> farm fences, and work in the farm forest lands.<br />
—174—
County Income Classification<br />
Among the 23,551 farmers in the sixteen-county Northeast<br />
<strong>Georgia</strong> Area who derive their livelihood from 1,736,893 acres <strong>of</strong><br />
land, some are prosperous! some are not.<br />
There is a wide variety <strong>of</strong> reasons for these differences<br />
in prosperity, most <strong>of</strong> which are associated with the character<br />
and quality <strong>of</strong> the land or with the specific uses to which the land is be<br />
ing put. The elementary variations are in size, gross income, gross expen<br />
diture, and individual standards or levels <strong>of</strong> living. Always these varia<br />
tions, due in part to natural resources, in part to factors beyond the con<br />
trol <strong>of</strong> farmers, and in part to the skills and abilities <strong>of</strong> the farmers,<br />
should be kept in mind.<br />
Some farms in the Northeast <strong>Georgia</strong> Area—13,1*32 <strong>of</strong> them—are operated<br />
by tenants. Others, possibly including some <strong>of</strong> the tenant-operated farms,<br />
are "Subsistence farms." Some employ tractors, some do not. Some lack<br />
adequate pastures, others have an excessive proportion <strong>of</strong> their total land<br />
in woodland, yet derive little pr<strong>of</strong>it from it. Still others may have no<br />
woodland. The average value <strong>of</strong> products sold, traded, and consumed in 1939<br />
was $561 per farm, but one farm in six produced less than $250; seven farms<br />
produced more than (10,000 each.<br />
Over the Area as a whole, the farm population represented 65.93 per<br />
cent <strong>of</strong> the total population in 191(0. The total value <strong>of</strong> products "sold,<br />
traded, and consumed" by this farm population amounted to $13,223,225 in<br />
1939. The land and buildings employed represented in that year a value<br />
<strong>of</strong> $37,932,907 (See Table A-6). These things all point to the fact that<br />
the problems <strong>of</strong> agriculture are important to everyone in the Area, not<br />
aierely to the farmers and their families.<br />
Economically, no two counties in <strong>Georgia</strong> are exactly the same. Nor<br />
are they the product <strong>of</strong> exactly the same combination either <strong>of</strong> land and<br />
the effect <strong>of</strong> the weather or <strong>of</strong> people and their actions. The farm econ<br />
omy is exceedingly complex. Farms vary in size, in income, in soil, in<br />
type <strong>of</strong> crops. Tilth this complex structure is it possible to find a<br />
common denominator which will classify the farms in a county into groups<br />
in such a way as to reveal their capacity for prosperity Can this be<br />
done for the Northeast <strong>Georgia</strong> Area What groups <strong>of</strong> farms in the North<br />
east <strong>Georgia</strong> Area add to the prosperity <strong>of</strong> the whole Area What groups<br />
fail to do so What kind <strong>of</strong> farms in the Northeast <strong>Georgia</strong> Area have<br />
serious problems Admittedly, it is not an easy task to answer these<br />
questions, but if it can be accomplished, even, in part, it is important<br />
to make the attempt.<br />
The farmer is a definite part <strong>of</strong> the whole community—his prosperity<br />
affects the rest <strong>of</strong> the community in the same way that the prosperity <strong>of</strong><br />
other groups affects farm prosperity. It is important, therefore, to de<br />
termine whet parts <strong>of</strong> the farm group are more prosperous in relation to<br />
the land they employ and thereby better able to participate adequately<br />
in the life <strong>of</strong> the community and its economy. It is also important to<br />
determine what parts <strong>of</strong> the farm group are confronted with problems which<br />
prevent this adequate participation in the community <strong>of</strong> which they are a<br />
part. Such problems require definition so that not only the farmers but<br />
ths mole community can work for their solution. The point <strong>of</strong> beginning<br />
is necessarily a consideration <strong>of</strong> all the farms in <strong>Georgia</strong> and the<br />
—175— .
development <strong>of</strong> a plan <strong>of</strong> classification which can be applied<br />
uniformly to all counties in the state. This will provide a<br />
pattern with which the Kortheast <strong>Georgia</strong> Area can be compared.<br />
The discussion <strong>of</strong> the pattern found over <strong>Georgia</strong> should<br />
be brief and general. For this reason the detailed county<br />
tables and a considerable part <strong>of</strong> the technical statistical<br />
discussion are being omitted. However, county agents and<br />
Start ....<br />
Engineering<br />
Experiment<br />
Station . . .<br />
Gtoegia<br />
Tick<br />
Industrial . .<br />
. . Economic<br />
Research .<br />
others interested in the theoretical problems are invited to examine the<br />
full details available in the files <strong>of</strong> the Industrial Economic Research<br />
Department and to discuss them vrith staff members.<br />
The statistical device used to deterndne the <strong>Georgia</strong> pattern was<br />
based on two sets <strong>of</strong> data available in the census which distribute the<br />
number <strong>of</strong> farms en the basis <strong>of</strong>: (a) the number <strong>of</strong> farms at different<br />
levels <strong>of</strong> total productivity (income), and (b) number <strong>of</strong> farms at varying<br />
sizes. The ratio between these two is used as a basis <strong>of</strong> classification.<br />
This incone-size ratio and the per cent figures on which it is based are<br />
being studied as a generally useful statistical measure <strong>of</strong> the composite<br />
economic effect <strong>of</strong> the multiple factors affecting land and the equally<br />
multiple factors applying to people and their actions.<br />
The data ir. each <strong>of</strong> the two base series have been combined into five<br />
groups. At each level numbers <strong>of</strong> farms in the income and size-<strong>of</strong>-farm<br />
segments were made as nearly equal as was practical within the limitations<br />
<strong>of</strong> the data.<br />
Table A-2 Table A-2 gives<br />
Level<br />
High<br />
Highi^.cdle<br />
JlLddle<br />
LowiLLddle<br />
Low<br />
Number and Per Cent <strong>of</strong> Farms in <strong>Georgia</strong><br />
by Income and Siz~Segments, 1939<br />
Unc: assified<br />
Tot; 1<br />
Income<br />
Range<br />
Over<br />
$2,500<br />
$1,500<br />
$2,h99<br />
$1,000<br />
$l,li99<br />
$ 600<br />
$ 999<br />
Under<br />
$ 600<br />
Fare Income<br />
Distribution<br />
Number<br />
Farms<br />
6,727<br />
10,595<br />
21,1.38<br />
51,599<br />
125,052<br />
622<br />
216,033<br />
Per<br />
Cent<br />
3.11<br />
U.90<br />
9.92<br />
23.89<br />
57.8<br />
0.29<br />
100.00<br />
Per<br />
Cent<br />
3. 80<br />
5.51.<br />
10.77<br />
26.51<br />
53.38<br />
100.00<br />
Source: Calculated, from Table A-3b.<br />
—176 —<br />
Size-<strong>of</strong>-Farm<br />
Distribution<br />
Number<br />
Farms<br />
8,216<br />
11,967<br />
23 ,262<br />
57,276<br />
115,312<br />
216,033<br />
Size<br />
Range<br />
Acres<br />
Over<br />
380<br />
220-<br />
379<br />
1UO-<br />
219<br />
70-<br />
139<br />
Under<br />
70<br />
in detail the de<br />
scriptions <strong>of</strong> the<br />
five income and<br />
the five size-<strong>of</strong>farm<br />
segments and<br />
presents for<br />
<strong>Georgia</strong> the num<br />
ber <strong>of</strong> farms and<br />
the per cent <strong>of</strong><br />
the <strong>Georgia</strong> total<br />
represented by<br />
each segment in<br />
each group.<br />
Table A-2<br />
also shows a third<br />
figure derived by<br />
dividing (for each<br />
level) the income<br />
per cent (Line A<br />
in table) by the<br />
size-<strong>of</strong>-fam per<br />
cent (Line B in<br />
table). This fig<br />
ure is called the<br />
Income-Size Ratio<br />
and is shown in<br />
Table A-2a on<br />
Line E. ,<br />
The tern<br />
"farm income" as
used i-i this discussion represents the "value <strong>of</strong> products sold,<br />
traded, and consumed" as shown for 1939 by the census, flhile<br />
this is not, strictly speaking, an income figure, it is the<br />
closest figure available 'on a county basis with sufficient de<br />
tail for statistical manipulation^ classification, and analysis.<br />
The term "income" then may be considered as being used for the<br />
sake <strong>of</strong> brevity in reference.<br />
Sure ....<br />
Engineering<br />
Experiment<br />
Station . . .<br />
<strong>Georgia</strong><br />
T«c»<br />
Industrial . .<br />
. . Economic<br />
Research . .<br />
In the classification <strong>of</strong> counties on the basis <strong>of</strong> these three series<br />
<strong>of</strong> figures, the procedures described in the following paragraphs have been<br />
employed.<br />
Panel Division; The counties <strong>of</strong> the state were first divided into<br />
two groups on the<br />
Table A-2a<br />
basis <strong>of</strong> whether or<br />
not the income-size<br />
Income-Size Ratios and Per Cents <strong>of</strong> All Farms in ratio at the Middle<br />
Five Income Segments and Five Size-<strong>of</strong>-Farm level was unity or<br />
Segments for <strong>Georgia</strong> by PanelsTor 195<br />
greater, or less<br />
than unity. The 61<br />
High<br />
Low<br />
•a counties with a<br />
High: Middle sltddle: Middle: Low:<br />
o> Middle income-size<br />
-H<br />
Over 31500- $1000- $600- Under CM ratio <strong>of</strong> unity or<br />
•H<br />
1<br />
$21(99; «2li99; S1U99; $999; $600 M greater have been<br />
CO<br />
Over 220- lliO- 70- Under i-t a called Panel I<br />
380 379 219 139 70<br />
Counties, the 98<br />
Acres Acres Acres Acres Acres 1 counties with Mid<br />
dle income-size<br />
A 3.11 U.90 9.92 23.39 57*89 0.29 ratios <strong>of</strong> less than<br />
B 3.60 5.5U 10.77 26.51 53.38 unity have been des<br />
R 0.32 0.88 0.92 0.90 1.08 ignated as Panel II<br />
Counties.<br />
Suonary<br />
<strong>Georgia</strong><br />
Panel I<br />
Panel n<br />
A<br />
B<br />
R<br />
A<br />
B<br />
R<br />
U.22<br />
3.99<br />
1.06<br />
2.29<br />
3.67<br />
0.63<br />
7.U6<br />
5.58<br />
1.3U<br />
3.01<br />
5.51<br />
0.55<br />
lii.W<br />
9.35<br />
1.35<br />
6.5U<br />
11.32<br />
0.55<br />
28.27<br />
2S.'j3<br />
1.11<br />
20.6k<br />
27.31<br />
0.76<br />
W.23<br />
55.65<br />
0.81<br />
67.26<br />
51.69<br />
1.30<br />
0.33<br />
0.26<br />
Source: Calculated from Table A-3b.<br />
1The values s'uovm on each <strong>of</strong> the three lines for<br />
each area are: A - Per Cents for Income Segments;<br />
B - Per Cents for Size-<strong>of</strong>-Farm Segments; H - Income-<br />
Si7.e Ratio. The income-size ratio (R) is obtained by<br />
dividing the income per cent (A) by the Size-<strong>of</strong>-Farm<br />
per cent (B).<br />
It was the gen<br />
eral thought when<br />
t'-iis division was<br />
made that Panel I<br />
Counties would prove<br />
to be counties in<br />
which intensive 1<br />
farming was predomi<br />
nant. Fnen all the<br />
counties in the<br />
state <strong>of</strong> <strong>Georgia</strong> had<br />
been so classified,<br />
it was discovered<br />
that all but seven<br />
Panel I Counties were<br />
located in South <strong>Georgia</strong> and all but sixteen Panel II Counties in North<br />
and Middle <strong>Georgia</strong>. It also appears to be generally true that intensive<br />
farming predominates in the Panel I Counties, but it is not quite so cer<br />
tain that extensive farming predominates in the Panel II Counties. Appar<br />
ently the Panel II Counties should be extensive farming counties, but are<br />
iBecause the data being considered deal with the "whole farm" and<br />
"all farm products" the terms inteng _e_ and extensive are used to indicate<br />
a relatively high income per acre or a relatively low income per acre for<br />
the wiiole farm.<br />
—177—
not because <strong>of</strong> excessively high percentages in both the Low<br />
incone segaent and the Low size-<strong>of</strong>-farm segaent.<br />
The circumstance that the number <strong>of</strong> subsistence farms<br />
<strong>of</strong>ten is more than half the number <strong>of</strong> fahns <strong>of</strong> less than 70<br />
acres in size probably contributes to this, but data are lacking,<br />
to detemine what proportion <strong>of</strong> all subsistence farms fall in<br />
to the Low size-<strong>of</strong>-farm segment, or into the Low income seg<br />
ment.<br />
Groups A, B, and C: A second method <strong>of</strong> classification suggested by<br />
the large Low level percentages in many Panel II counties was a broad<br />
classification on the basis <strong>of</strong> the size <strong>of</strong> the Low income segment. This<br />
classification placed the 52 counties in which the Low InccnE segment vras<br />
less than 50 per cent <strong>of</strong> all farms in the county in Group A; the 63 coun<br />
ties in which the Low income segment was above 50 per cent and not over<br />
70 per cent in Group B; and the UU counties in which the Low income segaent<br />
was over 70 per cent in Group C. Group A counties proved to be predoainantly<br />
in South <strong>Georgia</strong>, while Group C counties were very largely<br />
located in North <strong>Georgia</strong>.<br />
Panel-Group Relationships; The distribution <strong>of</strong> the three groups A,<br />
B, and C over Panels I and II is indicative <strong>of</strong> the general tendency for<br />
agreement between the bra classifications, even though they also tend to<br />
overlap, rather than represent an end to end ordering. In Panel'1, Ijl <strong>of</strong><br />
the 52 counties in Croup A occur, 16 <strong>of</strong> the 63 Group B counties, and only<br />
U <strong>of</strong> the kli Group C counties. This indicates a close affinity between<br />
Panel I and Group A since two-thirds <strong>of</strong> all Panel I counties are Group A,<br />
and four-fifths <strong>of</strong> all Group A counties are Panel I.<br />
In the same way Panel II seems to be associated with both Group C and<br />
Group B. Slightly over nine-tenths <strong>of</strong> all Group C counties are in Panel<br />
H; four-ninths <strong>of</strong> the counties in Panel II are Group C counties. So far<br />
as <strong>Georgia</strong> is concerned, a similar though less intense relationship exists<br />
between Panel II and Group B. About three-fourths <strong>of</strong> all Group B counties<br />
are in Panel II and almost half <strong>of</strong> the counties in Panel II are Group B<br />
counties. It appears probable, however, that this reflects distortions<br />
resulting from unsolved problems <strong>of</strong> farm manage-<br />
Panel Panel ment, since it would ordinarily be expected<br />
Group I II Total that Group B should provide more nearly equal<br />
proportions <strong>of</strong> each <strong>of</strong> the two panels. The<br />
A III 11 52 distribution <strong>of</strong> counties between panels and<br />
B 16 U7 63 groups is listed to the left.<br />
0 k kO bk<br />
Total 61 98 159 The following general statements have been<br />
developed from the examination <strong>of</strong> individual<br />
counties as reflecting the meaning <strong>of</strong> the Panel division.<br />
1. All Panel I counties produce more income per average acre in<br />
farms than do Panel II counties.<br />
2. The average per fara income is lower in Panel II counties than<br />
in Panel I counties.<br />
3. Host extensive farming should be found in High or High-Kiddle<br />
size-<strong>of</strong>-farm segments. Extensive farming may appear in either Panel I or<br />
Panel II.<br />
k. Over <strong>Georgia</strong> as a whole, Panel II counties appear to be counties<br />
in which extensive farming is practiced, but in which most farius are in<br />
tensive,<br />
—178—
5. In both panels, income-size ratios for High, High-<br />
Middle, Middle, or Low-Middle segments which are greater than<br />
the average are indicative <strong>of</strong> farm prosperity. In the same way,<br />
a Low-Middle ratio which is less than a Low-Middle ratio for<br />
the same <strong>Georgia</strong> panel will usually indicate a greater than<br />
average farm prosperity if the shift <strong>of</strong> Incomes is toward the<br />
Kiddle level.<br />
6. For both panels, ratios for all segments which vary only slight<br />
ly (not over 0.10) from unity (1.00) indicate a reasonable balance between<br />
the use <strong>of</strong> land and the capacity <strong>of</strong> farm people, but so far no measure <strong>of</strong><br />
prosperity for this case has been clearly deduced for Panel I. The as<br />
sumption that some degree <strong>of</strong> "greater than average prosperity" exists,<br />
however, is probable, even though, for Panel I, a complete logical pro<strong>of</strong><br />
is absent. For a Panel II county this state <strong>of</strong> balance would indicate<br />
that the county was definitely above Panel H standards and was probably<br />
in transition between the two panels.<br />
If it were possible to compile a complete list <strong>of</strong>" «n the factors—<br />
geologic, geographic, climatic, economic, sociological, and even, political,<br />
which in varying degrees contribute to the income segment per cents and<br />
size-<strong>of</strong>-farm segment per cents and the resulting five income-size ratios,<br />
one would have a list whose total length might easily range beyond five<br />
hundred describable items. It is regarded as reasonable, however, that<br />
most <strong>of</strong> these factors will tend to follow the pattern indicated. Good<br />
farm managers, for example, will either have good land or improve the poor<br />
land with which they start.<br />
One result <strong>of</strong> such a multiple complex is that from end to end <strong>of</strong> the<br />
list <strong>of</strong> 1$9 counties in <strong>Georgia</strong>, it is difficult to find a sufficient num<br />
ber <strong>of</strong> uniform and mutually exclusive classifying factors by which the<br />
list can be broken into groups and the individual counties within those<br />
groups ordered. It appears probable that neither the two panels nor the<br />
A, B, and C groups fit together in an end-to-end sequence, but as is illus<br />
trated in Chart A-51, the top county <strong>of</strong> Group B stands at a point somewhat<br />
above the middle <strong>of</strong> Group i, while Group C takes a position with its top<br />
county somewhat lower than the top county in Group B. it present, a sat<br />
isfactory statistical device for determining this arrangement has not been<br />
developed.<br />
Basic Principle; If every other factor were equal, the income produced<br />
from one acre <strong>of</strong> land would be the same as from any other acre in<br />
the state. If this were true, then, <strong>of</strong> course, the two columns <strong>of</strong> per<br />
cents in Table A-2 would be exactly alike, the two columns <strong>of</strong> number <strong>of</strong><br />
farms would show exactly the same figures for both income and size-<strong>of</strong>farm<br />
opposite each level, and the farms shown under income and size-<strong>of</strong>farm<br />
for each level would actually be the same identical farms.<br />
Variations Significantt All things are seldom equal. One farm with<br />
less than 70 acres will appear in the size-<strong>of</strong>-farm part <strong>of</strong> the table as<br />
Low, but from an income viewpoint, if the farm operator harvests twice as<br />
much tobacco as the average Low size farm or milks four cows instead <strong>of</strong><br />
none, this same farm may be in the Middle segment with an income <strong>of</strong> almost<br />
$1,500. Similarly, not all land has the same- capacity to produce, while<br />
the weather and other hazards limit one farm and aid another and the skill<br />
<strong>of</strong> individual farmers varies.<br />
The variation between the income and the size-<strong>of</strong>-farm per cents pro<br />
vides a means <strong>of</strong> measuring the advantages and disadvantages <strong>of</strong> each in<br />
come-size seement, or level. These measurements reflect differences be-<br />
—179--
tween the size-<strong>of</strong>-income segments within a county (or compared<br />
with other areas) and Bake possible comparisons <strong>of</strong> the ratio<br />
<strong>of</strong> incone-tc—size for an individual county with the ratio for<br />
the sane segment for an area or its panels, or for <strong>Georgia</strong> or<br />
the <strong>Georgia</strong> panels.<br />
First Eight<br />
Counties<br />
ir. Group A<br />
Sub-group a<br />
Table A-55<br />
Minimum Levels Which Will Absorb All Tenant<br />
Fares for First, and Last~Eight Counties<br />
in Table A-5I7 <strong>Georgia</strong>, 1959"<br />
1. Cook<br />
2. Atkinson<br />
3. Tirt<br />
k* Irwin<br />
5- Turner<br />
6. Pierce<br />
7. Dooly<br />
8. Crisp<br />
Last Eight<br />
Counties<br />
in Group C<br />
Sub-group c<br />
33. Pickens<br />
3u. Heard<br />
35. Gilraer<br />
36. Hancock<br />
37. Talbot<br />
33. Troup<br />
39. Dawson<br />
UO. Chattahoochee<br />
Highest Segment in Which<br />
Soae Tenant Farm<br />
Must Occur<br />
Size <strong>of</strong><br />
Farm<br />
Low-Middle<br />
Low<br />
Low-Middle<br />
Low-Kiddle<br />
Low-Kiddle<br />
Low<br />
Law-Middle<br />
Low-Kiddle<br />
Low-Middle<br />
Low-Kiddle<br />
Lor<br />
Low-Kiddle<br />
Low-Kiddle<br />
Low-Middle<br />
Low-Middle<br />
Kiddle<br />
Farm<br />
Income<br />
Kiddle<br />
Middle<br />
Kiddle<br />
Middle<br />
Middle<br />
Low-Middle<br />
Middle<br />
Kiddle<br />
Low<br />
Low<br />
Low<br />
Low<br />
Low<br />
LOT<br />
Low<br />
Low<br />
Per<br />
Cent<br />
Ten<br />
ants<br />
60.2<br />
51.5<br />
66.3<br />
72.3<br />
75.0<br />
50.5<br />
69.2<br />
71.8<br />
50.3<br />
60.1<br />
37.3<br />
73.9<br />
62.0<br />
56.0<br />
5$.h<br />
61.7<br />
Per Cent <strong>of</strong><br />
Farms in Low<br />
and Low-<br />
Middle Seg<br />
ments<br />
Size<br />
<strong>of</strong><br />
Farm<br />
82.UU<br />
73.72<br />
77.68<br />
75.29<br />
83 .OU<br />
77.82<br />
7U.11<br />
7U.87<br />
73. U8<br />
76.28<br />
71.78<br />
70.28<br />
7S.3U<br />
71.98<br />
75.57<br />
hk.2h<br />
•<br />
Farm<br />
In<br />
comes<br />
Ii9.32<br />
U9.85<br />
W.85<br />
57.82<br />
61.70<br />
6h.Lb<br />
55.29<br />
63.31<br />
95.00<br />
96.91<br />
95.18<br />
93.03<br />
89.65<br />
90.69<br />
97.39<br />
90.60<br />
State ....<br />
Engineering<br />
Experiment<br />
Scition . . .<br />
<strong>Georgia</strong><br />
Tec*<br />
InduftrijI . .<br />
. . Economic<br />
Research . .<br />
Tenant Farms<br />
Analysis <strong>of</strong><br />
Groups A., B, and<br />
C2 indicates the<br />
following conclu<br />
sions with re<br />
spect to tenant<br />
farms in <strong>Georgia</strong>:<br />
1. There is<br />
only a very gen<br />
eral relation<br />
ship between the<br />
relative posi<br />
tion <strong>of</strong> a county<br />
and the per cent<br />
<strong>of</strong> tenant farms,<br />
even though the<br />
counties with<br />
tenancy rates be<br />
low kO per cent<br />
occur more fre<br />
quently in Table<br />
C and Panel II.<br />
2. In the<br />
most prosperous<br />
counties, the<br />
tenant fams are<br />
nore prosperous<br />
than the aver<br />
age <strong>Georgia</strong> farm.<br />
3. In the<br />
least prosperous<br />
counties, the<br />
tenant farms are<br />
less prosperous<br />
than the average<br />
<strong>Georgia</strong> farm.<br />
h- In most counties, however, the indication is that tenant farms<br />
vary froa the state average only to about the extent that farms in the<br />
county vary.<br />
No data are available by which the number <strong>of</strong> tenant farms can be dis<br />
tributed by either size-<strong>of</strong>-farm or farm income segments. If, however, one<br />
assumes that all <strong>of</strong> the tenant farms are concentrated at the lowest level<br />
Table A-51 on which this analysis is based is not included in this<br />
report, but is available for inspection at the State Engineering Experiaen,'<br />
Station. <strong>Georgia</strong> School <strong>of</strong> Technology.<br />
—180—
Table A-3<br />
Per Cent <strong>of</strong> Farms in Income and Size-<strong>of</strong>-Farm Segment<br />
with Income-Size Ratios for Northeast <strong>Georgia</strong><br />
Area Total Number <strong>of</strong> Farms and Per Cent<br />
<strong>of</strong> Tenant Farms by_ Counties<br />
Line Key:<br />
A - Income Segment Per Cent1<br />
B - Size-<strong>of</strong>-Farm Segment Per Cent<br />
R - Income-Size Ratio<br />
Summary<br />
and<br />
Counties<br />
Area<br />
Panel I<br />
Panel II<br />
0><br />
c<br />
3<br />
A<br />
B<br />
R<br />
A<br />
B<br />
R<br />
A<br />
B<br />
R<br />
High:<br />
Over<br />
$2500;<br />
Over<br />
380<br />
Acres<br />
0.98<br />
0.81<br />
1.21<br />
1.01<br />
0.52<br />
1.91*<br />
0.6<br />
0.96<br />
l.CO<br />
Panel I Counties<br />
Barrow A 1-37<br />
B 0.7<br />
R 5.07<br />
Hart<br />
ABRABR 1.13<br />
0.39<br />
2-90<br />
Forsyth<br />
O.li5<br />
0.35<br />
1.29<br />
Madison A 1.17<br />
BR 1.07<br />
1.09<br />
Panel II Counties<br />
Franklin A 0.61<br />
B 0.38<br />
R 1.61<br />
Rabun A 1.16<br />
" B 1.06<br />
R 1.09<br />
High<br />
Middle:<br />
$1500-<br />
$21*99;<br />
220-<br />
379<br />
Acres<br />
1.93<br />
2.59<br />
0.75<br />
2.76<br />
1.58<br />
1.75<br />
1.53<br />
3-07<br />
0.50<br />
2.88<br />
1.72<br />
1.67<br />
3.38<br />
1.26<br />
2.68<br />
3-14<br />
l.W*<br />
2.18<br />
1-149<br />
2.02<br />
0.71*<br />
1.82<br />
1.87<br />
0.97<br />
2.60<br />
2.51<br />
1.01.<br />
Levels<br />
Middle:<br />
$1000-<br />
$11*99;<br />
11(0-<br />
219<br />
Acres<br />
5.87<br />
7.75<br />
0.76<br />
9-15<br />
6.16<br />
1.1*9<br />
1(.30<br />
8.52<br />
o.5o<br />
11.25<br />
5.90<br />
1.91<br />
10.18<br />
5.59<br />
1.82<br />
6.92<br />
5.03<br />
1.38<br />
8.61,<br />
8.26<br />
1.05<br />
6.17<br />
7.C1<br />
0.88<br />
5.21<br />
6.91*<br />
0.75<br />
Low<br />
Middle.<br />
$600-<br />
$999;<br />
70-<br />
139<br />
Acres<br />
22.3U<br />
28.21*<br />
0.79<br />
28.28<br />
28.78<br />
0.98<br />
19.1.8<br />
27.97<br />
0.70<br />
'32.51<br />
27-09 -<br />
1.20<br />
30.1*6<br />
26.1*7<br />
1.15<br />
23.29<br />
28.37<br />
0.82<br />
27.67<br />
33-37<br />
0.83<br />
28.80<br />
31-1*6 •<br />
0.92<br />
17.71*<br />
13-79<br />
1.29<br />
Low:<br />
Under<br />
$600;<br />
Under<br />
70<br />
Acres<br />
68.69<br />
60.61<br />
1.13<br />
58.62<br />
62.56<br />
0.93<br />
73.51*<br />
59.1.8<br />
1.21.<br />
51.65<br />
65.02<br />
0.79<br />
51*. 81<br />
66.29<br />
0.83<br />
66.10<br />
61..81<br />
1.02<br />
60.71<br />
55.28<br />
1.10<br />
62.60<br />
59.28<br />
1.06<br />
73.19<br />
75.70<br />
0.97<br />
Number<br />
Farms<br />
23,551<br />
7,651<br />
15,900<br />
1,1*58<br />
2,308<br />
2,009<br />
1,87*<br />
2,139<br />
1,037<br />
Per<br />
Cent<br />
Tenan<br />
Farms<br />
57.0<br />
67.3<br />
S2.1<br />
65.1<br />
71.3<br />
62.1<br />
69.6<br />
6U.5<br />
33.2<br />
Source: Calculated from Table A-3b.<br />
Small numbers <strong>of</strong> farms were shown by census as "unclassified"<br />
for income. For this reason, the per cents on tine A will lack from<br />
0.00 to 0.76 <strong>of</strong> adding to 100 per cent.<br />
--1S1—<br />
State ....<br />
Engineering<br />
Experiment<br />
Station . . .<br />
<strong>Georgia</strong><br />
Tec*<br />
Industrial . .<br />
. . Economic<br />
Research<br />
Sum<br />
High,<br />
High<br />
;Middle,<br />
Kiddle<br />
8.78<br />
11.15<br />
0-79<br />
12.92<br />
8.26<br />
1.56<br />
6.79<br />
12.55<br />
0.5k<br />
15.70<br />
7.89<br />
1.99<br />
1U.69<br />
7.21*<br />
2.03<br />
10.51<br />
6.82<br />
1.51*<br />
11.30<br />
11.35<br />
0.99<br />
9.60<br />
9-26<br />
0.93<br />
8.97<br />
10.51<br />
0.65
in each set <strong>of</strong> segments, it is possible to determine the seg<br />
ments into which the tenant with the largest farm and the ten<br />
ant with the highest farm income will fall.<br />
For the eight counties In the top sub-group <strong>of</strong> Group A all<br />
tenant farms can be absorbed by the Low and Low-Middle siae-<strong>of</strong>farn<br />
segments in all but two counties. For the two exceptions,<br />
the per cent <strong>of</strong> faras in the Low size-<strong>of</strong>-farm segment is greater<br />
State ....<br />
Engineering<br />
Experiment<br />
Sutitra . . .<br />
<strong>Georgia</strong><br />
redi<br />
Indaetiu] . .<br />
. . Economic<br />
RtfciTcb . .<br />
than the per cent <strong>of</strong> tenants. For the income segments, however, in every<br />
case but one, the tenant per cents were greater than the sum <strong>of</strong> the Low-<br />
Middle and .Low income per cents, so that some tenant farms <strong>of</strong> necessity<br />
must have had farms incomes at the Middle level.<br />
In contrast, the last eight counties in Group C show that, while in<br />
every case but two the per cent <strong>of</strong> tenant farms was less than the sum <strong>of</strong><br />
the Loir-Kiddle and Low size-<strong>of</strong>-farm per cent, in every case the per cent<br />
Summary<br />
and<br />
Counties<br />
c c<br />
3<br />
High<br />
Over<br />
$2500;<br />
Over<br />
380<br />
Acres<br />
Table A-3 - Continued<br />
High<br />
Middle :<br />
$1500-<br />
$2k99;<br />
220-<br />
379<br />
Acres<br />
Panel T£ Cpunties - Continued<br />
Jackson 1 1.62<br />
BRABE 1.39<br />
1.17<br />
White<br />
0.21<br />
0.87<br />
0.2k<br />
Hall<br />
A 1.62<br />
BRAB 0.71<br />
2.28<br />
Habersham<br />
1.88<br />
l.kk<br />
E 1.31<br />
Luarpkin 1 0.36<br />
BRABRABRABRABRABR 1.55<br />
0.23<br />
Stephens<br />
0.90<br />
1.23<br />
0.73<br />
Banks<br />
0.58<br />
0.66<br />
0.88<br />
Union<br />
0.30<br />
0.63<br />
0.36<br />
Towns<br />
0.27<br />
O.Ik<br />
1-93<br />
Dawson —<br />
1.96<br />
—<br />
2.U7<br />
3.15<br />
0.78<br />
0.87<br />
k-33<br />
0.20<br />
2.0k<br />
3.28<br />
0.62<br />
l.kk<br />
3.10<br />
O.k6<br />
1.19<br />
k-87<br />
0.2k<br />
l.i.5<br />
2.1*6<br />
0.59<br />
o.Si<br />
3.06<br />
0.17<br />
0.83<br />
2.kl<br />
0.3k<br />
0.27<br />
0.9k<br />
0.29<br />
0.33<br />
7.k9<br />
0.0k<br />
—182—<br />
Middle:<br />
$1000-<br />
$lk99;<br />
IkO-<br />
219<br />
Acres<br />
5.53<br />
7.92<br />
0.70<br />
5-95<br />
8.66<br />
0.6<br />
5-k9<br />
9-27<br />
0.59<br />
2.81<br />
6.35<br />
O.kk<br />
3.92<br />
10.9k<br />
0.36<br />
2.68<br />
7-37<br />
0.36<br />
2.92<br />
11.2k<br />
0.26<br />
2.k2<br />
9-7k<br />
0.25<br />
0.81<br />
k.32<br />
0.19<br />
2.12<br />
lk.98<br />
O.Ik<br />
Low<br />
Middle:<br />
$600-<br />
$999;<br />
70- "<br />
139<br />
Acres<br />
2k.56<br />
28.39<br />
0.87<br />
23-38<br />
22.83<br />
1.02<br />
21.33<br />
28-kO<br />
0.75<br />
13-93<br />
22.01<br />
0.63<br />
16.29<br />
33-06<br />
O.k9<br />
13-kl<br />
3l.8k<br />
O.k2<br />
19-05<br />
38.76<br />
O.k9<br />
15-09<br />
26.3k<br />
0.57<br />
5-kO<br />
20.78<br />
0.26<br />
11.56<br />
33-39<br />
0.35<br />
Low<br />
Under<br />
$600;<br />
Dnder<br />
70<br />
Acres Number<br />
Farms<br />
65.59<br />
59-15<br />
1.11<br />
69-59<br />
63-31<br />
1.10<br />
69-27<br />
58.3k<br />
1-19<br />
79-51<br />
67.10<br />
1.18<br />
78.12<br />
k9-58<br />
1.58<br />
8l.k5<br />
57-10<br />
l-k3<br />
76. 9k<br />
k6.28<br />
1.66<br />
80.60<br />
60.68<br />
1.33<br />
93-25<br />
73-82<br />
1.26<br />
85.83<br />
k2.l8<br />
2.03<br />
2,223<br />
92k<br />
2,k05<br />
1,386<br />
8kl<br />
895<br />
1,370<br />
1,325<br />
7kl<br />
611;<br />
Sun<br />
Per .High,<br />
Cent High<br />
Tenant Middle,<br />
Farms Middle<br />
66.1<br />
36-7<br />
56.2<br />
k5-2<br />
k5.22<br />
5k-5<br />
6k-2<br />
32-9<br />
3k. 3<br />
55-k<br />
9.62<br />
12.k6<br />
0.77<br />
7.03<br />
13.86<br />
0.51<br />
9.15<br />
13.26<br />
0.69<br />
6.13<br />
10.89<br />
0.56<br />
5.k7<br />
17-36<br />
0.31<br />
5.C3<br />
11.06<br />
o.k5<br />
k.Ol<br />
lk.96<br />
0.27<br />
3.55<br />
12.98<br />
0.27<br />
1.35<br />
5.kO<br />
0.25<br />
2.k5<br />
2k. h3<br />
0.10
Surmsary<br />
and<br />
Counties<br />
Table A-3b<br />
Number <strong>of</strong> Farms for 1939 in the Northeast <strong>Georgia</strong> Area<br />
Distributed~ly the Flve"lncome and Size-<strong>of</strong>-Farm<br />
Segments by Panels and Counties Tilth<br />
Comparisons Tilth <strong>Georgia</strong><br />
(Farms in the income groups are shown in Line A<br />
Those in the size groups are shown in Line B.)<br />
Area Total. .... .A<br />
B<br />
Panel I ...... .A<br />
B<br />
Panel II. ..... .A<br />
B<br />
Panel I Counties<br />
Barr-ow. ...... .A<br />
B<br />
Hart. ....... .A<br />
B<br />
Panel II Counties<br />
3<br />
Panel I ...... .A<br />
B<br />
Panel II. ..... .A<br />
B<br />
B<br />
B<br />
B<br />
3<br />
B<br />
Highs<br />
Over<br />
$2500;<br />
Over<br />
330<br />
Acres<br />
230»<br />
192<br />
77*<br />
ho<br />
153*<br />
152<br />
20*<br />
14<br />
26<br />
9<br />
9*<br />
7<br />
22*<br />
20<br />
13*<br />
• 8<br />
12*<br />
11<br />
36*<br />
31<br />
6,727*<br />
8,216<br />
3, 3814*<br />
3,668<br />
2,81(3*<br />
li,51*8<br />
High<br />
Middle-.<br />
$1500-<br />
$2l»99j<br />
220-<br />
379<br />
Acres<br />
l»51i*<br />
609<br />
211<br />
121<br />
2l»3*<br />
Ii88<br />
k2<br />
25<br />
78<br />
29<br />
63<br />
29<br />
28<br />
38<br />
39<br />
ItO<br />
27<br />
26<br />
55<br />
70<br />
10,595<br />
11,967<br />
6,862<br />
5,132<br />
3,733*<br />
6,335<br />
Middle:<br />
$1000-<br />
$11*99 ;<br />
lltO-<br />
219<br />
Acres<br />
1,333<br />
1,825<br />
700<br />
1471<br />
683<br />
1.35J*<br />
I61i<br />
86<br />
235<br />
129<br />
139<br />
101<br />
162<br />
155<br />
132<br />
150<br />
5k<br />
72<br />
123<br />
176<br />
21,1438<br />
23,262<br />
13,320<br />
8,598<br />
8,113<br />
11,6614<br />
Low<br />
jaddle:<br />
$600-<br />
$999;<br />
70-<br />
139<br />
Acres<br />
5,261<br />
6,650<br />
2,16U<br />
2,202<br />
3,097<br />
li,Wj8<br />
Itfli<br />
395<br />
703<br />
611<br />
1468<br />
570<br />
519<br />
626<br />
616<br />
673<br />
1814<br />
Hi3<br />
5U6<br />
631<br />
51,599<br />
57,276<br />
25,988<br />
23,383<br />
25,611<br />
33,393<br />
Low:<br />
Under<br />
$599;<br />
Under<br />
70<br />
Acres<br />
16,178<br />
111, 275<br />
1*,U85<br />
It,3l7<br />
11,693<br />
9,1458<br />
753<br />
9W<br />
1,265<br />
1,530<br />
1,323<br />
1,302<br />
1,139<br />
1,037<br />
1,339<br />
1,268<br />
759<br />
735<br />
1,158<br />
•1,315<br />
125,052<br />
115,312<br />
U.,533<br />
51,159<br />
83.U69<br />
61i,l53<br />
State ....<br />
Eo gin tiring<br />
Experiment<br />
Station . . .<br />
Gforoia<br />
TtA<br />
Industrial . .<br />
. . Economic<br />
Research . .<br />
Total<br />
Number<br />
<strong>of</strong><br />
Farms<br />
23,551<br />
7,651<br />
15,900<br />
l,«8<br />
2,308<br />
2,009<br />
1,376<br />
2,139<br />
1,037<br />
2,223<br />
216,033<br />
91,9140<br />
12)4,093<br />
Sources U. S. Census, Agriculture, <strong>Georgia</strong>, 19UO, First Series, Table<br />
1 and Third Series, Table. 18.<br />
*In most cases where figures were omitted by the census because "less<br />
than three farms reported," it has been possible to determine whether the<br />
missing figure for a county was 1 or 2. Where this could not be done, 1<br />
was added to more nearly balance the table.<br />
'•Small numbers <strong>of</strong> farms were shown by census as "unclassified" for<br />
income. For this reason, the figures on Line A will lack from 0 to 10<br />
<strong>of</strong> adding to the total number <strong>of</strong> farms in the county.<br />
—183—
<strong>of</strong> tanas in the Law income segment was greater than the per cent<br />
<strong>of</strong> tenant farms, so that all the tenants on fauns in the Low-<br />
Kiddle size-<strong>of</strong>-farn segment (and those in one county where some<br />
tenant fauns must have been in the Middle slze-<strong>of</strong>-fam segment)<br />
could have produced incooes at the Low level.<br />
Table A-55 presents data from Groups A and C on which the<br />
foregoing coitnent is based.<br />
Northeast <strong>Georgia</strong> Area<br />
SUM . ...<br />
Experiment<br />
Stzrion . . .<br />
Groroia<br />
Tec*<br />
lAdutriul . .<br />
. . Economic<br />
Rocarch . .<br />
The evaluation <strong>of</strong> the farm income pattern for Northeast <strong>Georgia</strong> is com<br />
plicated by an unusual condition resulting from the popularity <strong>of</strong> the North<br />
<strong>Georgia</strong> hills as a place <strong>of</strong> residence. For the Area as a whole, ltl*.72 per<br />
cent <strong>of</strong> all farms are classified as Subsistence fams* In Habun, Wiite,<br />
Lunpldn, Stephens, Union, and Towns counties, more than three-fourths <strong>of</strong><br />
the farms are Subsistence farms, and Habersham and Dawsor. have Subsistence<br />
farm percentages just below this figure.<br />
Some <strong>of</strong> these Subsistence farms are occupied by tenants, as is in<br />
dicated by the fact that the per cent <strong>of</strong> tenant-operated farms was greater<br />
than the per cent <strong>of</strong> an non-subsistence farms.<br />
while it is not possible to segregate the Subsistence or the tenant<br />
groups for other figures in the 1939 census, it appears probable that for<br />
the high-subsistence counties: (1) most, but not all, <strong>of</strong> the Subsistence<br />
s See pages 212 to 217 for more detailed discussion <strong>of</strong> Subsistence<br />
farms.<br />
Counties<br />
Unite. ....... A<br />
B<br />
Hall ........ A<br />
B<br />
B<br />
Banks. ....... A<br />
B<br />
B<br />
B<br />
B<br />
B<br />
B<br />
Table<br />
High:<br />
Over<br />
*2500;<br />
Over<br />
380<br />
Acres<br />
2*<br />
8<br />
"3Q*.<br />
17<br />
26*<br />
20<br />
3*<br />
13<br />
Oj.<br />
11<br />
6*<br />
9<br />
It*<br />
11<br />
2*<br />
1<br />
12<br />
—184—<br />
A-3b - C/ontinued<br />
High<br />
Middle:<br />
$1500-<br />
*2l»99;<br />
220-<br />
379<br />
Acres<br />
ho<br />
1*9<br />
79<br />
20<br />
1*3<br />
10<br />
1*1<br />
13<br />
22<br />
7<br />
1*2<br />
11<br />
32<br />
2*<br />
7<br />
2*<br />
I»6<br />
Itiddle:<br />
$1000-<br />
*H*99;<br />
11*0-<br />
219<br />
Acres<br />
55<br />
80<br />
132<br />
223<br />
39<br />
88<br />
33 92<br />
21*<br />
66<br />
ho<br />
151*<br />
32<br />
129<br />
6<br />
32<br />
13<br />
92<br />
Low<br />
Kiddle:<br />
$600-<br />
*999s<br />
70-<br />
139<br />
Acres<br />
n-t£<br />
211<br />
513<br />
683<br />
193<br />
305<br />
137<br />
278<br />
120<br />
285<br />
nf-\<br />
531<br />
31*9<br />
1*0<br />
151*<br />
71<br />
205<br />
Low:<br />
Under<br />
*599;<br />
Under<br />
70<br />
Acres<br />
61*3<br />
585<br />
1,666<br />
1,1
Item<br />
Table A-3c Snt. . . . .<br />
Ejifiaccriaf<br />
Comparison <strong>of</strong> Income-Size Ratios, Income Segment Per InEIT*"1<br />
Cents and Slze-<strong>of</strong>-Farm Segment Per Cents for Gnxfit<br />
Northeast <strong>Georgia</strong> Area by Panels with , . Tl^1,<br />
Those for <strong>Georgia</strong> Segments . . Ecomonk<br />
High:<br />
Over<br />
$2500;<br />
Over<br />
380<br />
Acres<br />
High<br />
Middle:<br />
$1500-<br />
$21*99;<br />
220-<br />
379<br />
Acres<br />
Middle:<br />
$1000-<br />
$11*99}<br />
11*0-<br />
219<br />
Acres<br />
Lotr<br />
Middle:<br />
$600-<br />
$999;<br />
70-<br />
139<br />
Acres<br />
Low:<br />
Under<br />
$599<br />
Under<br />
70<br />
Acres<br />
—<br />
Unclas<br />
sified<br />
Distribution <strong>of</strong> Farms by Income Segments<br />
Panel I<br />
<strong>Georgia</strong><br />
Northeast <strong>Georgia</strong><br />
Difference<br />
Panel II<br />
<strong>Georgia</strong><br />
Northeast <strong>Georgia</strong><br />
Difference<br />
1*.22<br />
1.01<br />
-3.23*<br />
2.29<br />
O.S6<br />
-1.33*<br />
7.1*6<br />
2.76<br />
-U.70*<br />
3.01<br />
1.53<br />
-1-1*8*<br />
U*.l*9<br />
9.15<br />
-5.3KC<br />
6.51*<br />
1*-30<br />
-2-21*<br />
28.27<br />
28.28<br />
+0.01*<br />
20.61;<br />
19.1*8<br />
-1.16*<br />
1*5.23<br />
58.62<br />
+13-39*<br />
67.26<br />
73-51.<br />
+6.28*<br />
0.33<br />
0.18<br />
-0.15<br />
0.26<br />
0.1<br />
-0.07<br />
Distribution <strong>of</strong> Farms by Size-<strong>of</strong>-Farm Segments<br />
Panel I<br />
<strong>Georgia</strong><br />
Northeast <strong>Georgia</strong><br />
Different<br />
Panel II<br />
<strong>Georgia</strong><br />
Northeast <strong>Georgia</strong><br />
Difference<br />
3-99<br />
0.52<br />
-3-1*7*<br />
3.67<br />
0.96<br />
-2.71*<br />
5-58<br />
1.58<br />
-l*.oo*<br />
5.51<br />
3.07<br />
-2.1*1**<br />
9.35<br />
6.16<br />
-3.19*<br />
11.82<br />
8.52<br />
-3.30*<br />
25.1*3<br />
28.73<br />
+3-35*<br />
27.31<br />
27.97<br />
+0.66*<br />
55.65<br />
62.96<br />
+7-31*<br />
51.69<br />
59. U8<br />
*7-79*<br />
Panel I<br />
<strong>Georgia</strong><br />
Northeast <strong>Georgia</strong><br />
Difference<br />
Income-Size Ratios<br />
Panel II<br />
<strong>Georgia</strong><br />
Northeast <strong>Georgia</strong>.<br />
Difference<br />
1.06<br />
1.91*<br />
+Q.38*<br />
0.63<br />
l.oo<br />
tO-37*<br />
1.31*<br />
1.75<br />
to.l*i*<br />
0.55<br />
o.5o<br />
-o.os*<br />
1-55<br />
1.1*9<br />
-O.O^f<br />
0.55<br />
o.So<br />
-0.05*<br />
1.11<br />
0.93<br />
-0.13*<br />
0.76<br />
0.70<br />
-0.06*<br />
0.81<br />
0.93<br />
+0.12*<br />
1.30<br />
1.21*<br />
-0.06*<br />
*This difference is indicative <strong>of</strong> a tendency toward a more pr<strong>of</strong>it<br />
able situation.<br />
*This difference is indicative <strong>of</strong> a tendency toward a less pr<strong>of</strong>it<br />
able situation.<br />
~185--
farms are actually in the Low and Low-middle levels; and (2)<br />
tost <strong>of</strong> the non-subsistence farms are in"the High, High-middle,<br />
and Kiddle levels for size-<strong>of</strong>-farm, and, for the income classi<br />
fication, some will be in Low-middle level.<br />
State ....<br />
Expfrimtat<br />
Station . . .<br />
Obviously, the amount <strong>of</strong> land suitable for purely comnercial<br />
fanning is limited by the roughness <strong>of</strong> terrain in most <strong>of</strong><br />
these counties and by the presence <strong>of</strong> mountains, the Chatta-<br />
Inlutiul . .<br />
Economic<br />
hoochee national Forest, and the numerous power reservoirs. Some <strong>of</strong> these<br />
counties are entirely <strong>of</strong>f the railroad, and it is only recently that there<br />
were ar.y paved roads other than through highways.<br />
Four <strong>of</strong> the seven Panel I counties north <strong>of</strong> the fall line are in the<br />
Northeast <strong>Georgia</strong> Area. Three <strong>of</strong> these four counties are south and east<br />
<strong>of</strong> the Chattahoochee 7alley. The fourth (Forsyth) represented the begin<br />
nings <strong>of</strong> the broilfir industry in the Area, in 1939- In general, it ap<br />
pears that trends in the first, three, Barrow, Hart, and Madison, are<br />
indicative <strong>of</strong> the possibilities <strong>of</strong> intensive farming in the entire section<br />
south <strong>of</strong> the Chattahoochee, including Hall, Jackson, Madison, Franklin,<br />
Banks, and Stephens.<br />
All four <strong>of</strong> the Panel I counties in 1939 fell in Group B, described<br />
on fags 178. Three <strong>of</strong> the twelve Panel II counties, Franklin, Jackson,<br />
and iKhite, also were in Group B. These three are among the top four<br />
counties in Panel II. All the remaining Panel II counties were in Group<br />
C. Ko Group A counties occurred in the Northeast <strong>Georgia</strong> Area.<br />
On the basis <strong>of</strong> the comparisons shown in Table A-3c between the in<br />
come segment, size-<strong>of</strong>-farm segment per cents, and the income-size ratios<br />
for the Northeast <strong>Georgia</strong> Area and for <strong>Georgia</strong>, all but three df the<br />
thirty comparisons are indicative <strong>of</strong> some unfavorable situation. With<br />
out question this is a result <strong>of</strong> the high Subsistence farm ratio and is<br />
not to te regarded as applying unifomly to all counties.<br />
The following paragraphs discuss the 1939 situation in each <strong>of</strong> the<br />
sixteen counties in Northeast <strong>Georgia</strong>*<br />
Panel I Counties<br />
Barrow County; Barrow, one <strong>of</strong> the eight smallest counties in<br />
<strong>Georgia</strong>, was apparently the number one county in the Northeast <strong>Georgia</strong><br />
Area in 1939 fron the viewpoint <strong>of</strong> per-fana income. All <strong>of</strong> the five in<br />
come-size ratios (Table A-3) were above 1.00, except the Low incomesize<br />
ratio, which was less than 1.00. This indicates that, at every<br />
size-<strong>of</strong>-fare level, farms were producing incomes at rates well above ex<br />
pectation, and hence for all levels was favorable.<br />
The combined effect <strong>of</strong> the five ratios indicates that there is a<br />
definite trend for farms in the smaller size segments to product incoines<br />
expected at higher size segments.<br />
On the basis <strong>of</strong> the size-<strong>of</strong>-income segments in the Northeast<br />
<strong>Georgia</strong> Area, Barrow county ranked fourth at the High level, third at<br />
the Kigh-Tiddle and first at the Kiddle level. The income-size ratio<br />
rar-kings for Barrow county in 1939 were: High, first; High-Btiddle, third;<br />
ard 12.ddle, first. While the High segments were not large (1.37 per<br />
cent <strong>of</strong> all farms in Barrow county had income above $2,500, and 0.27<br />
per cent <strong>of</strong> all farms had more than 380 acres <strong>of</strong> land}, most <strong>of</strong> the farms<br />
—136—
producing incomes at the High level were obviously classified<br />
in a smaller size-<strong>of</strong>-farra segment, a very favorable factor. -"" • • • •<br />
This probably reflects a prosperous condition for many <strong>of</strong> the<br />
65.1 per cent <strong>of</strong> all farms operated by tenants.<br />
Barrow county falls in Group B (with Low income segments<br />
between 50 and 70 per cent <strong>of</strong> all farms in <strong>Georgia</strong>) and ranks<br />
fourteenth among the Panel I counties in Group B., In Barrow<br />
EafinMriflf<br />
Experiment<br />
Station . . .<br />
<strong>Georgia</strong><br />
Tnh<br />
Industrial . .<br />
. . Economic<br />
Rcseiich . .<br />
county, 51.65 per cent <strong>of</strong> all farm incomes were under $600. The per cent<br />
<strong>of</strong> all farms operated by tenants (Table A-12) is 65.1. This per cent is<br />
almost identical with the Low size-<strong>of</strong>-farm segment per cent (65.03 per<br />
cent <strong>of</strong> all farms with less than 70 acres <strong>of</strong> land) but exceeds by 13-li5<br />
per cent the 51.65 per cent <strong>of</strong> all farms having incomes <strong>of</strong> $600 or less.<br />
This very definitely means that somewhat more than one out <strong>of</strong> four tenant<br />
farmers in Barrow county must have had a 1939 income above $600.<br />
The per cent <strong>of</strong> farms in the subsistence group was 2U-21—less than<br />
the <strong>Georgia</strong> figure <strong>of</strong> 31.03 per cent, and well below the Area average <strong>of</strong><br />
ljlj.72. Moreover, subsistence fanning is in general more successful in<br />
Barrow county than in other counties in the Area. The average farm income<br />
from Subsistence farms in the Area is $ljOl). In Barrow county the average<br />
is $ii59 (See Table A-lit).<br />
Hart County; From the viewpoint <strong>of</strong> income for the average farm in<br />
each <strong>of</strong> the five income-size levels, Hart county seems to rank next to<br />
Barrow county in the Northeast <strong>Georgia</strong> Area. The High, High-middle,<br />
I'iddle.and Low-middle income-size ratios (Table A-3) were all above 1.00,<br />
while the Low income-size ratio was less than 1.00. This indicates that<br />
at every size-<strong>of</strong>-farm level some faros were producing incomes at rates<br />
v;ell above expectation. The combined effect <strong>of</strong> the five ratios indicates<br />
that there is a definite trend for farms in the smaller size segments to<br />
produce incomes expected at higher size-<strong>of</strong>-farm segments.<br />
On the basis <strong>of</strong> the size-<strong>of</strong>-income segments, Hart, county ranked sixth<br />
ir. the Northeast <strong>Georgia</strong> Area at the High level, first at the High-middle,<br />
and second at the Kiddle level. In 1939, the High income-size ratio for<br />
Hart county ranked second in the Northeast <strong>Georgia</strong> Area, the High-niddle<br />
ratio ranked first in the Area, and the Middle ratio ranked second.<br />
While the High segments were not large (1.13 per cent <strong>of</strong> all farms<br />
in Hart county had incomes above $2,500, and 0.39 per cent <strong>of</strong> all farms<br />
had nore than 380 acres <strong>of</strong> land), the income-size ratio <strong>of</strong> 2.90 seems to<br />
indicate that large farms were more desirable than small farms in Hart<br />
county in 1939, although, obviously, most <strong>of</strong> the farms producing incomes<br />
at the High-middle level were classified in lower size-<strong>of</strong>-farm levels.<br />
Hart county also falls in Group B (Low income segments between 50 and<br />
70 per cent <strong>of</strong> all farms), ranking sixth among the Panel I counties in<br />
<strong>Georgia</strong> with a Low income per cent <strong>of</strong> 514-81. The per cent <strong>of</strong> a!3 farms<br />
operated by tenants (Table A-12) is 71-3. This tenancy per cent is close<br />
to the Low-size-<strong>of</strong>-farm segment per cent (farms with less than 70 acres<br />
<strong>of</strong> land) but exceeds by 16.1i9 per cent the 5U.81 per cent <strong>of</strong> all farms in<br />
the county having incomes cf $600 or less. This points to the fact that<br />
about three out <strong>of</strong> every ten tenant farmers in Hart county must have had<br />
incomes at least above $600 in 1939.<br />
There were 2,308 farms in Hart county in 1939, ranking the county<br />
seventeenth among the 159 counties in <strong>Georgia</strong>. Table A-3 shows an<br />
—187—
income-size ratio for 1939 <strong>of</strong> 1.82 for Hart county at the Middle<br />
level, ranking the county sixteenth in <strong>Georgia</strong> with respect to<br />
this ratio. The same table shows an income-size ratio <strong>of</strong> 0.83<br />
for Hart county at the Low level. It is seen from Table A-3<br />
that, while 66.29 per cent <strong>of</strong> all farms in the county had less<br />
than 70 acres <strong>of</strong> land, only 5U.81 per cent <strong>of</strong> them produced in<br />
comes which were under $600. Thus, 12.1;8 per cent were able to<br />
produce incomes at higher levels. Farms at the Middle size<br />
Suit ....<br />
EififlccriBf<br />
Expcriaunt<br />
Station . . .<br />
Tidt<br />
.<br />
. . Eonoaic<br />
Roczrch . .<br />
level appear to have been the most prosperous in Hart county in 1939. Only<br />
U-33 per cent <strong>of</strong> »n farms in 1939 were Subsistence farms, and the average<br />
income <strong>of</strong> these was |Ubl, above the Area average <strong>of</strong><br />
Forsyth County* Forsyth county in 1939 presented a slightly mixed<br />
picture <strong>of</strong> income and farm size relationships, a condition which perhaps<br />
reflects the beginnings <strong>of</strong> the broiler industry. The High, High-middle,<br />
and Middle segments mi had income-size ratios above 1.00, but the three<br />
segments represented only a total <strong>of</strong> 10.51 per cent <strong>of</strong> the number <strong>of</strong> farm<br />
incomes and 6.82 per cent <strong>of</strong> the number <strong>of</strong> farms in the size-<strong>of</strong>-farm group.<br />
Table A-3 shows an income-size ratio based on 1939 data <strong>of</strong> 1.38 for<br />
Forsyth county at the Middle level, ranking the county thirty-eighth in<br />
<strong>Georgia</strong> with respect to this ratio. The same table shows an income-size<br />
ratio <strong>of</strong> 0.82 for the Low-middle level and <strong>of</strong> 1.02 for the Low level, in<br />
dicating that some condition unfavorable to farm prosperity existed in<br />
Forsyth county in 1939. It is seen from Table A-3 that, while 66.10 per<br />
cent <strong>of</strong> the farms in the county produced incomes which were under $600,<br />
only 6k. 61 per cent <strong>of</strong> them were classified at the Low size-<strong>of</strong>-farm level<br />
(less than 70 acres <strong>of</strong> land). It is evident that farms <strong>of</strong> Low-middle<br />
size were the ones which produced incomes at other levels. Farms <strong>of</strong><br />
Middle size were probably the most prosperous ones in the county in 1939-<br />
There were 2,009 farms in Forsyth county in 1939, ranking the county<br />
twenty-eighth among the 159 counties in <strong>Georgia</strong>. Subsistence farms were<br />
28.67 per cent. While Forsyth county ranks third in the Panel I counties<br />
in the Area, Subsistence farming is on a relatively low scale as is indi<br />
cated by the fact that the average income <strong>of</strong> $k02 from Subsistence farms<br />
is below the Area average <strong>of</strong> IhQh- Forsyth county fell in twelfth place<br />
for Panel I, Group B, for the state.<br />
Madison County; The picture <strong>of</strong> farm prosperity in Madison county in<br />
1939 was only average. There was a slightly favorable excess <strong>of</strong> farms with<br />
incomes at the High level over farms in the High size-<strong>of</strong>-farm segment and a<br />
similar excess at the Middle level. However, the sum <strong>of</strong> the per cents <strong>of</strong><br />
the Eigh, High-middle, and Middle segments for farm income (11.30 per cent)<br />
and for size-<strong>of</strong>-farm. (11.35 per cent) practically balance. At the Lowmiddle<br />
and Low levels, U-30 per cent <strong>of</strong> the farms <strong>of</strong> Low-middle size had<br />
incomes at the Low level.<br />
Table A-3 shows an income-size ratio, based on 1939 data, <strong>of</strong> 1.05 for<br />
Madison county at the Middle level, ranking the county sixty-first in<br />
<strong>Georgia</strong> with respect to this ratio. The sane table shows an income-size<br />
ratio <strong>of</strong> 1.10 for the county at the Low level, indicating that some con<br />
dition unfavorable to farm prosperity existed in Madison county in 1939.<br />
It is seen from Table A-3 that 55.28 per cent <strong>of</strong> all the farms in the<br />
county had less than 70 acres <strong>of</strong> land, whereas 60.71 per cent <strong>of</strong> them<br />
produced incomes which were under $600. This means that 5-lt3 per cent <strong>of</strong><br />
all the farms in the county which were classified at size-<strong>of</strong>-farm levels<br />
higher than the Low level failed to produce incomes at the expected<br />
levels. Examination <strong>of</strong> the figures for the High, High-middle, and Middle<br />
—183—
levels indicated that farms at the High-middle and Low-middle<br />
size levels were the ones which failed in 1939 to produce in<br />
comes comparable to their size. There were 1,876 farms in<br />
Madison county in 1939, ranking the county thirty-sixth among<br />
the 159 counties in <strong>Georgia</strong>.<br />
The Subsistence farm per cent was 27.67, below the figure<br />
for <strong>Georgia</strong>. The average income <strong>of</strong> Subsistence farms in Madison<br />
county ($507) is the highest in the Area. Madison county in 1939 was<br />
eighth in <strong>Georgia</strong> for Panel I, Group B.<br />
Panel II Counties<br />
Franklin County; Franklin county, as a Panel II county, should have<br />
had higher per cents in the High, High-middle, and Kiddle size-<strong>of</strong>-farm seg<br />
ments than occur in Panel I. This, however, is not the case. Like the<br />
other Panel II counties in Northeast <strong>Georgia</strong>, Franklin county has less than<br />
ten per cent <strong>of</strong> its farms in the three top segments, either on the basis<br />
<strong>of</strong> the size-<strong>of</strong>-farm or the size-<strong>of</strong>-income distribution. Increases in the<br />
sizes <strong>of</strong> farms which in 1939 were either Low-middle or Low, to bring them<br />
into the High-middle and Middle levels, appear desirable. Such increases<br />
in the size <strong>of</strong> farms would provide the basis for establishing pastures<br />
and growing feed crops necessary for pr<strong>of</strong>itable livestock operations.<br />
Table A-3 shows an income-size ratio <strong>of</strong> 1.06 for Franklin county at<br />
the Low level; 59.28 per cent <strong>of</strong> all the farms in Franklin county had less<br />
than 70 acres <strong>of</strong> land and 62.60 per cent cf them produced incomes under<br />
$600. Examination <strong>of</strong> the figures indicates that some farms at the Highmiddle,<br />
Middle, and Low-middle levels failed to produce incomes at the<br />
expected rate in 1939. It is probable that most <strong>of</strong> the farms at the Mid<br />
dle and Low-niddle size levels produced incomes <strong>of</strong> Low level (under $600)<br />
and that many <strong>of</strong> the farms <strong>of</strong> Middle size which did not produce incomes<br />
at the Middle level were able to produce incomes at the High level. Since<br />
the shift <strong>of</strong> incomes was definitely toward the Low level, it appears that<br />
some factor in 1939 affected agriculture adversely in Franklin county.<br />
There were 2,139 farms in Franklin county in 1939, ranking the county<br />
twenty-third among the 159 counties in <strong>Georgia</strong>.<br />
The Subsistence farm per cent was 20.29, below the <strong>Georgia</strong> figure <strong>of</strong><br />
31.03 for 1939, and well below the Area average <strong>of</strong> Ui.72 per cent. Frank<br />
lin county ranks third in the Area with $U5l in average value <strong>of</strong> products<br />
on Subsistence farms. Franklin county ranked forty-first in Panel H,<br />
Group B for <strong>Georgia</strong>.<br />
Rabun County; Rabun county is one <strong>of</strong> fouri Northeast <strong>Georgia</strong><br />
counties in which" the per cent <strong>of</strong> Subsistence farms exceeds the per cent<br />
for Low income farms shown in Table A-3. For Rabun county, this Sub<br />
sistence farm per cent was 88.91, while only 73-19 per cent was shown<br />
for low incomes in 1939. The amount <strong>of</strong> usable land is somewhat limited<br />
and the scenery is attractive to those who might wish to retire and<br />
"live on a farm."<br />
The status <strong>of</strong> the remaining 11.09 per cent <strong>of</strong> "all farms which may be<br />
regarded as "commercial 11 , i.e.,operated with the objective <strong>of</strong> pr<strong>of</strong>it, is<br />
indicated by the income-size ratios for the High, High-middle, Middle,<br />
*The four counties are Rabun, Towns, Dnion, and Khite. For the<br />
state a fifth county, Gilmer, has more Subsistence than Low-income farms.<br />
—189—
and partly by the Low-middle levels. The income-size ratios <strong>of</strong><br />
1.09 for the High level and <strong>of</strong> l.OU for the High-middle level<br />
are indicative <strong>of</strong> favorable conditions for a few large operators,<br />
probably using slightly less land than usual, while the incomesize<br />
ratio <strong>of</strong> 0.75 for the Kiddle level and <strong>of</strong> 1.29 for the Lowciddle<br />
level reflects some condition on Middle and Low-middle<br />
size farms (perhaps lack <strong>of</strong> markets) which adversely affects<br />
There were 1,037 farms in Rabun county in 1939, ranking the county<br />
ninety-fourth among the 159 counties in <strong>Georgia</strong>. Rabun county ranked<br />
sixth in <strong>Georgia</strong> for Panel n, Group C counties in which the Low segment<br />
income per cents were above 70 per cent. In 1939, one-third <strong>of</strong> all the<br />
fanes in Rabun county were tenant farms. Since 88. 91 per cent <strong>of</strong> all<br />
fares are Subsistence fares, a ninimum <strong>of</strong> 22.11 per cent (or two-thirds<br />
<strong>of</strong> the 33.1 per cent classified as tenants) are also Subsistence farms.<br />
Hence i". is reasonable to suppose that nest <strong>of</strong> the tenant and Subsistence<br />
fares ir. Rabun county produced incomes at the Low level. Rabun county<br />
ranked fourth in average value <strong>of</strong> products on Subsistence farras, with<br />
|id(2. It ranked sixth .in Panel II, Group C counties for <strong>Georgia</strong>.<br />
Jackson County: The 65-59 per cent <strong>of</strong> all farm incones in Jackson<br />
county in 1939 under $600 puts this county in Group B. All income-size<br />
ratios are below unity except for the High and Low segments; this does<br />
not indicate a healthy farm economy- The figures in Table A-3 seem to<br />
indicate that about one out <strong>of</strong> every ten farm incomes <strong>of</strong> less than $600<br />
(Low segment) were produced on farms for the High-middle, Biddle, and<br />
Low-aiddie size-<strong>of</strong>-farc segments. Tenants operate 66.1 per cent <strong>of</strong> all<br />
farms, a figure which is slightly larger than the 65-59 per cent <strong>of</strong> all<br />
farss with incones below $600; this indicates that some tenants must<br />
have incomes above $600.<br />
There were 2,223 farns in Jackson county in 1939, ranking the county<br />
twenty-first among the 159 counties in <strong>Georgia</strong>. The per cent <strong>of</strong> all farms<br />
in the subsistence group in 1939 was 27.98; and the average income <strong>of</strong><br />
Subsistence farms in the county ($1»35) is well above the Area average <strong>of</strong><br />
$uOlj. Jackson county ranked fifteenth in Panel II, Group B counties for<br />
<strong>Georgia</strong>.<br />
White County: The data in Table A-3 reflect a series <strong>of</strong> peculiar<br />
ities for Dhite county. Only 7.03 per cent <strong>of</strong> all farms are in the<br />
three top levels on the basis <strong>of</strong> income and only 13.86 per cent on the<br />
basis <strong>of</strong> size-<strong>of</strong>-fara. This results in very small incoine-size ratios<br />
for the High, High-middle, and Middle levels. The large per cent, 77.16<br />
<strong>of</strong> all farms in the Subsistence group is a major factor in this, since<br />
not all <strong>of</strong> them can fall in either the Low income or size-<strong>of</strong>-farm levels.<br />
It seems probable that some Subsistence farms with incomes in Low-middle<br />
level ($600 to $999) are <strong>of</strong> Kiddle or High-middle size. The average<br />
value <strong>of</strong> products on Subsistence farms in TJhite county was $k21. The<br />
Low-ciddle segment appears to have been the one in 1939 in which a norieal<br />
income situation was most likely. Tenants operated only 36.7 per<br />
cent <strong>of</strong> all farns, hence it is possible that practically all tenants<br />
produced incomes under $600 since the Low income segment per cent is<br />
aljcost twice the per cent <strong>of</strong> tenants. This, however, may not be so un<br />
less nearly all tenants were also on Subsistence farms. There were 92k<br />
fares in White county in 1939, ranking the county 113th among the 159<br />
counties in <strong>Georgia</strong>. White county ranked forty-second in Panel II,<br />
Group B counties for <strong>Georgia</strong>.<br />
--190--
Hall County; The Income-size ratios and segment per cents<br />
for Hall county present a very mixed picture. The only favor<br />
able income-size ratio, 2.28, is that for the High level, which<br />
very probably reflects the operations <strong>of</strong> dairies serving Gainesville.<br />
The High segment per cents, however, were small in 1939,<br />
as were the High-niddle and Kiddle segments, reflecting the<br />
69.27 per cent <strong>of</strong> all farms which had 1939 incomes <strong>of</strong> less than<br />
$600 (Low level).<br />
State ....<br />
Engineering<br />
Experiment<br />
Sution . . .<br />
Cnrgia<br />
Tfth<br />
Industrial . .<br />
. . Economic<br />
Research . .<br />
There were 2,li05 farms in Hall county in 1939, ranking the county thir<br />
teenth among the 159-counties in <strong>Georgia</strong>. Table A-3, based on 1939 data,<br />
shows an income-size ratio <strong>of</strong> 0.59 for Hall county at the Middle level,<br />
ranking the county lOlith in <strong>Georgia</strong> with respect to this ratio. The sane<br />
table shows an income-size ratio, based on 1939 data, <strong>of</strong> 1.19 for Hall<br />
county at the Low level, indicating that some condition unfavorable to<br />
farm prosperity existed in Hall county in 1939- It may be seen from Table<br />
A-3 that 58.3J» per cent <strong>of</strong> all farms in the county had less than 70 acres<br />
<strong>of</strong> land but that 69.27 per cent <strong>of</strong> them produced incomes under $600. It<br />
is also evident, from examination <strong>of</strong> the corresponding figures for higher<br />
levels, that some farms classified at the High-middle, Middle, and Lowidddle<br />
levels failed to produce incomes at the expected levels. There<br />
was a slightly higher percentage <strong>of</strong> farms classified at the High income<br />
level than at the High size-<strong>of</strong>-farm level. The difference is 0.91 per<br />
cent <strong>of</strong> all farms in the county. Apparently some farms <strong>of</strong> High-middle,<br />
Kiddle, and possibly even <strong>of</strong> Low-middle size were able to produce in<br />
comes at the High level.<br />
The tenancy per cent <strong>of</strong> 56.2 produces a complication when considered<br />
with the Subsistence per cent <strong>of</strong> bO.W, since both will not fit into the<br />
Low income per cent <strong>of</strong> 69.27. Many people living on Subsistence farms<br />
are obviously industrial workers and others employed in Gainesvil]e, but<br />
it is apparent that some farms are in both the Subsistence and the Tenant<br />
groups, that some tenant farms and some Subsistence farms have incomes<br />
which are above $600, and that some <strong>of</strong> each group are very likely above<br />
70 acres in size.<br />
The average value <strong>of</strong> products on Subsistence farns is $389, below the<br />
Area average. Hall county ranked sixteenth in Panel II, Group B counties<br />
for <strong>Georgia</strong>.<br />
Habersham County; The 79-51 per cent <strong>of</strong> Habersham county farms<br />
which in 1939 had incomes <strong>of</strong> less than $600 puts the county in Group C,<br />
with a Panel II rank in the group <strong>of</strong> seventh for the state. On the Kid<br />
dle income-size ratio, Habersham county ranks 127th, with O.Wi. The<br />
1.88 per cent <strong>of</strong> all farm incomes (Table A-3) with l.Wi per cent in the<br />
size-<strong>of</strong>-farm segment produced a High level income-size ratio <strong>of</strong> 1.31.<br />
All other income-size ratios were unfavorable and indicative <strong>of</strong> some farm<br />
problem. , It is very probable that the rugged character <strong>of</strong> the land re<br />
sults in the inclusion <strong>of</strong> much actually unusable land in the reported<br />
size-<strong>of</strong>-farm. The Subsistence farm group was 72.58 per cent <strong>of</strong> all farms.<br />
The per cent <strong>of</strong> farms operated by tenants in 1939 was lt£.2, so that all<br />
tenant incomes could have been included in the 79.51 per cent <strong>of</strong> farms<br />
with incomes under $600 (Low), but again, if this were the case, they<br />
would probably have been mostly on a subsistence basis. More probably,<br />
the tenants were scattered over all levels.<br />
It may be seen from Table A-3 that, while 79.51 per cent <strong>of</strong> all the<br />
farms in Habersham county produced incomes under $600, only 67.10 per cent<br />
--191--
<strong>of</strong> them had less than 70 acres <strong>of</strong> land. It is obvious from a<br />
comparison <strong>of</strong> the corresponding figures for the higher levels<br />
that some <strong>of</strong> the farms at the High-middle, Kiddle, and Lowmiddle<br />
size levels failed to produce incomes at the expected<br />
levels. Apparently, some <strong>of</strong> the farms at these levels were able<br />
to produce incomes at the High level, while the greater part <strong>of</strong><br />
them produced incomes at the Low level. The average income from<br />
Subsistence farms in Habersham county was only $381i.<br />
There were 1,386 farms in Habersham county in 1939j ranking the county<br />
sixty-first among the 159 counties in <strong>Georgia</strong>. Habersham county ranked<br />
ninth it Panel H, Group C counties in <strong>Georgia</strong>.<br />
Lumpkin County; Lumpkin county is another in which a large proportion,<br />
72.58 per cent, <strong>of</strong> all farms are Subsistence farms, and the average value<br />
<strong>of</strong> products on Subsistence farms was only $383. These facts and the i»5-22<br />
per cent <strong>of</strong> farms operated by tenants are factors in the low per cents in<br />
the three top levels, which contain only 5-1*7 per cent <strong>of</strong> all farm incomes<br />
and 17.36 per cent <strong>of</strong> all farms classified on the basis <strong>of</strong> size.<br />
All <strong>of</strong> the income-size ratios are below unity except in the Low level,<br />
a clear indication that farming opportunities are somewhat limited. Only<br />
individuals with a well-thought-out plan are likely to achieve success.<br />
Lumpkin county ranked thirtieth in Panel II, Group C counties for <strong>Georgia</strong>.<br />
In 1939, there were only 8iil farms in Lumpkin county. One limiting<br />
factor in increased farming is the mountainous character <strong>of</strong> the land and<br />
the large proportion <strong>of</strong> land in forests, most <strong>of</strong> which are in the Chattahoochee<br />
National Forest.<br />
Stephens County; Just over half (53-63 per cent) <strong>of</strong> the farmers in<br />
Stephens county were subsistence" farmers. Tenant fanners were an almost<br />
equal group, 51*-5 per cent. It seems more probable that in this case both<br />
subsistence and tenant groups are very largely in the Low income level,<br />
which includes 81.1(5 per cent <strong>of</strong> all farms, and are divided between the<br />
Low (57.10 per cent) and Low-middle size-<strong>of</strong>-farm levels. A noticeable<br />
proportion <strong>of</strong> tenants are probably also in the subsistence group. This is<br />
not statistically demonstrable except to the extent that a nriTHimim <strong>of</strong> 8.13<br />
per cent <strong>of</strong> farms must be in both groups. This appears to suggest that in<br />
1939 some problem affected the prosperity <strong>of</strong> the tenant group. The aver<br />
age value <strong>of</strong> products on Subsistence farms is only (383- Stephens county<br />
ranked twenty-third among Panel H, Group C counties for <strong>Georgia</strong>.<br />
Banks County; The general situation in Banks county appears similar<br />
tc that in Stephens, although a little more unfavorable. Tenants operated<br />
6U.2 per cent <strong>of</strong> the farms. The census classified 58.54 per cent as Sub<br />
sistence farms. The probability appears that there is a very considerable<br />
overlap between these two groups and that most <strong>of</strong> both are included in the<br />
71.9U per cent <strong>of</strong> »n farms with incomes in the Low level. Of necessity,<br />
both the tenant group and the subsistence group must include most <strong>of</strong> the<br />
farms in two size-<strong>of</strong>-farm levels, the Low size group <strong>of</strong> 1*6.28 per cent and<br />
the Low-niddle size group <strong>of</strong> 38-76 per cent which total 85-0'* per cent.<br />
All o" this is highly indicative that, in 1939, some serious problem af<br />
fected the tenant group.<br />
All the income-size ratios are below 0.50 except the High and Low<br />
levels. Neither the High level ratio <strong>of</strong> 0.88, nor the Low level value <strong>of</strong><br />
1.66 can be regarded as reflecting favorable farming conditions. Banks<br />
--192--
county ranked twenty-fourth among Panel H, Group C counties for<br />
<strong>Georgia</strong>.<br />
Union County; There were 1,325 farms in Union county in<br />
1939-oT~this total, 92.30 were Subsistence and only 32. per<br />
cent were tenants. This definitely suggests that most <strong>of</strong> the<br />
farms are not really farms in the true sense, but represent<br />
only the subsistence idea. This is perhaps natural, since Union<br />
county, while one <strong>of</strong> the older counties, has been relatively more isolated<br />
since railroads have been built in other parts <strong>of</strong> the area. This former<br />
necessity for self-sufficiency is reflected in the fact that, in <strong>Georgia</strong>,<br />
only in Union and three adjoining counties does the per cent <strong>of</strong> Subsistence<br />
farms exceed the per cent for the Low income level.<br />
The economic condition <strong>of</strong> the 7.70 per cent <strong>of</strong> all farms which are nonsubsistence<br />
is then generally indicated by the income-size ratios for the<br />
thrse top levels—all <strong>of</strong> which for 1939 were extremely low and, as a re<br />
sult, indicative <strong>of</strong> possible difficulties. The average income from Sub<br />
sistence farms in Union county ($li!2) is above the area average <strong>of</strong> $ltOli.<br />
Union county ranked twenty-eighth among Panel II, Group C counties for<br />
<strong>Georgia</strong>.<br />
Towns County; Towns county is another <strong>of</strong> the four counties in North<br />
east <strong>Georgia</strong> in which the Subsistence farms (95.82 per cent <strong>of</strong> all farms)<br />
exceed the Low income farms (93.5 per cent). Only 3U.3 per cent <strong>of</strong> the<br />
7ljl farms in the county are tenant farms. Host <strong>of</strong> these, however, must<br />
obviously be Subsistence farms. The overlap between the tenant farms and<br />
the Subsistence farms in 1939 must have been at least 30.12 per cent <strong>of</strong><br />
all farms.<br />
The small number <strong>of</strong> farms included in the 7*18 per cent which are<br />
non-subsistence are apparently included in the High, High-middle, Middle,<br />
and about half <strong>of</strong> the Low-middle levels. The segment per cents for the<br />
top three and the income-size ratios for all four describe their economic<br />
position in 1939. Only the High level income-size ratio <strong>of</strong> 1.93 gives an<br />
indication that favorable conditions existed. Apparently, some <strong>of</strong> the<br />
farms in the two top size-<strong>of</strong>-farm levels (High and High-middle) have in<br />
comes smaller than should have been expected. This interpretation, how<br />
ever, is limited by the small number <strong>of</strong> farms in the non-subsistence<br />
classification. The average income from Subsistence farms in Towns county<br />
($286) is the lowest in the Area. Towns county ranked twentieth among<br />
Panel H, Group C counties for <strong>Georgia</strong>.<br />
Pawson County; While the Subsistence farm group in Batrson county in<br />
1939 was 73.62 per cent <strong>of</strong> all farms, the Low income group (Table A-3) was<br />
larger, 85.83 per cent. The tenant farm per cent was 55.1* per cent. Ho<br />
farm incomes above $2,U99 were shown in Table A-3. All the income-size<br />
ratios were extremely low except for the Low level, which was high so that<br />
all represented unfavorable conditions. Dawson county has an average value<br />
<strong>of</strong> $3Ui <strong>of</strong> products on Subsistence farms, next to the lowest in the Area.<br />
Dawsou county ranked thirty-ninth in Panel n, Group C, for <strong>Georgia</strong>.<br />
—193—
Agricultural Characteristics<br />
Tne farm income discussion in the preceding section on<br />
County Income Classification was based primarily on the relation<br />
ships between incor.e-size groups and size-<strong>of</strong>-farra groups. In<br />
this section, devoted to the Agricultural Characteristics <strong>of</strong> the<br />
Kortheast <strong>Georgia</strong> Area, incone is approached in the nore conven<br />
tional framework <strong>of</strong> simple averages, crops, type <strong>of</strong> farm, and<br />
srrdlar criteria.<br />
Sutc ....<br />
Engineering<br />
Experiment<br />
Surioa . . .<br />
GrorOM<br />
Tteh<br />
IndoBtrul . .<br />
. . Economic<br />
Research . .<br />
r^ Ir.ceae; The total value <strong>of</strong> all farm products sold, traded, and<br />
consumed in Ilortheast <strong>Georgia</strong> for 1939 was $13,223,225. The average farm<br />
income <strong>of</strong> the 23,551 farms for the same year was $561 (see Table A-15),<br />
$207 less than the 8768 average for all farms in <strong>Georgia</strong>. The relatively<br />
low income <strong>of</strong> farns in the Northeast <strong>Georgia</strong> Area is due in large part to<br />
the predominance <strong>of</strong> Subsistence farns. A comparison <strong>of</strong> Tables A-6l and<br />
A-15 indicates that in counties where the number <strong>of</strong> Subsistence farms was<br />
highest, farn incoces tended to be lowest. A Subsistence farm is defined<br />
as one on which fare products used by the fans household are more than half<br />
the total fara income, and ordinarily have little effect on the pattern <strong>of</strong><br />
an area. However, in Northeast <strong>Georgia</strong>, since Subsistence faros comprise<br />
Wi.72 per cent <strong>of</strong> the nuaber <strong>of</strong> farns in the Area, they become an important<br />
factor in interpreting the farm picture. The Subsistence farms with an<br />
average ir.con-.e <strong>of</strong> $UOli contribute only 32.2 per cent <strong>of</strong> the total farm inccce<br />
(Table A-Sa). For seven counties, 70 per cent or more <strong>of</strong> all 'farms<br />
are Subsistence farns.<br />
Kost <strong>of</strong> the fane income <strong>of</strong> the Area<br />
Table A-8a<br />
Per Cent <strong>of</strong> Faros by Types for Number<br />
and Inccna with i.'uaber-Incone Ratios<br />
for northeast <strong>Georgia</strong> Area<br />
Type <strong>of</strong> Fara<br />
Dairy<br />
Horticultural<br />
Specialty<br />
Forest Products<br />
Livestock1<br />
Poultry<br />
Fruits and Nuts<br />
Vegetables<br />
Field Crops<br />
Subsistence<br />
Not Classified<br />
Total<br />
Per Cent<br />
<strong>of</strong> Area Total<br />
Number<br />
»f<br />
Farms<br />
O.ljD<br />
0.03<br />
0.31<br />
0.37<br />
1.29<br />
0.32<br />
O.T5<br />
51.59<br />
Ui.72<br />
0.61<br />
100.00<br />
Farm<br />
Income<br />
2.11<br />
O.Oij<br />
O.US<br />
0.58<br />
3.63<br />
2.72<br />
0.61<br />
57.13<br />
32.20<br />
0.53<br />
100.00<br />
Ratio<br />
Col.2<br />
to<br />
Col.l<br />
Source: Percentages calculated<br />
froa Table A-10.<br />
1 Includes "Other Livestock."<br />
--194--<br />
5.28<br />
1.33<br />
1.U5<br />
1.57<br />
2.81<br />
8.50<br />
1.69<br />
1.11<br />
0.72<br />
0.37<br />
is fron field crops, although the<br />
51.59 per cent <strong>of</strong> all farms clas<br />
sified as field crop farns is be<br />
low the state figure <strong>of</strong> 88.3 per<br />
cent. Field crop farms produced<br />
57-13 per cent <strong>of</strong> the total farm<br />
income. Field crops are also the<br />
chief source <strong>of</strong> cash income on<br />
the Subsistence farms in the Area.<br />
Table A-10 shows the incomes<br />
by types <strong>of</strong> farms in the Area in<br />
1939. Those with the largest av<br />
erage income were: (1) fruit and<br />
nut farms, with an average income<br />
<strong>of</strong> $U,795; (2) dairy farns,<br />
$2,965; and (3) poultry farms,<br />
$1,535. The types which pro<br />
vided the largest income totals<br />
for 1939 were: (1) field crop<br />
farms, 87,55M73; (2) Sub<br />
sistence farms, SU,257,U50; and<br />
(3) poultry farms, $U80,138.<br />
However, the poultry farm<br />
group, which in 1939 ranked third<br />
in both average and total income,<br />
is now the most important farm<br />
income source in the Area, be<br />
cause <strong>of</strong> its expansion during the<br />
war to a point where the annual<br />
value <strong>of</strong> it product is equal to
the 1939 value <strong>of</strong> an farm products in. the Area. The broiler<br />
industry in Northeast <strong>Georgia</strong>, the beginnings <strong>of</strong> which can be<br />
Table A-10<br />
seen in the poultry<br />
figures for 1939,<br />
Total and Average Value <strong>of</strong> Products Sold, has become the sec<br />
Traded and Consumed by Farms in<br />
ond largest <strong>of</strong> the<br />
the Northeast <strong>Georgia</strong> Area<br />
four sections in<br />
the United States<br />
Type<br />
<strong>of</strong><br />
Farm<br />
All Farms in Area:<br />
Dairy<br />
Horticultural<br />
Forest products<br />
Livestock1<br />
Poultry<br />
Fruits and nuts<br />
Vegetables<br />
Field crops<br />
Subsistence<br />
Not classified2<br />
Total<br />
Suit ....<br />
Engineering<br />
Experiment<br />
Station . . .<br />
Tich<br />
Industrial . .<br />
. . Economic<br />
Research . .<br />
-*- ————— —— ———— "- «rM^>] Bimnlv t.ho Kill IT nf t.Vio<br />
Num<br />
ber<br />
<strong>of</strong><br />
Farms<br />
9k '8<br />
73<br />
88<br />
303<br />
75<br />
8k<br />
12,151<br />
10,531<br />
•Mil,<br />
23,551<br />
Amount<br />
All Farms in Panel I Counties<br />
Dairy<br />
Horticultural<br />
Forest products<br />
Livestock1<br />
Poultry<br />
Fruits and nuts<br />
Vegetables<br />
Field crops<br />
Subsistence<br />
Not classified 2<br />
Total<br />
16<br />
2<br />
8<br />
15<br />
15U<br />
1It<br />
5,873<br />
1,5U8<br />
30<br />
7,651<br />
All Farms in Panel II Counties<br />
Dairy<br />
Horticultural<br />
Forest products<br />
Livestock 1<br />
Poultry<br />
Fruits and nuts<br />
Vegetables<br />
Field crops<br />
Subsistence<br />
Not classified 8<br />
Total<br />
78<br />
6<br />
65<br />
73<br />
1U9<br />
7k<br />
80<br />
6,273<br />
8,983<br />
nh<br />
15,900<br />
Total Value<br />
<strong>of</strong> Products<br />
$ 278,689<br />
5,703<br />
58,993<br />
77,107<br />
359^616<br />
8l,W7<br />
7,551i,178<br />
1;,257,U50<br />
69,911*<br />
$13,223,225<br />
ft 36,608<br />
*<br />
75,501<br />
226,939<br />
*<br />
781<br />
3,897,363<br />
700,Wl<br />
19,137<br />
ft il,39U,352<br />
$ 359,616<br />
5,703<br />
53,501<br />
69,606<br />
253,199<br />
359,616<br />
80,656<br />
3,656,815<br />
3,556,969<br />
50,727<br />
ft 8,328,873<br />
(Cbntinued on page 196)<br />
—195—<br />
Per<br />
Farm<br />
$5>,
cream, condensed or evaporated milk, and powdered milk products.<br />
Table A-8 gives the per cent <strong>of</strong> the number <strong>of</strong> farms and <strong>of</strong><br />
Incomes by types, irlth the number-income ratio. This ratio in<br />
dicates to what extent each type <strong>of</strong> farm contributes to the farm<br />
income <strong>of</strong> the Area. In 1939, fruit and nut farms contributed<br />
Table A-10 - Continued 8.50 times their<br />
nronortionate<br />
Type<br />
<strong>of</strong><br />
Farm<br />
Value <strong>of</strong> Products by Type <strong>of</strong> Farms<br />
All Fauns in<br />
Counties Over 70<br />
Subsistence Farms<br />
Dairy<br />
Horticultural<br />
Forest Products<br />
livestock1<br />
Poultry<br />
Fruits and nuts<br />
Vegetables<br />
Field crops<br />
Subsistence<br />
Not classified8<br />
Total<br />
All Farms in<br />
Counties Under 70f<br />
Subsistence Farms<br />
Dairy<br />
Ho rticultural<br />
Forest Products<br />
livestock<br />
Poultry<br />
Fruits and nuts<br />
Vegetables<br />
Field crops<br />
Subsistence<br />
Not classified8<br />
Total<br />
Number<br />
<strong>of</strong><br />
Farms Amount<br />
21<br />
1<br />
50<br />
3U<br />
5o<br />
5o<br />
75<br />
868<br />
5,661<br />
58<br />
6,868<br />
73<br />
7<br />
23<br />
5k<br />
253<br />
259<br />
11,283<br />
U,870<br />
86<br />
16,683<br />
457,393 *<br />
32,5U3<br />
31,062<br />
Ii7,527<br />
255,00k<br />
77,376<br />
520,195<br />
2,200,109<br />
28,1,3°<br />
221,296<br />
5,703<br />
26,1,50<br />
1,6,01,5<br />
U32.611<br />
101,, 612<br />
lj.,061<br />
7,033,983<br />
2,057,010.<br />
Ui.WS<br />
9,973,277<br />
Per<br />
Farm<br />
|2»733<br />
65*<br />
9Ui<br />
951<br />
5,100<br />
1,032<br />
599<br />
389<br />
1*90<br />
U73<br />
3,031<br />
815<br />
1,150<br />
853<br />
1,710<br />
U,181«<br />
1*51<br />
623<br />
U22<br />
U82<br />
598<br />
Source: 0. S. Census, Agriculture,<br />
<strong>Georgia</strong>, 19ltO, Third Series, Table 19. Col,<br />
3 is calculated by dividing Col. 1 into Col.<br />
2.<br />
irtThere only three farms reported, data<br />
are not included.<br />
1And "Other livestock.*<br />
22he Bot Classified item includes<br />
under number <strong>of</strong> farms those farms with no<br />
value <strong>of</strong> products reported. The values in<br />
Cols. 2 and 3 represent the county figures<br />
omitted by the Census where less than three<br />
farms reported in a particular type and is<br />
shown only to balance the table._________<br />
—196—<br />
Sttl* ....<br />
EafOMtriaf<br />
Expcrimtnt<br />
Station . . .<br />
Grarpi*<br />
T«h<br />
Indamul . .<br />
. . Economk<br />
Roeirtb . .<br />
share <strong>of</strong> the income; dairy<br />
products, 5-28 tines; and<br />
poultry, 2.81 times. The<br />
fact that the types <strong>of</strong> farms<br />
bringing the largest incomes<br />
are relatively few in number<br />
indicates conditions which<br />
tend to keep farmers out <strong>of</strong><br />
these higher income-produc<br />
ing types <strong>of</strong> farming. Among<br />
these conditions are:<br />
1. Market limitations,<br />
which may discourage the en<br />
trance <strong>of</strong> new producers into<br />
the higher-income-producing<br />
farm types.<br />
2. Kisk, usuallygreater<br />
in the more pr<strong>of</strong>it<br />
able types <strong>of</strong> farming and<br />
<strong>of</strong>ten discouraging to new<br />
producers.<br />
3. Management require<br />
ments and the need for more<br />
constant labor and super<br />
vision.<br />
It- Capital limitations,<br />
frequently difficult or im<br />
possible to overcome.<br />
If «1.J farms are con<br />
sidered, there are relatively<br />
few large incomes in the<br />
Area1. If it were possible<br />
to eliminate completely the<br />
Subsistence farms, it is ap<br />
parent that, in the seven<br />
counties with very large Sub<br />
sistence *"ara groups, the<br />
proportion <strong>of</strong> large Incomes<br />
in the remaining non-subsist<br />
ence farms would be greater<br />
than normal, even though no<br />
basis exists for assuming<br />
that the number <strong>of</strong> non-sub<br />
sistence farms can be greatly<br />
increased.<br />
IfaBle A-3, pages 181<br />
and 182.
Subsistence Income; Distinct from the Subsistence farm as<br />
a type is "subsistence farming" or the "live-at-home" plan as<br />
practiced by non-subsistence farms. For all farms, both Sub Expeitatnt<br />
sistence and non-subsistepne, the subsistence income, or the Station . . .<br />
Cmrfia<br />
value <strong>of</strong> products consumed by the f'arn household, is a measure TKh<br />
<strong>of</strong> the extent to which the farra family follows the "live-at- IndBJtrial . .<br />
. . Economic<br />
home" philosophy. Table A-63 gives the value <strong>of</strong> products con- Reieaitb . .<br />
suiied in the Northeast <strong>Georgia</strong> Area in 1939 by levels <strong>of</strong> con<br />
sumption, arranged in descending order <strong>of</strong> the per cent <strong>of</strong> Subsistence Tarns.<br />
There are seven counties in the Area in which over 70 per cent <strong>of</strong> the farms<br />
are Subsistence farms. These counties in general have higher values <strong>of</strong><br />
products consumed at all total income levels than do those with more normal<br />
subsistence per cents. This may indicate that in the Northeast <strong>Georgia</strong> Area,<br />
especially in the northern counties where Subsistence fara averages are<br />
highest, subsistence faming is a wholesome way <strong>of</strong> living, rather than a low<br />
standard <strong>of</strong> farming. The census estimates <strong>of</strong> crop values enter into this<br />
subsistence value on the same basis as for »n other crops—the average<br />
market value—and nothing is added for the value <strong>of</strong> farm processing. In<br />
other words, farm consumption averages would be much higher if products<br />
consumed were appraised on the basis <strong>of</strong> the value paid for similar products<br />
by an industrial family.<br />
Even in high income levels, where few Subsistence farns are likely to<br />
be found and where the farms in counties <strong>of</strong> high Subsistence farm rates<br />
are likely to be non-subsistence faros, farm consumption is still at a<br />
high level. For example,in Rabun county (see Table A-63) the 26 farms in<br />
the $1500 to $2tt99 level, which are not reasonably Subsistence farms, have<br />
the highest value <strong>of</strong> consumed products at that level. The example <strong>of</strong> the<br />
neighboring Subsistence farms may explain the fact that subsistence was at<br />
a high level' even on non-subsistence farms in counties where Subsistence<br />
fan averages were higher, or it may be the greater isolation, which prob<br />
ably also accounts for the high proportion <strong>of</strong> Subsistence fams. On the<br />
average, all Northeast <strong>Georgia</strong> farm households in 1939 consumed 38.17 per<br />
cent <strong>of</strong> all they produced, |5,0i;7,956 (Table A-15). Among the types <strong>of</strong><br />
farms, on an Area basis, fruit and nut farms had the highest average<br />
value <strong>of</strong> products consumed, $272. Subsistence farms were second with a<br />
consumed value <strong>of</strong> J265. The lowest value shown in Table A-8 was |173 for<br />
field crop farms.<br />
The difference between the high and low values consumed in different<br />
counties in the* Area are much less than usual, since In many <strong>Georgia</strong><br />
counties,farms in the Specialty group frequently have consumption totals<br />
which are well below a hundred dollars.<br />
Types <strong>of</strong> Farming<br />
All the farms in the Northeast <strong>Georgia</strong> Area are divided into three<br />
groups in Table A-8. These are:<br />
Croup I-<br />
Group I: General purpose farms<br />
Group II: Specialty farms<br />
Group HI: Subsistence farms<br />
General Purpose Farms<br />
General purpose farms are those which have field crops as the prin<br />
cipal source <strong>of</strong> Income. In general, field crop farming can be engaged in<br />
lith a minimum <strong>of</strong> capital and risk, and the working year is relatively short.<br />
—197—
Succar7<br />
and<br />
Counties<br />
Table A-56<br />
Yields and Nuriber <strong>of</strong> Trees for Selected Fruits<br />
and Berries for Northeast <strong>Georgia</strong> Area<br />
in 1939 by Counties<br />
Banks. ....<br />
Barrow ....<br />
Bawson ....<br />
Forsyth ....<br />
Franklin. . . .<br />
Habershac . . .<br />
Hall. .....<br />
Hart. .....<br />
Jackson ....<br />
Lumpkin ....<br />
Madison ....<br />
Stephens. ...<br />
Union. .. ...<br />
White. ....<br />
Smeary<br />
and<br />
Counties<br />
Area Total. ...<br />
Barrow ....<br />
Bawson ....<br />
Forsyth ....<br />
Franklin. ...<br />
Habersban ...<br />
Kail .....<br />
Hart. .....<br />
Jackson ....<br />
LiLipkin ....<br />
Madison ....<br />
White. ....<br />
Farms<br />
Report<br />
ing<br />
.11,228<br />
805<br />
1)71<br />
222<br />
1,091<br />
870<br />
603<br />
1,213<br />
919<br />
771»<br />
1496<br />
771<br />
701)<br />
Ii36<br />
W6<br />
789<br />
588<br />
Farms<br />
Report<br />
ing<br />
2,151.<br />
91<br />
102<br />
36<br />
331<br />
162<br />
89<br />
29U<br />
222<br />
126<br />
su<br />
150<br />
96<br />
88<br />
118<br />
89<br />
106<br />
Apples<br />
Bushels<br />
10i6,li20<br />
I6,9li0<br />
5,888<br />
8,685<br />
20,66<br />
12,139<br />
130,703<br />
2l),375<br />
15,023<br />
9,396<br />
11,033<br />
9,93lt<br />
100,ti7li<br />
11,016<br />
20,922<br />
2lj,05l<br />
25,169<br />
Cherries<br />
Pounds<br />
110,905<br />
2,967<br />
U,336<br />
2,921<br />
11,021<br />
3,771)<br />
7,762<br />
16,202<br />
10,1:65<br />
3,300<br />
2,1471!<br />
1),273<br />
3,587<br />
6,725<br />
13,873<br />
9,101<br />
7,811<br />
Yield, 1939<br />
Bearing<br />
Trees<br />
298,608<br />
.13,952<br />
14,672<br />
14,925<br />
12,382<br />
i2,5ia<br />
95,032<br />
23,163<br />
9,089<br />
6, 3714<br />
7,820<br />
6,l481i<br />
38,690<br />
9,291<br />
13,252<br />
18,560<br />
22,381<br />
Bearing<br />
Trees<br />
11,203<br />
U25<br />
605<br />
192<br />
1,616<br />
815<br />
501)<br />
1,607<br />
902<br />
529<br />
229<br />
550<br />
379<br />
565<br />
956<br />
76U-<br />
565<br />
Farms<br />
Report<br />
ing<br />
10,261;<br />
811<br />
570<br />
185<br />
1,090<br />
978<br />
U85<br />
1,207<br />
l,Cii7<br />
901<br />
1467<br />
962<br />
199<br />
Il22<br />
131<br />
276<br />
533<br />
Farms<br />
Report<br />
ing<br />
3,537<br />
311<br />
1140<br />
21<br />
379<br />
291<br />
205<br />
• 10)6<br />
' 269<br />
280<br />
11U<br />
227<br />
2104<br />
1U1<br />
76<br />
233<br />
160<br />
Peaches<br />
Bushels<br />
1)82,052<br />
36,195<br />
10,1314<br />
6,01)8<br />
27,1)90<br />
19,2li7<br />
177,616<br />
2l4,U;5<br />
23,319<br />
93,126<br />
10,508<br />
20,li62<br />
1,698<br />
10,026<br />
1,305<br />
3,622<br />
16,811<br />
Grapes<br />
Pounds.<br />
1)23,288<br />
33,059<br />
18.59U<br />
1,351)<br />
20,933<br />
23,0142<br />
37,037<br />
145,659<br />
140,066<br />
28,583<br />
17,958<br />
20,356<br />
142,693<br />
11,319<br />
10,857<br />
104,076<br />
27,702<br />
Smt ....<br />
Engineering<br />
Experiment<br />
Station . . .<br />
Gtargia<br />
T«*<br />
Industrial . .<br />
. . Economic<br />
Research . .<br />
Bearing<br />
Trees<br />
U25,09S<br />
26,820<br />
10,819<br />
3,795<br />
18,979<br />
18,61)1<br />
135,2214<br />
25,li05<br />
•16,10)5<br />
116, 108<br />
9,1)65<br />
15,653<br />
2,013<br />
7,771;<br />
1,971<br />
6,122<br />
9,551<br />
Bearing<br />
Vines<br />
Source: U. S. Census, Agriculture, 191)0, Second Series, Table 111.<br />
—198—<br />
2l(,597<br />
l,80li<br />
3,209<br />
89<br />
1,L55<br />
l,i>60<br />
1,526<br />
2,162<br />
1,1)17<br />
1,67k<br />
SOh<br />
810<br />
3,010<br />
I,0li6<br />
263<br />
1,71)5<br />
2,1)23
Summary<br />
and<br />
Counties<br />
Area Total. . . .<br />
Barrow ....<br />
Dawson ....<br />
Forsyth ....<br />
Franklin. ...<br />
Habersham ...<br />
Ii_-jn<br />
Hart .....<br />
Jackson ....<br />
Lumpkin ....<br />
Uadison ....<br />
Stephens. ...<br />
White. ....<br />
Table A-56 - Continued If Sutc ....<br />
Engineering<br />
Experiment<br />
Held, 1939 | Station . . .<br />
<strong>Georgia</strong><br />
Tid,<br />
Figs<br />
Strawberries [ndastrul . .<br />
. . Economic<br />
Research . .<br />
Farms<br />
Farms<br />
!L<br />
Report<br />
Bearing Report<br />
ing Pounds Trees ing Quarts Acres<br />
2,11*7<br />
21*9<br />
150<br />
117<br />
296<br />
5o<br />
217<br />
287<br />
357<br />
1*<br />
308<br />
91<br />
1<br />
20<br />
171*, 665<br />
Hi, 116<br />
11,615<br />
1*,926<br />
20,563<br />
3,31*1,<br />
16,61,0<br />
30,778<br />
33,839<br />
77<br />
33,339<br />
i*,100<br />
*<br />
1,328<br />
5,332<br />
560<br />
383<br />
31*1<br />
61*3<br />
130<br />
726<br />
697<br />
925<br />
1*<br />
675<br />
210<br />
*<br />
38<br />
Number <strong>of</strong> Trees<br />
580<br />
33<br />
21<br />
6<br />
88<br />
99<br />
7<br />
72<br />
21<br />
91<br />
61<br />
9<br />
33<br />
1*<br />
16<br />
17<br />
51*,1*37<br />
2,885<br />
2,29<br />
162<br />
6,390<br />
8,010<br />
553<br />
7,332<br />
1,689<br />
15,261<br />
1*30<br />
3,301,<br />
907<br />
2,0li7<br />
688<br />
876<br />
1,611<br />
112<br />
7<br />
5<br />
i<br />
23<br />
15<br />
1<br />
16<br />
18<br />
*<br />
9 1<br />
1*<br />
1<br />
3<br />
5<br />
Summary<br />
and<br />
Counties<br />
Area Total. ...<br />
Banks. ....<br />
Barrow ....<br />
Dawson ....<br />
Foroyth ....<br />
Franklin. . . .<br />
Habersham ...<br />
Hall .....<br />
Hart . . . .' .<br />
Jackson ....<br />
Lumpkin ....<br />
Uadison ....<br />
Stephens. ...<br />
White. ....<br />
Farms<br />
Report<br />
ing<br />
13,838<br />
920<br />
716<br />
262<br />
1,319<br />
1,159<br />
700<br />
1,530<br />
1,206<br />
920<br />
51*9<br />
1,093<br />
798<br />
513<br />
51*6<br />
966<br />
61*1<br />
Apples<br />
Not<br />
Bearing<br />
Trees<br />
63,578<br />
2,101<br />
2,109<br />
2,11*6<br />
5,01*3<br />
l*,07l*<br />
7,338<br />
5,1*06<br />
3,308<br />
1,773<br />
2,815<br />
3,289<br />
8,1*1,5<br />
2,167<br />
2,660<br />
9,631<br />
1,273<br />
Bearing<br />
Trees<br />
298,608<br />
13,952<br />
U.672<br />
1*,925<br />
12,382<br />
12,51*1<br />
95,032<br />
23,163<br />
9,089<br />
6,371*<br />
7,820<br />
6,1,81*<br />
38,690<br />
9,291<br />
13,252<br />
18,560<br />
22,381<br />
^-Information withheld to avoid disclosure.<br />
Farms<br />
Report<br />
ing<br />
12,881*<br />
93li<br />
810,<br />
219<br />
1,328<br />
1,239<br />
571<br />
1,521*<br />
1,332<br />
1,061,<br />
502<br />
1,21,5<br />
308<br />
512<br />
231<br />
1*53<br />
578<br />
Peaches<br />
Not<br />
Bearing<br />
Trees<br />
99,10*1*<br />
12,1*8C<br />
l*,237<br />
3,255<br />
6,673<br />
5,523<br />
17,51*2<br />
11,205<br />
5,876<br />
20,682<br />
1,211*<br />
1*,578<br />
861*<br />
2,589<br />
568<br />
1,1,56<br />
702<br />
Bearing<br />
Trees<br />
1*25,095<br />
26,820<br />
10,819<br />
3, -795<br />
18,979<br />
18,61,1<br />
135,221*<br />
25,1*05<br />
16,1*1*5<br />
116,1*18<br />
9,1,65<br />
15,653<br />
2,013<br />
7,771*<br />
1,971<br />
6,122<br />
9,551<br />
—199—
Summary<br />
and<br />
Counties<br />
Table A-56 - Continued<br />
Kumber <strong>of</strong> Trees - Continued<br />
Farms<br />
Report<br />
ing<br />
Cherries<br />
Not<br />
Bearing<br />
Trees<br />
Bearing<br />
Trees<br />
Farms<br />
Report<br />
ing<br />
Grapes<br />
Bearing<br />
Vines<br />
State . , . .<br />
Enffflcefiaf<br />
Experiment<br />
Station . . .<br />
Grorffta<br />
Txh<br />
Indutrial'. .<br />
..EtOWBic<br />
Rotarcb . .<br />
Bearing<br />
Vines<br />
Area Total. ...<br />
Barrow ....<br />
Cawson ....<br />
Forsyth ....<br />
Franklin. ...<br />
Habersham . . .<br />
IT--I -[<br />
Hart .....<br />
Jackson ....<br />
Lumpkin ....<br />
lladison ....<br />
Stephens. . . .<br />
Unite. ....<br />
l»,36l<br />
197<br />
21,7<br />
70<br />
599<br />
375<br />
188<br />
601,<br />
h28<br />
251<br />
83<br />
337<br />
18U<br />
185<br />
202<br />
232<br />
179<br />
28,882<br />
2,81,9<br />
10,179<br />
1,679<br />
1,881,<br />
1,668<br />
983<br />
5,265<br />
578<br />
958<br />
130<br />
1,67<br />
256<br />
361<br />
797<br />
591<br />
237<br />
11,203<br />
1,25<br />
605<br />
192<br />
1,616<br />
815<br />
501,<br />
1,607<br />
902<br />
529<br />
229<br />
550<br />
379<br />
565<br />
956<br />
761,<br />
565<br />
li,962<br />
1,00<br />
261,<br />
33<br />
572<br />
te6<br />
267<br />
625<br />
381,<br />
360<br />
135<br />
333<br />
302<br />
207<br />
106<br />
323<br />
225<br />
57,919<br />
2,953<br />
22,222<br />
15,077<br />
2,763<br />
1,201,<br />
289<br />
3,022<br />
359<br />
1,225<br />
532<br />
388<br />
1,226<br />
1,17<br />
U,718<br />
756<br />
768<br />
21,, 597<br />
1,801,<br />
3,209<br />
89<br />
1,155<br />
I,li60<br />
1,526<br />
2,162<br />
1,10.7<br />
1,67U<br />
501,<br />
810<br />
3,010<br />
1,01,6<br />
263<br />
1,71,5<br />
2,1^3<br />
Figs<br />
Strawberries<br />
Sumnary<br />
and<br />
Counties<br />
Area Total. . . .<br />
Barrow ....<br />
Dawson ....<br />
Forsyth ....<br />
Franklin. ...<br />
Habersham . . .<br />
Hall .....<br />
Hart .....<br />
Jackson ....<br />
Lumpkin ....<br />
Madison ....<br />
Stephens. ...<br />
white. ....<br />
Farms<br />
Report<br />
ing<br />
3,016<br />
312<br />
289<br />
2<br />
203<br />
395<br />
75<br />
3U3<br />
390<br />
U35<br />
7<br />
1*20<br />
h<br />
115<br />
1<br />
25<br />
Not<br />
Bearing<br />
Trees<br />
1,725'<br />
211,<br />
311,<br />
*<br />
72<br />
18U<br />
50<br />
329<br />
125<br />
181<br />
20<br />
177<br />
26<br />
23<br />
10<br />
Bearing<br />
Trees<br />
5,332<br />
560<br />
383<br />
3ia<br />
61,3<br />
130<br />
726<br />
697<br />
925<br />
1»<br />
675<br />
210<br />
*<br />
38<br />
Farms<br />
Report<br />
ing<br />
580<br />
33<br />
21<br />
6<br />
88<br />
98<br />
7<br />
72<br />
21<br />
91<br />
61<br />
9<br />
33<br />
1,<br />
16<br />
17<br />
Acres<br />
112<br />
7<br />
5<br />
1<br />
23<br />
15<br />
1<br />
16<br />
3<br />
18<br />
«<br />
9<br />
1<br />
U<br />
1<br />
3<br />
*Tnformation withheld to avoid disclosure.<br />
—200—
Consequently, it is attractive to many farmers, even though the<br />
chances <strong>of</strong> large gain are small. Field crop farms represented<br />
51-59 per cent <strong>of</strong> the total number <strong>of</strong> farms in the Northeast<br />
<strong>Georgia</strong> Area and contributed 57.13 per cent <strong>of</strong> the farm income.<br />
The average farm value <strong>of</strong> field crop farms was $622, ranking next<br />
to last <strong>of</strong> the nine classifications given in Table A-10.<br />
State ....<br />
Enfincfriilf<br />
Exptriaat<br />
St*tkm . . .<br />
Grorffta<br />
Tick<br />
Ifldaftrul . .<br />
. . Economic<br />
Rararcb . .<br />
Field crop farmers who find this type <strong>of</strong> farming most at<br />
tractive may increase their income by working into their programs, on a<br />
small scale if little risk is desired, some type <strong>of</strong> specialty farming, such<br />
as beef cattle, poultry, sheep, vegetables, or fruit. The larger the enter-<br />
Table A-59<br />
Counties<br />
Over 7C/f<br />
Subsistence<br />
Farms<br />
Towns<br />
Union<br />
Rabun<br />
flhite<br />
Lumpkin<br />
Daws on<br />
Habersham<br />
Total<br />
Under 70*<br />
Subsistence<br />
Banks<br />
Stephens<br />
Hall<br />
Forsyth<br />
Jackson<br />
Kadison<br />
Barrow<br />
Franklin<br />
Hart<br />
Total<br />
Area Total<br />
Panel I<br />
Panel H<br />
<strong>Georgia</strong><br />
United States<br />
Poultry and Poultry Products Sold in the Northeast<br />
<strong>Georgia</strong> Area in 1939 bgfype <strong>of</strong> Farms<br />
Panels and Counties by istence Groups<br />
Poultry Farms<br />
Dollar<br />
Value<br />
* 737<br />
12,57k<br />
6,350<br />
2,039<br />
633<br />
5,758<br />
28,091<br />
6,168<br />
20,1*13<br />
77,61*3<br />
117,831*<br />
26,952<br />
16,067<br />
17,873<br />
19,267<br />
302,222<br />
330,313<br />
153,168<br />
177,11*5<br />
2,016,105<br />
259,760,700<br />
Per<br />
Cen1<br />
0.33<br />
2.17<br />
1.39<br />
0.55<br />
0.29<br />
0.71<br />
0.36<br />
0.91*<br />
It. 92<br />
5.61<br />
10.13<br />
1.96<br />
1.61<br />
1.U3<br />
1.23<br />
3.03<br />
2,5o<br />
3.13<br />
2.13<br />
1.21<br />
3.32<br />
Field Crop Farms<br />
Dollar<br />
Value<br />
$ 710<br />
1,01*1*<br />
1,858<br />
5,51*9<br />
3,1*13<br />
1,613<br />
5,159<br />
19,31*6<br />
5,881<br />
5,821*<br />
21*, 199<br />
36,338<br />
22,1*18<br />
17,530<br />
H*,82l*<br />
23,722<br />
31*, 366<br />
185,102<br />
20l*,l*l*8<br />
103,058<br />
101,390<br />
1,81*1«,1,75<br />
98,563,075<br />
Per<br />
Cent1<br />
0.32<br />
0.18<br />
0.32<br />
1.21<br />
0.92<br />
0.71*<br />
0.63<br />
0.60<br />
0.90<br />
1.1*0<br />
1.75<br />
3.13<br />
1.63<br />
1.50<br />
1.1*9<br />
1.90<br />
2.19<br />
1.36<br />
1.55<br />
2.11<br />
1.22<br />
1.11<br />
1.26<br />
Other Farms<br />
Dollar<br />
Value2<br />
* 23,21*6<br />
1*3,367<br />
11,521*<br />
11,031*<br />
13,723<br />
6,1.37<br />
18,370<br />
128,201<br />
9,658<br />
7,063<br />
20,390<br />
U*,t*12<br />
10,1*1*8<br />
8,526<br />
1*,799<br />
6,712<br />
1,690<br />
83,898<br />
212,099<br />
29,627<br />
182,1*72<br />
1,277,528<br />
197,087,923<br />
Source: U. S. Census, Agriculture, <strong>Georgia</strong>, 191*0, Third Series,<br />
Tables 19 and 17.<br />
1 The per cent figures a re per cent <strong>of</strong> total value <strong>of</strong> products sold,<br />
traded, and consumed in the Area, Panel, County, or by Subsistence Group<br />
2 Col. 5 is calculated b y subtracting Col. 1 and Col. 3 from the<br />
totals in Table 17.<br />
—201—<br />
Per<br />
Centf<br />
10.35<br />
7.1*9<br />
1.98<br />
2.1*1<br />
3.69<br />
2.91.<br />
2.31<br />
3-91*<br />
1.1*8<br />
1.70<br />
1.2*7<br />
1.21*<br />
0.76<br />
0.73<br />
0.1*8<br />
0.51*<br />
0.12<br />
0.81*<br />
1.60<br />
0.61<br />
2.19<br />
0.77<br />
2.52
prise the greater are the risks involved. Before such an enter<br />
prise is undertaken, even on a small scale, it would be well to<br />
seek advice from county or state agricultural agencies.<br />
Group Hi Specialty Farms<br />
State ....<br />
Engineering<br />
Experiment<br />
Station . . .<br />
<strong>Georgia</strong><br />
TKh<br />
Indanrul . .<br />
. . Economic<br />
Rauttb .<br />
Specialty farms are those specializing In horticultural<br />
products, dairy products, fruits and nuts, livestock, forest<br />
products, poultry, or vegetables. The favorable number-income ratios <strong>of</strong><br />
specialty farms shown in Table A-Sa may encourage farmers in the Area to<br />
enter some phase <strong>of</strong> specialty farming. However, success in this phase <strong>of</strong><br />
farming depends upon a number <strong>of</strong> factors, for example (1) market facili<br />
ties, (2) soil adaptation, and (3) experience or ability <strong>of</strong> the operator.<br />
The farner who contemplates any new type <strong>of</strong> agriculture will pr<strong>of</strong>it by ad<br />
vice from state or county agricultural agencies.<br />
Horticultural Specialty Farms: Horticultural specialties as defined<br />
in the census include crops grown under glass and propagated mushrooms,<br />
nursery products, flower and vegetable seeds, bulbs, and flowers and plants<br />
grown in the open. In general, such farms are operated on an intensively<br />
comeroial basis.<br />
There were only eight horticultural specialty farms in the Northeast<br />
<strong>Georgia</strong> Area in 1939- There seems to be no reason, however, why addi<br />
tional horticultural specialties could not be developed in the Area,<br />
since growing conditions can in large part be controlled. Possible op<br />
portunities exist in the growing <strong>of</strong> cut flowers and the propagation <strong>of</strong><br />
fruit trees in Northeast <strong>Georgia</strong> for sale in the towns and cities in the<br />
Southeast. limiting factors are market facilities and the experience and<br />
ability <strong>of</strong> the operator. Such enterprises should not be undertaken unless<br />
a careful study <strong>of</strong> conditions affecting the growth and sale <strong>of</strong> the products<br />
proves them practical, or without the assistance <strong>of</strong> someone having a thor<br />
ough knowledge <strong>of</strong> the businesses. Since individual farmers would probably<br />
be hesitant to take on the risks involved, such an enterprise could be<br />
promoted by agricultural agencies, if investigation proves the projects<br />
practical.<br />
Dairy Products: The 9k dairy farms in the Northeast <strong>Georgia</strong> Area had<br />
an average income <strong>of</strong> $li,795 in 1939. Table A-8a indicates that dairy<br />
farms produced S.'J- times their proportionate share <strong>of</strong> the income in the<br />
Area, and ranked second in the number-income ratio <strong>of</strong> all types <strong>of</strong> faros<br />
in the Area. These farms were concentrated in sections where the urban<br />
market is large, 35 in Hall county, 11 in Stephens, 11 in Habersham, 8<br />
in Jackson^ and 7 in Barrow. The prospects for expanding the dairy in<br />
dustry in the Area lie in the production on farms which are not dairy<br />
specialty fans ,<strong>of</strong> milk to be used for making ice cream mix, condensed or<br />
evaporated milk, powdered ailk products, or butter. Anyone wishing to<br />
promote such an enterprise should make a careful study <strong>of</strong> problems in- .<br />
volved, asking advice <strong>of</strong> county and state agricultural agencies.<br />
The opportunities for processing dairy products are limited, however,<br />
until the farms, through the development <strong>of</strong> pastures and feed production,<br />
will sustain more dairy cattle than are required to produce milk for the<br />
wholei^ilk market alone.<br />
Fruit and Nut Farms; The 75 fruit and nut farms in the Northeast<br />
<strong>Georgia</strong> Area in 1939 produced an average income <strong>of</strong> $!»,795 and ranked first<br />
in value <strong>of</strong> products <strong>of</strong> all types <strong>of</strong> farms in the Area. The chief items<br />
—202—
to i<br />
o<br />
Table A-8<br />
Average Value <strong>of</strong> All Products, Sold, Traded, and Consumed on Farms in the Northeast <strong>Georgia</strong> Area,<br />
1539, by Type <strong>of</strong> Farm in Three Groups for Panels and Counties b^r Subsistence Groups<br />
Group and Type <strong>of</strong> Farm<br />
Group I, General<br />
Purpose'<br />
Field Crop Farms<br />
Group II, Specialty<br />
Horticultural<br />
Dairy Products<br />
Fruits and Nuts<br />
livestock1<br />
Forest Products<br />
Poultry<br />
Vegetables<br />
Group III, Subsistence<br />
Group I, General<br />
Purpose<br />
Field Crop Farms<br />
Group II, Specialty<br />
Horticultural<br />
Dairy Products<br />
Fruits and Nuts<br />
livestock1<br />
Forest Products<br />
Poultry<br />
Vegetables<br />
Group III, Subsistence<br />
Northeast <strong>Georgia</strong> Area<br />
Average Value <strong>of</strong>:<br />
Number<br />
Farms<br />
12,151 $ 622 t 173 $ U.9<br />
8 713<br />
9k 2,965<br />
75 U,795<br />
88 876<br />
73 808<br />
303 1,585<br />
81* 969<br />
10,531 koh<br />
'<br />
Prod<br />
ucts<br />
Prod<br />
ucts<br />
Used<br />
*<br />
229<br />
272<br />
181<br />
160<br />
210<br />
229<br />
265<br />
Over 7055 Subsistence<br />
868<br />
599<br />
1 *<br />
21 2,733<br />
50 5,100<br />
31* 91U<br />
50 651<br />
50 951<br />
75 1,032<br />
5,661 389<br />
199<br />
__<br />
201<br />
326<br />
212<br />
155<br />
196<br />
21*5<br />
261<br />
Products<br />
Sold,<br />
Traded<br />
»<br />
2,736<br />
1*,523<br />
695<br />
61*8<br />
1,375<br />
71*0<br />
139<br />
1*00<br />
*<br />
2,532<br />
l*,77l*<br />
702<br />
1*96<br />
755<br />
787<br />
108<br />
Number<br />
Farms<br />
5,873<br />
2<br />
16<br />
1<br />
15<br />
8<br />
151*<br />
U<br />
1,51*8<br />
Panel I<br />
Average Value <strong>of</strong>:<br />
Prod<br />
ucts<br />
t 661* * 171 $ 1*93<br />
*<br />
2,288<br />
*<br />
5oo<br />
687<br />
1,1*71*<br />
195<br />
1*53<br />
Prod<br />
ucts<br />
Used<br />
—<br />
210<br />
. —<br />
133<br />
137<br />
193<br />
*<br />
251*<br />
Under 70/6 Subsistence<br />
11,283<br />
7<br />
11<br />
51.<br />
23<br />
253<br />
9<br />
I*, 870<br />
Ao^ 623<br />
815<br />
3,031<br />
1*,181*<br />
, 853<br />
1,150<br />
1,710<br />
1*51<br />
1*22<br />
171<br />
*<br />
237<br />
163<br />
161<br />
172<br />
213<br />
97<br />
2lt6<br />
Products<br />
Sold,<br />
Traded<br />
*<br />
2,078<br />
*<br />
367<br />
550<br />
1,281<br />
*<br />
199<br />
1*52<br />
815<br />
2,79l»<br />
I*, 021<br />
692<br />
978<br />
1,1*97<br />
351*<br />
176<br />
Number<br />
Farms<br />
Panel II<br />
Average Value<br />
Prod<br />
ucts<br />
6,278 $582 »175 $ U07<br />
6 951<br />
78 3,10U<br />
71* 1*,860<br />
73 951*<br />
65 823<br />
11*9 1,699<br />
80 1,008<br />
8,983 396<br />
Prod<br />
ucts<br />
Used<br />
it-<br />
233<br />
275<br />
191<br />
163<br />
228<br />
2(40<br />
266<br />
<strong>of</strong>:<br />
Products<br />
Sold,<br />
Traded<br />
*<br />
2,871<br />
It, 585<br />
763<br />
660<br />
1,1*71<br />
768<br />
130<br />
Source: U. S. Census,<br />
Agriculture, <strong>Georgia</strong><br />
Third series, "TaBle 19.<br />
, 191.0,<br />
*Hhere less than three<br />
farms reported, data are<br />
not included.<br />
1 "livestock" and<br />
"Other Livestock." ,i<br />
f ^ agS'B'g 1<br />
§•5 E-i.| f i'i •<br />
: 1" ••; Iff: |
in this classification are the apple and peach orchards concen<br />
trated in Habersham, Jackson, Banks, and Rabun counties (see<br />
Table A-13). In 1939, fruit and nut farms brought to Habersham<br />
county an income <strong>of</strong> $183,1*52, representing 22.5) per cent <strong>of</strong><br />
that county's total farm income. However, census figures in<br />
dicate an appreciable decrease in the planting <strong>of</strong> fruit trees<br />
and in fruit crops harvested between 1920 and 19lt5.<br />
The production <strong>of</strong> apples in northeast <strong>Georgia</strong> was promoted under the<br />
leadership <strong>of</strong> a few enthusiasts about 1900, and plantings were very heavy<br />
frnm 1917 to 1920. Plantings since have shown a steady decrease.<br />
Counties<br />
Over ^cef,<br />
Subsistence<br />
Farms<br />
Towns . .<br />
Union .<br />
Rabun White . . .<br />
.<br />
Lumpkin.<br />
Dawsoc. . .<br />
Habersham .<br />
Total. .<br />
Under 70<br />
Subsistence<br />
Banks ....<br />
Stephens ...<br />
Hall. ....<br />
Forsyth. ...<br />
Jackson. ...<br />
Madison. ...<br />
Barrow ....<br />
Franklin . . .<br />
Hart. ....<br />
Total. . . .<br />
Area Total. . .<br />
Panel I. ...<br />
Panel n . . .<br />
Table A-13<br />
Number <strong>of</strong> Farms by Groups and Type <strong>of</strong> Farm for the<br />
Northeast <strong>Georgia</strong> Area in 1939 by Panels and<br />
Counties by Subsistence Groups<br />
3 o<br />
E-*<br />
71*1<br />
1,325<br />
1,037<br />
921*<br />
81*1<br />
611*<br />
1,386<br />
6,868<br />
1,370<br />
895<br />
2,1(05<br />
2,009<br />
2,223<br />
1,876<br />
1,1*58<br />
2,139<br />
2,308<br />
16,683<br />
23,551<br />
7,615<br />
15,900<br />
Tt<br />
m +> "S<br />
_<br />
31 921<br />
2<br />
13<br />
58<br />
6<br />
1<br />
27<br />
7<br />
U*<br />
10<br />
11<br />
82<br />
86<br />
il, 1,<br />
30<br />
111*<br />
Group<br />
r<br />
3 0<br />
m<br />
Q) O<br />
•ri C<br />
E o<br />
17<br />
18<br />
66<br />
196<br />
U*2<br />
U*3<br />
286<br />
868<br />
531<br />
391<br />
1,270<br />
1,291<br />
1,539<br />
1,336<br />
1,061<br />
1,679<br />
2,185<br />
11,283<br />
12,151<br />
5,873<br />
6,278<br />
H a<br />
1<br />
rH<br />
§<br />
-H<br />
.p<br />
_<br />
_<br />
-<br />
_<br />
_<br />
_<br />
1<br />
1<br />
_<br />
-<br />
1*<br />
_<br />
1<br />
1<br />
1<br />
__<br />
7<br />
8<br />
•2<br />
6<br />
a<br />
2<br />
—<br />
6<br />
—<br />
2<br />
—<br />
11<br />
21<br />
2<br />
11<br />
35 281716<br />
73<br />
91*<br />
16<br />
78<br />
n<br />
!<br />
10<br />
&.<br />
3<br />
—<br />
i<br />
e311<br />
36<br />
50<br />
9<br />
2<br />
13<br />
1<br />
— __<br />
25<br />
75<br />
1<br />
71*<br />
Group<br />
II<br />
•i<br />
8<br />
-P<br />
to<br />
g<br />
a<br />
6<br />
5<br />
n<br />
2<br />
1<br />
1<br />
8<br />
31*<br />
7 1<br />
18<br />
5<br />
10<br />
6<br />
2<br />
32<br />
51*<br />
88<br />
15<br />
73<br />
-p nS<br />
S.<br />
_<br />
8 1<br />
2<br />
16<br />
10<br />
13<br />
50<br />
1*<br />
25313131<br />
23<br />
73<br />
8<br />
65<br />
*><br />
PH<br />
5<br />
18<br />
1It<br />
10<br />
it<br />
8<br />
50<br />
8<br />
9<br />
57<br />
121*<br />
16<br />
—<br />
18<br />
9<br />
12<br />
253<br />
303<br />
151*<br />
11(9<br />
CQ<br />
3<br />
0}<br />
M<br />
__<br />
22<br />
132<br />
33 11*<br />
75<br />
1<br />
—<br />
3 1<br />
—<br />
—<br />
3 1<br />
Sources U. S. Census, Agriculture, <strong>Georgia</strong>, 191(0, Third Series,<br />
Table 19.<br />
a lncludes "Other Livestock."<br />
—204 —<br />
__<br />
9<br />
81*<br />
1*<br />
80<br />
Group<br />
III<br />
I<br />
I<br />
.3<br />
I<br />
710<br />
1,223<br />
922<br />
713<br />
635<br />
1(52<br />
1,006<br />
5,661<br />
802<br />
1*80<br />
981*<br />
576<br />
622<br />
519<br />
353<br />
1(31*<br />
100<br />
it, 870<br />
10,531<br />
1,51(8<br />
8,983
The opinion now held is that northeast <strong>Georgia</strong> generally<br />
is not well adapted to apple production. It is too far south<br />
climatically, and the rainfall is badly distributed for satis<br />
factory production. Apple insects and disease are more severe<br />
than farther north, and the cost <strong>of</strong> their control is very high.<br />
The rapid expansion <strong>of</strong> apple orchards in previous years on<br />
an assumption <strong>of</strong> excellent adaptability resulted in the use <strong>of</strong><br />
Salt ....<br />
Expirimtnt<br />
Station . . .<br />
Gtoeffia<br />
Txh<br />
Indnitriil . .<br />
. . Eonomic<br />
Rocuch .<br />
unsuitable varieties in some localities where other varieties might have<br />
prospered. There are locations in limited sites, especially in the higher<br />
altitudes, where apples are doing very well, and it is possible that there<br />
Table A-61<br />
Counties<br />
Over 70if<br />
Subsistence<br />
Farms<br />
Towns<br />
Union<br />
Rabun<br />
Unite<br />
Lumpkin<br />
Dawson<br />
Habersham<br />
Total<br />
Under 70£<br />
Subsistence<br />
Banks<br />
Stephens<br />
Hall<br />
Forsyth<br />
Jackson<br />
Kadison<br />
3 arrow<br />
Franklin<br />
Hart<br />
Total<br />
Area Total<br />
Panel I<br />
Panel II<br />
<strong>Georgia</strong><br />
Per Cent <strong>of</strong> Number <strong>of</strong> Farms by Groups and Type<br />
<strong>of</strong> Farm for Northeast <strong>Georgia</strong> Area<br />
3<br />
a<br />
100.00<br />
100.00<br />
100.00<br />
100.00<br />
100.00<br />
100.00<br />
100.00<br />
100.00<br />
100.00<br />
100.00<br />
100.00<br />
100.00<br />
100.00<br />
100.00<br />
100.00<br />
100.00<br />
100.00<br />
100.00<br />
100.00<br />
100.00<br />
100.00<br />
100.00<br />
•a<br />
•rf to<br />
CM<br />
•H<br />
CO tn<br />
4J<br />
o<br />
2;<br />
_<br />
2.31*<br />
0.87<br />
0.22<br />
0.12<br />
0.33<br />
0.91*<br />
0.81*<br />
0.1*1*<br />
0.11<br />
1.12<br />
0.35<br />
0.63<br />
0.53<br />
0.75<br />
0.37<br />
0.09<br />
0.52<br />
0.61<br />
0.39<br />
0.72<br />
1.11*<br />
Group<br />
I<br />
tfi<br />
1 •o<br />
£<br />
2.29<br />
1.36<br />
6.36<br />
21.21<br />
16'.88<br />
23-29<br />
20.63<br />
12.61*<br />
38.76<br />
1.3.69<br />
52.81<br />
61*. 26<br />
69.23<br />
71-22<br />
72.77<br />
78.1*9<br />
9U.67<br />
67.63<br />
51.59<br />
76.76<br />
39.1*8<br />
62.70<br />
•a<br />
1<br />
g<br />
H<br />
•P<br />
fH<br />
&<br />
. _<br />
_<br />
—<br />
—<br />
—<br />
_<br />
0.07<br />
O.C1<br />
—<br />
—<br />
0.17 _<br />
_<br />
o.c5<br />
0.07<br />
o.o5 _<br />
o.ol*<br />
0.03<br />
0.03<br />
0.03<br />
Source: Calculated from Table A-13.<br />
'•Includes "Other Livestock"<br />
—205—<br />
I £<br />
s<br />
£ •a<br />
§<br />
1<br />
fa<br />
0.27 0.13<br />
—<br />
0.58 0.77 — 0.32<br />
0.21* 0.12<br />
_ 0.16<br />
0.79 2.60<br />
0.31 0.73<br />
0.15<br />
1.23<br />
1.1*6<br />
0.10<br />
0.36<br />
o.c5<br />
0.1*8<br />
o.o5<br />
0.26<br />
o.tl*<br />
0.1*0<br />
0.21<br />
0.1*9<br />
0.66<br />
—<br />
0.08 —<br />
0.58<br />
—<br />
0.07<br />
——<br />
0.15<br />
0.32<br />
0.01<br />
0.1*7<br />
i<br />
osCO<br />
O><br />
><br />
a<br />
0.81<br />
0.38<br />
1.06<br />
0.22<br />
0.32<br />
0.16<br />
0.58<br />
0.1*9<br />
o.5i<br />
0.11<br />
0.75<br />
0.25<br />
0.1*5<br />
0.32<br />
O.U*<br />
0.11*<br />
O.C9<br />
0.32<br />
0.37<br />
0.20<br />
0.1*6<br />
Group<br />
II<br />
«<br />
§<br />
fc.<br />
_ _<br />
0.60<br />
0.10<br />
0.22<br />
1.90<br />
1.63<br />
0.91*<br />
0.73<br />
0.29<br />
0.22<br />
0.21<br />
0.15<br />
o.o5<br />
0.16<br />
0.07<br />
0.11*<br />
o.ol*<br />
O.li*<br />
0.31<br />
0.11<br />
o.io.<br />
b<br />
5<br />
s<br />
0.68<br />
1.36<br />
0.10<br />
0.1*3<br />
1.19<br />
0.65<br />
0.58<br />
0.73<br />
0.58<br />
1.01<br />
2.37<br />
6.17<br />
0.72<br />
—<br />
1.23<br />
0.1)2<br />
0.52<br />
1.52<br />
1.29<br />
2.01<br />
0.9k<br />
W<br />
are others where a wrong variety has discouraged growers and<br />
where a different variety might prosper. A real advantage pos<br />
sessed by the apple grower <strong>of</strong> northeast <strong>Georgia</strong> is his nearness<br />
to the southern market.<br />
The apple industry is a highly specialized business and,<br />
for success, must be built around the right varieties in the<br />
proper places.<br />
The peach industry has held its own in northeast <strong>Georgia</strong> since its<br />
beginnings, about 1900.<br />
Livestock Fams: Livestock fanning as practiced in the Northeast<br />
<strong>Georgia</strong> Area has not proved as successful as other types <strong>of</strong> specialty farm<br />
ing. In 1939, the 88 livestock farms In the Area produced an average inccce<br />
<strong>of</strong> $876 and ranked fifth in average income <strong>of</strong> the seven types <strong>of</strong><br />
specialty farms as listed in Table A-10. The average income <strong>of</strong> livestock<br />
far^s for the state was $1767. However, low labor requirements make<br />
livestock farrdng attractive, and, with improved and a better selection <strong>of</strong><br />
acreage for feed crops, it could become a good source <strong>of</strong> income for the<br />
Kortheast <strong>Georgia</strong> Area. Fanners contemplating expansion in this type <strong>of</strong><br />
faming will pr<strong>of</strong>it by asking advice <strong>of</strong> state and county agricultural<br />
agencies. Livestock is further discussed in the section beginning on<br />
page 228.<br />
Forest Products Farms; There were 73 forest products fams In the<br />
Northeast <strong>Georgia</strong> Area in 1939. Of these, 16 were in Lumpkin county, 13<br />
in Habersham county, and 10 in Dawson county. The average income was $808.<br />
The presence <strong>of</strong> the Ghattahoochee National Forest in the Area limits any<br />
appreciable expansion <strong>of</strong> this type <strong>of</strong> farming.<br />
For further discussion <strong>of</strong> forest products in the Area, see Forest<br />
Products in the Industry section beginning on page 101.<br />
Poultry Faras; The Northeast <strong>Georgia</strong> Area has recently become the<br />
center <strong>of</strong> a new agricultural industry—the raising <strong>of</strong> broilers on an in<br />
tensively commercial basis. Beginnings <strong>of</strong> the industry are seen in the<br />
census poultry figures for 19l»0, especially in Forsyth county, where there<br />
were at that tine 12U poultry faras, comprising 6.17 per cent <strong>of</strong> the total<br />
number <strong>of</strong> fams and producing 10.13 per cent <strong>of</strong> the total farm income <strong>of</strong><br />
that county. The greatest strides, however, have been made since 19JjO,<br />
chiefly to satisfy wartime demands. In lUi, <strong>Georgia</strong> ranked second in<br />
the United States in commercial broiler production, being exceeded only by<br />
Delaware. In 19I»3, the state ranked fourth among the broiler producing<br />
states, and in 1939 it ranked seventeenth. The industry is concentrated<br />
in the Northeast <strong>Georgia</strong> Area in Forsyth, Hall, Dawson, Jackson, White,<br />
and Habersham counties, and in adjoining Cherokee county. Production for<br />
19UU is estimated at 2k ndUion broilers with a value <strong>of</strong> $19,116,000, or<br />
a Itl per cent increase above the 17 million broilers raised in 19Ji3. The<br />
139 production is estimated at 1,600,000 broilers, having an approximate<br />
value <strong>of</strong> $676,000. The phenomenal growth <strong>of</strong> the industry in the Area is<br />
indicated by the fact that income from broiler production alone in 19hh<br />
is at least equal to the value <strong>of</strong> all farm products in 1939.<br />
Although it is Impossible to say at what level the enterprise will<br />
become stabilized, the prospects are favorable for its establishment as<br />
2 <strong>Georgia</strong> Crop Reporting Service, April, 19U5-<br />
—206—
a permanent peace-time industry, chiefly through the efforts <strong>of</strong><br />
cooperative organizations. An immediate goal is the reduction<br />
<strong>of</strong> the cost <strong>of</strong> raising broilers.<br />
Vegetable Production in Mountain Counties: The farms <strong>of</strong><br />
the mountain counties <strong>of</strong> North <strong>Georgia</strong> were, according to the<br />
IJliO census, largely Subsistence farms. A recent study made by<br />
N. K. Penny <strong>of</strong> the <strong>Georgia</strong> Experiment Station3 indicates that in<br />
Sure ....<br />
Engineering<br />
Experiment<br />
Station . . .<br />
the last few years an appreciable number <strong>of</strong> farmers in these counties have<br />
nadle a shift toward the production <strong>of</strong> vegetables for sale, a change which<br />
tends to increase the cash incomes <strong>of</strong> the farmers, thereby removing them<br />
fron the Subsistence category. The changes noted in the study are rel<br />
atively recent, however, and are not as yet <strong>of</strong> such magnitude as to create<br />
a noticeable change<br />
Sunmary<br />
aid<br />
Counties<br />
irsa Total<br />
Panel I<br />
Panel II<br />
Table A-60<br />
Fruits and Huts on Farms in the<br />
Northeast <strong>Georgia</strong> Area, I9"39<br />
Fruits and<br />
Huts Farms<br />
Dollar<br />
Value<br />
323,Wi<br />
—<br />
323,710;<br />
Panel I Counties<br />
Jarrow<br />
Ha-t<br />
Forsyth<br />
Madison<br />
Panel II Counties<br />
Franklin<br />
Sabun<br />
Jackson<br />
Shite<br />
Hall<br />
labersham<br />
''JQpkin<br />
Stephens<br />
Banks<br />
;nion<br />
'owns<br />
Dawson<br />
U3,li30<br />
75,987<br />
1,100 __<br />
183, U52<br />
__<br />
19,775<br />
Per<br />
Cent<br />
2.U5<br />
. —— .<br />
3.89<br />
Field<br />
Crop Farms<br />
Dollar<br />
Value<br />
36,83U<br />
1U.330<br />
22,501;<br />
t _ _ _ 1,10U<br />
——— — 5,066<br />
— 5,738<br />
— 2,U22<br />
_ .<br />
—<br />
_ .<br />
7.U6<br />
5.52<br />
0.2k<br />
—<br />
22.50<br />
——<br />
2,050<br />
273<br />
7,U05<br />
5,260<br />
2,281<br />
753<br />
699<br />
7iii<br />
3.03———<br />
2, as<br />
*<br />
311<br />
3UO<br />
Per<br />
Cent<br />
0.23<br />
0.29<br />
0.27<br />
0.21<br />
0.32<br />
O..V9<br />
0.21<br />
O.X6<br />
0.05<br />
0.5k<br />
1.15<br />
0.16<br />
0.09<br />
0.19<br />
0.17<br />
0.37 —<br />
o.iu<br />
0.16<br />
Other Farms<br />
Dollar<br />
Value<br />
37,897<br />
5,5U5<br />
32,352<br />
1,059<br />
k02<br />
3,205<br />
879<br />
369<br />
3,118<br />
1,689<br />
k,235<br />
2,513<br />
3,623<br />
3,93U<br />
1,136<br />
5,855<br />
769<br />
U,W8<br />
668<br />
Per<br />
Cent<br />
0.29<br />
0.11<br />
0.39<br />
O.Oli<br />
0.03<br />
0.28<br />
O.OS<br />
0.03<br />
0.5!t<br />
0.12<br />
0.93<br />
0.18<br />
O.UU<br />
1.06<br />
0.27<br />
0.90<br />
o.u<br />
1.93<br />
0.30<br />
Source: U. S. Census, Agriculture, <strong>Georgia</strong>,<br />
9hO, Third Series, Tables 19 and 17. The per cent<br />
igures are per cent <strong>of</strong> total value <strong>of</strong> products sold,<br />
traded, and consumed in the Area, Panel, or County.<br />
Col. 5 is calculated by subtracting Col. 1 and Col. 3<br />
from the totals in Table A-17.<br />
stess than three farms reported.<br />
—207—<br />
Intfostriil . .<br />
. . Economic<br />
Roejrcb . .<br />
in the agricultural<br />
or industrial struc<br />
ture <strong>of</strong> the counties.<br />
They are chiefly in<br />
dicative <strong>of</strong> trends<br />
and possibilities.<br />
The study was<br />
made <strong>of</strong> eight coun<br />
ties, six <strong>of</strong> which<br />
are counties having<br />
highest subsistence<br />
percentages in the<br />
Northeast <strong>Georgia</strong><br />
Area—Towns, Union,<br />
Rabun, Unite, Lumpkin,<br />
and Habersham.<br />
Two counties in<br />
cluded in the study,<br />
Fannin and Gilmer,<br />
are outside the<br />
Northeast <strong>Georgia</strong><br />
Area.<br />
The estimated<br />
acreage in the vege<br />
table crops mentioned<br />
in Table A-66 was<br />
7,li87 acres in 19Ui.<br />
The most important<br />
crop in acreage and<br />
production was snap<br />
beans. Acreage in<br />
snapbeans amounted<br />
to 2,705 acres, and<br />
total production was<br />
3Mr. Penny's<br />
report is in pro<br />
cess <strong>of</strong> printing.<br />
These comments are<br />
based on a copy <strong>of</strong><br />
the manuscript<br />
which he made avail<br />
able.
3,753.2 tons, with an approximate value <strong>of</strong> $120,670. Acreage in<br />
19iiO was 1,590 acres, and sales amounted to $70,703 (Table A-37).<br />
IT. addition to the vegetable crops shown in Table A-67, 13 other<br />
vegetable crops are named as being adapted to production In Nortl<br />
<strong>Georgia</strong>. These are, in the order <strong>of</strong> importance, HIM beans,<br />
Table A-67<br />
Crop<br />
Estimated Acreage and Production <strong>of</strong> Certain Commercial<br />
Vegetable Crop's in Eight Counties, <strong>Georgia</strong>, 1944<br />
Beans , snap<br />
Beans, pole<br />
Bell peppers<br />
Cabbage<br />
Collards<br />
Corn, green<br />
Cucumbers<br />
Potatoes<br />
Squash<br />
Tonatoes<br />
Turnips<br />
Units<br />
bushels<br />
bushels<br />
bushels<br />
tons<br />
dozen<br />
bunches<br />
dozen<br />
bushels<br />
bushels<br />
bushels<br />
bushels<br />
dozen<br />
bunches<br />
Number<br />
2,705<br />
670<br />
65<br />
1,150<br />
685<br />
75<br />
5<br />
1,865<br />
120<br />
15<br />
132<br />
Average Yield<br />
1932-19411<br />
Units<br />
92.5<br />
92.5<br />
171.4<br />
4.2<br />
156. 0<br />
500.0<br />
200.0<br />
64.0<br />
151.0<br />
61.2<br />
262.3<br />
Production<br />
Units<br />
250,212<br />
61,975<br />
11,141<br />
4,830<br />
106,860<br />
37,500<br />
1,000<br />
119,360<br />
18,120<br />
918<br />
34,623<br />
Tons<br />
3,753.2<br />
929.6<br />
139.3<br />
4,830.0<br />
187. 08<br />
243.7*<br />
24.0<br />
3,530.8<br />
S62.43<br />
24.3<br />
6S7.83<br />
Total<br />
7.487<br />
16.415.1.<br />
Source: Penny, N. li. , Vegetable Production and Market<br />
ing in <strong>Georgia</strong> Mountain Counties, <strong>Georgia</strong> Experiment Station<br />
TJjriffin), 1946.<br />
Agricultural statistics, 1944. The yields <strong>of</strong> collards.<br />
green corn, scuash, cucumbers, and turnips were estimated by<br />
agricultural leaders <strong>of</strong> the area.<br />
Calculated on the basis <strong>of</strong> estimates made by wholesale<br />
dealers on the Atlanta Fanners' Market: a dozen bunches <strong>of</strong><br />
collards as 35 pounds, a dozen bunches <strong>of</strong> turnips as 38<br />
pounds, and a dozen ears <strong>of</strong> corn as 13 pounds.<br />
'Calculated at 40 pounds per bushel, the <strong>Georgia</strong> stan<br />
dard waight for one bushel <strong>of</strong> squash.<br />
Area<br />
Table A-37a<br />
Experiment<br />
Station . . .<br />
Groeyia<br />
Ttch<br />
Indwtriil . .<br />
. . Economic<br />
Rocarch . .<br />
Value <strong>of</strong> Vegetables (Bxcludir.K Potatoes) Per Kara and Per Acre, for<br />
"" '<br />
Itort'ieast<br />
<strong>Georgia</strong> Area<br />
<strong>Georgia</strong><br />
Total Farms<br />
Reporting<br />
1939<br />
1,657<br />
27,639<br />
1929<br />
1,926<br />
26,U32<br />
Acres <strong>of</strong> Vegeta<br />
bles Produced<br />
for Sale<br />
1939<br />
3,688<br />
125,531<br />
1929<br />
1,782<br />
109,921<br />
Per Fara<br />
1939<br />
$90.20<br />
129.51<br />
Average Value<br />
1929<br />
$68.1U<br />
213.37<br />
Per Acre<br />
1939<br />
$1(0.52<br />
28.57<br />
Source: C. S. Census, Agriculture , <strong>Georgia</strong>, 19UO, Second Series,<br />
Table 13-<br />
—208-<br />
1929<br />
$73-65<br />
51 -to
lettuce, beets, carrots, English peas, okra, spinach, rutabagas,<br />
celery, cauliflower, green peas, brussels sprouts, and rhubarb.<br />
Some <strong>of</strong> these are grown In negligible quantities, and some are<br />
not grown for commercial purposes. Strawberries and sweet pota<br />
toes are also mentioned as having commercial possibilities.<br />
Sun ....<br />
Experiment<br />
Station . . .<br />
Cfocyia<br />
Tick<br />
Indnmiil . .<br />
..Eo<br />
Rtttaith .<br />
Only 1».3 per cent <strong>of</strong> the total cropland in the eight coun<br />
ties included in the study is devoted to vegetable production. _ _.__<br />
However, <strong>of</strong> the 173,886 acres <strong>of</strong> cropland, about 59 per cent is believed<br />
to be adapted to the production <strong>of</strong> one or more vegetable crops. It is<br />
further estimated that 18 per cent <strong>of</strong> the total cropland is available;<br />
that is, it could be planted in vegetable crops without seriously changing<br />
the farm organization. According to the findings <strong>of</strong> the study, the land<br />
devoted to vegetable crops could be increased to three times the present<br />
acreage with little change in farm organization. It is believed that most<br />
<strong>of</strong> the acreage would be taken from acreage formerly devoted to corn.<br />
Table 4-68 shows the types <strong>of</strong> buyers who purchased the vegetables<br />
grojm in the eight counties. The chief types were buyers on the Atlanta<br />
Farmers' Market, local cash buyers, and transient cash buyers. By far the<br />
largest part <strong>of</strong> the produce was sold at the Atlanta Farmers' Market,<br />
brought there by the growers.<br />
Table A-66<br />
Cropland1 Adapted, Available and Devoted to Vegetable<br />
Production In Eight Countie's in GeorgTa, 1944<br />
County<br />
Fannin<br />
Silmer<br />
Habersham<br />
Lujnpkin<br />
Babun<br />
Towns<br />
Union<br />
Tlhite<br />
Total<br />
Per Cent<br />
<strong>of</strong> Total<br />
Total<br />
Acres<br />
25,081<br />
24,545<br />
34,515<br />
16,930<br />
12,996<br />
12,407<br />
25,513<br />
21,799<br />
173,886<br />
Adapted2<br />
Acres<br />
8,277<br />
18,409<br />
22,435<br />
2,540<br />
11,696<br />
7,444<br />
25,000<br />
6,540<br />
102,341<br />
58.9<br />
Avail<br />
able3<br />
Acres<br />
2,069<br />
3,682<br />
7,852<br />
1,524<br />
1,754<br />
1,117<br />
12,000<br />
1,308<br />
31,306<br />
18.0<br />
1944<br />
Actual<br />
Acres<br />
810<br />
1,550<br />
365<br />
1,105<br />
820<br />
150<br />
2,405<br />
282<br />
7,487<br />
4.3<br />
Per Cent<br />
Avail<br />
able<br />
39.1<br />
42.1<br />
4.6<br />
72.5<br />
46.8<br />
13.4<br />
20.0<br />
21.6<br />
23.9<br />
Source: Penny, N. 1C., Vegetable Production in<br />
<strong>Georgia</strong> Mountain Counties, <strong>Georgia</strong> Experiment s¥a~<br />
tion (Griffin), i55T<br />
Cropland includest cropland land harvested,<br />
cropland failure, and cropland idle. U. S. Census,<br />
1940.<br />
2 Cropland adapted to the production <strong>of</strong> one or<br />
more <strong>of</strong> the commercial vegetable crops now being<br />
grown in the area.<br />
'Cropland that could be planted to vegetable<br />
crops without seriously changing the farm organiza<br />
tion <strong>of</strong> the area as a whole or <strong>of</strong> most individual<br />
forms.___________________________________<br />
—209—<br />
The table indi<br />
cates that only a<br />
snail quantity (one<br />
per cent <strong>of</strong> beans)<br />
was sold to can<br />
neries. These were<br />
in Murphy, North<br />
Carolina, and Grif<br />
fin, <strong>Georgia</strong>. How<br />
ever, the fact that<br />
canning factories<br />
as direct' purchasers<br />
are insignificant<br />
does not indicate<br />
the quantity <strong>of</strong><br />
beans that go to the<br />
canneries, because<br />
local cash buyers<br />
sell much <strong>of</strong> the pro<br />
duce purchased to<br />
them.<br />
In many cases,<br />
farmers sold the<br />
whole field <strong>of</strong> pro<br />
duce to a buyer for<br />
a lump sum. This<br />
practice should be<br />
discouraged, since<br />
the grower usually<br />
sells without proper<br />
information concern<br />
ing market condi<br />
tions.
Table A-68<br />
Proportions <strong>of</strong> Certain Vegetable Crops Produood<br />
in j!ighT <strong>Georgia</strong> Counties ThatTTer Sold<br />
to the Various Typo Buyers 1, Ig44<br />
Type <strong>of</strong> Buyer<br />
Beans<br />
Bell<br />
Peppers<br />
Cab<br />
bage<br />
Collards<br />
Corn<br />
Cucum<br />
bers<br />
Pota<br />
toes<br />
Squash<br />
Toma<br />
toes<br />
Turnips<br />
Units<br />
bushel<br />
bushel<br />
tons<br />
dozen<br />
bunohes<br />
dozen<br />
bushel<br />
bushel<br />
bushel<br />
bushel<br />
dozen<br />
bunches<br />
Amount<br />
318,187<br />
11,141<br />
4,830<br />
106,860<br />
37,600<br />
1,000<br />
119,56C<br />
18,320<br />
918<br />
34,623<br />
Per Cent <strong>of</strong> Crop Bought by Type <strong>of</strong> Buyer<br />
Looal oash buyer<br />
Transient oash buyer<br />
Chain stores<br />
Atlanta Farmers' Market<br />
Itinerant truckers<br />
Canneries<br />
Other<br />
Total<br />
19<br />
116<br />
59<br />
-_<br />
1<br />
4<br />
100<br />
17<br />
26<br />
--<br />
57<br />
__<br />
--<br />
__<br />
100<br />
6<br />
7<br />
14<br />
44<br />
3<br />
_.<br />
26<br />
100<br />
_„<br />
—<br />
~<br />
100<br />
__<br />
__<br />
__<br />
100<br />
„_<br />
-.<br />
—<br />
100<br />
...<br />
_..<br />
100<br />
100<br />
—<br />
__<br />
__<br />
__<br />
__<br />
__<br />
100<br />
14<br />
9<br />
16<br />
54<br />
__<br />
_..<br />
7<br />
100<br />
28<br />
6<br />
„_<br />
66<br />
__<br />
_..„<br />
100<br />
52<br />
«<br />
._<br />
31<br />
__<br />
_<br />
17<br />
100<br />
^^<br />
..<br />
_„<br />
100<br />
....<br />
_<br />
„.,<br />
100<br />
Souroei Penny, H. li., Vegetable Production and Marketing in <strong>Georgia</strong> Mountain Counties, <strong>Georgia</strong><br />
Experiment Station (Griffin), 1946. •' ""••• ~<br />
Definitions <strong>of</strong> type buyers i Loop.l oash buyers are those who live in the marketing center the year round<br />
and usually are engaged in some other business. Transient oash operate in the area only during the marketing<br />
season and have their headquarters or business establishment in some other oity or state. Chain stores,<br />
self-axplanatory. Buyers on the Atlanta Farmers' Market include all types operating on that market.<br />
Itinerant truckers are buyers who may make one or more trips to the area in a marketing season.<br />
Canneries, self-explanatory. Other includes retail stores, tourists, other farmers, farmertruokers,<br />
etc.<br />
-—. — i<br />
f •„ I JgS^<br />
! li|^|l"
According to recommendations made by Mr. Penny, the practio<br />
<strong>of</strong> selling on the Atlanta Farmers' Market by individual farmers<br />
should be discouraged because <strong>of</strong> (1) the time involved in the<br />
trip to Atlanta, (2) transportation costs, (3) the tendency <strong>of</strong><br />
fanners to sell at a low price in order to make an early sale,<br />
(li) the possibility that the farmer may have to accept a lower<br />
price on the Atlanta market than he was <strong>of</strong>fered locally, and<br />
(5) the farmers' lack <strong>of</strong> knowledge <strong>of</strong> market conditions or abil<br />
ity to estimate market trends.<br />
Table A-37<br />
Sales <strong>of</strong> Vegetables in the Northeast<br />
<strong>Georgia</strong> Area, 1939T by ]<br />
Vegetable<br />
isparagus0<br />
Beans1<br />
Beets1<br />
Cabbage6<br />
Cantaloups 2 ^<br />
Collards6<br />
Cucumbers6<br />
Dry Onions4<br />
Green Onions*<br />
Green Peas8<br />
Lettuce*<br />
liraa Beans<br />
Mixed Vegetables<br />
Okra<br />
Pepperss> e<br />
Spinach<br />
Squash6<br />
Sweet corri5<br />
Tomatoes6<br />
Turnips6<br />
Turnip Greens6<br />
Watermelons6<br />
Totals<br />
Area<br />
Total<br />
* -<br />
70,703<br />
158<br />
2B,k02<br />
1,109<br />
5,627<br />
158<br />
38U<br />
75<br />
8,080<br />
3U<br />
9,COU<br />
361,<br />
16<br />
601<br />
251<br />
2,987<br />
1,892<br />
li,028<br />
682<br />
181<br />
8,591t<br />
$1U3,330<br />
Panel I<br />
Total<br />
$ -<br />
U.2S8<br />
160<br />
79<br />
57<br />
2,3)43<br />
5,ii02<br />
5X3<br />
275<br />
515<br />
3,7U9<br />
$17,351<br />
Panel II<br />
Total<br />
158<br />
28,2*42<br />
1,030<br />
5,627<br />
158<br />
327<br />
75<br />
5,737<br />
3U<br />
3,602<br />
36U<br />
16<br />
601<br />
251<br />
2, Wit<br />
1,617<br />
3,513<br />
682<br />
181<br />
U.8U5<br />
$125,979<br />
Source: U. S. Census, Agriculture,<br />
<strong>Georgia</strong>, 19UO, Second Series, Table 13.<br />
iSnap, string, or wax.<br />
E Includes muskmelons, honeydews, etc.<br />
'Sweet and pimientos. *And shallots.<br />
6 Data for counties where three or Less<br />
farms reported a particular vegetable are not<br />
shown by Census. For this reason, the totals<br />
do not include data for the number <strong>of</strong> counties<br />
shown: Asparagus, 1; Beets, 8; Cabbage, k;<br />
Cantaloups, 2; Collards, 1; Cucumbers, 6; Dry<br />
onions, k; Green peas, k; Lettuce, 7; Lima<br />
beans, 3; Mixed vegetables, 5; Okra, 9j Pep<br />
pers, 6; Spinach, k; Squash, kj Sweet corn,<br />
3; Tomatoes, 3; Turnips, 7; Turnip greens, 5;<br />
Watermelons, lu _____ _______________<br />
--211--<br />
The study indicates<br />
that there was little grad<br />
ing or packaging <strong>of</strong> produce<br />
in the eight counties<br />
studied. However, it is be<br />
lieved that if the section<br />
is to become an important<br />
commercial producing area,<br />
the produce should be prop<br />
erly prepared for market<br />
before leaving the area.<br />
Grading and packaging<br />
could be done by the<br />
growers, by local buyers,<br />
or by cooperatives, ac<br />
cording to accepted stand<br />
ards. The author <strong>of</strong> the<br />
study believes that the<br />
volume <strong>of</strong> production<br />
justifies the location <strong>of</strong><br />
Federal shipping-point<br />
inspectors in the area.<br />
Each <strong>of</strong> the eight<br />
counties included in the<br />
survey, except Habersham,<br />
has a farmers' cooperative<br />
organization. Services<br />
rendered by the coopera<br />
tives include: providing<br />
a place for assembling<br />
produce, grading, packag<br />
ing, transportation, and<br />
selling.<br />
Irrigation is sug<br />
gested as a possibility<br />
for increasing yields <strong>of</strong><br />
vegetable crops in the<br />
eight counties, especially<br />
those crops with short<br />
growing seasons and early<br />
harvest seasons. The<br />
lakes and streams <strong>of</strong> the<br />
area would provide ample<br />
water. The yields per<br />
acre indicated in Table<br />
A-67 show that the crops<br />
mentioned produce a better
^J<br />
Table A-9<br />
Per Farm Consumption <strong>of</strong> Farm Products<br />
for the Northeast <strong>Georgia</strong> Area, by<br />
Levels <strong>of</strong> Total "Production, 1939*<br />
Value <strong>of</strong><br />
Products Sold,<br />
Traded, or Used<br />
Under $250<br />
$250 to $399<br />
$UOO to $599<br />
$600 to $999<br />
$1000 to $Ui99<br />
$1500 to $2It99<br />
$2500 to $3999<br />
$UOOO to $5999<br />
$6000 to $9999<br />
$10,000 and over<br />
Farms<br />
Report<br />
ing<br />
3,787<br />
5,U20<br />
6,1^2<br />
5,213<br />
1,376<br />
U39<br />
127<br />
UO<br />
17<br />
7<br />
Value <strong>of</strong> Products<br />
Used on Farms<br />
Total <strong>of</strong><br />
All Farms<br />
$ WJ2.289<br />
91t7,369<br />
1,U7U,075<br />
1,U99,017<br />
U66,635<br />
155,781*<br />
Ii8,l52<br />
Ut,592<br />
10,752<br />
3,072<br />
Average<br />
Per<br />
Farm<br />
$109<br />
175<br />
229<br />
286<br />
31<br />
379<br />
365<br />
632<br />
U39<br />
cash income than the<br />
crops which they<br />
probably displace,<br />
but they are not<br />
large enough per<br />
acre to justify a<br />
commercial canning<br />
plant. They do in<br />
Suit ..<br />
Exp«nincat<br />
Satkm . . .<br />
r«*<br />
Induitzu! .<br />
. . Econooi<br />
Rctcarcb . .<br />
dicate, however, that atten<br />
tion should be given to the<br />
problem <strong>of</strong> greater tonnage per<br />
acre, which could reach a level<br />
high enough to make vegetable<br />
growing for commercial canning<br />
or freezing more pr<strong>of</strong>itable<br />
than the fresh .market basis<br />
which is developing.<br />
Group III; Subsistence Farms:<br />
The relatively low per<br />
farm incomes <strong>of</strong> the Northeast<br />
<strong>Georgia</strong> Area are due in large<br />
part to the high proportion <strong>of</strong><br />
Subsistence farms. Over half<br />
<strong>of</strong> the income <strong>of</strong> a Subsistence<br />
Source: U. S. Census, Agriculture,<br />
19UO, Third Series, Table 20.<br />
Table A-62 farm is in products consumed by the farm house<br />
hold. There are 10,531 such farms in the Area.<br />
Kumber and Per Cent <strong>of</strong> Farms * comparison<strong>of</strong>_Tables A-6l and A-15 indicate<br />
Those Operators Are Not<br />
Listed As Farmers in<br />
Occupation Table<br />
County<br />
Rabun<br />
Eabersham<br />
Onion<br />
Lumpkin<br />
Towns<br />
White<br />
Jackson<br />
Barrow<br />
Stephens<br />
Hall<br />
Banks<br />
Dawson<br />
Forsyth<br />
Hart<br />
Franklin<br />
Madison<br />
Total<br />
Number<br />
28U<br />
32li<br />
260<br />
162<br />
96<br />
88<br />
196<br />
101 56<br />
136<br />
77<br />
2k<br />
U5 ho<br />
23<br />
12<br />
1920<br />
Per<br />
Cent<br />
All<br />
Farms<br />
27-39<br />
21.93<br />
19-62<br />
19.26<br />
12-95<br />
9-52<br />
8.32<br />
6.92<br />
6.21<br />
5-65<br />
5.62<br />
3-91<br />
2.2k<br />
1-73<br />
1.07<br />
0.61*<br />
8.11<br />
Source; Calculated<br />
from Tables A-13 and IF-9.<br />
—212—<br />
that where Subsistence farms are most numerous,<br />
farm incomes tend to be lowest. While Subsist<br />
ence farms comprise Wi.72 per cent <strong>of</strong> the num<br />
ber <strong>of</strong> farms in \he Area, with an average in<br />
come <strong>of</strong> only $UoU, they contribute only 32.<br />
per cent <strong>of</strong> the total farm income.<br />
Highest percentages <strong>of</strong> subsistence are<br />
for the most part in the northern part <strong>of</strong> the<br />
Area where the mountains are highest and the<br />
forests are densest, where unfavorable ter<br />
rain <strong>of</strong>fers greatest difficulties to the pre<br />
vailing types <strong>of</strong> faming and, concurrently,<br />
more attractions for retired living. Seven<br />
counties (see Table A-61) have more than 70<br />
per cent Subsistence farms. In Towns county,<br />
95.82 per cent <strong>of</strong> the farms are Subsistence<br />
farms; in Union county, 92.30 per cent; in<br />
Eabun county, 89.91 per cent; in Unite county,<br />
77.16 per cent; in Lumpkiii county, 75-51 per<br />
cent; in Dawson county, 73.62 per cent; and<br />
in Habersham county, 72.58 per cent. The<br />
lowest Subsistence farm percentages are in<br />
and south <strong>of</strong> the Cnattahooch.ee Valley, where<br />
industrial influence is strong or cotton farm<br />
ing is practical. Barrow county reported 2U-2<br />
per cent Subsistence farms, Franklin county,<br />
20.29 per cent, and Hart county only U.33 per<br />
cent.
Hature <strong>of</strong> Subsistence Farms; As compared with most other<br />
types <strong>of</strong> farms, Subsistence farms consume a_larger proportion <strong>of</strong><br />
what they produce, but their cash income is'low. In consequence,<br />
their total value produced is relatively low. The reasons for<br />
this lie in the nature <strong>of</strong> the Subsistence farm. It is not ac<br />
curate to assume that all <strong>of</strong> them are merely poor producers and<br />
cannot do any better. In some cases, the major income is earned<br />
airay from the farm; again, the Subsistence farm may be the hone-<br />
Sun....<br />
EngiaMriflg<br />
Eiptrimcnt<br />
Station . . .<br />
Gmgie<br />
T«*<br />
Iidmuul . .<br />
. . Economic<br />
Rftcaicb .<br />
stead <strong>of</strong> a plantation. The farm then is a way <strong>of</strong> life rather than a live<br />
lihood. It is only those farms which intend to be non-subsistence farms,<br />
but, because <strong>of</strong> poor soil, small area, or misfortune do not produce enough<br />
for an adequate Living, that need analysis and suggestion.<br />
Kinds <strong>of</strong> Subsistence Farmers! Even though a Subsistence farm in it<br />
self contriEutes little to general production and prosperity, the fact <strong>of</strong><br />
subsistence is not in every case an indication <strong>of</strong> the relative .wealth <strong>of</strong> a<br />
household, nor does it necessarily imply a low standard <strong>of</strong> living. The<br />
census classifies as a farm4 any tract <strong>of</strong> land, three acres or more in size,<br />
on which some agricultural operations are performed and the agricultural<br />
products <strong>of</strong> which are valued at not less than $250. Thus, a Subsistence<br />
farm may be relatively small and the subsistence category may include a<br />
number <strong>of</strong> types.<br />
1. True Subsistence Farms; Subsistence farms may be<br />
operated by people who want only subsistence, whose require<br />
ments are simple, and who need cash only for taxes, clothing,<br />
4According to the census, "A farm, for census purposes, is all the<br />
land on which some agricultural operations are performed by one person,<br />
either by his ovm labor alone or with the assistance <strong>of</strong> members <strong>of</strong> his<br />
household, or hired employees. The land operated by a partnership is like<br />
wise considered a farm. A "farm 1 may consist <strong>of</strong> a single tract <strong>of</strong> land, or<br />
a number <strong>of</strong> separate tracts, and the several tracts may be held under dif<br />
ferent tenures as when one tract is owned by the farmer and another tract<br />
is rented by him. When a landowner has one or more tenants, renters, crop<br />
pers, or managers, the land operated by each is considered a farm.<br />
"Include dry-lot or barn dairies, nurseries, green houses, hatcheries,<br />
fur farns, mushroom cellars, apiaries, cranberry bogs, etc.<br />
"Exclude 'fish-farms, 1 fish hatcheries, 'oyster farms,' and 'frog<br />
farms.'<br />
"Do not report as a farm any tract <strong>of</strong> land <strong>of</strong> less than 3 acres unless<br />
its agricultural products in 1939 were valued at $250 or more."<br />
Thus, on a plantation, the land operated by each cropper, renter, or<br />
tenant should be reported as a separate farm, and the land operated by the<br />
owner or manager by means <strong>of</strong> wage hands should likewise be reported as a<br />
separate farm.<br />
The character <strong>of</strong> this definition tends to include in the census ta<br />
bles many farms, particularly in Groups I and HI, General Purpose and<br />
Subsistence farms, which distort averages. The further lack <strong>of</strong> separate<br />
crop statistics for snare-croppers and other tenants who, from one point<br />
<strong>of</strong> view, may be regarded as employees working on a share basis, or from<br />
another as limited partners, also seems to obscure the picture. As a<br />
pure description <strong>of</strong> economic function, is a plantation consisting <strong>of</strong> 40<br />
acres <strong>of</strong> home place, 200 acres <strong>of</strong> pasture and woodlot, and ItOO acres <strong>of</strong><br />
fields (with ten share-croppers) one farm or the eleven which the census<br />
records The ten hO-acre tenant farms could not exist without the service<br />
provided by the pasture and the woodlot, yet this necessary land usually<br />
is excluded from the so-called "farm" <strong>of</strong> the tenant.<br />
—213--
and ether elementary necessities. This group may in<br />
clude those who secure their entire income from the<br />
farn or people <strong>of</strong> independent income who retire to Sub<br />
sistence farns with the intention <strong>of</strong> producing only<br />
enough for their needs. The scenic and recreational<br />
features <strong>of</strong> the northern counties <strong>of</strong>fer especial at<br />
tractions to people who wish to live in retirement.<br />
2. Farqs Used as Residences; Often pr<strong>of</strong>essional<br />
and business people, or industrial workers use the Sub<br />
sistence farn as a place <strong>of</strong> residence and farm on a<br />
snail scale without expectation <strong>of</strong> pr<strong>of</strong>it.<br />
3. Plantation Home Places; In the Southeastern<br />
States, particularly, some large plantation homeplaces<br />
are classified as "Subsistence farms." Most <strong>of</strong> the<br />
land on such a plantation is operated by tenants, leav<br />
ing the pasture land, woodlot, and a small amount <strong>of</strong><br />
Table A-9a<br />
Consumption <strong>of</strong> Products on Farms with Production <strong>of</strong> $250<br />
and __ ___ Less _ in the __ Mortheast <strong>Georgia</strong> Area for 1939, for<br />
Counties Cons'"'' ng Over HT
Oi<br />
I<br />
Type <strong>of</strong> Crop<br />
All products<br />
Products used<br />
Field crops<br />
livestock<br />
Poultry<br />
Fruits and nuts<br />
Vegetables<br />
Dairy<br />
Forest products<br />
Other livestock<br />
All products<br />
Products used<br />
Field props<br />
Livestock<br />
Poultry<br />
Fruits and nuts<br />
Vegetables<br />
Dairy<br />
Forest products<br />
Other livestock<br />
dumber<br />
<strong>of</strong><br />
Farms<br />
10,531<br />
10,531<br />
6,71*3<br />
2,897<br />
6,757<br />
1,113<br />
891»<br />
2,082<br />
687<br />
255<br />
5,661<br />
5,661<br />
2.65U<br />
1,637<br />
3,761,<br />
500<br />
707<br />
618<br />
502<br />
197<br />
Table A-llt<br />
Production on All Subsistence1 Farms in the Northeast <strong>Georgia</strong> Area<br />
by Type <strong>of</strong> Crop <strong>of</strong> Enterprise by Panels and by Counties<br />
Northeast <strong>Georgia</strong> Area<br />
Value<br />
<strong>of</strong><br />
Products<br />
$U,257,51(0<br />
2,785,637<br />
959,166<br />
113,879<br />
196,751<br />
29,11)2<br />
58,823<br />
67,0lt9<br />
1(1,086<br />
U.671<br />
Per<br />
Farm<br />
Value<br />
IUOU<br />
265<br />
11)2<br />
393<br />
291<br />
262<br />
658<br />
322<br />
598<br />
183<br />
Over 10% Subsistence<br />
2,200,1(09<br />
1,589,515<br />
298,111<br />
69,11(0<br />
119,832<br />
15,192<br />
52,603<br />
20,88k<br />
30,819<br />
3,51J(<br />
389<br />
281<br />
112<br />
h22<br />
318<br />
30U<br />
7UU<br />
338<br />
6Ui<br />
178<br />
Per<br />
Cent<br />
Unit<br />
Total2<br />
32.20<br />
21.07<br />
7.25<br />
0.86<br />
1.1|9<br />
0.22<br />
O.U4<br />
0.51<br />
0.31<br />
o.ou<br />
67.71<br />
1(8.91<br />
9.17<br />
2.13<br />
3.69-<br />
O.k7<br />
1.62<br />
0.6U<br />
0.95<br />
o.n<br />
Number<br />
<strong>of</strong><br />
Farms<br />
1,51(8<br />
1,51»8<br />
1,386<br />
389<br />
1,119<br />
ll,!.<br />
6k<br />
711<br />
35<br />
11<br />
Panel I<br />
Value<br />
<strong>of</strong><br />
Products<br />
$700,571<br />
392, Ut<br />
238,992<br />
13,890<br />
28,119<br />
U,0li2<br />
2,092<br />
18,01(0<br />
3,028<br />
Farm<br />
Value<br />
$1(53<br />
25U<br />
172<br />
31(2<br />
251<br />
281<br />
327*<br />
25U<br />
865*<br />
56U*<br />
62<br />
Per<br />
Under 10% Subsistence<br />
li,870 2,057,131<br />
1»,870 1,196,122<br />
U.089 661,055<br />
1,260 1J(,739<br />
2,993 76,919<br />
613 13,950<br />
187 6,220<br />
1.U6U 1(6,165<br />
185 10,267<br />
58 1.-157<br />
(Table continued on page 216 . )<br />
1(22<br />
21(6<br />
162<br />
355<br />
257<br />
228<br />
333<br />
315<br />
555<br />
199<br />
Per<br />
Cent<br />
Unit<br />
Total'<br />
1U.31<br />
8.02<br />
U.88<br />
0.27<br />
0.57<br />
0.08<br />
O.Oli<br />
0.37<br />
0.06<br />
0.00<br />
20.63<br />
11.99<br />
6.63<br />
O.lt5<br />
0.77<br />
O.lL<br />
0.06<br />
O.H6<br />
0.10<br />
0.01<br />
Number<br />
<strong>of</strong><br />
Farms<br />
8,983<br />
8,983<br />
5,357<br />
2,508<br />
5,638<br />
969<br />
830<br />
1,371<br />
652<br />
2hk<br />
Panel II<br />
Value<br />
<strong>of</strong><br />
Products<br />
$3,556,969<br />
2,393,093<br />
720,17U<br />
100,589<br />
168,632<br />
• 25,100<br />
56,731<br />
1(9,009<br />
38,058<br />
U,609<br />
r<br />
1ft<br />
l<br />
^"11*<br />
oSflir*<br />
•<br />
•!*•*:<br />
K-- •<br />
If:<br />
~ '<br />
Per<br />
Farm<br />
Value<br />
$396<br />
266<br />
13U<br />
U01<br />
299<br />
259<br />
68U<br />
357<br />
581(<br />
189<br />
Per<br />
Cent<br />
Unit<br />
Total2<br />
1(2.71<br />
28.73<br />
8.65<br />
1.21<br />
2.02<br />
0.30<br />
0.68<br />
0.59<br />
O.U6<br />
0.06<br />
Source: U. S. Census, Agri<br />
culture, Third Series, Table 19.<br />
'Farms on which over half<br />
the total value <strong>of</strong> products is<br />
products consumed on the farms.<br />
£ The per cent which the value<br />
<strong>of</strong> products shown in the second<br />
column is <strong>of</strong> the total value <strong>of</strong><br />
all products on all farms in the<br />
area, panel, subsistence groups,<br />
and county.<br />
*Based on farms reporting.<br />
iCWhere less than three farms<br />
reported,data are not included.
Work Off Farm; In many cases, most <strong>of</strong> the total incone, <strong>of</strong><br />
which the farm income is only a small part, is earned by members<br />
<strong>of</strong> the farm family, <strong>of</strong>ten the operators themselves, who work<br />
away from the farm. Table A-65 shows the number and per cent <strong>of</strong><br />
fare operators who worked more than one hundred days <strong>of</strong>f the<br />
fare in 1939 » either at non-farm work or on some other farm, and<br />
indicates that in counties having relatively low farm incomes<br />
the farn families supplement them substantially by <strong>of</strong>f-farm work<br />
ype <strong>of</strong> Crop<br />
Panel I Counties<br />
3arrow<br />
111 products<br />
Products used<br />
field crops<br />
livestock<br />
Poultry<br />
Fruits and nuts<br />
Vegetables<br />
Dairy<br />
Forest products<br />
Other livestock<br />
Hart<br />
LL1 products<br />
Products used<br />
ield crops<br />
livestock<br />
Poultry<br />
Fruits and nuts<br />
Vegetables<br />
Dairy<br />
Forest products<br />
Other livestock<br />
Forsyth<br />
111 products<br />
Products used<br />
Field crops<br />
Livestock<br />
Poultry<br />
Fruits and nuts<br />
Vegetables<br />
Dairy<br />
Forest products<br />
Other livestock<br />
Table A-lli - Continued<br />
Number<br />
<strong>of</strong><br />
Farms<br />
Value Pei<strong>of</strong><br />
Farm<br />
Products Value<br />
Per<br />
£:nt<br />
Unit<br />
Total2<br />
353 $161,873 *U59 16.23<br />
353 92,216 261 9.lt<br />
310 55,881 180 5.60<br />
83 3,781 U6 0.38<br />
200 k,555 23 O.U6<br />
li 399 29 O.OU<br />
5 160 32 0.02<br />
137 li,6UO 3U O.ltf<br />
32 • 206 69i 0.02<br />
# #<br />
100 t Wi.iio $100. 2.82<br />
100 2k,0h& ato 1.5k<br />
83 16,068 191i 1.03<br />
20 993 50 0.06<br />
67 1,690 25 0.11<br />
k1 127 32 0.01<br />
# i i<br />
31 999 32 0.06<br />
2 #— #<br />
—<br />
— — #<br />
576 $231,1415 $1*02 19.90<br />
576 127,096 221 10.93<br />
518 71;,212 Vj3 6.33<br />
139 2*,2S1 31 0.37<br />
U99 13,537 27 1.16<br />
72 2,637 37 0.23<br />
1.6 1,51U 33 0.13<br />
372 6,756 18 0.58<br />
132 1.2U2 96# 0.11<br />
# #<br />
(Table continued on page 217.)<br />
—216—<br />
Such work may be in the near<br />
by forests, on roads or<br />
public work, or in stores<br />
in the nearest town. In<br />
eight counties, all <strong>of</strong> them<br />
having relatively low farm<br />
incomes or with industrial<br />
influence, more than ten<br />
per cent <strong>of</strong> fana operators<br />
themselves worked more than<br />
100 days <strong>of</strong>f the farm.<br />
Farms Without Operators;<br />
The non-farm characteristic<br />
<strong>of</strong> the Subsistence farm<br />
group is indicated by a<br />
comparison <strong>of</strong> the figures<br />
for the number <strong>of</strong> farms in<br />
Table A- and for the num<br />
ber <strong>of</strong> farmers in the<br />
Fanners and Farm Uanagers<br />
section <strong>of</strong> Table L-9<br />
(page 31j ). There is an<br />
apparent discrepancy be<br />
tween the two. Since<br />
there should be a farm<br />
operator or manager for<br />
each farm, one would ex<br />
pect the two totals<br />
to be the same. Ordina<br />
rily the data on which<br />
Table L-9 is based shows<br />
only a small difference,<br />
but in the Northeast<br />
<strong>Georgia</strong> Area the differ<br />
ence was 1,920, or 8.11<br />
per cent <strong>of</strong> all farms, as<br />
is shown in Table A-6U.<br />
It is <strong>of</strong> course impossible<br />
for that many farms to be<br />
without operators. Hlhat<br />
appears to be the case is •<br />
that on 1,920 farms, when<br />
the Population schedule<br />
was filled out,"Farmer"<br />
or "Farm Manager" was not<br />
given as the occupation<br />
<strong>of</strong> any member <strong>of</strong> the family.<br />
This occurred to a much<br />
greater extent in those
counties with many Subsistence farms. This would appear to re<br />
flect that "retired" or some other non-farm occupation was re<br />
ported, an indication that in such cases Tanning" was not<br />
thought <strong>of</strong> in connection with such "farms. 11 In Rabun, Habersham<br />
Union, Lumpkin, Towns, and TOiite, in all <strong>of</strong> which Subsistence<br />
farms were more than 70 per cent <strong>of</strong> all farms, the per cent <strong>of</strong><br />
farms "without an operator" ranged from 27.39 down to 9.52 per<br />
cent. In Jackson, Barrow, Stephens,and Hall counties in which<br />
Type <strong>of</strong> Crop<br />
Madison<br />
JIT products<br />
Products used<br />
Field crops<br />
Livestock<br />
Poultry<br />
Fruits and nuts<br />
Vegetables<br />
Dairy<br />
Forest products<br />
Other livestock<br />
Panel II Counties<br />
Franklin<br />
All products<br />
Products used<br />
Field crops<br />
Livestock<br />
Poultry<br />
Fruits and nuts<br />
Vegetables<br />
Dairy<br />
Forest products<br />
Other livestock<br />
Rabun<br />
ill products<br />
Products used<br />
Field crops<br />
livestock<br />
Poultry<br />
Fruits ana nuts<br />
Vegetables<br />
.-.try<br />
Forest products<br />
Ot,her livestock<br />
Table A-14 - Continued<br />
Number<br />
<strong>of</strong><br />
Farms<br />
519<br />
519<br />
475<br />
147<br />
353<br />
54<br />
12<br />
171<br />
Value Per<br />
<strong>of</strong> Farm<br />
Products Value<br />
$263,173<br />
149,186<br />
92,831<br />
4,235<br />
6,331<br />
679<br />
418<br />
177<br />
434<br />
434<br />
381<br />
125<br />
306<br />
33 6<br />
118<br />
24<br />
11<br />
922<br />
922<br />
277<br />
278<br />
403<br />
67<br />
159<br />
143<br />
67<br />
48<br />
5,645<br />
1,580<br />
»195,635<br />
112,856<br />
68,424<br />
3,827<br />
6,385<br />
353<br />
187<br />
2,713<br />
511<br />
379<br />
$407,669<br />
317,205<br />
34,265<br />
14,077<br />
9,693<br />
2,579<br />
15,827<br />
7,986<br />
5,154<br />
708<br />
Per<br />
Cent<br />
Dnit<br />
Total'<br />
$507 22.52<br />
287 12.77<br />
195 7.95<br />
29 0.36<br />
24 0.71<br />
16 0.08<br />
35 0.04<br />
33<br />
939<br />
62<br />
$451<br />
260<br />
180<br />
31<br />
21<br />
11<br />
31-<br />
23<br />
21<br />
34<br />
$442<br />
344<br />
124<br />
51<br />
24<br />
38<br />
100<br />
56<br />
59<br />
15<br />
(Table continued on page 218.)<br />
—217—<br />
O.U8<br />
0.14<br />
0.01<br />
15.66<br />
9.03<br />
5.48<br />
0.31<br />
0.51<br />
0.03<br />
0.01<br />
0.22<br />
0.04<br />
0.03<br />
70.00<br />
54.47<br />
5.88<br />
.2.U2<br />
1.66<br />
0.44<br />
2.72<br />
1.37<br />
0.88<br />
0.12<br />
the bulk <strong>of</strong> the Area's in<br />
dustry is concentrated, the<br />
same figure ranged from 8.82<br />
to 5.65 per cent, while all<br />
other counties in the Area<br />
had lower per cents <strong>of</strong> farms<br />
for which no operator was<br />
indicated.<br />
Sources <strong>of</strong> Income on<br />
Subsistence Farms: Table"<br />
A-14, which shows produc<br />
tion on all Subsistence<br />
farms in the Area by types<br />
<strong>of</strong> crops, reveals the fol<br />
lowing:<br />
1. Banked by total<br />
value <strong>of</strong> products, the<br />
best sources <strong>of</strong> income are<br />
(in order): (a) field<br />
crops, (b) poultry, (c)<br />
livestock, (d) dairy prod<br />
ucts, and (e) vegetables.<br />
2. Hanked according<br />
to the number <strong>of</strong> farms re<br />
ceiving cash incomes from<br />
the types <strong>of</strong> farms listed<br />
are (in order): (a) poul<br />
try, (b) field crops, (c)<br />
livestock, (d) dairy, and<br />
(e) fruits and nuts.<br />
3. Ranked according<br />
to average farm income re<br />
ceived, the best sources<br />
are (in order): (a) vege<br />
tables, (b) forest products,<br />
(c) livestock, (d) dairy<br />
products, and (e) poultry.<br />
The high average farm<br />
income <strong>of</strong> vegetables and<br />
the low number <strong>of</strong> farms<br />
reporting cash income from<br />
them indicate a possible<br />
source <strong>of</strong> income for more<br />
Subsistence farms. Limit<br />
ing factors are market<br />
facilities and growing<br />
conditions.
Tenure<br />
Of the 23,551 farms in the Area in 191*0, 13,1)32, or 57.03<br />
per cent were operated by tenants. Highest tenancy percentages<br />
are found in the Panel I counties and in the first counties <strong>of</strong><br />
Panel II. In Hart county, 71.3 per cent <strong>of</strong> the farmers are<br />
tenants; in Vadison county, 69.6 per cent; in Jackson county,<br />
66.1 per cent; in Barrow county, 65.1 per cent; in Franklin<br />
Suit....<br />
Enfutcrinf<br />
Experiment<br />
Station . . .<br />
Ctorgia<br />
Txh<br />
Indnatrial . .<br />
. . Economic<br />
Research . .<br />
county, 61*.5 per cent; in Forsyth county, 62.1 per cent. The tenancy fig<br />
ure for the Area is not as high as the state percentage <strong>of</strong> 60.1 per cent.<br />
„ .. , _, „ .. . owever, when considered in<br />
Tabl* A-ll* - Continued conjunction with the high<br />
Type o" Crop<br />
Jackson<br />
All products<br />
Products used<br />
Field crops<br />
livestock<br />
Poultry<br />
Fruits and nuts<br />
Vegetables<br />
Dairy<br />
Forest products<br />
Other livestock<br />
White<br />
All products<br />
Products used<br />
Field crops<br />
livestock<br />
Poultry<br />
Fruits and nuts<br />
Vegetables<br />
Dairy<br />
Forest products<br />
Other livestock<br />
Hall<br />
All products<br />
Products used<br />
Field crops<br />
Livestock<br />
Poultry<br />
Fruits and nuts<br />
Vegetables<br />
Dairy<br />
Forest products<br />
Other livestock<br />
Number<br />
<strong>of</strong><br />
Farms<br />
622<br />
622<br />
505<br />
109<br />
309<br />
1*8<br />
35<br />
131*<br />
Value Per<br />
<strong>of</strong> Farm<br />
Products Value<br />
$270,512<br />
157,733<br />
88,988<br />
5,M2<br />
9,768<br />
1,580<br />
1,H*3<br />
12<br />
8<br />
1*,96<br />
691<br />
201<br />
713 $299,907<br />
713 203,277<br />
1*07 68,802<br />
138 7,1*97<br />
379 10,812<br />
81 3,825<br />
31* 1,538<br />
51* 1,287<br />
hO 2,563<br />
13 281<br />
98U 1382,911<br />
981* 221,900<br />
778 1H*,313<br />
2l4l 10,053<br />
1*92 16,383<br />
68 1,356<br />
33 I,d67<br />
235 13,631*<br />
68 3,51*6<br />
11 259<br />
$1*35<br />
251*<br />
176<br />
50<br />
32<br />
33<br />
33<br />
37<br />
58<br />
25<br />
Per<br />
Cent<br />
Unit<br />
Total2<br />
19.65<br />
11.1*6<br />
6.U6<br />
0.39<br />
0.71<br />
0.11<br />
0.08<br />
0.36<br />
0.05<br />
0.01<br />
$1*21 65.56<br />
286 kk.kk<br />
169 15.01*<br />
5k 1.61*<br />
29 2.36<br />
1*7 0.31*<br />
1*5 0.31*<br />
•21* 0.28<br />
6k 0.56<br />
22 0.61<br />
$389<br />
226<br />
11*7<br />
1*2<br />
33 20<br />
kk 58<br />
52<br />
21i<br />
(Table continued on page 219.)<br />
—218—<br />
27.66<br />
16.03<br />
8.26<br />
0.73<br />
1.18<br />
0.10<br />
0.11<br />
0.98<br />
0.26<br />
0.02<br />
Subsistence farm rates, the<br />
figure assumes more signif<br />
icance. Ordinarily, nei<br />
ther subsistency nor tenancy<br />
is in general indicative<br />
<strong>of</strong> a wholesome agricul<br />
tural condition. A. com<br />
bination <strong>of</strong> the two,<br />
therefore, might be ex<br />
pected to be doubly un<br />
desirable. Because <strong>of</strong> the<br />
nature <strong>of</strong> subsistence<br />
farming, it is not gener<br />
ally practised by tenant<br />
farmers. 1 study <strong>of</strong><br />
Tables A-6l and A-12 shows<br />
that subsistence and ten<br />
ancy percentages taken to<br />
gether are in nine coun<br />
ties more than one hundred<br />
per cent, indicating that<br />
some tenant farmers are<br />
also subsistence farmers.<br />
In six counties, onefifth<br />
or more <strong>of</strong> the farm<br />
operators are both ten<br />
ants and subsistence<br />
farmers. This is due in<br />
part to the fact that sone<br />
Subsistence farms are<br />
rented primarily as places<br />
<strong>of</strong> residence.<br />
In the Panel I coun<br />
ties, the subsistence<br />
figure <strong>of</strong> 20.23 per cent,<br />
and the tenancy figure<br />
<strong>of</strong> 67.26 per cent, taken<br />
together, are 87.1(9 per<br />
cent, indicating only a<br />
possible 12.51 per cent<br />
at the least,and 32.71;<br />
at the most,<strong>of</strong> the oper<br />
ators who farm neither<br />
on a subsistence nor a<br />
tenant basis. It is only<br />
by increasing the estimate
<strong>of</strong> the most undesirable condition <strong>of</strong> tenancy-subsistence that<br />
we can approach the maximum estimate <strong>of</strong> the number <strong>of</strong> owneroperators<br />
who do not farm on a subsistence scale (see Tables<br />
A-ll and A-12).<br />
Cotton<br />
Table A-39 indicates that a favorable elimination <strong>of</strong> mar<br />
ginal cotton lands has taken place in the Northeast <strong>Georgia</strong> Area since 1929<br />
In all counties in the Area there has been an almost drastic reduction <strong>of</strong><br />
type <strong>of</strong> Crop<br />
Habersham<br />
All products<br />
Products used<br />
Field crops<br />
Livestock<br />
Poultry<br />
Fruits and nuts<br />
Vegetables<br />
Dairy<br />
Forest products<br />
Other livestock<br />
Lumpkin<br />
All products<br />
Products used<br />
Field crops<br />
livestock<br />
Poultry<br />
Fruits and nuts<br />
Vegetables<br />
Dairy<br />
Forest products<br />
Other livestock<br />
Stephens<br />
All products<br />
Products used<br />
Field crops<br />
livestock<br />
Poultry<br />
Fruits and nuts<br />
Vegetables<br />
Dairy<br />
Forest products<br />
Other livestock<br />
Table A-lli - Continued<br />
Number<br />
<strong>of</strong><br />
Farms<br />
1,006<br />
1,006<br />
501<br />
279<br />
582<br />
75<br />
82<br />
120<br />
73<br />
26<br />
635<br />
635<br />
1.87<br />
123<br />
1*80<br />
169<br />
138<br />
Id<br />
137<br />
36<br />
llSO<br />
1*80<br />
3U7<br />
166<br />
301*<br />
28<br />
32<br />
121<br />
20<br />
10<br />
Value Per<br />
<strong>of</strong> Farm<br />
Products Value<br />
$386,596<br />
283,022<br />
57,W*6<br />
11,999<br />
16,51*2<br />
3,1*13<br />
2,91(1<br />
5,158<br />
i*,581*<br />
1,01*7<br />
$2t*3,l*71*<br />
152,973<br />
51,580<br />
1*,758<br />
12,798<br />
3,271*<br />
9,31*1*<br />
767<br />
7,671<br />
309<br />
«180,536<br />
111*,157<br />
U6,829<br />
5,371i<br />
6,91*2<br />
1,111<br />
827<br />
1*,259<br />
801*<br />
58<br />
$381*<br />
281<br />
115<br />
1*3<br />
28<br />
1*6<br />
36<br />
1*3<br />
63<br />
1*0<br />
$383<br />
21*1<br />
106<br />
39 27<br />
19<br />
68<br />
19<br />
(Table continued on page 220 . )<br />
—219—<br />
Per<br />
Cent<br />
Unit<br />
Total2<br />
1*7.!*1<br />
31*. 71<br />
7.01*<br />
1.1*7<br />
2.03<br />
0.1*2<br />
0.36<br />
0.63<br />
0.56<br />
0.13<br />
65.1th<br />
1*1.11<br />
13.86<br />
1.28<br />
3.1*1*<br />
0.38<br />
2.51<br />
56<br />
9<br />
0.21<br />
2.06<br />
0.08<br />
»376 1*3.55<br />
238 27.51*<br />
135 11.30<br />
32 1.30<br />
23 1.67<br />
1*0 0.27<br />
26 0.20<br />
35 1.03<br />
1*06 0.19<br />
0.01<br />
cotton acreage, and in all<br />
counties except Barrow and<br />
Jackson an accompanying in<br />
crease in yield per acre.<br />
The Area as a whole de<br />
creased its notton acreage<br />
from 306,916 acres in 1929<br />
to 168,2&5 acres in 1939,<br />
a decrease <strong>of</strong> 1;5.18 per<br />
cent. This removal <strong>of</strong><br />
land not well suited to<br />
cotton from cotton acreage<br />
resulted in the increase<br />
in yield per acre for the<br />
Area from O.U6 bales in<br />
1929 to 0.57 bales in<br />
1939, and has permitted<br />
the development <strong>of</strong> other<br />
enterprises which are<br />
likely to prove better<br />
suited to the Area, for<br />
example, hogs and pigs,<br />
and dairy cattle.<br />
The "cotton" counties<br />
<strong>of</strong> the Area are those<br />
where the proportion <strong>of</strong><br />
Subsistence farms is low<br />
est. Those having the<br />
greatest acreages in cot<br />
ton are, in order: Hart,<br />
Jackson, Franklin, Madi<br />
son, Barrow, and Hall.<br />
Hart county decreased<br />
its acreage from 1*3,056<br />
acres in 1929 to 27,71(8<br />
acres In 1939, or ap<br />
proximately 36 per cent.<br />
The concentration <strong>of</strong><br />
cotton on land better<br />
suited to cotton resulted<br />
in a favorable increase<br />
in yield per acre from<br />
0.37 bales in 1929 to<br />
0.66 bales in 1939, the<br />
highest yield in the<br />
Area. Census figures show
Type <strong>of</strong> Crop<br />
Banks<br />
All products<br />
Products used<br />
Field crops<br />
livestock<br />
Poultry<br />
Fruits and nuts<br />
Vegetables<br />
Dairy<br />
Forest products<br />
Other livestock<br />
Onion<br />
All products<br />
Products used<br />
Field crops<br />
livestock<br />
Poultry<br />
Fruits and nuts<br />
Vegetables<br />
Dairy<br />
Forest products<br />
Other livestock<br />
Towns<br />
An products<br />
Products used<br />
Field crops<br />
Livestock<br />
Poultry<br />
Fruits and nuts<br />
Vegetables<br />
Dairy<br />
Forest products<br />
Other livestock<br />
Dawson<br />
All products<br />
Products used<br />
Field crops<br />
Livestock<br />
Poultry<br />
Fruits and nuts<br />
Vegetables<br />
Dairy<br />
Forest products<br />
Other livestock<br />
Table A-1U - Continued<br />
Number<br />
<strong>of</strong><br />
Farms<br />
802<br />
802<br />
692<br />
230<br />
U63<br />
292<br />
17<br />
Iti5<br />
26<br />
7<br />
1,223<br />
1,223<br />
380<br />
512<br />
995 52<br />
2W<br />
87<br />
118<br />
32<br />
710<br />
710<br />
268<br />
221<br />
620<br />
hk 8<br />
69<br />
30<br />
36<br />
Value Per<br />
<strong>of</strong> Faro<br />
Products Value<br />
$326,966<br />
196,932<br />
103,509<br />
6,783<br />
9,322<br />
5,508<br />
50Jj<br />
2,523<br />
1,687<br />
198<br />
*50U,31i8<br />
381,769<br />
32,278<br />
16,991<br />
W.,036<br />
680<br />
20,308<br />
2,089<br />
8,3146<br />
in<br />
$202,856<br />
U»9,lj5ij<br />
1U.1U7<br />
10,655<br />
22,609<br />
1,263<br />
395<br />
2,622!<br />
1,261!<br />
370<br />
U52 $155,559<br />
Jj52 101,815<br />
33U 39,593<br />
86 3,163<br />
305 6,3U2<br />
12 158<br />
12 2,250<br />
10k 973<br />
17 1,237<br />
6<br />
—220—<br />
$U08<br />
21*6<br />
150<br />
29<br />
20<br />
19<br />
30<br />
17<br />
65<br />
28<br />
Per<br />
Cent<br />
Unit<br />
Total2<br />
50.02<br />
30.13<br />
15. 8U<br />
J..0ij<br />
1.U3<br />
0.8U<br />
0.08<br />
0.39<br />
0.26<br />
0.03<br />
*1(12 87.16<br />
312 65.98<br />
85 5.58<br />
33 2.9h<br />
1*1 7.09<br />
13 0.12<br />
8U 3.51<br />
2k 0.36<br />
71 1.U*<br />
2U 0.13<br />
$286<br />
210<br />
53<br />
hS<br />
36<br />
29<br />
U9<br />
38<br />
U2<br />
10<br />
$33U<br />
225<br />
119<br />
37 21<br />
13<br />
52<br />
9<br />
2£<br />
90.28'<br />
66.51<br />
6.30<br />
h.7h<br />
10.06<br />
0.56<br />
0.18<br />
1.17<br />
0.56<br />
0.16<br />
70.95<br />
U6.U*<br />
18.06<br />
l.UU<br />
2.89<br />
0.07<br />
1.03<br />
73<br />
5<br />
o.W.<br />
0.56<br />
0.01<br />
that this de<br />
crease in cotton<br />
acreage has been<br />
accompanied by<br />
an appreciable<br />
increase in the<br />
nunber <strong>of</strong> pigs<br />
and hogs in Hart _ _____<br />
county and a small increase<br />
in the number <strong>of</strong> dairy cat<br />
tle.<br />
j'ackson county, which<br />
decreased its cotton acre<br />
age by almost 50 per cent,<br />
also decreased its yield<br />
from 0.51 bales in 1929 to<br />
O.U8 in 1939. Since Jack<br />
son county had second to<br />
the largest cotton acreage<br />
in the Area, and the yield<br />
was next to lowest, it is<br />
possible that further ad<br />
justment <strong>of</strong> cotton land<br />
can be made. ' •<br />
Franklin and Madison<br />
counties each reduced acre<br />
age by approximately US<br />
per cent and attained a more<br />
favorable yield per acre.<br />
Barrow county, by re<br />
ducing its acreage from<br />
26,978 acres in 1929 to<br />
15,678 acres in 1939, only<br />
maintained its yield per<br />
acre <strong>of</strong> 0.60. However,<br />
Barrow county ranks high<br />
in the Area and has prob<br />
ably made the best elim<br />
ination possible, and by<br />
its reduction <strong>of</strong> cotton<br />
land has helped to permit<br />
a pr<strong>of</strong>itable increase in<br />
the number <strong>of</strong> hogs and<br />
pigs.<br />
Hall county reduced<br />
its acreage approximately<br />
1»8 per cent and increased<br />
its yield from Q.hk to<br />
0.55 bales per acre.<br />
Of the counties<br />
having relatively small<br />
cotton acreage, White<br />
county has apparently
to<br />
l-><br />
I<br />
Counties<br />
Over 70*<br />
Subsistence<br />
Farms<br />
Towns<br />
Union<br />
Rabun<br />
White<br />
Lumpkin<br />
Dawaon<br />
Fiabersham<br />
Total<br />
Under 70*<br />
Subsistence<br />
Banks<br />
Stephens<br />
Hall<br />
Forsyth »<br />
Jackson<br />
liadison<br />
Barrow<br />
Franklin<br />
Hart<br />
Total<br />
Area Total<br />
Panel I<br />
Panel II<br />
All<br />
Farms<br />
50.8<br />
71.5<br />
51*.9<br />
78.2<br />
89.6<br />
I0li.7<br />
73.5<br />
72.9<br />
86.2<br />
82.1<br />
78.1<br />
66.3<br />
79.6<br />
81.3<br />
61*. 8<br />
70.5<br />
61*.7<br />
7l*.l<br />
73.8<br />
69.2<br />
75.9<br />
Average Nurabur <strong>of</strong><br />
Acres Per farm in<br />
Plowable<br />
Pas<br />
ture<br />
5.8<br />
l*.l<br />
3.5<br />
6.6<br />
3.5<br />
6.U<br />
5.8<br />
5.0<br />
7.9<br />
7.7<br />
7.5<br />
1*.9<br />
6.7<br />
lt.1*<br />
3.1.<br />
1*.0<br />
5.3<br />
5.7<br />
5.5<br />
l*.6<br />
5.9<br />
Wood<br />
land<br />
22.3<br />
1*3.6<br />
35.7<br />
1*3.1<br />
62.1<br />
63.0<br />
36.9<br />
1*2.7<br />
32.9<br />
1.0.9<br />
33.5<br />
28.0<br />
20.9<br />
28.1*<br />
15.1<br />
19.6<br />
ll*.6<br />
2li. 9<br />
30.1<br />
21.6<br />
3l*.2<br />
Crop<br />
land<br />
11*. 2<br />
15.0<br />
11.0<br />
2f<br />
16.J<br />
21.6<br />
19.7<br />
16.7<br />
27.1<br />
2l*.l<br />
21*.)*<br />
•»*.!*<br />
37 !o<br />
33.1<br />
30.1*<br />
33. 1*<br />
30.2<br />
26.3<br />
31.9<br />
23.6<br />
Source: Calculated from Table A-l*.<br />
Idle<br />
land<br />
2.5<br />
1*.3<br />
1.6<br />
*.2<br />
3.9<br />
l*.7<br />
5.2<br />
3.7<br />
7.0<br />
U.6<br />
5.2<br />
2.6<br />
6.k<br />
3.3<br />
3.6<br />
5.0<br />
2.1<br />
1*.).<br />
U.2<br />
2.8<br />
1».8<br />
Land<br />
IS<br />
Hi<br />
-
made the most favorable adjustment <strong>of</strong> cotton lands. By elim<br />
inating 3li per cent <strong>of</strong> its land from cotton, the cotton yield<br />
per acre was increased from 0.29 bales, the lowest yield in<br />
the Area, to 0.65 bales, second to highest yield in the Area.<br />
This adjustment has in part resulted in an appreciable increase<br />
in hogs and dairy cattle, which are proving to be pr<strong>of</strong>itable<br />
enterprises for the county.<br />
Land and :<br />
Suit....<br />
Eactflffriaf<br />
Experiment<br />
Station . . .<br />
Ctorgia<br />
Tid,<br />
toduitrul . .<br />
. . EcoaMaic<br />
Rorarcb . .<br />
Land Distribution: In the Northeast <strong>Georgia</strong> Area there is an ap<br />
proximate total land area <strong>of</strong> 2,7lt3,OliO acres, <strong>of</strong> which 63.3 per cent was<br />
in farms in 1939. Hart county has the greatest percentage (90.8 per cent)<br />
<strong>of</strong> land in farms. The other three counties <strong>of</strong> Panel I and the first coun<br />
ty in Panel H have the largest percentage <strong>of</strong> land in farms, chiefly be<br />
cause they con-<br />
Table A-U tain more farm-<br />
Farm. Acreage Operated by Owners in 1939 for Northeast<br />
<strong>Georgia</strong> Area, by Pane3S, Counties by Subsistence<br />
Groups, and bjr Type <strong>of</strong> Ownership<br />
Counties<br />
Over 70jt<br />
Subsistence<br />
Fams<br />
Towns<br />
union<br />
Bahnn<br />
White<br />
Lurapldn<br />
Dawson<br />
fiabersham<br />
Total<br />
Full<br />
Owners<br />
23,037<br />
62,962<br />
35,1*99<br />
to, 751<br />
1*2,1*59<br />
33,869<br />
1*7,771<br />
287,31*8<br />
Acres Farmed by:<br />
Part Owners<br />
Total<br />
3,679<br />
9,11*7<br />
1*,060<br />
ii,871<br />
3,81*9<br />
1,095<br />
7,301*<br />
3l*,005<br />
Owned<br />
2,650<br />
6,675<br />
2,092<br />
2,989<br />
2,756<br />
593<br />
l*,l*33<br />
22,188<br />
Rented<br />
1,029<br />
2,1*72<br />
1,968<br />
1,882<br />
1,093<br />
502<br />
2,871<br />
11,817<br />
Managers<br />
*<br />
1,311<br />
*<br />
*<br />
2,726<br />
1*,037<br />
Under 70* •<br />
Subsistence<br />
Banks to, 173 5,793 3,U55 2,338<br />
Stephens 26,671* 3,379 1,598 1,781<br />
Hall 77,587 10,092 5,51*8 1*,5U*<br />
Forsyth 52,783 i*,587 2,889 1,698<br />
Jackson 57,51*6 16,521* 9,181* 7,31*0<br />
Madison 1*2,930 12,606 6,371* 6,232<br />
Barrow 31,299 6,890 3,61*7 3,21*3<br />
Franklin 52,1,85 11,828 6,352 5,1*76<br />
Hart<br />
1*7,139 5,853 3,1*50 2,1*03<br />
Total 1*29,616 77,552 1*2,1*97 35,055<br />
Area Total<br />
Panel I<br />
Panel II<br />
716,961*<br />
171*, 151<br />
51*2,813<br />
111,557<br />
29,936<br />
81,621<br />
61*,685<br />
16,360<br />
1*8,325<br />
1*6,872<br />
13,576<br />
33,296<br />
•»<br />
5,711<br />
1,177<br />
2,692 it-<br />
823<br />
*<br />
*<br />
10,1*03<br />
ll*,U*0<br />
823<br />
13,617<br />
Sources U. S. Census, Agriculture, GeorgS.a, 191*0,<br />
First Series, Table 2.<br />
*where less than three farms reported, data are<br />
not included.<br />
—282—<br />
able land (see<br />
Table A-5). The<br />
presence <strong>of</strong> the<br />
Chattahoochee<br />
National Forest<br />
accounts for<br />
the small per<br />
centage <strong>of</strong> land<br />
in farms in the<br />
northern coun<br />
ties.<br />
Tables<br />
A-l* and A-lia<br />
give the dis<br />
tribution <strong>of</strong><br />
farm lands ac<br />
cording to use<br />
in 1939. Panel<br />
I shows an ap<br />
preciably higher<br />
percentage <strong>of</strong><br />
land in crops<br />
than Panel II,<br />
and a correspond<br />
ingly lower per<br />
centage <strong>of</strong> wood<br />
land. This<br />
again, however,<br />
is due in part<br />
to the fact that<br />
there is more<br />
plowable land<br />
in the Panel I<br />
counties.<br />
Farm Ma<br />
chinery: STthough<br />
mechanization<br />
has<br />
made consider<br />
able progress in
iH W<br />
fl) H<br />
O CD<br />
71*1<br />
1,325<br />
1,037<br />
921*<br />
81*1<br />
611,<br />
1,386<br />
6,868<br />
1,370<br />
895<br />
2,1*05<br />
2,009<br />
2,223<br />
1,876<br />
1,1.58<br />
2,139<br />
2,308<br />
16,683<br />
23,551<br />
7,651<br />
15,900<br />
0<br />
£<br />
•2> n<br />
«H Q w B<br />
&t»<br />
710<br />
1,223<br />
922<br />
713<br />
635<br />
1.52<br />
1,006<br />
5,661<br />
802<br />
1*80<br />
981*<br />
576<br />
62<br />
519<br />
353<br />
1.31*<br />
100<br />
M70<br />
io,53i<br />
1,51*8<br />
8,983<br />
•H M<br />
w n<br />
•§
No.<br />
Farms<br />
$1000-$lli99<br />
Value<br />
Prod<br />
ucts<br />
Used<br />
6<br />
31 a 5<br />
33<br />
13<br />
3<br />
21*<br />
129<br />
138<br />
122<br />
162<br />
161*<br />
131<br />
235<br />
UO<br />
__ ""**<br />
—<br />
——<br />
—<br />
—<br />
— •<br />
—<br />
$1*,227<br />
15,1*68<br />
25,1*68<br />
26,995<br />
U*,5U<br />
5,275<br />
16,920<br />
11*, 280<br />
7,730<br />
1*3,857<br />
1*0,815<br />
35,766<br />
61*, 878<br />
53,791*<br />
U»,361*<br />
52,287<br />
Over $10,000<br />
—- .<br />
Per<br />
Farm<br />
Value<br />
1701*<br />
1*99<br />
1*72<br />
1*91<br />
1*39<br />
1*05<br />
1*31*<br />
357<br />
322<br />
369<br />
296<br />
293<br />
1*00<br />
328<br />
339<br />
221*<br />
—<br />
• ——<br />
""**"<br />
ii ^ b i<br />
P 5 re § as<br />
(5 H 1 p. O<br />
-"-o-fu / tr<br />
39 a i-B<br />
Q ffi **<br />
is£.&» H.°8s.s<br />
:H-*<br />
&<br />
4*2 a m 2<br />
r~* W ^ r-f<br />
Vn.4 fii vo H-<br />
B> (D<br />
g^ ff B8<br />
w «££ e*-<br />
o\o» o> *3<br />
v • Sf* I* E<br />
Fssg"<br />
p. H p (ft<br />
i ° 8 o S-<br />
o o ft o 3<br />
SJ 2. 2 M »<br />
4o P<br />
8&^i<br />
"gfrgg Ss ' ff<br />
^ . —<br />
" J<br />
f ml S0!f f f (1<br />
§.§ 1. jj 8 B.| • II<br />
: I- •': if: |<br />
Table A-63<br />
I<br />
to<br />
I<br />
Counties<br />
Over 70$<br />
Subsist<br />
ence No.<br />
Farms Farms<br />
Towns 383<br />
Union 2«5<br />
Rabun 180<br />
White 185<br />
Lumpkln 236<br />
Dawson 229<br />
Habershai 1278<br />
Under 70j{<br />
Subsistence<br />
Banks 277<br />
Stephens 217<br />
Hall im<br />
Forsyth 212<br />
Jackson 290<br />
Madison 19I|<br />
Barrow 119<br />
Franklin 175<br />
Hart 96<br />
Under $250<br />
Value<br />
Prod<br />
ucts<br />
Used<br />
$50,995<br />
1*2,530<br />
25,550<br />
23,173<br />
27,661<br />
2!*, 295<br />
33.965<br />
28,277<br />
20,905<br />
1*2,781*<br />
19,026<br />
2l*,38u<br />
16,1*05<br />
10,726<br />
11*,657<br />
6.956<br />
Over 70$<br />
Subsistence Sl500-$21*99<br />
Towns<br />
Rabun<br />
White<br />
Lumpkin<br />
_Q«<br />
11 5,387<br />
26 15,1*62<br />
69 3,1*20<br />
U.590<br />
Value <strong>of</strong> Products Consumed by Counties Classified by Per Cent<br />
<strong>of</strong> Subsistence Farms for levels <strong>of</strong> Total Production<br />
Per<br />
Farm<br />
Value<br />
$133<br />
11*9<br />
11*2<br />
125<br />
117<br />
106<br />
122<br />
102<br />
96<br />
99<br />
90<br />
81*<br />
8<br />
90<br />
8U<br />
72<br />
1*90<br />
595<br />
1*28<br />
510<br />
No.<br />
Farms<br />
195<br />
363<br />
276<br />
216<br />
229<br />
161*<br />
1*17<br />
378<br />
21*9<br />
566<br />
1*81<br />
1*1*9<br />
1*19<br />
199<br />
1*16<br />
1*03<br />
|250-$399<br />
Value<br />
Prod<br />
ucts<br />
Used<br />
$1*2,928<br />
99,372<br />
78,056<br />
50,11*7<br />
1*2,662<br />
30,71*5<br />
100,290<br />
3 1,01*5<br />
2,375<br />
— —.<br />
— —<br />
Per<br />
Farm<br />
Value<br />
$220<br />
271*<br />
283<br />
232<br />
186<br />
187<br />
21*1<br />
No.<br />
Farms<br />
112<br />
391<br />
288<br />
236<br />
183<br />
120<br />
389<br />
$l*00-$599<br />
Value<br />
Prod<br />
ucts<br />
Used<br />
$36,752<br />
ll*!*,907<br />
116,681*<br />
70,1*07<br />
1*8,156<br />
33,21*5<br />
122,336<br />
Per<br />
Farm<br />
Value<br />
$328<br />
371<br />
1*05<br />
298<br />
263<br />
277<br />
311*<br />
No.<br />
Farms<br />
1*0<br />
200<br />
182<br />
216<br />
13<br />
71<br />
192<br />
$600-8999<br />
Value<br />
Prod<br />
ucts<br />
Used<br />
$18,11*1*<br />
90,536<br />
8U.839<br />
82,113<br />
50,967<br />
28,275<br />
63,091*<br />
66,007 175 385 91,250 237 260 87,968<br />
1*3,861* 176 21*0 57,372 239 119 36,988<br />
87,926 155 617 135,851* 220 513 Il*l*,l»'i3<br />
67,560 11*0 596 110,358 185 1*65 118,31*2<br />
59,062 132 61*1 120,088 187 51*3 11*0,185<br />
51*,9l)6 131 1*88 95,705 196 519 11*3 ,971<br />
27,91*8 11*0 373 78,127 209 1*72 129, 1*1*9<br />
56,595 136 651 121,756 187 615 160,882<br />
39,261 97 712 91,078 128 699 118,821<br />
$2500-$3999 $l*000-$5999 $6000-$9999<br />
—— •*- " «<br />
3U8<br />
1*75 3 1,51*0 513 ——<br />
——<br />
.— — ~ —— ——<br />
——<br />
— •— — •<br />
— ~<br />
— ~<br />
Per<br />
Farm<br />
Value<br />
$1*51*<br />
1*51<br />
1*66<br />
380<br />
372<br />
398<br />
329<br />
338<br />
311<br />
282<br />
251*<br />
258<br />
277<br />
271*<br />
262<br />
169
O CO 4<br />
13- H- 8.'<br />
ci- 5 w c* g 5<br />
><br />
re<br />
S-<br />
0<br />
g<br />
o<br />
3<br />
re<br />
H-<br />
(0<br />
1 TO<br />
p- !5 & " ft <br />
B » n » C o<br />
.0.0 P<br />
Such increase may result from an Increased volume <strong>of</strong> crops<br />
per worker, or from a shift to higher value crops. The first Stiu ....<br />
Enfioccrittf<br />
may call for more land per worker, a combination <strong>of</strong> crops per Experiment<br />
mitting double cropping <strong>of</strong> the present land per worker, or<br />
StJtion . . .<br />
Giocgia<br />
intensified soil building to increase the yield per acre. If a TrOl<br />
shift to higher value crops is not practical, that is, if a<br />
Industrial . .<br />
• . Economic<br />
field crop fans is now producing crops to which its soil, labor,<br />
management, and markets are best suited, then the one best means<br />
<strong>of</strong> increasing income is through the improvement <strong>of</strong> farm practices.<br />
In Table A-7, the number <strong>of</strong> automobiles, trucks, and tractors owned<br />
on farms in 1939 are shown. Automobiles and even trucks will be owned and<br />
used by both Subsistence and non-subsistence fanes, but tractors are only<br />
pr<strong>of</strong>itable when farming operations <strong>of</strong> size are carried on. Table A-62<br />
analyzes the use <strong>of</strong> tractors on the assumption that an tractors will be<br />
found on non-subsistence farms. Somewhat suprisingly, this shows that in<br />
the seven counties with the highest rates <strong>of</strong> Subsistence farms (over 70<br />
per cent) are found the smallest numbers <strong>of</strong> non-subsistence farms per<br />
Table A-lil '<br />
Counties<br />
Over 70!t<br />
Subsistence<br />
Farms<br />
Towns ....<br />
Union ....<br />
Rabun ....<br />
Whit£ ....<br />
Lumpkin. ...<br />
Bawson ....<br />
Habersham ...<br />
Total. . . .<br />
Under 70$<br />
Subsistence<br />
Banks ....<br />
Stephens ...<br />
Hall. ....<br />
Forsyth. ...<br />
Jackson. ...<br />
Madison. ....<br />
Barrow ....<br />
Franklin . . .<br />
Hart. ....<br />
Total. . . .<br />
Area Total<br />
Panel I<br />
Panel II<br />
Farm Wages in the Northeast <strong>Georgia</strong> Area, 1939, by<br />
Panels, and Counties by Subsistence Groups<br />
Total<br />
Wages<br />
Dollars<br />
3,21*2<br />
11,279<br />
27,91*8<br />
2,52k<br />
6,796<br />
3,039<br />
63,919<br />
118.7W<br />
21,1*91*<br />
18,507<br />
51*,735<br />
10,173<br />
119,029<br />
90,625<br />
Ii7,959<br />
55,609<br />
58,012<br />
1*76,11*3<br />
591*, 890<br />
206,769<br />
388,121<br />
Uonthly Wages<br />
Per<br />
Dollars Cent<br />
602<br />
878<br />
6,621*<br />
1,10.7<br />
2,696<br />
18,806<br />
31,023<br />
11,968<br />
7,1*61<br />
22,571<br />
5,705<br />
U*,53i<br />
57,022<br />
16,277<br />
15,151*<br />
36,352<br />
217,01*1<br />
21*8,061*<br />
115,356<br />
132,708<br />
18.57<br />
7.78<br />
23-70<br />
56.11*<br />
39.67<br />
29.1*2<br />
26.13<br />
55.68<br />
1*0.31<br />
1*1.21*<br />
56.08<br />
37.1*1<br />
62.92<br />
33.91*<br />
27.25<br />
62.66<br />
1*5.53<br />
1*1.70<br />
55.79<br />
31*. 19<br />
Daily or<br />
Weekly Wages<br />
Per<br />
Dollars Cent<br />
511<br />
9,1*79<br />
U*,51*9<br />
61*5<br />
815<br />
3,031*<br />
37,731<br />
66,761*<br />
7,983<br />
10,030<br />
25,116<br />
3,193<br />
52,1*05<br />
27,615<br />
27,008<br />
31*, 038<br />
20,751<br />
208,189<br />
271*, 953<br />
78,567<br />
196,386<br />
15-76<br />
81*-0l*<br />
52.06<br />
25-55<br />
11-99<br />
99.81*<br />
59-03<br />
56.22<br />
37.11*<br />
51*. 20<br />
1*5-89<br />
31-39<br />
1*1*. 03<br />
30. 1*7<br />
56.31<br />
61.30<br />
35-77<br />
1*3.73<br />
1*6.22<br />
38.00<br />
50.60<br />
Other Wages<br />
Per<br />
Dollars Cent<br />
2,129<br />
922<br />
6,775<br />
1*62<br />
3,285<br />
5<br />
7,382<br />
20,960<br />
1,51*3<br />
1,016<br />
7,01,8<br />
1,275<br />
22,093<br />
5,988<br />
l*,67l*<br />
6,367<br />
909<br />
50,913<br />
71,873<br />
12,81*6<br />
59,027<br />
Source: U. S. Census, Agriculture. <strong>Georgia</strong>. 191*0, Second Series,<br />
Table 10. ——— — ——<br />
—226—<br />
65-67<br />
8.17<br />
21*. 21*<br />
18.30<br />
1*8.31*<br />
11.55<br />
17.65<br />
7.18<br />
5.1*9<br />
12.38<br />
12.53<br />
18.56<br />
6.61<br />
9.75<br />
ll.!*5<br />
1.57<br />
10.69<br />
12.03<br />
6.21<br />
15.21
tractor. Thus, in Towns county there is one tractor for every<br />
li.li <strong>of</strong> the 31 non-subsistence farms, while in Hart county there<br />
is one tractor for every 36.8 non-subsistence farms. While<br />
Table A-62 also shows the number <strong>of</strong> farms per tractor on a total<br />
farm basis, where the proportion <strong>of</strong> Subsistence farms is so<br />
overwhelming, the figure is distorted by including so-called<br />
farms which could never use a tractor. Many tractors are <strong>of</strong><br />
course used on more than one farm. They will be used not only<br />
on the owners' farm but for custom work as well, such as harrowing,<br />
Exp<br />
Station . . .<br />
Grarna<br />
T«h<br />
hdutrul . .<br />
. . Ecoaomk<br />
Ratuch . .<br />
threshing, and grain harvesting on neighboring farms. Therefore, some <strong>of</strong><br />
these tractors were <strong>of</strong> value to many more farms than to the 532 who owned<br />
them.<br />
Table A-65<br />
County<br />
Data on Work <strong>of</strong>f Farm by Farm Operators in Northeast<br />
<strong>Georgia</strong> Area by Counties, Arranged by Per Cen'<br />
Working 100 Days or More<br />
State<br />
Rabun<br />
Habersham<br />
Towns<br />
Union<br />
lumpkin<br />
Stephens<br />
Hall<br />
White<br />
Jackson<br />
Banks<br />
Barrow<br />
Franklin<br />
Dawson<br />
Forsyth<br />
Madison<br />
Hart<br />
Number<br />
<strong>of</strong> AH<br />
Farms<br />
216,033<br />
1,037<br />
1,386<br />
7ld<br />
1,325<br />
81tl<br />
895<br />
2,1(05<br />
92k<br />
2,223<br />
1,370<br />
1,1*58<br />
2,139<br />
61U<br />
2,009<br />
1,876<br />
2,308<br />
V<br />
Work <strong>of</strong>f Farm<br />
Number<br />
1(8,01(0<br />
1(1(7<br />
663<br />
329<br />
515<br />
278<br />
269<br />
571<br />
300<br />
U7U<br />
396<br />
378<br />
1(63<br />
181;<br />
1(09<br />
362<br />
267<br />
Per<br />
Cent<br />
Average Days<br />
Worked by<br />
Full<br />
Own<br />
ers<br />
22.3 167<br />
143.1 199<br />
1(7.8 160<br />
UuU 108<br />
38.9 ru,<br />
33.1 131<br />
30.1 157<br />
23.7 171*<br />
32.5 113<br />
21.3 166<br />
28.9 120<br />
25.9 126<br />
21.6 . 126<br />
30.0 88<br />
20.U 100<br />
19.3 123<br />
11.6 118<br />
Part<br />
Own<br />
ers<br />
Ten<br />
ants<br />
12li 93<br />
136 172<br />
98 10k<br />
9U 102<br />
83 95<br />
8U 113<br />
81 81<br />
122 Hd<br />
75 97<br />
130 89<br />
26 61<br />
99 63<br />
111 69<br />
86 60<br />
96 63<br />
UiU 57<br />
99 70<br />
Worked Over<br />
100 Days<br />
Number<br />
22,09U<br />
320<br />
316<br />
13U<br />
227<br />
121<br />
116<br />
297<br />
108<br />
193<br />
103<br />
101(<br />
151<br />
1(0<br />
112<br />
92<br />
75<br />
Source: D. S. Census, Agriculture, <strong>Georgia</strong>, 191(0, Sec<br />
ond Series, Table 9.<br />
Percentage figures are per cent <strong>of</strong> all farms.<br />
Per<br />
Cent1<br />
10.23<br />
30.36<br />
22.80<br />
18.08<br />
17.13<br />
li(.39<br />
12.96<br />
12.35<br />
11.69<br />
8.63<br />
7.52<br />
7.13<br />
7.06<br />
6.51<br />
5.57<br />
U.90<br />
3.25<br />
—227--
Dairy and Livestock<br />
livestock in the Northeast <strong>Georgia</strong> Area has shown material<br />
increases since 1930. Although the 1939 income from livestock am<br />
dairy products (5-81 per cent <strong>of</strong> the total income) is at.ni. belor<br />
the state average (11.5), the industry is presenting itself as<br />
one <strong>of</strong> possibilities, and as a solution to many <strong>of</strong> the agricul<br />
tural prcbleais <strong>of</strong> the Area (see Table A-28).<br />
Suu ....<br />
Enginccrinc<br />
Experiment<br />
Station . . .<br />
Gneaia<br />
Ttdi<br />
Indonriil . .<br />
. . Ecoaomk<br />
Ruearcb . .<br />
An increase in the near future <strong>of</strong> about 16 per cent over the 1939 to<br />
tals appeai-s to be a reasonable expectation. This increase should be<br />
fitted to the best individual feed pattern <strong>of</strong> each farm. In general, the<br />
types <strong>of</strong> operation suitable for livestock expansion in the Northeast<br />
<strong>Georgia</strong> Area are, in order <strong>of</strong> their probable importance: (1) beef cattle,<br />
(2) poultry, (3) hogs, (It) dairy herds for urban consumption, (5) dairy<br />
herds for processing, and (6) sheep.<br />
Table A-5<br />
Kumber and Average Size <strong>of</strong> Farms, 1939 and 1929, and Per Cent<br />
<strong>of</strong> Land in Farms, 1939, for All the Counties in the<br />
Northeast <strong>Georgia</strong> Area by_ Panels and<br />
Counties by Subsistence Groups<br />
Counties<br />
Over 10%<br />
Subsistence<br />
Farms<br />
Towns<br />
Union<br />
Eabun<br />
Unite<br />
Lumpkin<br />
Dawson<br />
Habersham"<br />
Total<br />
Under 10%<br />
Subsistence<br />
Banks<br />
Stephens<br />
Hall<br />
Forsyth<br />
Jackson<br />
Uadison<br />
Barrow<br />
Franklin<br />
Hart<br />
Total<br />
Area Total<br />
Panel I<br />
Panel II<br />
Kumber<br />
<strong>of</strong> Farms<br />
1939<br />
71*1<br />
1,325<br />
1,037<br />
92k<br />
8id<br />
6114.<br />
1,386<br />
6,868<br />
1,370<br />
895<br />
2,1.05<br />
2,009<br />
2,223<br />
1,676<br />
1,1*58<br />
2,139<br />
2,308<br />
16,683<br />
23,551<br />
7,651<br />
15,900<br />
1929<br />
663<br />
1,117<br />
769<br />
921<br />
817<br />
685<br />
1,216<br />
6,188<br />
1,667<br />
1,230<br />
2,832<br />
2,169<br />
2,979<br />
2,601<br />
1,861<br />
2,631<br />
2,593<br />
20,563<br />
26,751<br />
9,221;<br />
17,527<br />
Total<br />
Land<br />
Area<br />
(Acres)<br />
1939<br />
110,080<br />
20l*,l60<br />
236,160<br />
155,520<br />
186,880<br />
136,320<br />
181,120<br />
1,210,21*0<br />
12(7,81(0<br />
115,200<br />
272,61tO<br />
155,520<br />
215,680<br />
179,81(0<br />
109,1(1(0<br />
172,160<br />
161(,1(80<br />
1,532,800<br />
2,71(3,01(0<br />
609,280<br />
2,133,760<br />
—228—<br />
Per<br />
Cent<br />
Land<br />
in<br />
Farns<br />
1939<br />
31*. 2<br />
1*6.1*<br />
2l(.l<br />
1*6.U<br />
1(0.3<br />
1*7.2<br />
5U.7<br />
1*1-3<br />
79.S<br />
63.8<br />
68.8<br />
85.6<br />
82.0<br />
8U.8<br />
86.3<br />
87.7<br />
90.8<br />
80.7<br />
63.3<br />
86.9<br />
56.6<br />
Average Size<br />
<strong>of</strong> Farms<br />
(Acres)<br />
1939<br />
50.8<br />
71.5<br />
5ii.9<br />
78.2<br />
89.6<br />
lDlt.7<br />
71.5<br />
72.9<br />
86.<br />
82.1<br />
78.1<br />
66.3<br />
79.6<br />
81.3<br />
6U.8<br />
70.5<br />
6U.7<br />
7U.1<br />
73.8<br />
69.2<br />
75.9<br />
1929<br />
72.1<br />
90.0<br />
66.5<br />
91.1s<br />
91.0<br />
lOlt.2<br />
85.7<br />
86.2<br />
73-9<br />
61.1*<br />
72.5<br />
51*.o<br />
57.5<br />
53.0<br />
1(9.0<br />
5U.6<br />
52.0<br />
58.lt<br />
61j.8<br />
52.2<br />
71-5<br />
Source:<br />
U. S. Census<br />
Agriculture,<br />
<strong>Georgia</strong>, 19UO,<br />
First Series,<br />
Table 1.
Greater opportunity for expanding livestock operations ap<br />
pears to exist in the southern and eastern parts <strong>of</strong> the Area,<br />
including Rabun, Habersham, Stephens, Hall, Banks, Franklin,<br />
Hart, Barrow, Jackson, and Madison, and, to a less extent in<br />
Forsyth, Bauson, Lumpkin, Unite, Union, and Towns.<br />
While poultry is included in the above list, it is re<br />
stricted to general farn poultry and laying flocks in the later<br />
Stal. ....<br />
Engineering<br />
Experiment<br />
Station . . .<br />
<strong>Georgia</strong><br />
Tick<br />
Industrial . .<br />
. . Ecoaomk<br />
Reaearch . .<br />
discussion <strong>of</strong> feed, for the reason that the broiler specialty farms usually<br />
buy most <strong>of</strong> their feed. In consequence <strong>of</strong> this, feed for broilers does<br />
ncj; appear to be a burden on the feed production <strong>of</strong> the Area.<br />
In general, the Area is short on hay, has an excess <strong>of</strong> pasture, and<br />
is close to its needs for grains. The pasture and hay situation showed improvenent<br />
in 1939.- and a continuation <strong>of</strong> this trend nay reasonably bring<br />
about a oetter balance.<br />
Table A-6<br />
Counties<br />
Over 1Q>%<br />
Subsistence<br />
Farms<br />
Value <strong>of</strong> Farms, Land, Buildings, Implements, and Machinery<br />
for the Northeast <strong>Georgia</strong> Area, 19UO, by Panels<br />
and Counties by Subsistence Groups<br />
Tonns .......<br />
flhite .......<br />
Total. ......<br />
Under 70%<br />
Subsistence<br />
Banks .......<br />
Hall. .......<br />
Uadison. ......<br />
Franklin ......<br />
Hart. .......<br />
Total. ......<br />
Panel I. ......<br />
Panel II ......<br />
Source: U. S. Census,<br />
Tables 1 and 2.<br />
Value<br />
<strong>of</strong><br />
Farms<br />
$ 876,329<br />
1,679,031<br />
2,015,1,80<br />
1,039,515<br />
855,223<br />
706,701<br />
2,583,153<br />
9,785,1,32<br />
1,833,999<br />
1,599,279<br />
3,665,657<br />
2,619,81,7<br />
1,, 118,1,96<br />
3,3^,1,75<br />
3,219,560<br />
3,675,1,26<br />
1,,072,736<br />
28,11,7,1,75<br />
37,932,907<br />
13, 251,, 618<br />
21,, 678, 289<br />
Land, Buildings<br />
Per<br />
Farm<br />
$1,183<br />
1,267<br />
1,972<br />
1,125<br />
1,017<br />
1,151<br />
1,861,<br />
1,1^5<br />
1,339<br />
1,787<br />
i,52U<br />
1,301,<br />
1,853<br />
1,782<br />
2,208<br />
1,718<br />
1,765<br />
1,687<br />
1,611<br />
1,732<br />
1,552<br />
Per<br />
Acre<br />
*23.30<br />
17-72<br />
35-90<br />
11,. 39<br />
11.35<br />
10.99<br />
26.05<br />
19.55<br />
15.51,<br />
21.76<br />
19.53<br />
19.67<br />
23.29<br />
21.93<br />
3l,.07<br />
2k. 36<br />
27.28<br />
22.76<br />
21.81,<br />
25-03<br />
20. U,<br />
Machinery and<br />
Implements<br />
Total<br />
Value<br />
* 3U.U98<br />
97,805<br />
71,, 231,<br />
59,761,<br />
53,683<br />
35,377<br />
168,191<br />
523,552<br />
12U.072<br />
88,263<br />
21^,738<br />
155,339<br />
261,, 1A3<br />
226,785<br />
220,289<br />
267.5U,<br />
285,289<br />
1,871,, 702<br />
2,398,352<br />
887,800<br />
1,510,552<br />
Agriculture, <strong>Georgia</strong>, 191,0, First Series,<br />
—229—<br />
Value<br />
Per<br />
Farm<br />
*k7<br />
7k<br />
72<br />
65<br />
61,<br />
58<br />
121<br />
76<br />
91<br />
99<br />
101<br />
77<br />
119<br />
121<br />
151<br />
125<br />
121,<br />
112<br />
102<br />
116<br />
95
Hogs and Figs; Table A-39, which shows a marked decrease<br />
in cotton plantings, indicates that there has been a favorable<br />
elimination <strong>of</strong> marginal land fron cotton acreage. The indica<br />
tions are that much <strong>of</strong> this land diverted from cotton will be<br />
used for the production <strong>of</strong> feed for livestock, especially for<br />
pigs and hogs, and if good land selection is made, and proper<br />
feeding practices followed, the change will result in a more<br />
wholesome balance.<br />
Suu ....<br />
EflfiBitriflf<br />
Experiment<br />
Suttoo . . .<br />
<strong>Georgia</strong><br />
T«*<br />
ladutriil . .<br />
. . Economic<br />
Reftarcb . .<br />
The greatest livestock increases between 1930 and 191*0 have been in<br />
pigs and togs, as is shown in Table A-6"9, which indicates such an increase.<br />
in every county except two. Greatest percentages <strong>of</strong> increase were in Forsyth<br />
county (126.L7 per cent); Hart (122.92 per cent); Jackson (63.37 per<br />
cer.t); White (70.1>6 per cent); Habersham (63.60 per cent); Hall (60.77<br />
per cent) and Franklin (55-97 per cent). Table A-39 shows that in all<br />
counties in the Area there has been a substantial reduction in cotton<br />
Table A-7<br />
liunber <strong>of</strong> Automobiles, Trucks, and Tractors on Farms in the Northeast<br />
<strong>Georgia</strong> Area, 1939, by_ Panels and Counties by Subsistence Groups<br />
Counties<br />
Over 70%<br />
Subsistsr.ee<br />
Farms<br />
Towns<br />
Union<br />
Itobun<br />
Tihite<br />
Lumpkin<br />
Dawson<br />
Habersham<br />
Total<br />
Under 70!6<br />
Subsistence<br />
Banks<br />
Stephens<br />
Hall<br />
Forsyth<br />
Jackson<br />
Zladison<br />
Barrow<br />
Franklin<br />
Hart<br />
Total<br />
Area Total<br />
Panel I<br />
Panel n<br />
Autooobiles<br />
on Fanns<br />
Faras<br />
Heporting<br />
13U<br />
177<br />
208<br />
176<br />
153<br />
231<br />
357<br />
l,Utl<br />
ii86<br />
339<br />
796<br />
771<br />
779<br />
772<br />
533<br />
827<br />
1,001*<br />
6,357<br />
7,798<br />
3,130<br />
1*,668<br />
Number<br />
11*0<br />
180<br />
221*<br />
181*<br />
173<br />
21*8<br />
380<br />
1,529<br />
510<br />
359<br />
853<br />
797<br />
836<br />
826<br />
611<br />
856<br />
1,01*0<br />
6,688<br />
8,217<br />
3,271*<br />
1*,3B<br />
Motor Trucks<br />
on Farms<br />
Farms<br />
.Report<br />
ing<br />
32<br />
78<br />
115<br />
67<br />
111<br />
31<br />
126<br />
560<br />
76<br />
1»8<br />
175<br />
11,6<br />
111<br />
72<br />
72<br />
107<br />
72<br />
879<br />
1,1*39<br />
362<br />
1,077<br />
Number<br />
35<br />
82<br />
12!*<br />
70<br />
120<br />
31*<br />
135<br />
600<br />
73<br />
50<br />
189<br />
150<br />
121<br />
82<br />
77<br />
111<br />
72<br />
930<br />
1,530<br />
381<br />
1,11*9<br />
Tractors<br />
on Farms<br />
Farms<br />
Report<br />
ing<br />
7<br />
22<br />
10<br />
9<br />
11<br />
21<br />
33<br />
113<br />
33<br />
25<br />
36<br />
1*3<br />
65<br />
62<br />
29<br />
62<br />
59<br />
1*19<br />
532<br />
198<br />
331*<br />
Number<br />
7<br />
23<br />
10<br />
9<br />
11<br />
21<br />
37<br />
118<br />
33<br />
26<br />
39<br />
it9<br />
73<br />
68<br />
31<br />
66<br />
60<br />
1*1*5<br />
563<br />
208<br />
355<br />
Tractors<br />
Farms . Aver<br />
Report age<br />
ing Date<br />
1936-1*0 Latest<br />
Model Model<br />
2<br />
10<br />
2<br />
5<br />
h<br />
2<br />
12<br />
37<br />
19<br />
7<br />
10<br />
7<br />
1*0<br />
35<br />
12<br />
20<br />
13<br />
163<br />
200<br />
67<br />
133<br />
Source: U. S. Census, Agriculture. <strong>Georgia</strong>, 191*0. Second Series,<br />
Table 10.<br />
———'<br />
—230—<br />
1931<br />
1931<br />
1930<br />
1931<br />
1931<br />
1927<br />
1932<br />
1931<br />
1932<br />
1927<br />
1929<br />
1929<br />
1935<br />
1932<br />
1932<br />
1929<br />
1928<br />
1932<br />
1931<br />
1931<br />
1931
acreage andjwlth the exception <strong>of</strong> Barrow and Jackson counties,<br />
an increase in yield per acre.<br />
Forsyth county, which shows the greatest increase in the<br />
number <strong>of</strong> pigs and hogs since 1930, shows a decrease in cotton<br />
acreage <strong>of</strong> approximately h2 per cent and a slight increase in<br />
yield per acre. Production <strong>of</strong> cattle for milk and beef shows<br />
little change.<br />
State ....<br />
Eaibuniv<br />
ExjMnmnt<br />
Surio. . . .<br />
Gtorgia<br />
Tid,<br />
IndMtrul . .<br />
Roaitb .<br />
fiart county in 1939 showed an increase in hog production <strong>of</strong> approxi<br />
mately 123 per cent. A small increase is reported for dairy cattle. These<br />
increases are partly accounted for in the decrease in cotton acreage. Eart<br />
county reduced its cotton acreage from. U3.056 acres in 1930 to 27,7U8 acres<br />
in 19UO, or approximately 35 per cent. The elimination <strong>of</strong> marginal cot<br />
ton land resulted in an advantageous increase in cotton yield per acre<br />
from 0.3 bales to 0.66 bales, the highest in the Area, and permitted a<br />
pr<strong>of</strong>itable increase in livestock.<br />
Jackson county reduced cotton acreage 50 per cent, with only a<br />
slight reduction in yield per acre from 0.51 to O.ljS bales. It the same<br />
time there was an 88 per cent increase in the production <strong>of</strong> hogs and<br />
pigs.<br />
Unite county, in decreasing its cotton acreage, increased its yield<br />
per apre from 0.29 in 1930 to 0.65 (the second highest yield in the Area)<br />
in 191*0. This decrease was accompanied by an increase <strong>of</strong> over 70 per<br />
cent in production <strong>of</strong> hogs.<br />
county decreased its cotton acreage from 32, 390 acres in 1930<br />
to 16,731 acres in 191*0 (approximately 1*8 per cent) and increased- its hog<br />
production from 3^68 to 3^L6li (approximately 65 per cent). The conver<br />
sion will probably prove advantageous since the cotton yield per acre was<br />
increased from 0.1*1* bales to 0.55 bales.<br />
Stephens county decreased its cotton acreage from 13,103 acres in<br />
1930 to 5,383 acres in 191*0, increasing the yield per acre from O.lil'to<br />
0.51 bales. The lumber <strong>of</strong> hogs and pigs increased from 97U to 1,1; 17.<br />
Barrow county, while decreasing its acreage from 26,978 acres to<br />
15,678 acres, a decrease <strong>of</strong> approximately 1*2 per cent, only maintained<br />
its average yield per acre <strong>of</strong> 0.60 bales, which is above the Area aver<br />
age <strong>of</strong> 0.57 and well above the state average <strong>of</strong> 0.1*9- A comparatively<br />
small increase was made in cattle and hogs.<br />
Madison county eliminated approximately 1*6 per cent <strong>of</strong> its cotton<br />
acreage and thereby increased the yield per acre from 0.1*9 bales to 0.59<br />
bales. An accompanying increase <strong>of</strong> approximately 50 per cent was made<br />
in the number <strong>of</strong> pigs and hogs.<br />
Franklin county reduced its cotton acreage approximately Ii5 per<br />
cent from 1930 to 191*0 and increased its yield per acre from 0.1*1 bales<br />
to 0,56 bales. An accompanying increase <strong>of</strong> 55.97 per cent was made in<br />
number <strong>of</strong> hogs and pigs, and a smaller one in cattle.<br />
Habersham county, having a total cotton acreage <strong>of</strong> only3,H3 acres<br />
in 191*0, increased the yield per acre from 0.3U bales in 1930 to 0.58<br />
bales in 191*0 by reducing its cotton acreage by approximately 1*1* per<br />
sent. The number <strong>of</strong> pigs and hogs in Habersham county increased by<br />
——231—
I<br />
Counties<br />
Over 70$<br />
Subsiftence<br />
Farms<br />
Towna<br />
Union<br />
Rabun<br />
White<br />
Lunpkin<br />
Devaon<br />
ilabergham<br />
Total<br />
Under 70$<br />
Subsistence<br />
Banks<br />
Stephens<br />
Hall<br />
Forsyth<br />
Jackson<br />
iadlson<br />
Harrow<br />
Franklin<br />
Hart<br />
Total<br />
Area Total<br />
Panel I<br />
Panel II<br />
Milk Cattle<br />
Per<br />
Cent<br />
1939 1929 Change<br />
1,238<br />
1,771<br />
1,570<br />
1,253<br />
1,018<br />
730<br />
2.016<br />
9,596<br />
1,052<br />
1,560<br />
1,203<br />
890<br />
785<br />
729<br />
1,1(95<br />
7,711*<br />
1,877 1,722<br />
1.W7 1,319<br />
3,1*71; 3,101<br />
2,368 2,283<br />
2,560 2,756<br />
2,560 2,530<br />
1,711 1,761.<br />
2,9l*U 2,575<br />
2,852 2,101<br />
21,783 20,1(51<br />
31,379 28,165<br />
9,1.91 8,978<br />
21,888 19,187<br />
+17.68<br />
+U.53<br />
+30.51<br />
+1)0.79<br />
+29.68<br />
+ o.m<br />
+31..85<br />
+2l|.liO<br />
+ 9.00<br />
+ 8.95<br />
+12.03<br />
+ 3.72<br />
- 7.11<br />
+ 1.19<br />
- 3.00<br />
+11.33<br />
+18.78<br />
+ 6.51<br />
+11.1(1<br />
+ 5.71<br />
+1U.08<br />
Beef Cattle<br />
Per<br />
Cent<br />
1939 1929 Change<br />
3<br />
35<br />
106<br />
8k<br />
68<br />
25<br />
52<br />
373<br />
30<br />
29<br />
112<br />
11*<br />
91*<br />
1*3<br />
31<br />
11*6<br />
258<br />
757<br />
1,130<br />
31*6<br />
781*<br />
26<br />
19<br />
27<br />
99<br />
1.5<br />
2<br />
11»<br />
232<br />
6<br />
6<br />
85<br />
1*<br />
60<br />
1*1*<br />
13<br />
86<br />
30<br />
331*<br />
566<br />
91<br />
1*75<br />
-88.1*6<br />
-8!i.21<br />
+292.59<br />
-15.15<br />
+51.11<br />
41,150.00<br />
4271.1*3<br />
4. 60.78<br />
+1*00. OC<br />
+363.33<br />
+ 31.7£<br />
+250.0C<br />
+ 56.67<br />
- 2.7<br />
+138. W<br />
+69.77<br />
+760.0C<br />
+126.6J<br />
+99.6!<br />
4280.2J<br />
+65.0J<br />
Other Cattle1<br />
Per<br />
Cent.<br />
1939 1929 Change<br />
981<br />
l.OU<br />
1,210<br />
691*<br />
572<br />
363<br />
1,367<br />
6,230<br />
1,137<br />
91*8<br />
1,836<br />
1,219<br />
1,950<br />
1,239<br />
1,075<br />
2,117<br />
1,671*<br />
13,195<br />
L9,li25<br />
5,207<br />
m,2l8<br />
817<br />
1,091*<br />
1,267<br />
652<br />
558<br />
1*3 1*<br />
1,157<br />
5,979<br />
1,108<br />
633<br />
1,833<br />
1,21*8<br />
1,516<br />
1,251<br />
812<br />
1,1*58<br />
1,225<br />
ll,C81i<br />
17,063<br />
1*,536<br />
12,527<br />
+20.07<br />
- (*.66<br />
- a. 50<br />
+ 6.14*<br />
+ 2.51<br />
-16.36<br />
+18.15<br />
+ li.20<br />
+ 2.62<br />
+1*9.76<br />
+ 0.16<br />
- 2.32<br />
+28.63<br />
- 0.96<br />
+32.39<br />
+1*5.20<br />
+36.65<br />
+19.05<br />
+13.81*<br />
+1U.79<br />
+13.50<br />
Ho zs and Pigs<br />
Per<br />
Cent<br />
1939 1929 Chnnge-<br />
1,61*1.<br />
1,821.<br />
2,785<br />
1,258<br />
908<br />
861<br />
2,333<br />
11,613<br />
1,856<br />
1,1)17<br />
3,161,<br />
2,701*<br />
3,21.2<br />
2,981<br />
2,256<br />
2,71*2<br />
3,609<br />
23,973<br />
35,586<br />
11,552<br />
2l*,03l*<br />
2,058<br />
2,573<br />
1,91*8<br />
738<br />
719<br />
.680<br />
1,1*26<br />
10,11*2<br />
1,269<br />
971.<br />
1,968<br />
l.WIt<br />
1,768<br />
1,999<br />
1,962<br />
1,758<br />
1,619<br />
ll.,5ll<br />
2l*,653<br />
6,771*<br />
17,879<br />
-20.12<br />
-29.11<br />
+1)2.97<br />
+70.1*6<br />
+26.29<br />
426.62<br />
+63.60<br />
+1U.50<br />
+1*6.26<br />
+1.5.1*8<br />
+60.77<br />
+126.1*7<br />
+83.37<br />
+1*9.12<br />
+15.09<br />
+55.97<br />
+122.92<br />
+65.21<br />
+ld*.3S<br />
+70.53<br />
+3l*.lk3<br />
Sourcei U. S. Census, Agriculture, <strong>Georgia</strong>, 191*0,, First Series, Table 1*.<br />
Other cattle represent animals under two years. The figures represent the difference between<br />
"total cattle" and the sum <strong>of</strong> cattle kept for dairy use and cattle kept for beef.
S<br />
T<br />
H<br />
H<br />
S<br />
1<br />
E<br />
§p.<br />
c*<br />
g01<br />
H)<br />
0)<br />
i<br />
CD<br />
V*<br />
>•<br />
1<br />
6a.<br />
. Economk<br />
Raeaich .<br />
hj Jackson, Hall, and Franklin indmmui .<br />
SX* greatest Hart, 1939. Area For- The<br />
concentration is in<br />
by A-35 Table shows the distribution counties swine<br />
<strong>of</strong> Station .<br />
Experiment<br />
InSneeniit<br />
approxinately per 35 cent, ised<br />
Tables A-31 and A-32<br />
Number <strong>of</strong> Cows and Heifers Two Tears Old and Over,<br />
in 191,0, in~the Northeast <strong>Georgia</strong> Area,<br />
by Panels and Counties<br />
Number A-3~I<br />
Counties<br />
Over 70£<br />
Subsistence<br />
Farms<br />
Towns<br />
Union<br />
Rabun<br />
White<br />
Lumpkin<br />
Dawson<br />
Habersham<br />
Total<br />
Under 10%<br />
Subsistence<br />
Banks<br />
Stephens<br />
Hall<br />
Forsyth<br />
Jackson<br />
Madison<br />
Barrow<br />
Franklin<br />
Hart<br />
Total<br />
Area Total<br />
Panel I<br />
Panel H<br />
191*0<br />
Total<br />
1,238<br />
1,806<br />
1,676<br />
1,337<br />
1,086<br />
755<br />
2,068<br />
9,966<br />
1,907<br />
1,1*66<br />
3,586<br />
2,382<br />
2,651*<br />
2,603<br />
1,71*2<br />
3,090<br />
3,110<br />
22,51*0<br />
32,506<br />
9,837<br />
22,669<br />
1930<br />
1,078<br />
1,579<br />
1,230<br />
989<br />
830<br />
729<br />
1,509<br />
7,91*1*<br />
1,728<br />
1,325<br />
3,186<br />
2,287<br />
2,816<br />
2,571*<br />
1,777<br />
2,661<br />
2,1*31<br />
20,785<br />
28,729<br />
9,069<br />
19,660<br />
Kept for<br />
Milk<br />
191*0<br />
1,238<br />
1,771<br />
1,570<br />
1,253<br />
1,018<br />
730<br />
2,016<br />
9,596<br />
1,877<br />
1,1*37<br />
3,1*71*<br />
2,368<br />
2,560<br />
2,560<br />
1,711<br />
2, 9t.lt<br />
2,852<br />
21,783<br />
31,379<br />
9,1*91<br />
21,888<br />
1930<br />
1,052<br />
1,560<br />
1,203<br />
890<br />
785<br />
729<br />
1,1*95<br />
7,711*<br />
1,722<br />
1,319<br />
3,101<br />
2,283<br />
2,756<br />
2,530<br />
1,761*<br />
2,575<br />
2,1*01<br />
20,1*51<br />
28,165<br />
8,978<br />
19,187<br />
• Kept for<br />
Beef<br />
191*0<br />
*<br />
35<br />
106<br />
81*<br />
68<br />
25<br />
52<br />
370<br />
30<br />
29<br />
112<br />
'Ik<br />
9k<br />
1*3<br />
. 31<br />
me<br />
258<br />
757<br />
1,127<br />
31*6<br />
781<br />
1930<br />
26<br />
19 '27<br />
99<br />
1*5<br />
*<br />
11*<br />
230<br />
6<br />
6<br />
85<br />
k<br />
60<br />
1*1*<br />
13<br />
86<br />
30<br />
331*<br />
561,<br />
91<br />
1*73<br />
Source: U. S. Census, Agriculture,<br />
<strong>Georgia</strong>, 191*0, First Series, Table 1*.<br />
*Less than three farms reporting.<br />
Per Cent A-32<br />
191*0<br />
Total<br />
3.81<br />
5.56<br />
5.16<br />
lull<br />
3.31*<br />
2.32<br />
6.36<br />
30.66<br />
£.87<br />
l*.5l<br />
11.03<br />
7.33<br />
8.16<br />
8.00<br />
5.36<br />
9.51<br />
9.57<br />
69.31*<br />
100.00<br />
30.26<br />
69.71*<br />
1930<br />
3.75<br />
5.50<br />
1*.28<br />
3.1*1*<br />
2.89<br />
2.51*<br />
5.25<br />
27.65<br />
6.02<br />
1*. 61<br />
11.09<br />
7.96<br />
9.80<br />
8.96<br />
6.19<br />
9.26<br />
8.1*6<br />
72.35<br />
100.00<br />
31.57<br />
68. 1*3<br />
Kept for<br />
Milk<br />
191*0<br />
3.95<br />
5.61*<br />
5.00<br />
3.99<br />
3.21,<br />
2.33<br />
6.1*3<br />
30.58<br />
5.98<br />
1*.58<br />
11.07<br />
7.55<br />
8.16<br />
8.16<br />
5.1*5<br />
9.38<br />
9.09<br />
69.1*2<br />
100.00<br />
30.25<br />
69.75<br />
1930<br />
3.71*<br />
5.51*<br />
1*.27<br />
3.16<br />
2.79<br />
2.59<br />
5.31<br />
27.39<br />
6.11<br />
U.68<br />
11.01<br />
8.11<br />
9.79<br />
8.98<br />
6.26<br />
9.11*<br />
8.52<br />
72.61<br />
100.00<br />
31.87<br />
68.13<br />
1 Kept for<br />
Beef<br />
191*0<br />
*<br />
3.11<br />
9.1*1<br />
7.1*5<br />
6.03<br />
2.22<br />
U.61<br />
32.83<br />
2.66<br />
2.57<br />
9.91*<br />
1.2U<br />
8.31*<br />
3.82<br />
2.75<br />
12.96<br />
22.89<br />
67.17<br />
100.00<br />
30.70<br />
69.30<br />
1930<br />
U.61<br />
3.37<br />
U.79<br />
17.55<br />
7.98<br />
2.U8<br />
1*0.78<br />
1.06<br />
1.06<br />
15.07<br />
0.71<br />
10.61*<br />
7.30<br />
2.31<br />
15.25<br />
5.32<br />
59.22<br />
100.00<br />
16.1U<br />
83.86
Sows and Oilts<br />
Farrowing or<br />
To Farrow<br />
April<br />
19liO<br />
5.29<br />
8.91.<br />
13.61<br />
6.51<br />
3.55<br />
1.90<br />
7. 51.<br />
1*7.31*<br />
3.99<br />
2.77<br />
6.51<br />
1..95<br />
7.10<br />
8.13<br />
l*.l»2<br />
9.28<br />
5.51<br />
• 52.66<br />
100.00<br />
23.01<br />
76.99<br />
April<br />
1930<br />
7.12<br />
8.30<br />
7.59<br />
1).72<br />
2.81.<br />
1.17<br />
U.3S<br />
37.09<br />
6.92<br />
2.61.<br />
3.65<br />
US<br />
9.63<br />
5.95<br />
5.59<br />
10.07<br />
13.71<br />
62.91<br />
100.00<br />
30.00<br />
70.00<br />
pigs> sheep, 7 chickeng. 100 20 or<br />
horse, dairy<br />
cor.sxmed: cow, cattle,<br />
hogs, 35<br />
beef other 1 mature by quantity conaon measure. The number<br />
unit is determined <strong>of</strong> feed reducing '"in. anjjnal unit is the result or animals 1' — J to a<br />
1-3 a- tr<br />
Stri<br />
fc-S 0-^<br />
BSSSS-g"<br />
« M (9 PCS g<br />
C* (U TJ t*1!<br />
a o n 0 o"<br />
1" p. 1 g c* ffl<br />
HH j* 1 0<br />
» rt ii Ho<br />
v*» w TO o H- a<br />
vn^ » 1^3 3<br />
it. p.» oo<br />
H- ^» o I<br />
-i >/\ w oo g-<br />
Tables A-31. and A-35<br />
Numbers <strong>of</strong> Swine for 191.0 and 1930 in the Northeast<br />
<strong>Georgia</strong> Area by Panels and CoutvETes<br />
i lumber A-3li —————<br />
Counties<br />
Over 70!<<br />
Subsistence<br />
Faros<br />
Towns<br />
Union<br />
Rabun<br />
White<br />
Lumpkin<br />
Dawaon<br />
Habershara<br />
Total<br />
Under 70£<br />
Subsistence<br />
Banks<br />
Stephens<br />
Hall<br />
Forsyth<br />
Jackson<br />
Uadison<br />
Barrow<br />
Franklin<br />
Hart<br />
Total .<br />
Area Total<br />
Panel I<br />
Panel II<br />
Farms<br />
Report<br />
ing<br />
April<br />
191.0<br />
1.78<br />
682<br />
725<br />
631<br />
1*92<br />
028<br />
932<br />
U.368<br />
9U1<br />
670<br />
1,533<br />
1,537<br />
1,1.79<br />
1,1.00<br />
1,000<br />
1,1.70<br />
1,81.9<br />
11,879<br />
16,21*7<br />
5,786<br />
10,1.61<br />
Hogs and Pigs<br />
Over k<br />
Ho. Old<br />
April<br />
191.0<br />
1,610.<br />
1,821.<br />
2,785<br />
1,258<br />
908<br />
861<br />
2,333<br />
11,613<br />
1,856<br />
1,1*17<br />
3,161.<br />
2,701.<br />
3,21.2<br />
2,981<br />
2,258<br />
2,71.2<br />
3,609<br />
23,973<br />
35,586<br />
11,552<br />
2lt,03!t<br />
Over 3<br />
Mo. Old<br />
April<br />
1930<br />
2,058<br />
2,573<br />
1,91*8<br />
738<br />
719<br />
680<br />
1,1*26<br />
10,11.2<br />
1,269<br />
97l*v<br />
1,968<br />
1,191*<br />
1,768<br />
1,999<br />
1,962<br />
1,758<br />
1,619<br />
11*, 511<br />
2U,653<br />
6,771.<br />
17,879<br />
Sows, Oilta<br />
Farrowing or<br />
To Farrow<br />
April<br />
191.0<br />
170<br />
287<br />
U37<br />
209<br />
111.<br />
61<br />
21.2<br />
1,520<br />
128<br />
89<br />
209<br />
159<br />
228<br />
261<br />
Hi2<br />
298<br />
177<br />
1,691<br />
3,211<br />
739<br />
2,1.72<br />
April<br />
1930<br />
213<br />
263<br />
227<br />
HA<br />
85<br />
35<br />
11*5<br />
1,109<br />
207<br />
79<br />
109<br />
H.2<br />
268<br />
178<br />
167<br />
301<br />
U10<br />
1,881<br />
2,990<br />
897<br />
2,093<br />
Sources 0. S. Oensus, Agriculture,<br />
Qeorgia,19l.O, First Series , Table 1..<br />
Pur Cent A->5<br />
Farms<br />
Report<br />
ing<br />
April<br />
191*0<br />
2.9U<br />
1..20<br />
U.U6<br />
3.88<br />
3.03<br />
2.6U<br />
5.71*<br />
26.88<br />
5.79<br />
U.12<br />
9.U1*<br />
9.1.6<br />
9.. 10<br />
8.62<br />
6.15<br />
9.05<br />
11.38<br />
73.12<br />
100.00<br />
35.61<br />
61.. 39<br />
Hogs and Pigs<br />
Over 1.<br />
Uo. Old<br />
April<br />
191*0<br />
1..62<br />
5.13<br />
7.33<br />
3.53<br />
2.55<br />
2.1.2<br />
6.56<br />
32,63<br />
5.22<br />
3.98<br />
8.89<br />
7.60<br />
9.11<br />
8.38<br />
6.31.<br />
7.70<br />
10.11.<br />
67.37<br />
100.00<br />
32.1.6<br />
67.51.<br />
Over 3<br />
Mo. Old<br />
April<br />
1930<br />
8.35<br />
10.10*<br />
7.90<br />
2.99<br />
2.92<br />
2.76<br />
5.78<br />
1*1.11*<br />
5.15<br />
3.95<br />
7.98<br />
1*.8J«<br />
7.17<br />
8.11<br />
7.96<br />
7.13<br />
6.57<br />
58.86<br />
100.00<br />
'27.1*8<br />
72.52
with subsistence rates below 70 per cent the order was the same,<br />
hut the proportion <strong>of</strong> animal units represented by horses and<br />
mules was higher, 33.83 per cent, while dairy cattle was 29.43<br />
per cent. In the seven co-unties with subsistence rates above<br />
70 per cent, dairy cattle' was first with 36.80 per cent, and<br />
horses and mules were only 26.77 per cent. Table A-16 relates<br />
the number <strong>of</strong> animal units to acres <strong>of</strong> farm land. For the whole<br />
Area there was one animal unit for every 17.35 acres <strong>of</strong> farm<br />
Table A-19<br />
Counties<br />
Over 70*<br />
Subsistence<br />
Farms<br />
Towns<br />
Union<br />
Rabun .<br />
White<br />
Lurapkin<br />
Dawson<br />
Habersham .<br />
Total. .<br />
Under 70*<br />
Subsistence<br />
Banks ....<br />
Stephens ...<br />
UaT T<br />
Forsyth. ...<br />
Jackson. ...<br />
Madison. . . .<br />
Barrow ....<br />
Franklin ...<br />
Hart. ....<br />
Total. . . .<br />
Area Total. . .<br />
Panel I. ...<br />
Panel II ...<br />
Feed Bequirements and 1939 Feed Production<br />
Related to Animal Units in the Northeast<br />
<strong>Georgia</strong> Area by Counties<br />
Total<br />
Animal<br />
Units1<br />
3,142<br />
1,865<br />
3,989<br />
3,613<br />
2,718<br />
2,058<br />
5,689<br />
26,074<br />
5,539<br />
ll,027<br />
10,755<br />
10,328<br />
9,342<br />
6,047<br />
6,008<br />
9,'680<br />
10,287<br />
74,013<br />
100,087<br />
314,670<br />
65, 417<br />
1940<br />
Requirements<br />
Equivalent <strong>of</strong><br />
Corif<br />
4,511<br />
7,708<br />
6,915<br />
5,021<br />
3,712<br />
2,595<br />
7,510<br />
37,972<br />
6,538<br />
U,835<br />
12,161<br />
11,071<br />
10,884<br />
9,604<br />
7,088<br />
11,685<br />
11,277<br />
85,143<br />
123,115<br />
39,040<br />
84,075<br />
Ha/<br />
4,820<br />
6,494<br />
5,710<br />
4,899<br />
3,793<br />
2,942<br />
8,073<br />
36,731<br />
7,790<br />
5,563<br />
13,553<br />
7, 888<br />
12,510<br />
10,977<br />
8,106<br />
13,179<br />
13,299<br />
94,865<br />
131,596<br />
42,370<br />
89,326<br />
1939<br />
Production<br />
Equivalent <strong>of</strong><br />
Corn8<br />
3,729<br />
5,519<br />
4,244<br />
3,969<br />
3,046<br />
2,635<br />
5,741<br />
28,883<br />
5,129<br />
3,810<br />
9,373<br />
7,905<br />
11,384<br />
10,841<br />
6,966<br />
9,432<br />
12,288<br />
77,128<br />
106,011<br />
38,000<br />
68,011<br />
Ha/<br />
1,009<br />
1,704<br />
2,625<br />
795<br />
660<br />
280<br />
2,213<br />
9,286<br />
1,685<br />
963<br />
2,273<br />
1,609<br />
6,428<br />
3,081<br />
3,079<br />
2,49l<<br />
3,618<br />
25,230<br />
34,516<br />
11,387<br />
23,129<br />
Per Cent 1939<br />
Production Was<br />
3f 1940 Needs<br />
Equivalent <strong>of</strong><br />
Corn2<br />
62.66<br />
71.60<br />
61.37<br />
79.05<br />
82.06<br />
101.54<br />
76.44<br />
76.06<br />
78.45<br />
78.30<br />
77.07<br />
71.40<br />
104.59<br />
112.38<br />
98.28<br />
80.72<br />
108.97<br />
90.59<br />
86.11<br />
97.34<br />
80.39<br />
Ha/<br />
20.93<br />
26.24<br />
45-97<br />
16.23<br />
17.40<br />
9-52<br />
27-41<br />
25-28<br />
21.63<br />
17.31<br />
16.77<br />
51.38'<br />
16.27<br />
28.07<br />
37-98<br />
18.92<br />
27.21<br />
26.60<br />
26.23<br />
26.94<br />
25.89<br />
lAp animal unit is the result <strong>of</strong> reducing all animals to a conraon<br />
measure. The number <strong>of</strong> animals <strong>of</strong> various types needed to equal this com<br />
mon measure is determined largely by the quantity <strong>of</strong> feed consumed. An<br />
animal unit is 1 horse; 1 dairy cow; 1 beef cow; 3 other cattle; 5 nature •<br />
hogs; a20 pigs; 7 sheep; or 100 chickens.<br />
The corn equivalent, figure represents the amount <strong>of</strong> grain and simi<br />
lar feed produced in the Area, (or needed), expressed as tons <strong>of</strong> com, ac<br />
cording to its relative nutritive value. The hay equivalent figure repre<br />
sents the amount <strong>of</strong> fodder produced in the Area, (or needed), expressed as<br />
tons <strong>of</strong> hay.<br />
—335—
Animal<br />
Table A-22<br />
tnniml Feed Requirements<br />
1 Dairy cow<br />
1 Beef caw<br />
3 in "other cattle" group 1<br />
20 Pigs<br />
5 Sows<br />
7 Sheep<br />
1 Horse or mule<br />
100 Ifature chickens<br />
100 Chickens raised on farms<br />
Corn<br />
Zquiv.<br />
in Tons<br />
0.3755<br />
0.2335<br />
1.5000<br />
10.0000<br />
4.7750<br />
0.4760<br />
0.6678<br />
3.8150<br />
0.7800<br />
Hay<br />
Hquiv.<br />
in Tons<br />
2.00<br />
1.27<br />
3.00<br />
• —<br />
. —<br />
2.10<br />
1.60<br />
—<br />
~<br />
^All cattle between three months and two<br />
years <strong>of</strong> age.<br />
Crop<br />
Table A-25<br />
Average Yields <strong>of</strong> Various<br />
Forage Crops in <strong>Georgia</strong> •<br />
<strong>Georgia</strong> Average<br />
Tield Per Acre<br />
Grainsj<br />
Corn<br />
Oats1<br />
Barley2<br />
.Ve1<br />
Sorghum Grain<br />
Hays and<br />
Grazing Crops: 4<br />
Peanuts<br />
Conpeas<br />
Lespedeza<br />
Soybeans<br />
Alfalfa<br />
Small Grain<br />
Velvet Beans<br />
Silage: 2<br />
Corn<br />
Sorghum<br />
Pounds<br />
537-6<br />
U83-2<br />
792.0<br />
390.0<br />
711.2<br />
Bushels<br />
9.6<br />
15.1<br />
16.5<br />
6.5<br />
12.7<br />
Tons<br />
0.268<br />
0.2it2<br />
0.392<br />
0.195<br />
0.356<br />
0.36<br />
0.67<br />
0.86<br />
0.88<br />
1.80<br />
0.70<br />
o.ia<br />
U.25<br />
5.25<br />
Source: Calculated from data col<br />
lected by the <strong>Georgia</strong> Crop Reporting<br />
Service.<br />
Average 1930-39 "Crop for 1939<br />
%rop for 19U2-U3 * Average 1932-ltl<br />
--236--<br />
land. The nonsubsistence<br />
counties had a<br />
figure, 16.71<br />
acres',slightly<br />
less than the<br />
Area figure,<br />
while the sub-<br />
State ....<br />
EnfiKCriaf<br />
Experiment<br />
Sutioa . . .<br />
<strong>Georgia</strong><br />
Tecft<br />
Indoiteul . .<br />
. . Economic<br />
Research . .<br />
sistence counties are<br />
shown with 19.18 acres<br />
per animal unit. The<br />
largest amounts <strong>of</strong> land<br />
per animal unit was in<br />
Dawson county (31.25<br />
acres), Lumpkin county<br />
(27.73 acres), and Banks<br />
county (21.31 acres).<br />
Towns county (11.97 acres),<br />
Forsyth (12.90 acres),<br />
Rabun (lit.28 acres), and<br />
Hart county (lti.51 acres)<br />
had the lowest acres-per-<br />
animal-unit index. In general,<br />
it is believed that the favor<br />
able percentages <strong>of</strong> the latter<br />
counties may ultimately be at<br />
tained over most <strong>of</strong> the North<br />
east <strong>Georgia</strong> Area. .<br />
The Feed Problem<br />
In order to produce good<br />
quality flesh and livestock<br />
products at a satisfactory rate,<br />
livestock must receive sertain<br />
minimum quantities <strong>of</strong> feed. The<br />
basic livestock feeds are corn<br />
(or its' equivalent) and hay (or<br />
its equivalent) plus the neces<br />
sary protein and mineral sup<br />
plements. Increasing the hay<br />
and reducing the corn equiva<br />
lent reduces the growth <strong>of</strong> beef<br />
cattle and lowers quality.<br />
Corn and Hay Requirements;<br />
Table A-19 gives the estimated<br />
quantities <strong>of</strong> corn and hay<br />
needed to maintain the animal<br />
units in the Northeast <strong>Georgia</strong><br />
Area in 19liO at a good growing<br />
and producing level, the quanties<br />
<strong>of</strong> these feeds produced<br />
in the Area, and the per cent<br />
that the 1939 corn and hay pro<br />
duction was <strong>of</strong> the 19kO needs<br />
for these feeds. Three coun<br />
ties (Madison, Hart, and Dawson)<br />
produced as much as 100 per
cent <strong>of</strong> production needs In corn or equivalent. All <strong>of</strong> the<br />
others with the exception <strong>of</strong> Rabun county (61.37) produced more<br />
than 70 per cent <strong>of</strong> the corn or equivalent needs. The Area<br />
average is 86.11, which is well above the average <strong>of</strong> other sec<br />
tions <strong>of</strong> the state.<br />
The per cent that hay production was <strong>of</strong> needs, however, was<br />
only 26.23 per cent for the Area. The highest per cent was in<br />
State ....<br />
Enfintcrimf<br />
Exptrimtnt<br />
Station . . .<br />
Oorjw<br />
Tidi<br />
Indutiul . .<br />
.<br />
Rncarch .<br />
Jackson county, which produced approximately half its needs. This appar<br />
ently means that in all counties an increase in hay production is needed.<br />
Since the available pasture will sustain, on a normal pasturage basis,<br />
more animal units than are ultimately recommended, it seems probable that<br />
such hay as is required can be cut from pasture. Probably, however, more<br />
land should be producing hay and forage. Two sources appear available<br />
for such an increase. A decrease <strong>of</strong> about 7,500 acres in cotton can ap<br />
parently be made without affecting the total bales <strong>of</strong> cotton produced.<br />
It is further estimated that about hai-r Of the 98,333 acres <strong>of</strong> idle or<br />
fallow land can also become grass lands. These two adjustments would<br />
increase the total for forage crops and pasture from 166,ltl.9 acres to<br />
2U,317 acres (see Table A-ij9).<br />
The requirement figures in Table A-19 are based on good feeding prac<br />
tices, and their accuracy will be lessened in the case <strong>of</strong> poor feeding<br />
practices, or the diversion <strong>of</strong> corn or other feed crops into unreported<br />
channels.<br />
Table A-2U<br />
Improved<br />
Practice<br />
Estimated Effect <strong>of</strong> Specified Improved Practices<br />
on Crop Yields inEdgefield County, S.C.<br />
Liming<br />
Fertilizer<br />
Soil Adaption<br />
Cultivation Methods<br />
Per Cent<br />
Increase<br />
Over<br />
Usual<br />
Yields<br />
Corn Oats<br />
8<br />
2S<br />
20<br />
65<br />
8<br />
25<br />
9<br />
20<br />
Improved<br />
Practice<br />
Variety Selection<br />
Seed Selection<br />
Insect, disease control<br />
(Probable increase from<br />
an practices)<br />
Per Cent<br />
Increase<br />
Over<br />
Usual<br />
Yields<br />
Corn Oats<br />
Source: Adapted from Table 11;, Land Utilization and Agricultural<br />
'Adjustment in Edgefield County, S. C., South Carol! na Agricultural<br />
Experiment Station <strong>of</strong> Clemson Agricultural College,<br />
Bulletin 31*9, June 19U*.<br />
Included in cultivation methods ares Use <strong>of</strong> cover crops,<br />
time <strong>of</strong> planting and harvesting, and use <strong>of</strong> proper equipment for<br />
tillage.<br />
8Fossible achievement by 1950 with allowance for lags in ad<br />
justments -by farm operators in overcoming customary or traditional<br />
practices. The combination <strong>of</strong> all practices is not expected to<br />
result in an increased yield equal to the sum <strong>of</strong> the individual<br />
increases expected.<br />
9<br />
15<br />
5<br />
70<br />
10<br />
10<br />
5<br />
70<br />
—237—
, 1<br />
w<br />
CO<br />
1<br />
• -<br />
Feed Crop<br />
Com, Acres<br />
Bushels<br />
Com Eq. Tons<br />
Wheat, Acres<br />
Bushels<br />
Corn Eq. Tons<br />
Barley, Acres<br />
Bushels<br />
Corn Eq. Tons<br />
Rye, Acres<br />
Bushels<br />
Corn Eq. Tons<br />
Small Grain Ikix, Acres<br />
Bushels<br />
Com Eq. Tons<br />
Oats, Acres<br />
Bushels<br />
Corn Eq. Tons<br />
Velvet Beans, Acres<br />
Bushels<br />
Corn Eq. Tons<br />
Peanuts, Acres<br />
Bushels<br />
Com Eq. Tons<br />
Sweet Potatoes<br />
Feed Crop<br />
Corn, Acres<br />
Bushels<br />
Corn Eq. Tons<br />
Table A-20<br />
Corn Sguiyalents liwdents <strong>of</strong> Feed Cro; Crops Produced in the Northeast Qeorgia Area<br />
in~T3S[7 by. PaneliTand' (Jountles §£ guSsiatonce Qroups ~~<br />
Area<br />
Total<br />
21i8,722<br />
2,735, 1.56<br />
76,591<br />
36,126<br />
362,711*<br />
10,881.<br />
21*5<br />
3,361*<br />
81<br />
8,671<br />
60,21*1<br />
1,689<br />
931.<br />
11*, 278<br />
286<br />
60,890<br />
1,107,308<br />
15,91*5<br />
2,335<br />
81*9<br />
535<br />
1*83<br />
79<br />
Total<br />
182,21*8<br />
1,798,052<br />
50,314.<br />
Panel<br />
I<br />
Total<br />
85,258<br />
823,808<br />
23,067<br />
19,107<br />
195,1.71<br />
5,865<br />
71<br />
1,359<br />
33<br />
1,191*<br />
12,786<br />
358<br />
1*01*<br />
6,028<br />
121<br />
29,061<br />
578,865<br />
8,335<br />
91.7<br />
351<br />
221<br />
153<br />
31.<br />
66 28<br />
Banks<br />
15,329<br />
135,968<br />
Panel<br />
Counties with Over 70* Subsistenc* Farms<br />
II<br />
Total Total Towns Union Rabun White Lumpkin Dawson<br />
163, 1*
CA -<br />
so cu co<br />
Heeting the Area's Feed Needs<br />
In view <strong>of</strong> the decrease in cotton acreage in the Northeast<br />
<strong>Georgia</strong> Area and the increase in the number <strong>of</strong> animal units and<br />
income from livestock<br />
O\cn O C\J f\»<br />
-rr\t^rH CJ «v •» •*<br />
Cor two feed crops -utilized in the Northeast <strong>Georgia</strong> Area. Tlhile<br />
the improvenent <strong>of</strong> the practices indicated will increase yields<br />
Ln the Northeast <strong>Georgia</strong> Area, it does not necessarily follow<br />
that increases will be the same as in Edgefield county, South<br />
Carolina-<br />
A-16<br />
Farm Acreage Per Animal Unit in<br />
the Kortheast jeorgia Area<br />
for 1939 by Panels and<br />
Counties<br />
Counties<br />
Over 70*<br />
Subsistence<br />
Farms<br />
Towns<br />
Union<br />
Ba>min<br />
white<br />
TjffltplrT n<br />
Dawson<br />
fiabersoam<br />
Total<br />
Under 70$<br />
Subsistence<br />
Banks<br />
Stephens<br />
Hall<br />
Forsyth<br />
Jackson<br />
Madison<br />
Barrow<br />
Franklin<br />
Hart<br />
Total<br />
Area Total<br />
Panel I<br />
Panel U<br />
Acres in<br />
Farm Land<br />
37,616<br />
94,732<br />
56,981<br />
72,239<br />
75,375<br />
64,314<br />
99,159<br />
500,416<br />
ne,o39<br />
73,503<br />
187,712<br />
133,192<br />
176,873<br />
152,448<br />
94,494<br />
150,905<br />
149,311<br />
l,236;477<br />
1,736,893<br />
529,445<br />
1,207,448<br />
Anl null<br />
Units1<br />
3,142<br />
4,865<br />
3,989<br />
3,613<br />
2,718<br />
2,058<br />
5,689<br />
26,074<br />
5,539<br />
4,027<br />
10,755<br />
10,328<br />
9,342<br />
8,047<br />
6,008<br />
9,680<br />
' 10,287<br />
74,013<br />
100,037<br />
34,670<br />
65,417<br />
Acres<br />
Per<br />
Anl mal<br />
Unit<br />
11.97<br />
19.47<br />
lit. 28<br />
19.99<br />
27.73<br />
31.25<br />
17. U3<br />
19.19<br />
21.31<br />
18.25<br />
17.'45<br />
12.90<br />
18.93<br />
18.94<br />
15.73<br />
15.59<br />
14.51<br />
16.71<br />
17.35<br />
15.27<br />
18.46<br />
Source: Col. 1 U. S. Census,<br />
igrieulture, 1940, First Series, Table<br />
Ij Col. 2 from Table A-17; Col. 3 caljulated<br />
by dividing Col. 1 by Col. 2.<br />
1An animal unit is the result <strong>of</strong><br />
reducing all animals to a common neasire.<br />
The number <strong>of</strong> animals <strong>of</strong> various<br />
types needed to equal this common<br />
neasure is determined largely by the<br />
juantity <strong>of</strong> feed consumed. An animal<br />
mit is 1 horse; 1 dairy cow; 1 beef<br />
:ow; 3 other cattle; 5 mature hogs;<br />
!0 pigs; 7 sheep; or 100 chickens.<br />
Satt . . . .<br />
EfifiaccriBC<br />
Exptrimnt<br />
Station . . .<br />
Tftfc<br />
Wuuial .<br />
Crop Selection; Rocaftb .<br />
The selection <strong>of</strong> the<br />
crops to be produced on the in<br />
dividual farm is <strong>of</strong> great value<br />
in determining the income produced<br />
Table A-21<br />
Maximun Number <strong>of</strong> Anlnal Units<br />
Which C, in Be Sustained 01i<br />
Three 5Lfferent Bases-1- ii<br />
the Northeast <strong>Georgia</strong><br />
Area , by Panels and<br />
Counties<br />
Over 70<br />
Subsistence<br />
Farms<br />
Towns<br />
Union<br />
Rabun<br />
White<br />
Lumpkin<br />
Dawson<br />
Habersham<br />
Total<br />
Under 10%<br />
Subsistence<br />
Batiks<br />
Stephens<br />
Hall<br />
Forsyth<br />
Jackson<br />
Madison<br />
Barrow<br />
Franklin<br />
Hart<br />
Total<br />
Area Total<br />
Panel I<br />
Panel H*<br />
Grazing<br />
4,855<br />
9,825<br />
12,907<br />
10,110<br />
15,979<br />
3,957<br />
13,501<br />
98,562<br />
13,931<br />
6,01.6<br />
38,057<br />
9,872<br />
19,645<br />
8,067<br />
10,572<br />
7,272<br />
17,061<br />
130,523<br />
201,657<br />
1*5,572<br />
156,085<br />
Grain<br />
2,204<br />
3,100<br />
2,352<br />
2,588<br />
2,064<br />
1,887<br />
U,019<br />
18,214<br />
3,226<br />
2,337<br />
6,986<br />
6,287<br />
6,215<br />
4,795<br />
3,650<br />
4,545<br />
5,752<br />
1^ ,793<br />
62,007<br />
20jU81|<br />
M,523<br />
Hay<br />
659<br />
1,281<br />
1,836<br />
585<br />
Ii7l<br />
196<br />
1,558<br />
6,586<br />
1,195<br />
698<br />
1,804<br />
1,676<br />
4,797<br />
2,265<br />
2,281<br />
1,834<br />
2,805<br />
19,355<br />
25,941<br />
9,027<br />
16,914<br />
The assumption in each case is<br />
that in 1940 the particular feed<br />
source could support the number <strong>of</strong><br />
animal units estimated, if the sup<br />
ply <strong>of</strong> the other two sources were at<br />
least sufficient to permit a normal<br />
feeding program.<br />
—240—
1<br />
&*»<br />
H<br />
1<br />
1<br />
Counties<br />
Over 70*<br />
Subsistence<br />
Farms<br />
White .....<br />
Habersham ....<br />
Total. ....<br />
Under 70*<br />
Subsistence<br />
Banks .....<br />
Stephens ....<br />
Hall. .....<br />
Madison. ....<br />
Franklin ....<br />
Hart. .....<br />
Total. ....<br />
Area Total. . . .<br />
Panel I. ....<br />
Panel II ....<br />
Tables A-17 and A-18<br />
Distribution <strong>of</strong> Animal Units in the Northeast <strong>Georgia</strong><br />
Area In 191*0, ly Panels and Counties<br />
Number A-17<br />
Total<br />
Animal<br />
Units<br />
3,11*2<br />
1*,865<br />
3,989<br />
3,613<br />
2,718<br />
2,058<br />
5,689<br />
26,071;<br />
5,539<br />
!*,027<br />
10,755<br />
10,328<br />
9,3U2<br />
8,01*7<br />
6,008<br />
9,680<br />
10,287<br />
71*, 013<br />
100,087<br />
31*, 670<br />
65,1*17<br />
Dairy<br />
Cows<br />
1,233<br />
1,771<br />
1,570<br />
1,253<br />
1,018<br />
730<br />
2,016<br />
9,596<br />
1,877<br />
1,1*37<br />
3,1*71*<br />
2,368<br />
2,560<br />
2,560<br />
1,711<br />
2,91*1*<br />
2,852<br />
21,783<br />
31,379<br />
9,1*91<br />
21,888<br />
Beef,<br />
Other<br />
Cattle<br />
327<br />
383<br />
509<br />
315<br />
259<br />
11*6<br />
508<br />
2,1*1*7<br />
1.09<br />
31.5<br />
721*<br />
1*20<br />
71*1*<br />
1*56<br />
389<br />
852<br />
816<br />
5,155<br />
7,602<br />
2,081<br />
5,521<br />
Type <strong>of</strong> Animal Unit<br />
Pigs<br />
and<br />
Sows<br />
131<br />
221<br />
336<br />
161<br />
88<br />
1*7<br />
186<br />
1,170<br />
99<br />
69<br />
161<br />
123<br />
176<br />
200<br />
109<br />
230<br />
136<br />
1,303<br />
2,1.73<br />
568<br />
1,905<br />
Sheep<br />
56<br />
23<br />
1.9<br />
10<br />
9<br />
28<br />
175<br />
*<br />
11<br />
11<br />
*<br />
5<br />
3<br />
18<br />
1*8<br />
223<br />
23<br />
200<br />
Horses<br />
and<br />
Mules<br />
830<br />
1,212<br />
71.7<br />
1,01*7<br />
732<br />
711<br />
1,700<br />
6,979<br />
Chick<br />
ens<br />
560<br />
1,255<br />
778<br />
827<br />
621<br />
1.15<br />
1,251<br />
5,707<br />
1,907 1,21.7<br />
1,136 1,01*0<br />
3,069 3,316<br />
2,610 1*,307<br />
3,532 2,319<br />
3,01*2 1,789<br />
2,373 1,1*21<br />
3,322 2,329<br />
3,703 2,762<br />
2&,69l* 21,030<br />
31,673<br />
11,728<br />
19,91*5<br />
26,737<br />
10,779<br />
15,958<br />
Source :U.S. Census, ART!., Oa.,19liP, 1st Se<br />
ries, Tables 1* & 5. Tess~Ehan 3 farms.<br />
Per Cent A-18<br />
Type <strong>of</strong> Animal<br />
Dairy<br />
Cows<br />
39.1*0<br />
36.1*1<br />
39.36<br />
31*. 68<br />
37.1.5<br />
35.1*7<br />
35.1*1*<br />
36.80<br />
33.89<br />
35.68<br />
32.30<br />
22.93<br />
27.J*0<br />
31.81<br />
28.1*8<br />
30.1*1<br />
27.72<br />
29.1*3<br />
31.35<br />
27.37<br />
33.1*6<br />
Beef,<br />
Other<br />
Cattle<br />
10.1*1<br />
7.37<br />
12.76<br />
8.72<br />
9.53<br />
7.09<br />
8.93<br />
9.33<br />
7.38<br />
8.57<br />
6.73<br />
1*.07<br />
7.97<br />
5.67<br />
6.1*8<br />
8.80<br />
' 7.93<br />
6.97<br />
7.60<br />
6.00<br />
8.1*1*<br />
Sows<br />
and<br />
Pigs<br />
U.17<br />
l*.51*<br />
8.1*2<br />
1*.1*5<br />
3.21*<br />
2.28<br />
3.27<br />
1*.1*9<br />
1.79<br />
1.71<br />
1.50<br />
1.19<br />
1.38<br />
2.1*9<br />
1.81<br />
2.38<br />
1.32<br />
1.76<br />
2.1*7<br />
1.61*<br />
2.91<br />
Sheep<br />
1.78<br />
0.1*7<br />
1.23<br />
0.28<br />
0.1*1*<br />
0.1*9<br />
0.67<br />
0.10<br />
0.12<br />
0.08<br />
0.03<br />
0.18<br />
0.07<br />
0.22<br />
0.07<br />
0.31<br />
Horses<br />
and<br />
Mules<br />
26.!*2<br />
2U.91<br />
18.73<br />
28.98<br />
26.93<br />
3U.5S<br />
29.38<br />
26.77<br />
31*. 1*3<br />
28.21<br />
28.51*<br />
25.27<br />
37.81<br />
37.80<br />
39.50'<br />
3l*.32<br />
36.00<br />
33.36<br />
31.65<br />
33.83<br />
30.1*9<br />
Chick<br />
ens<br />
17.82<br />
25.30<br />
19.50<br />
22.89<br />
22.35<br />
20.17<br />
21.99<br />
21.89<br />
22.51<br />
25.83<br />
30.83<br />
1*6.51*<br />
2l*.82<br />
22.23<br />
23.65<br />
2U.06<br />
26.35<br />
28.1*1<br />
26.71<br />
31.09<br />
21*. 39
on the farm. In fact, under any given set <strong>of</strong> conditions, there<br />
is one combination <strong>of</strong> enterprises which will prove the most<br />
pr<strong>of</strong>itable. This combination will be influenced from year to<br />
»<br />
c o •*-<<br />
•H -p -p<br />
0 3<br />
6CT3<br />
I bC O<br />
O<br />
5£<br />
<br />
North<br />
§<br />
•H<br />
Ol -P<br />
c m 3<br />
. T<br />
EH O<br />
t,<br />
PH<br />
«S<br />
«D •P -P<br />
•H CO O<br />
ff bCT3<br />
3 hfl 0<br />
O 3 ><br />
F<br />
the Nor c<br />
x<br />
t-4<br />
CO<br />
O t> -H<br />
(, 4> •&<br />
O 3<br />
63 T3<br />
.3 to o<br />
t-, CO fc<br />
o<br />
o<br />
•s<br />
c<br />
•p<br />
IH<br />
o<br />
o<br />
•r*<br />
en -P<br />
to c .<br />
t-C TJ<br />
ot<br />
g<br />
<br />
o> s<br />
-"2<br />
Pk<br />
33,937<br />
1,897<br />
755 1*17<br />
1,829<br />
5<br />
31<br />
38,502<br />
0 1<br />
CO TO ( c+ 3"<br />
fc<br />
£ M<br />
(0 fl» r<br />
p £ p.<br />
H- H-O<br />
CO (u (IP<br />
OOP<br />
c«- O<br />
ȣ{<br />
•a g- (<br />
ft £l<br />
8S8<br />
c* sf 5"<br />
O hlS<br />
Crop<br />
Corn<br />
Orain sorghum1<br />
Wheat<br />
Oats<br />
Velvet beans1<br />
Table A-27<br />
Grain Production for 1939 in the Northeast Qeorgla Area and Suggested Reallocation <strong>of</strong> Acreage<br />
Peanuts (solid)1<br />
Peanuts (interplanted;<br />
Rye1<br />
Barley 8<br />
Small grain<br />
Totals<br />
Corn<br />
Grain sorghum1<br />
Wheat<br />
Oats<br />
Velvet beans<br />
Peanuts (solid)1<br />
Peanuts (interplanted)<br />
Rye1<br />
Barley<br />
Small grain<br />
Totals<br />
Northeast <strong>Georgia</strong> Area<br />
Suggested Reallocation<br />
Yield in Tons3<br />
At 70 Per<br />
1939 Cent In<br />
1939 Production<br />
Yield creased<br />
Per Yield<br />
Acres Tons Acres Acre Per Acre<br />
21*8,722<br />
%<br />
36,126<br />
60,890<br />
2,333<br />
1,31*3<br />
102<br />
8,671<br />
21*5<br />
931*<br />
359,1*22<br />
196,271 56<br />
33,932<br />
58,862<br />
2,160<br />
1,262<br />
93<br />
2,707<br />
227<br />
81*9<br />
296,1419<br />
76,591<br />
18<br />
10,881*<br />
15,91*5<br />
535<br />
66*<br />
1,689<br />
81<br />
286<br />
106,095<br />
Ten Soi<br />
55,61*9<br />
18<br />
10,272<br />
15,1*95<br />
1*91*<br />
60*<br />
__<br />
613<br />
78<br />
268<br />
82,91*7<br />
200,000<br />
56<br />
5o,ooo<br />
80,000<br />
1,000<br />
500<br />
100<br />
9,000<br />
21,5<br />
1,000<br />
61,588<br />
18<br />
15,061*<br />
20,91*9<br />
229<br />
25<br />
1,753 81<br />
306<br />
100,013<br />
3l»l,901<br />
ithem Counties<br />
150,000 56<br />
1*6,000<br />
78,000<br />
900<br />
1*50<br />
100<br />
3,036<br />
227<br />
915<br />
279,681*<br />
1*1,625<br />
18<br />
13,91*8<br />
20,505<br />
205<br />
21<br />
_<br />
677<br />
78<br />
288<br />
77,365<br />
10l*,700<br />
31<br />
25,609<br />
35,613<br />
389 1*3<br />
2,980<br />
138<br />
520<br />
170,023<br />
1939 Production<br />
Acres<br />
52,1*51<br />
. —<br />
2,191*<br />
2,028<br />
173<br />
81<br />
9<br />
5,961*<br />
18<br />
85<br />
63,003<br />
Six Northern Counties<br />
Suggested Reallocation<br />
Yield in Tons<br />
At 70 Per<br />
1939 Cent In<br />
Yield creased<br />
Per Yield<br />
Tons Acres Acre Per Acre<br />
20,91*2<br />
_<br />
612<br />
1*50<br />
1*1<br />
6*<br />
1,076<br />
3<br />
18<br />
23,11*8<br />
50,000<br />
. —<br />
1*,000<br />
2,000<br />
100<br />
50<br />
5,96U<br />
18<br />
85<br />
62,217<br />
19,963<br />
1,116<br />
1*1*1*<br />
21*<br />
1*<br />
1,076<br />
3<br />
18<br />
22,61*8<br />
70,763<br />
31 Source; U. S. Census, Agriculture<br />
23,712 191*0, First Serles,Tables 6 and Y) Second<br />
31*,858 Series, Table 12.<br />
31*8 #This figure includes interplanted.<br />
36 1 These enterprises are not important<br />
— in Northeast <strong>Georgia</strong> Area.<br />
1,1*1 E Barley is a very promising grain<br />
.133 for livestock feeding. Due to very small<br />
1*89 acreage grown,no recommendation is made.<br />
131,521 'Expressed in corn equivalent(A-20) .
Tables A-28 and A-29<br />
Live stack and Dairy Sales in Northeast <strong>Georgia</strong><br />
.rea '"by Oountloa ai7d"Typea <strong>of</strong> Farm<br />
I<br />
o<br />
Counties<br />
Over 70#<br />
Subsistence<br />
Farms<br />
Toms<br />
Union<br />
Rabun<br />
White<br />
Lumpkin<br />
Dawson<br />
Habersham<br />
Total<br />
Under 70*<br />
Subsistence<br />
Banks<br />
Stephens<br />
Hall<br />
Forsyth<br />
Jackson<br />
Madison<br />
Barrow<br />
Franklin<br />
Hart<br />
Total<br />
Area Total<br />
Panel I<br />
Panel II<br />
Livestock<br />
and Dairy<br />
Dollar<br />
Value<br />
* 19,891<br />
2li,235<br />
51,632<br />
13,71*1*<br />
1U.559<br />
6,521<br />
69,351<br />
200, 1*33<br />
33,223<br />
1*2,670<br />
180,672<br />
50,01*7<br />
68,706<br />
1,3,686<br />
W,96l<br />
1*5,059<br />
55,050<br />
568,071*<br />
768,507<br />
197, 71*1*<br />
570,763<br />
Per<br />
Cent<br />
8.35<br />
I*. 19<br />
8.87<br />
3.00<br />
3.91<br />
2.97<br />
3.57<br />
6.17<br />
5.08<br />
10.29<br />
13.05<br />
U.30<br />
U.99<br />
3.71*<br />
1*.91<br />
3.61<br />
3.52<br />
5.70<br />
5.81<br />
1*.0>*<br />
6.85<br />
Livestock<br />
Dollar<br />
Value<br />
$ 11*, 1*99<br />
21,790<br />
31,038<br />
10,951<br />
8,213<br />
5,069<br />
31,079<br />
122,639<br />
19,323<br />
ll*,017<br />
1*U, 193<br />
22,111<br />
33,1*88<br />
22,878<br />
20,51*7<br />
26,011*<br />
25,339<br />
cc. i f y ou<br />
350,599<br />
90,925<br />
.259,6714<br />
Per<br />
Cent<br />
6.1,5<br />
3.77<br />
5.33<br />
2.39<br />
2.21<br />
2.31<br />
3.81<br />
3.77<br />
2.96<br />
3.38<br />
3.19<br />
1.90<br />
2.1*3<br />
1.96<br />
Oats; In those cases vjhsre the production per acre <strong>of</strong> oats |<br />
is comparable to that <strong>of</strong> corn, there ar*. certain advantages in<br />
utilizing oats as a feed crop. At least two important adrantages<br />
<strong>of</strong> oats under the above conditions are: (1} it gives an<br />
opportunity for better soil protection, and (2) it gives an op<br />
portunity for a grain crop and a hay crop to be made from the<br />
land during the same year.<br />
Sate ....<br />
Enfinitiuif<br />
Expcrimtnt<br />
Station . . .<br />
^ndutria] . .<br />
Economic<br />
Rtwarcb . .<br />
Oats probably should be substituted for corn wherever the oat yield<br />
on an individual farm appears likely to be twice the corn yield in bushels.<br />
Silage; Fanners interested in heavy-forage-consuming livestock can<br />
well supplement hay with silage. The utilization <strong>of</strong> silage will probably<br />
fit in best with dairy farming. Three tons <strong>of</strong> silage is the rough equiv<br />
alent <strong>of</strong> one ton <strong>of</strong> hay. On this basis, the average yield <strong>of</strong> corn silage<br />
Counties<br />
Over 70<br />
Subsistence<br />
Farms<br />
Towns ....<br />
Union ....<br />
Eabun ....<br />
White ....<br />
Lumpkin. ...<br />
Dawson ....<br />
Habersham ...<br />
Total. . . .<br />
Table A-39<br />
Cotton Acreage and Production in the Northeast<br />
<strong>Georgia</strong> Area, for 1939 and 1929, by Panels<br />
and Counties by Subsistence Croups<br />
Acres<br />
3,013<br />
1.U7U<br />
2,308<br />
3,113<br />
9,908<br />
Under 10%<br />
Subsistence<br />
Banks .... 9,985<br />
Stephens . . . 5,383<br />
Hall. .... 16,731<br />
Forsyth. ... U.,511.<br />
Jackson. 25,535<br />
Madison. . . . 20,961<br />
Barrow .... 15,678<br />
Franklin . . 21,802<br />
Hart. . - . . . 27,71.8<br />
Total. . . . 158,337<br />
Area Total. . . 168,21,5<br />
Panel I. ... 78,901<br />
Panel H . . . 89,3U.<br />
1939<br />
Tield<br />
(Bales)<br />
1,955<br />
778<br />
1,329<br />
1,806<br />
5,868<br />
It, 652<br />
2,71.6<br />
9,12li<br />
8,588<br />
12,363<br />
12,303<br />
9,372<br />
12,239<br />
18, la8<br />
89,805<br />
95,673<br />
1.8,681<br />
1.6,992<br />
Per<br />
Acre<br />
(Bales<br />
0.65<br />
0.53<br />
0.58<br />
0.58<br />
0.59<br />
0.1*7<br />
o.5i<br />
0.55<br />
0.59<br />
0.1.8<br />
0.59<br />
0.60<br />
0.56<br />
0.66<br />
0.57<br />
0.57<br />
0.62<br />
0.53<br />
Acres<br />
39<br />
l.,51.9<br />
2,329<br />
3,973<br />
5,51.8<br />
. 16,1.38<br />
21,685<br />
13,1.03<br />
32,390<br />
21., 960<br />
50,115<br />
38,652<br />
26,978<br />
39,209<br />
U3,056<br />
290,1.78<br />
306,916<br />
133,61.6<br />
173,270<br />
1929<br />
lield<br />
(Bales)<br />
20<br />
1,330<br />
672<br />
1,51.3<br />
1,908<br />
5,1.73<br />
8,1.32<br />
5,14.9<br />
Hi, 170<br />
13,678<br />
25, ao<br />
18,781<br />
16,10.5<br />
16,087<br />
15,907<br />
13!., 329<br />
139,802<br />
614,781<br />
75,021<br />
Per<br />
Acre<br />
(Bales)<br />
0.51<br />
0.29<br />
0.29<br />
0.39<br />
0.3U<br />
0.33<br />
0.39<br />
o.la<br />
o.ia.<br />
0.55<br />
o.5i<br />
0.1.9<br />
0.61<br />
0.1)1<br />
0.37<br />
O.lt6<br />
O.lj6<br />
0.1.8<br />
0.1.3<br />
Per<br />
Cent<br />
Decrease<br />
(Acres)<br />
33.77<br />
36.71<br />
la. 91<br />
1.3.89<br />
39.73<br />
53.95<br />
59.8U<br />
U8.35<br />
la-85<br />
1.9.08<br />
15.77<br />
la.89<br />
W..UO<br />
35.55<br />
15.li9<br />
1.5.18<br />
1.0.96<br />
W.hk<br />
Source: U. S. Census, Agriculture, <strong>Georgia</strong>, 191$, First Series,<br />
Table 7, and U. S. Census, Agriculture, 1930, Volume n, Part 2, Table<br />
5.<br />
--245—
is equivalent to 1.1(2 tons <strong>of</strong> hay, while sorghum silage produces<br />
the equivalent <strong>of</strong> 1.75 tons <strong>of</strong> hay. Sorghum silage also has<br />
shown a higher feeding value than corn in silage feeding tests.<br />
Pasturage; The cheapest livestock feed is produced in good<br />
pastures. Improving pastures is not only an economical means <strong>of</strong><br />
producing feed, tut Improving pastures means less acreage per<br />
animal, thereby enabling the farmer to produce more livestock on<br />
Sut.....<br />
ElfiiHcriif<br />
Expcrincnt<br />
Sntioti . . .<br />
Grorpt<br />
T«ft<br />
Induniil. .<br />
. . Ecoaoak<br />
Rotarcb .<br />
a given acreage. One <strong>of</strong> the first things farmers in the Northeast <strong>Georgia</strong><br />
Area should do to increase their livestock is to Improve their pastures.<br />
Improved pastures are the foundation <strong>of</strong> both beef cattle and dairy<br />
operations on the one hand and soil improvement on the other. By the<br />
selection <strong>of</strong> the particular hay crop best suited to the individual farmer's<br />
land, almost any land which is either not being otherwise used, or which<br />
has become depleted through erosion or over-cropping may be restored to<br />
usefulness and fertility. The greatest possibility <strong>of</strong> improving the live<br />
stock phase <strong>of</strong> the Northeast <strong>Georgia</strong> Area's agriculture, seems to be in<br />
Table A-33<br />
Value <strong>of</strong> Dairy Products Sold in 1939 and in 1929 in the Northeast<br />
<strong>Georgia</strong> Area by Ki-nd and by Panels' and Counties<br />
Counties<br />
Over 70*<br />
Subsistence<br />
Farms<br />
Towns<br />
Dnion<br />
Habun<br />
White<br />
Lumpkin<br />
Dawson<br />
Eabersham<br />
Total<br />
Under 70*<br />
Subsistence<br />
Banks<br />
Stephens<br />
Hall<br />
Forsyth<br />
Jackson<br />
Uadison<br />
Barrow<br />
Franklin<br />
Hart<br />
Total<br />
Area Total<br />
Panel I<br />
Panel H<br />
Total Value<br />
1939<br />
* 6,716<br />
2,363<br />
19,259<br />
2,U73<br />
6,905<br />
2,326<br />
1.1,001.<br />
81,01.6<br />
16,220<br />
28.151<br />
129,725<br />
35,183<br />
3lt,731<br />
28,027<br />
27,271<br />
19,856<br />
32,180<br />
351, 3U.<br />
U32,390<br />
122,661<br />
309,729<br />
1929<br />
* 6,532<br />
5,553<br />
16,088<br />
U.137<br />
5,225<br />
i.,271<br />
39,023<br />
80,829<br />
21,836<br />
19,092<br />
66,079<br />
63,381.<br />
51,1.60<br />
1.0,502<br />
1*0,689<br />
lil,629<br />
29,830<br />
375,001<br />
1(55,830<br />
17U,905<br />
280,925<br />
Whole Milk Sold<br />
1939<br />
1929<br />
* 1..079 * 1,606<br />
769<br />
15,672<br />
1(63<br />
6,202<br />
200<br />
35,01.7<br />
62,1.32<br />
10,667<br />
21,187<br />
111,360<br />
1,681.<br />
23,092<br />
12,293<br />
15,582<br />
9,095<br />
17,863<br />
222,823<br />
285,255<br />
1.7,1*22<br />
237,833<br />
1,216<br />
8,71(7<br />
656<br />
1,875<br />
200<br />
22,1(88<br />
36,788<br />
1,631<br />
7,669<br />
29,590<br />
2,625<br />
15,260<br />
2,1(98<br />
20,1(26<br />
10,082<br />
5,707<br />
95,1(88<br />
132,276<br />
31,256<br />
101,020<br />
Cream Sold<br />
1939<br />
*2,181(<br />
1,125<br />
535<br />
1,003<br />
1,251<br />
6,098<br />
l,7U7<br />
»<br />
1,703<br />
1,53*<br />
5,1(11<br />
532<br />
1,397<br />
3,228<br />
15,551.<br />
21,652<br />
9,171<br />
12,1(81<br />
1929<br />
>3,181<br />
1,729<br />
3,122<br />
1,631<br />
6,812<br />
16,1(75<br />
7,329<br />
l,Urf<br />
2,1(1(1<br />
Id<br />
1(,319<br />
U(,250<br />
1,01(6<br />
8,81.9<br />
9,21(9<br />
1(8,971<br />
65,1(1(6<br />
2U,586<br />
1(0,860<br />
Butter Sold<br />
1939<br />
* 1(53<br />
1(69<br />
3,052<br />
1,007<br />
703<br />
2,126<br />
lu7Q6<br />
12,516<br />
3,806<br />
6.63U<br />
16,662<br />
33,1(86<br />
10,103<br />
10,323<br />
11,157<br />
9,361.<br />
11,089<br />
112,621.<br />
155,11(0<br />
66,055-<br />
59,085<br />
Source: B. S. Census, Agriculture, <strong>Georgia</strong>, 191.0, Third Series,<br />
Table 16.<br />
•KWhere less than three farms reported, data are not included.<br />
—246—<br />
1929<br />
1 1,71(5<br />
2,608<br />
U,219<br />
i,85o<br />
3,350<br />
It, 071 9,723'<br />
27,566<br />
12,376<br />
1<br />
9,976<br />
3U.01.8<br />
61,218<br />
31,881<br />
23,751.<br />
19,217<br />
22,698<br />
ll(,87l»<br />
230,51(2<br />
258,108<br />
305,063<br />
139,01(5
an increase in the production, <strong>of</strong> feeds <strong>of</strong> the right kind. This<br />
will lead to the handling <strong>of</strong> more animals at a pr<strong>of</strong>it. Steps<br />
which may improve the live«tock industry are:<br />
1. Use <strong>of</strong> legumes more extensively to improve the<br />
quality <strong>of</strong> feed and increase yields.<br />
2. Maintaining or increasing the present yield <strong>of</strong><br />
corn.<br />
3- Increasing the acreage <strong>of</strong> oats for feed.<br />
Ij. Improving pasture lands by proper seeding and the<br />
use <strong>of</strong> phosphates.<br />
5. Bringing idle or fallow land into use by establish-<br />
Table A-30<br />
Dairy Products Sold and Traded in the Northeast<br />
<strong>Georgia</strong> Area for 1939, by Type <strong>of</strong> Farm,<br />
and by Panels and Counties<br />
Counties<br />
Over 70$<br />
Subsistence<br />
Farms<br />
Towns<br />
tlnion<br />
Rabun<br />
Hhite<br />
Lunpktn<br />
Bauson<br />
Habersham<br />
Total<br />
Under 70*<br />
Subsistence<br />
Banks<br />
Stephens<br />
Hall<br />
Forsyth<br />
Jackson<br />
Madison<br />
Barrow<br />
Franklin<br />
Hart<br />
Total<br />
Area Total<br />
Panel I<br />
Panel II<br />
Dairy Farms<br />
Dollar<br />
Value<br />
» —<br />
9,758<br />
29,022<br />
33,780<br />
21,912<br />
109,350<br />
17,892<br />
11,939<br />
iii,3ii<br />
175,U01*<br />
2Ui,18l4<br />
26,250<br />
187,931*<br />
Per<br />
Cent<br />
1.68<br />
3.56<br />
1.19<br />
5.29<br />
7-90<br />
1.30<br />
1.20<br />
0.91<br />
1.76<br />
1.62<br />
0.5U<br />
2.26<br />
Field Crop<br />
Farms<br />
Dollar<br />
Value<br />
( __<br />
*<br />
1,235<br />
1,272<br />
163<br />
383<br />
U,0l*9<br />
7,102<br />
3,181<br />
2,1*77<br />
11,557<br />
16,51*7<br />
11,831<br />
11*,1*99<br />
11,122<br />
11,921<br />
13,1*62<br />
96,597<br />
103,699<br />
55,630<br />
1*8.069<br />
Per<br />
Cent<br />
*<br />
0.21<br />
0.28<br />
O.Olt<br />
0.17<br />
0.50<br />
0.22<br />
0.1*9<br />
0.60<br />
0.83<br />
1.1*2<br />
0.36<br />
1.2li<br />
1.11<br />
0.95<br />
0.66<br />
0.97<br />
0.78<br />
l.Ut<br />
0.58<br />
Other Farms<br />
Dollar<br />
Value<br />
* 2,621*<br />
2,231<br />
7,986<br />
1,287<br />
767<br />
973<br />
5,1*53<br />
21,321<br />
2,582<br />
U, 259<br />
15,1*16<br />
8,571.<br />
5,1*37<br />
5,972<br />
5,21*9<br />
3,263<br />
1.55U<br />
52,356<br />
73,677<br />
21,3l»9<br />
S2.328<br />
Per<br />
Cent<br />
1-17<br />
0.39<br />
1.37<br />
0.28<br />
0.21<br />
0.1*1*<br />
0.67<br />
0.66<br />
0.2)0<br />
1.03<br />
1.1:<br />
o.7l*<br />
0.1*0<br />
o.5i<br />
0.53<br />
0.26<br />
0.10<br />
0.52<br />
0.56<br />
0.1*1*<br />
0.61<br />
Source: C. S. Census, Agriculture, <strong>Georgia</strong>, 19ltO,<br />
Third Series, Tables 19 and 17^ The Census Items, ———<br />
"livestock" and "Other livestock Products" have been<br />
combined. The per cent figures are per cent <strong>of</strong> the<br />
the Area, Panel, or Courty. Col. 5 Is calculated by<br />
subtracting Col. 1 and Col. 3 from totals in Table 17.<br />
«Less than 3 farms reporting, data not included. _<br />
—247—<br />
Exptwnt<br />
Stirion . . .<br />
bdwniil. .<br />
..Eco<br />
Rontth<br />
ing soil conserva<br />
tion practices<br />
that will provide<br />
additional pas<br />
ture or feed for<br />
livestock.<br />
Eetail <strong>of</strong><br />
Crop Adjustment;<br />
As previously<br />
indicated, con<br />
siderable ad<br />
justment is<br />
needed in feed<br />
production in<br />
the Northeast<br />
<strong>Georgia</strong> Area in<br />
order to maintain<br />
the present num<br />
ber <strong>of</strong> livestock<br />
and to produce<br />
good quality<br />
animals. Farmers<br />
in the Northeast<br />
<strong>Georgia</strong> Area<br />
should go as far<br />
as possible to<br />
-increase their<br />
livestock feed<br />
production.<br />
Sweet<br />
Potatoes; Sweet<br />
potatoes have<br />
not been con<br />
sidered as a pos<br />
sible livestock<br />
feed in making<br />
these estimates<br />
for the Northeast<br />
<strong>Georgia</strong> Area for<br />
the reason that<br />
the total acre<br />
age is small and<br />
is very largely<br />
for taman con<br />
sumption. It is
difficult under these conditions to estimate what sort <strong>of</strong> in<br />
crease is practical. The najor limitation is the hand-setting<br />
<strong>of</strong> slips. The expansion <strong>of</strong> sweet potato production appears to<br />
be dependent upon finding implements and developing practices<br />
asking it possible to plant "draws" with less labor than it<br />
takes for hand planting, and to plant sweet potatoes whenweather<br />
is clear and soil dry. The high feed value <strong>of</strong> sweet<br />
potatoes per acre cannot now be capitalized because <strong>of</strong> a plant<br />
ing practice <strong>of</strong> waiting on a rain to put out sweet potatoes.<br />
If the use <strong>of</strong> planting machines* can be adopted in parts- <strong>of</strong> the North<br />
east <strong>Georgia</strong> Area, it would then be possible and desirable to plant many<br />
thousands <strong>of</strong> acres purely for feed in the southern counties.<br />
In addition to being a good hog feed, the sweet potato <strong>of</strong>fers -good<br />
Table A-36<br />
opportunities as a<br />
source <strong>of</strong> carbo<br />
Volume <strong>of</strong> Uilk Products Sold in the<br />
hydrates for cat<br />
Northeast <strong>Georgia</strong> Area, in 1939<br />
tle feeds. The<br />
by Panels and Counties<br />
average per-acre<br />
yield <strong>of</strong> corn in<br />
Farms<br />
the Northeast<br />
Reporting<br />
Sales in 1939<br />
<strong>Georgia</strong> Area in<br />
1939<br />
1939 was 11.02<br />
•hole<br />
bushels. The corn<br />
Hilk Butter Uilk Cream Butter equivalent <strong>of</strong> the<br />
Sold Sold (Gallons) (Pounds] [Pounds) per-acre sweet<br />
potato yield in<br />
12 22 11,655 9,926 2,383 the Area was ap<br />
21 Ik 2,198 5,355 2,1*68 proximately •' 25<br />
83 131* 1*7,1*92 2,1*3!* 15,262 bushels. The<br />
16 59 1,322 1*,557 5,299 production'<strong>of</strong><br />
12 1*9 17,720<br />
3,698 twice the corn<br />
7 138 570<br />
11,190 equivalent in<br />
62 160 103,080 5,685 23,532 sweet potatoes<br />
213 (506 182*,037 27,957 63,832 agrees with data<br />
on the produc<br />
tion <strong>of</strong> pork<br />
from com and<br />
19 228 30,1*78 7,91*3 18,123 sweet potatoes<br />
38 202 51*,326 # 30,156 reported by the<br />
157 571* 278,399 7,71*2 83,312 Coastal Plains<br />
7 1,367 6,013 * 167,1*32 Experiment Station.<br />
80 h29 65,976 6,980 50,513 Recent studies in<br />
51 kak 3fc,U*6 21..596 1.9,158 dicate than famars<br />
53 h2k 1*5,829 2,1*19 53,130 could produce at<br />
53 529 25,985 6,352 1*1*,592 least 200 bushels<br />
33 1*25 57,621 lit, 035 50,1*01; <strong>of</strong> sweet potatoes<br />
k91 1*,582 598,773 70,067 51*6,320 per acre if size<br />
(quality) were <strong>of</strong><br />
70k 5,188 782,810 98,021* 610,652 no consideration.<br />
H,l| 2,620 11*3,609 1*1,050 320,121* In the production<br />
560 2,563 639,201 56,971* 290,528 <strong>of</strong> sweet potatoes<br />
Counties<br />
Over 70*<br />
Subsistence<br />
FanBs<br />
Towns<br />
Union<br />
Rabun<br />
white<br />
Lumpkin<br />
Dawson<br />
Habersham<br />
Total<br />
tinder 70*<br />
Subsistence<br />
Banks<br />
Stephens<br />
Hall<br />
Forsyth<br />
Jackson<br />
Madison<br />
Barrow<br />
Franklin<br />
Hart<br />
Total<br />
Area Total<br />
Panel I<br />
Panel II<br />
Source: U. S. Census , Agriculture, <strong>Georgia</strong>,<br />
19i*0. First Series, Table U-<br />
•Hlhere less than thre e farms reported, data are<br />
not included.<br />
—248—<br />
2 See Fortune,<br />
October, 191*5, page<br />
178.
for hog and cattle feed, quality is <strong>of</strong> no consideration, and 200<br />
bushels <strong>of</strong> sweet potatoes are equivalent, in terms <strong>of</strong> feed, to<br />
about IjO or 50 bushels <strong>of</strong> com.<br />
Reallocation <strong>of</strong> Acreage; Table A-20 shows the corn equlvalents<br />
<strong>of</strong> feed crops produced in the Northeast <strong>Georgia</strong> Area in<br />
1939- Table A-U9 shows suggested crop adjustments which may<br />
improvp the feed situation in the Northeast <strong>Georgia</strong> Area. The _<br />
Table A-49<br />
Suggested Changes in Crops to<br />
Improvo Feed Situation in<br />
Northeast <strong>Georgia</strong> Area'<br />
Principal<br />
Crops<br />
Cotton<br />
Grain Crops<br />
Forage Crops 2<br />
Jfcsture<br />
Acres<br />
1939<br />
168.345<br />
359,422<br />
37,445<br />
128,974<br />
1 From Table A-27<br />
*From Table A-26<br />
Suggested<br />
Acres<br />
1950<br />
160,745<br />
341,901<br />
86,010<br />
157,307<br />
rough formula indicated by Table A-lj9<br />
is (1) to increase permanent pasture<br />
acreage, (2) to decrease slightly grain<br />
acreage, and (3) to increase acreage in<br />
forage crops. Tables A-26 and A-27 show<br />
In detail suggested hay and grain ad<br />
justments for the Area, for the six<br />
northern counties, and for the ten<br />
southern counties. These suggested<br />
reallocations <strong>of</strong> crop acreage should.,<br />
<strong>of</strong> course, in the case <strong>of</strong> any indi<br />
vidual farm be modified by a consider<br />
ation <strong>of</strong> the actual acreage available,<br />
and by the types <strong>of</strong> livestock which<br />
are to be produced on that farm.<br />
Table A-27 shows grain production<br />
for 1939 In the Northeast <strong>Georgia</strong> Area,<br />
and a suggested reallocation <strong>of</strong> acreage.<br />
A total reduction <strong>of</strong> grain acreage for the Area from 359,l£2 acres to<br />
3ltl,901 acres is suggested. If the 1939 yield per acre remained the same,<br />
there would be a resulting decrease <strong>of</strong> total tonnage from 106,095 tons to<br />
100,013 tons. However, with the suggested 70 per cent increase in yield<br />
per acre the total tonnage would be increased to 170,023 tons. This 70<br />
per cent increase in yield per acre is believed to be possible if the<br />
four practices Riven on page 239 are followed.<br />
Number<br />
<strong>of</strong><br />
Animal<br />
Units<br />
125,000<br />
Of the 106,095 tons <strong>of</strong> grain produced in 1939, approximately lli,390<br />
TatUe A-50<br />
tons were used for<br />
seed and human con<br />
Livestock Goals for the Northeast<br />
sumption. Sub<br />
<strong>Georgia</strong> Area, X950 and 1955<br />
tracting then, we<br />
arrive at 91,705<br />
tons used for animal<br />
feed in 1939.<br />
Tons <strong>of</strong> Feed<br />
to be Hequired<br />
in 1950<br />
Corn<br />
Bquiv.<br />
118,080<br />
Hay<br />
Equiv.<br />
162,500<br />
Number<br />
<strong>of</strong><br />
Animal<br />
Units<br />
144,000<br />
Tons <strong>of</strong> Peed<br />
to be Re<br />
quired in 1955<br />
Corn<br />
Bquiv.<br />
135,300<br />
Hay<br />
Bquiv.<br />
187,200<br />
Of the 100,013<br />
tons <strong>of</strong> grain that<br />
could be'produced from<br />
the suggested real<br />
located acreage, ap<br />
proximately 15,717<br />
tons would be needed for seed and human consumption, or (subtracting)<br />
Bit,296 tons for livestock. Tilth a 70 per cent increase in yield per acre,<br />
the total yield would be 170,023 tons. Of this, approximately 17,117<br />
tons are used for seed and human consumption, leaving 152,906 tons to be<br />
used for livestock, with the suggested reallocation <strong>of</strong> acreage and the<br />
proposed 70 per cent increase in yield per acre.<br />
According to careful estimates, (made on the asstmption <strong>of</strong> good feed<br />
ing practices), the 1939 total corn equivalent could have supported 62,007<br />
—249—
animal units (see Table A-21). With suggested crop reallocation,<br />
the proposed 100,013 acres at the same yield per acre could have<br />
maintained 53,U52 animal units. With reallocation and an in<br />
crease <strong>of</strong> 70 per cent in yield, available corn and com equiv<br />
alents could support 99,370 animal units.<br />
In the preceding calculations, allowance has been made for<br />
both seed and human consumption. Since it is a fact that a part<br />
State .<br />
Eipenanat<br />
Station . . .<br />
Ctarfif<br />
Tich<br />
IndmxrUI . .<br />
. . Economic<br />
Roan* . .<br />
<strong>of</strong> the grain used for consumption is imported, these estimates represent an<br />
understatement. The amount <strong>of</strong> this understatement <strong>of</strong> the animal units,<br />
however, is small, ranging from perhaps four to ten per cent, and there is<br />
no practical way <strong>of</strong> determining on a county or Area basis just what it is.<br />
Maximum Animal Units in the Kortheast <strong>Georgia</strong> Area; Table A-21 sets<br />
up the maxumaa number <strong>of</strong> animal units the Northeast <strong>Georgia</strong> Area could<br />
sustain. There are three groups <strong>of</strong> calculations, grazing, grain, and hay.<br />
It is assumed in each case that in 191iO the feed source mentioned could<br />
support the estimated number <strong>of</strong> animal units, if the supply <strong>of</strong> the other<br />
two sources were sufficient to penult a normal feeding program. The<br />
table shows that grazing in the Northeast <strong>Georgia</strong> Area could maintain<br />
201,657 animal units, if other feed sources were normal. However, the<br />
Kortheast <strong>Georgia</strong> Area does not produce enough grain and winter feeds<br />
(hay, ensilage) to feed adequately 201,657 animal units if they are<br />
distributed in the same proportion as obtains now.<br />
The 1939 hay production could have supported only 16,91L. Pasturage<br />
is apparently out <strong>of</strong> proportion to other factors, and a much more favor<br />
able balance is suggested.<br />
Livestock Goals; Table A-50 presents livestock goals for the North<br />
east <strong>Georgia</strong> Area for 1950 and 1955. It is an attempt to readjust the<br />
existing proportions, and to achieve a more favorable balance. These<br />
estimates, as others, are based on an assumption <strong>of</strong> improved feeding<br />
practices. It is suggested that by 1950 the Kortheast <strong>Georgia</strong> Area should<br />
Table A-28a<br />
Counties in Which the Per Cent <strong>of</strong> Total Income Derived<br />
from Dairy or Farm Livestock is Larger Than<br />
the Area Percentage From These Sources<br />
Counties<br />
Fall<br />
Stephens<br />
Rabur.<br />
Towns<br />
Habersham<br />
Livestock<br />
and Dairy<br />
Dollar<br />
Value<br />
$150,672<br />
U2,670<br />
51,632<br />
19,891<br />
69,351<br />
Per<br />
Cent<br />
13-05<br />
10.29<br />
8.37<br />
8.85<br />
3.57<br />
Livestock<br />
Dollar<br />
Value<br />
lid., 193<br />
114,017<br />
31,038<br />
H*,U99<br />
31,079<br />
Per<br />
Cent<br />
3-19<br />
3.38<br />
5-33<br />
6.1.5<br />
3-31<br />
Dairy<br />
Products<br />
Dollar<br />
Value<br />
«L36,U79<br />
28,653<br />
20,59U<br />
5,392<br />
38,772<br />
Per<br />
Cent<br />
9.86<br />
6.91<br />
3-51.<br />
2.1»0<br />
ii.75<br />
Sources D. S. Census, Agriculture, <strong>Georgia</strong>, 19iiO,<br />
Third Series, Table 17. (Cols. 2, k, and 6) percent<br />
age figures are per cent <strong>of</strong> total value <strong>of</strong> products<br />
sold, traded, and consumed. (Col. 3) livestock fig<br />
ures include the Census items "livestock" and "Other<br />
Livastock Products."<br />
—250—<br />
be able to carry<br />
125,000 animal<br />
units, and by 1955,<br />
UiIijOOO. The<br />
more immediate<br />
goal <strong>of</strong> 125,000<br />
animal units is<br />
an increase <strong>of</strong><br />
25,000 over the<br />
191tO total shown<br />
in Table A-17.<br />
This goal is at<br />
tainable only<br />
by increasing the<br />
feed production<br />
efficiency <strong>of</strong> the<br />
Area. It has al<br />
ready been noted<br />
that in 191*0 both<br />
the available<br />
com equivalent<br />
and the hay equiv<br />
alent were less<br />
than the theoretical
amount needed to provide a balanced ration for the 100,000 ani<br />
mal units then owned. Only on the basis <strong>of</strong> pasturage was there<br />
an excess. The "plowable" pasture available in 19liO was suf<br />
ficient for approximately 110,000 animal units— somewhat in<br />
excess <strong>of</strong> the total actually being carried. In addition there<br />
was available about 72,000 animal units <strong>of</strong> grazing on farm woodlots,<br />
and in a few counties about 9,000 units on land not in<br />
farms. Apparently, then, grazing was being substituted for both<br />
Expcri<br />
Station .<br />
Tid,<br />
Indoitiul . .<br />
. . Economic<br />
Rnurcb . .<br />
hay and grain with probably some buying <strong>of</strong> concentrates. The greatest lack<br />
<strong>of</strong> balance in this apparent program seems to be the lack <strong>of</strong> available hay.<br />
A sound policy for the Area appears to be the transfer <strong>of</strong> .as much idle and<br />
fallow land as possible, and cotton land with low yield, to either hay land<br />
or pasture. Wherever possible, hay should be cut from permanent pasture<br />
in order-to make more grass available for winter feeding. In Table A-lt9<br />
it has been estimated that a total <strong>of</strong> 56,666 acres (see page 3li9) can be<br />
added to forage crops and pastures, and that more corn equivalent crops<br />
can be produced on slightly less acreage. Details <strong>of</strong> these adjustments<br />
are shown in Tables A-26 and A-27.<br />
TtHT-y and Livestock Values; Table A-33 gives the value <strong>of</strong> dairy<br />
products sold in 1939- and in 1929. However, since the factor <strong>of</strong> price<br />
fluctuation was not considered, comparison <strong>of</strong> production for the two dates<br />
cannot be used for accurate conclusions. Greatest gains were made in<br />
Hall county, where the total value <strong>of</strong> dairy products sold was almost<br />
doubled. Most <strong>of</strong> this increase was in thfi value <strong>of</strong> whole milk sold. For<br />
the Area as a whole, there is a large decrease in the value <strong>of</strong> cream and<br />
butter.<br />
Table A-28 shows the per cent livestock and dairy sales were <strong>of</strong> the<br />
total farm income. Hall^ Stephens, Rabun, Towns, and Habersham had the<br />
largest per cent <strong>of</strong> livestock and dairy sales in the Area (see Table<br />
A-28a).<br />
Tables A-30 and A-36 give further details <strong>of</strong> value and volume <strong>of</strong><br />
dairy products in the Northeast <strong>Georgia</strong> Area.<br />
Table A-32, which presents the per cent <strong>of</strong> cows and heifers in each<br />
county, in 1930 and 19UO, shows that greatest concentration was in Hall,<br />
Hart, Franklin, and Jackson counties.<br />
Table A-29 presents the value <strong>of</strong> livestock sold and traded in the<br />
Northeast <strong>Georgia</strong> Area in 1939 and the per cent <strong>of</strong> the total each county<br />
produced.<br />
—251—
Banks County<br />
Population: 1940 Total: 8,733; white ma let 4,033; white<br />
fenale: 4,039; Negro male: 324; Negro female: 332.<br />
Principal Crops; Cotton, hay, sweet potatoes and yams.<br />
Land distribution; Total land areai 147,840 acres; land*<br />
Sou ....<br />
Experiment<br />
Smio. . . .<br />
Indutriil . .<br />
. . Ecownak<br />
in farms: 118,039 acres; land in pasture: 10,798; land in woodlot: 45,112<br />
acres; other land in forests: 48,817 acres.<br />
Retail Trade Summary;<br />
Total<br />
Pood group<br />
General stores with food<br />
General merchandise<br />
Apparel group<br />
Furniture, radio group<br />
Automotive group<br />
Stores<br />
50<br />
2791<br />
—<br />
~~<br />
Sales<br />
(Add<br />
000)<br />
t 188<br />
86<br />
50*<br />
~<br />
—<br />
""—<br />
Filling stations<br />
Lumber, building,<br />
hardware<br />
Bating, drinking<br />
places<br />
Drug stores<br />
Other stores<br />
Sales<br />
(Add<br />
Stores OOP)<br />
—————<br />
TTeather<br />
————3<br />
Surmary;<br />
FM<br />
A H J J A S<br />
Station<br />
Average Ifcucimum Temperature<br />
Gillsville 52.5 53.7 65.3 71.3 81.3 «7.5 88.8 88.0 83.7 73.6 63.5 62.5<br />
Average ViniTmim Temperature<br />
32.8 32.6 42.6 47.3~57.7 64.3 SS.& 6.8 62.1 49.8 41.3 32.8<br />
Homer, County Seat<br />
1940 Population; 283.<br />
Railroads:None.<br />
Eighwa; State Highway 15, connecting Athens with Franklin, N. C.<br />
Industries;<br />
Manufacturer<br />
1. Garrison, 0. 5.<br />
Kind <strong>of</strong> Product<br />
Lumber<br />
Ifaysville<br />
33<br />
Number<br />
Kmployees<br />
1940 Population; 514.<br />
Railroads: Southern, connecting Atlanta with Athens.<br />
Highways: State Highway 98, connecting Jfeysville with TJ. S. Highway<br />
23 and State Highway 15 to the north and with State Highway 15 to the<br />
south.<br />
24<br />
*<br />
Sourse: U. 3. Census, other <strong>of</strong>ficial sources, and local sources.<br />
•Withheld to avoid disclosure.<br />
—252—
arrow Uounty<br />
Population; 1940 Total: 13,064; white male: 5,195;<br />
whiteTemale! 5,410; Negro male: 1,176; Negro female: 1,283.<br />
Principal Crops: Cotton, hay, sweet potatoes, yams.<br />
in farms: 94,494 acres; land in pasture: 5,009 acres; land in<br />
woodlot: 21,997 acres; other land in forests: 19,130 acres.<br />
Census <strong>of</strong> Manufactures: 1939<br />
Number <strong>of</strong> establishments 15<br />
Average wage earners for year 1,603<br />
Wages $ 873,535<br />
Cost <strong>of</strong> materials $3,398,813<br />
Value <strong>of</strong> products $5,462,920<br />
Value added $2,064,107<br />
Retail Trade Summary:<br />
Total<br />
Food group<br />
General stores with food<br />
General merchandise<br />
Apparel group<br />
Furniture, radio group<br />
iutomotive group<br />
Wholesale Trade Summary;<br />
Sales<br />
(Add<br />
Stores 000)<br />
138 $1,688<br />
52 490<br />
4 60<br />
7453 271<br />
50<br />
69<br />
88<br />
Number <strong>of</strong> establishments: 9<br />
Total sales, 1939: $565,000<br />
1937<br />
13<br />
1,102<br />
464,697<br />
$1,978,454<br />
$2,754,412<br />
$ 775,958<br />
Filling stations<br />
Limber, building,<br />
hardware<br />
Eating, drinking<br />
places<br />
Drug stores<br />
Other stores<br />
Sutc ....<br />
Eniuucrwc<br />
Expcriaunc<br />
Sutioa . . .<br />
Oocji.<br />
Tidi<br />
Indutiul . .<br />
. . EoMOBic<br />
Racaich . .<br />
1935<br />
12<br />
863<br />
t 373,697<br />
$1,277,918<br />
$2,196,434<br />
t 918,496<br />
Sales<br />
(Add<br />
Stores OOP)<br />
34 f 226<br />
4 120<br />
10 4 58<br />
90<br />
11 166<br />
Winder, County Seat<br />
1940 Population: 3,974. Area <strong>of</strong> Municipality: square miles.<br />
Railroads : Seaboard Air Line, connecting Atlanta with Athens.<br />
Gainesville Mfdland, connecting Gainesville 'with Monroe.<br />
Highways : U. S. Highway 29, State Highway 8, connecting Atlanta<br />
with Athens. State Highway. 11, connecting Macon with Jefferson. State<br />
Highway 53, connecting Winder with U. S. Highway 23, connecting Atlanta<br />
and Gainesville.<br />
Paved Streets: 12 miles; sidewalks ; 10 miles.<br />
Tax Rate, 1943; 15 mills; tax rate. 1940; 15 mills.<br />
Public WorTcsT Utilities: Fire and Health and Sanitary Departments<br />
adequate. Electricity supplied by <strong>Georgia</strong> Power Company. Ho gas. Source<br />
<strong>of</strong> T/ater system: creek.<br />
Other Services: Grade schools: 1 white, 1 non-white; Eigh schools: 1<br />
white, 1 non-white. Churches: 6 white, 4 non-white. Libraries.- 1 white.<br />
Banks: 1, with total capital and surplus <strong>of</strong> $75,000. Airpurts: 1, with<br />
runway <strong>of</strong> 3,000 feet.<br />
Source: 0. S. Census, other <strong>of</strong>ficial sources, and local sources.<br />
—253—
Barrow<br />
Industries:<br />
Manufacturer<br />
1. Harrow Manufacturing Co.<br />
2. Bellgrade Manufacturing<br />
Co.<br />
3. Carwood Manufacturing Co.<br />
£. Bnpire Manufacturing Co.<br />
5. Superior Garment Manufac<br />
turing Co.<br />
5. Winder Oil Mill Co., Inc.<br />
7. national Furniture Co.,<br />
Inc.<br />
8. Sumaerour, G. W. , ft Co.,<br />
Inc.<br />
9. Winder Creamery<br />
10. Lanthier's Machine Shop<br />
11. Beacon Manufacturing Co.<br />
12. Southern Waistband<br />
_ , Number State ....<br />
Emmeerint<br />
Kind <strong>of</strong> Product Employees |«P«:-»"<br />
Men's work pants 165 T*A<br />
Men's shirts, pants, coats and overalls 270 ££
Dawson County<br />
Population; 1940 Total: 4,479; white malej 2,266; white<br />
female: 2,149; Negro mala: 64; Negro female --.<br />
Principal Crops: Cotton, hay, sweet potatoes and yams.<br />
Land. Distribution; Total land area: 136,320 acres; land<br />
in farms: ^4,314 acres; land ia pastures 3,957 acres; land in woodloti<br />
38,703 acres; other land in forests: 83,316 acres.<br />
Census <strong>of</strong> Manufacturesi<br />
Nunber <strong>of</strong> establishments<br />
Average wage earners<br />
Wages<br />
Cost <strong>of</strong> materials<br />
Value-<strong>of</strong> products<br />
Value added<br />
Retail Trade Summaryi<br />
Total<br />
Food group<br />
General stores -with food<br />
General merchandise<br />
Apparel group<br />
Furniture, radio group<br />
Automotive group<br />
Sales<br />
(Add<br />
Stores 000)<br />
40 4<br />
24<br />
7<br />
1939 ———3<br />
26<br />
76 Filling stations<br />
24 Lumber, building,<br />
* hardware<br />
Eating, drinking<br />
places<br />
Drug stores<br />
Other stores<br />
Da-wsomrille, County Seat<br />
1937 1935<br />
Sales<br />
(Add<br />
Stores OOP)<br />
7 4<br />
1940 Population; 319.<br />
Railroads: Hone.<br />
HighwaysT U. S. Highway 19, State Highway 9, connecting Atlanta with<br />
Murphy, N. 0. State Highway 53, connecting Gaiuesville with Rome.<br />
2<br />
26<br />
, *<br />
Industriesi<br />
Manufacturer<br />
1. Haamer, A. E.<br />
2. Sherard, B. A-<br />
Kind <strong>of</strong> Product<br />
Lumber<br />
Lumber<br />
Number<br />
Employees<br />
10<br />
18<br />
Sourcei U. 3. Census, other <strong>of</strong>ficial sources, and looal sources.<br />
"Withheld to avoid disclosure.<br />
—255—
Forsyth County<br />
Population: 1940 Total: 11.332; white male: 5,664; white<br />
female: 5,617; Hegro male: 22; Hegro fenale: 19.<br />
Principal Crops: Cotton, hay, sweet potatoes and yams.<br />
land Distribution: Total land area: 155,520 acres; land<br />
in farms: 133,192 acres; land in pasture: 9,872 acres; land in woodlott<br />
56,343 acres; other land in forests: 2,460.<br />
Retail Trade Summary:<br />
Total<br />
Food group<br />
General stores with food<br />
General merchandise<br />
Apparel group<br />
Furniture, radio group<br />
Automotive group<br />
Stores<br />
104 t<br />
39<br />
335<br />
—<br />
1<br />
1<br />
Sales<br />
(Add<br />
000)<br />
560<br />
91<br />
187<br />
72<br />
• —<br />
*<br />
*<br />
Wholesale Trade Summary;<br />
Number"<strong>of</strong> establishmentsi 6<br />
Total Sales 1939s $168,000<br />
dimming, County Seat<br />
Filling stations<br />
Lumber, building.<br />
hardware<br />
Bating, drinking<br />
places<br />
Drug stores<br />
Other stores<br />
1940 Population: 958.<br />
Railroads: Hone.<br />
Highways: U. S. Highway 19, State Highway 9,<br />
Jttrphy, S. C.<br />
Industries:<br />
Banufaqturer Kind <strong>of</strong> Product<br />
1. Forsyth County Hews<br />
Freezer Locker Plant - 550 Lockers.<br />
Stores<br />
10 f<br />
5<br />
— •<br />
1<br />
9<br />
Sales<br />
(Add<br />
000)<br />
52<br />
21<br />
—<br />
*<br />
81<br />
connecting Atlanta with<br />
Number<br />
Knployees<br />
Source: U. S. Census, other <strong>of</strong>ficial sources, and local sources.<br />
^Withheld to avoid disclosure.<br />
—256—
Franklin County<br />
Suu . . . .<br />
Population; 1940 Total: 15.612j white male: 6,657; white<br />
Tie*<br />
female: 6,685; Negro male: 1,105; Negro female: 1,165.<br />
Principal Crops; Cotton, hay, sweet potatoes and yams.<br />
Land Distribution: Total land area: 172,160 acres;Jand in<br />
farms: 150,905 acres; land in pasture; 8,527 acres; land in woodlot:<br />
41,892 acres; other land in forests: 41,277 acres.<br />
Census <strong>of</strong> Manufactures; 193S 1937 1935<br />
Number <strong>of</strong> establishments 785<br />
Average wage earners for year 205 277 202<br />
Wages $ 90,756 $107,262 $102,224<br />
Cost <strong>of</strong> materials $214.661 $317.699 $346,115<br />
Value <strong>of</strong> products $362,009 $481,754 $525,542<br />
Value added $147,348 $164.055 $179,427<br />
Ketail Trade S'<br />
.ry:<br />
Total<br />
Pood group<br />
General stores with food<br />
General merchandise<br />
Apparel group<br />
Furniture, radio group<br />
Automotive group<br />
Tfooles&le Trade Summary;<br />
Number "<strong>of</strong> establishmentsi<br />
Total sales, 1939t<br />
Sales<br />
(Add<br />
Stores 000)<br />
174 $ 1.869<br />
80 488<br />
4 47<br />
14 239<br />
3 7<br />
7 78<br />
6 264<br />
$1,474,000<br />
Carnesville, County Seat<br />
Killing stations<br />
Lumber, building.<br />
hardware<br />
Eating, drinking<br />
places<br />
Drug stores<br />
Other stores<br />
Stores<br />
Sales<br />
(Add<br />
OOP)<br />
22 $ 210<br />
8 189<br />
7 27<br />
6 60<br />
17 260<br />
1940 Population:<br />
AltitnHeT 800 feet.<br />
3S1. Area <strong>of</strong> Municipality; 1 square nile.<br />
Railroads i None.<br />
Highways: State Highway 67, connecting Commerce with Seneca, South<br />
Carolina.STate Highway 106, connecting Carnesville and Toccoa. State<br />
Highway 51, connecting Carnesville with Hartwell.<br />
Paved Streets: 2 miles; sidewalks: & mile.<br />
Tax Hate, 1943; 6 mills; tax rate, 1940: 6 mills.<br />
Puolie Iforks and Utilities; Fire Department inadequate. Health<br />
Department adequate. Sanitary Department inadequate. No gas. Electricity<br />
supplied by <strong>Georgia</strong> Power Company. Source <strong>of</strong> water system: Artesian.<br />
Other services: Grade schools: 1 white, 1 non-white; High schools:<br />
1 white, 1 non-white. Libraries: 2 white, 1 non-white. Banks: 1,<br />
(private bank) with total capital and surplus <strong>of</strong> $5,000. Churches: 4<br />
white, 2 non-white.<br />
Industries:<br />
Manufacturer<br />
1. Sinn Manufacturing Co.<br />
Source:<br />
Kind <strong>of</strong> Product<br />
Number<br />
Bnployees<br />
U. S. Census, other <strong>of</strong>ficial sources, and looal sources.<br />
—257—
Lavonia.<br />
1940 Population; 1,667. Altitude; 865 feet.<br />
Railroads: Southern, connecting Atlanta with Elberton.<br />
HighwaysT State Highway 17, connecting Toccoa with Hashingto'SI<br />
State Highway 59, connecting Commerce and Seneca, S.C.<br />
Industries:<br />
Manufacturer<br />
1. Rilcon Ifanufacturlug Co.<br />
2. La-vonia Manufacturing Co.<br />
3. Lavonia Novelty Yarn Co.<br />
4. Lavonia Lumber Co.<br />
Freezer Locier Plant - 300 lockers.<br />
Eizid <strong>of</strong> Produot<br />
Hen's Shirts and Pants<br />
Novelty t Colored Yarns<br />
Hovelty Yarns<br />
1940 Population: 1,549. Altitude; 910 feet.<br />
Railroads: Southern, connecting Atlanta and Elberton.<br />
HighwaysT U. S. Highway 29, State Highway 8, connecting Atlanta with<br />
Greenville. State Highway 17, connecting Toccoa with Washington.<br />
Tax Bate, 1943: 1 mill.<br />
Fucllc Worlcs and Utilities ; Fire, Health and Sanitary Departments<br />
adequate. Electricity supplied by <strong>Georgia</strong> Power Company. Source <strong>of</strong> water<br />
system: spring and wells.<br />
Other Services; Grade schools i 1 white, 1 non-*hite; High schools:<br />
1 white, 1 non-whitej<br />
5 white; 2 non-white.<br />
surplus <strong>of</strong> (30,000.<br />
Colleges; 1 white-. Libraries: 1 white. Churches:<br />
Hospitals: 2. Banks: 1, with total capital and<br />
Industries;<br />
Manufacturer<br />
1. Jefferson Mills #3, The<br />
2. Harbin Lumber Co.<br />
3. Veal, Martin<br />
Kind <strong>of</strong> Produot<br />
Cotton Cloth, Dobbies & Specialties<br />
Lumber<br />
Humber<br />
Bnployees<br />
298<br />
—S58—
Habersham County<br />
Sun ....<br />
Engintcriaf<br />
Experiment 1<br />
Station .<br />
^•a<br />
. Population; 1940 Total: 14,771; white male: 6,949; white<br />
female: 7,155; Negro male: 305; Negro female: 362.<br />
Principal Crops; Cotton, hay, sweet potatoes and yams.<br />
Land Distribution; Total laud area: 181,120 acres; land<br />
in farms: 99,159 acres; land in pasture: 8,083 acres; land in woodlot:<br />
51,098; other land in forests: 72,283 acres.<br />
Census <strong>of</strong> Manufactures;<br />
Humber <strong>of</strong> establishments<br />
Average wage earners for year<br />
Wages<br />
Cost <strong>of</strong> materials<br />
Value <strong>of</strong> products<br />
Value added<br />
1939 1937<br />
485<br />
278,369<br />
630,834<br />
1,193,201<br />
562,367<br />
Txh<br />
Industrial .<br />
1935 ——12<br />
397<br />
Retail Trade Summary;<br />
Total<br />
Food group<br />
General stores with food<br />
General merchandise<br />
Apparel group<br />
Furniture, radio group<br />
Automotive group<br />
Sales<br />
(Add<br />
Stores OOP)<br />
171 | 2,075 Filling stations<br />
55 469 Lumber, building,<br />
149367 204 hardware<br />
168 Bating, drinking<br />
89 places<br />
89 Drug stores<br />
329 Other stores<br />
Sales<br />
(Add<br />
Stores OOP)<br />
44 t 276<br />
11 253<br />
9 41<br />
4 86<br />
9 71<br />
Wholesale Trade Summary;<br />
Miimhar-"nf<br />
Total sales, 1939i<br />
12<br />
$971,000<br />
Weather Summary;<br />
———J~ F MAMJJA S 0 N D<br />
Station Average Max^nm Temperature<br />
Cornelia 51.3 54.8 60.9 71.2 77.0 34.8 SB.9 55.2 81.6 70.3 59.2 52.8<br />
Average M-ini'mnm Temperature<br />
33.0 35.9 40.5T9 .1 56. 0 63.9 66.3 65.7 62.6 50.8 41.0 34.9<br />
Clarkesville, County Seat<br />
1940 Population: 850. Area <strong>of</strong> Municipality; 6 square miles.<br />
Altitude; 1.365 feet.<br />
Railroads: None<br />
Highways Stata Highway 15 and DV S. Highway 23, connecting Atlanta<br />
with Franklin, North Carolina.<br />
Paved Streets; 6 miles; sidewalks: 4 miles.<br />
Tax Bate, 1943; 1 mill; tax rate, 1940i 1 mill.<br />
Public Works and Utilities: Fire and Health Departments adequate.<br />
Sanitary Department adequate. No gas. Electricity supplied by <strong>Georgia</strong><br />
Power Company. Source <strong>of</strong> water system; Soque River.<br />
Other Services: Grade schools: 1 white, 1 non-white; High schools:<br />
1 whitei Colleges: 1 white. Churches: 5 white, 2 non-white. Libraries:<br />
j white. Banks: 1, with total capital and surplus <strong>of</strong> J50.000.<br />
Source: U. S. Census, other <strong>of</strong>ficial sources, and local sources.<br />
—259—
J<br />
Industries:<br />
Manufacturer<br />
Number<br />
<strong>of</strong> Product Baployees<br />
1. Killer, C. 11. Fruit Packing<br />
2. Kebro Manufacturing Co. Novelty Funliture<br />
4 Tfooden toys<br />
3. Hill Planing Co.<br />
4. Tanner, W. A., Co. Limber<br />
Freczoi- looker Plant - 250 Lockers.<br />
Cornelia<br />
50<br />
13<br />
15<br />
30<br />
Ex<br />
Surkn .*. .<br />
T«*<br />
Iiuhuttut . .<br />
Racarch . .<br />
1940 Population: 1,808. Area <strong>of</strong> Municipality; 1 3/4 square miles.<br />
AltituHeT 1,535 feet.<br />
Pjtilroads; Southern, connecting Atlanta with Greenville, South Caro<br />
lina.Tallulah Falls, connecting Cornelia with Franklin, Korth Carolina.<br />
Highways: U. S. Highway 23, State Highway 13, connecting Atlanta<br />
with Seneca, South Carolina. State Highway 15, connecting Athens with<br />
Franklin, North Carolina.<br />
paved Streets: 6 miles; sidewalks: 2 miles.<br />
lag Rate, 1943: 15 mills; tax rate, 1940; 20 mills.<br />
Public Works and Utilities; Fire and Health Departments adequate.<br />
Sanitary Department adequate. Ko gas. Electricity supplied by <strong>Georgia</strong><br />
Power Conpany. Source <strong>of</strong> water system: creek.<br />
Other Services: Grade schools: 1 white, 1 non-white; High schools:<br />
1 white, 1 non-white. Churches: 3 white, 2 non-white. Libraries: 1<br />
white. Banks: 2, with total capital and surplus <strong>of</strong> $145,000.<br />
Industries;<br />
Number<br />
Manufacturer Kind <strong>of</strong> Product Baployees<br />
1. <strong>Georgia</strong> Shirt Co.<br />
2. Cornelia Hatchery<br />
3. Cason, George H.<br />
4. Cornelia Cabinet Co.<br />
6. Cornelia Manufacturing Co.<br />
6. Cornelia Machine Shop<br />
7. Baldwin Lumber Co.<br />
8. Cornelia Veneer Co.<br />
9. Eabersham Broom Co.<br />
10. Eaney Mop Co.<br />
Men's Shirts<br />
Novelty Furniture<br />
Porch Furniture<br />
Brooms<br />
Hops<br />
Denorest<br />
'1940 Population: 820. Area <strong>of</strong> Municipality; 2 square miles.<br />
Altitude: 1,365 feet.<br />
Railroads: Tallulah Falls, connecting Cornelia with Franklin,<br />
Korth Carolina.<br />
Highways: State Highway 15, U. S. Highway 23, connecting Atlanta<br />
with Franklin, North Carolina.<br />
Paved Streets: 2.5 dies; sidewalks: 10 miles.<br />
Tax"Rate, 1943: 14 mills; tax rate, 1940: 14 mills.<br />
Public Works and Utilities : Fire and Health Departments inadequate.<br />
Sanitary Department adequate. Uo gas. Electricity supplied by <strong>Georgia</strong><br />
Power Company. Source <strong>of</strong> water system: Soquee River.<br />
Source: 0". S. Census, other <strong>of</strong>ficial sources, and lo';al sources.<br />
—260--<br />
275<br />
35<br />
10<br />
10<br />
50<br />
60<br />
50<br />
10
Other Services: Grade schools: 1 white; High schools: 1<br />
white; Colleges: 1 white. Churches: 4 white. Libraries: 3<br />
white. Banks: (Branch <strong>of</strong> Cornelia Bank.)<br />
Industries:<br />
Manufacturer Kind <strong>of</strong> Product<br />
1. Cason Cabinet Works Wooden Toys<br />
2. Flor, Edward, Co. Saddle Trees<br />
2. Southern Novelty Co.. Clothes racks, mop and<br />
broom handles<br />
4. Demorest Broom Works Brooms<br />
Eabersham<br />
Number<br />
Bnployees<br />
I<br />
65<br />
33<br />
85<br />
Eabersham<br />
;ountv<br />
Succ ....<br />
Eiptrimmc<br />
SutioB . . .<br />
Inchutriil . .<br />
.. Ecrauric<br />
Rotarch . .<br />
1940 Population: 696.<br />
Railroads; Tallulah Palls, connecting Cornelia with Franklin, North<br />
Carolina"!<br />
Highways: None.<br />
Industries:<br />
Manufacturer<br />
1. Eabersham Hills<br />
Kind <strong>of</strong> Product<br />
Thread and yarn<br />
Number<br />
Bnployees<br />
295<br />
—261—
Hall County<br />
Population: 1940 Total: 34,822; white male: 15,483; white<br />
female: 16,000; Negro male: 1,529; Hegro fenale, 1,810.<br />
Principal Crops; Cotton, hay, sweat potatoes, and yams.<br />
land Distribution: Total land area: 272,640 acres; land<br />
in farms: 187,712 acres; land in pasturet 17,932 acres; land in<br />
woodloti 80,501 acres; other land in forests: 43,608 acres.<br />
Census <strong>of</strong> Manufactures;<br />
Number <strong>of</strong> establishments<br />
Average wage earners for year<br />
Wages<br />
Cost <strong>of</strong> materials<br />
Value <strong>of</strong> products<br />
Value added<br />
1939<br />
27<br />
3,080<br />
$2,161,856<br />
$4,417,345<br />
$8,732,944<br />
(4,315,599<br />
1937 ——— 23<br />
3,015<br />
$2,196,578<br />
|5,254,084<br />
$9,956,247<br />
$4,702,163<br />
State ....<br />
Enfraeerinf<br />
Experiment<br />
Station . . .<br />
Gtetgim<br />
T«h<br />
Indutrial . .<br />
. .Economic<br />
Remicb . .<br />
1935<br />
26<br />
2,498<br />
.$1,576, '29<br />
$4,416,137<br />
$7,092,116<br />
$2,675,979<br />
Retail Trade Surmary:<br />
Stores<br />
Sales<br />
(Add<br />
000)<br />
Stores<br />
Sales<br />
(Add<br />
OOP)<br />
Total<br />
Food group<br />
General stores with food<br />
General merchandise<br />
Apparel group<br />
Furniture, radio group<br />
Automotive group<br />
375<br />
153<br />
12<br />
10<br />
21<br />
13<br />
14<br />
$7,328<br />
1,597<br />
125<br />
793<br />
387<br />
542<br />
1,791<br />
Filling stations<br />
Lumber, building,<br />
hardware<br />
Eating, drinking<br />
places<br />
Drug stores<br />
Other stores<br />
69<br />
7<br />
$ 641<br />
404<br />
34 226<br />
8 241<br />
34 581<br />
Wholesale Trade Sucmary<br />
Number <strong>of</strong> establishments:<br />
Total sales, 1939:<br />
Weathe r Summary;<br />
29<br />
$4, 259,000<br />
Station<br />
Average IfrTimum Temperature<br />
Gainesville 50.4 52.6 61.7 70.3 79.1 85.8 87.3 86.5 81.7 71.9 60.7 51.2<br />
(Jillsville See Banks County for data.<br />
Ave rage Minimum Temperature<br />
32.0 32.5 40.6 47.7 56.1 66.7 66.1 61.5 44.0 39.0 33.2<br />
Gainesville, County Seat<br />
1940 Population; 10,243. Aroa <strong>of</strong> Municipality; 3 square miles.<br />
Altitude: 1,200 feet.<br />
Bailroads; Southern, connecting Atlanta with Greenville. Gainesville<br />
Midland, connecting Gainesville with Monroe; Gainesvillo Midland, connect<br />
ing Sainesvillo with Athens.<br />
Highways; U-. S. Highway 23, State Highway 13, connecting Atlanta with<br />
Toecoa. U. S. Highway 78, State Highway 11, connecting Gainesville with<br />
Augusta. D. S. Highway 129, 0. S. Highway 19, connecting Gainesville with<br />
Blairsville. State Highway 53, connecting Gainesville with Tate.<br />
Paved Streets; 21 miles; sidewalks; 30 miles.<br />
Tax Rate, 1943; 17.5 mills; tax rate, 1940i 17.5 mills.<br />
Source:<br />
U. 3. Census, other <strong>of</strong>ficial sources, and local sources.<br />
—252—
Ball<br />
County<br />
public Works and Utilities i Fire Department adequate.<br />
Health Department inadequate, additions to sewer system needed, Stat. ....<br />
Eifnucriaf<br />
Sanitary Department inadequate, better garbage disposal system<br />
needed. Construction <strong>of</strong> incinerator under consideration.<br />
Surioa .<br />
Butane gas. Electricity supplied by <strong>Georgia</strong> Power Company.<br />
Source <strong>of</strong> water system: Dry Creek and Chattahoochee River. [ndutml . .<br />
Other Services ; Grade schools: 3 white, 1 non-white; high ..Ecoraik<br />
RfMuth . .<br />
schools: 1 wKite, 1 non-white. Colleges: 2 white. Churches: _<br />
12 white, 5 non-white. Libraries: 1 white. Hospitals; 1.<br />
Banksi 3, with total capital and surplus <strong>of</strong> 1*52,500. Airports: 1, with<br />
4,000 foot runway.<br />
Retail Trade Summary;<br />
Total<br />
Food group<br />
General stores with food<br />
General merchandise<br />
Apparel group<br />
Furniture, radio group<br />
Automotive group<br />
Stores<br />
218<br />
73<br />
1<br />
7<br />
21<br />
13<br />
13<br />
Wholesale Trade Summary:<br />
Number'<strong>of</strong> establishmentst 28<br />
Total sales, 1939:<br />
it-<br />
Sales<br />
(Add<br />
000)<br />
Stores<br />
*6,628 Filling stations 25<br />
1,245 Lumber, building.<br />
* hardware<br />
7<br />
765 Eating, drinking '26<br />
387 places<br />
** Drug stores<br />
7<br />
Other stores<br />
26<br />
Sales<br />
(Add<br />
OOP)<br />
t 473<br />
404<br />
179<br />
*<br />
534<br />
Industries:<br />
Manufacturer<br />
1. Bellmore Manufacturing Co.<br />
• .. Small t Estes Bakery<br />
3. Gainesville Cooa-Cola .Bottling Co.<br />
4. Dr. Pepper Bottling Co.<br />
5. Tright Ice Cream Co.<br />
6. Hewton Batohery<br />
7. Jewell, J. D.<br />
8. Piedmont Poultry Co.<br />
9. Swift t Co.<br />
10. <strong>Georgia</strong> Chair Co.<br />
11. Vance, Earl, & Co.<br />
12. Oainesville Iron Works<br />
13. Slack, IT. H., Jr.<br />
14. Brown Wire Die Co.<br />
15. £agle Publishing Co.<br />
16. G<strong>of</strong>orth Concrete Products<br />
17. Massey Concrete Co.<br />
18. Bellmore Ifanufaoturing Co.<br />
19. Faoelot kfg Co. f6<br />
20-. Owen Osborne, Inc.<br />
21. Best Manufacturing Co.<br />
22. Ohioopee Manufacturing Co.<br />
to avoid disclosure.<br />
—263—<br />
Kind <strong>of</strong> Product<br />
Overalls<br />
Poultry<br />
Chairs<br />
Harnesses & Horse Collars<br />
Concrete Blocks<br />
Concrete Blocks<br />
Chenille<br />
Print Cloth<br />
Ladies' Full-Fashioned<br />
k Silk Hosiery<br />
Silk Throwing<br />
Surgical Gauze Ic Tobacco<br />
Cloth<br />
Number<br />
Employees<br />
75<br />
.27<br />
II<br />
10<br />
3<br />
225<br />
140<br />
40<br />
65<br />
7<br />
80<br />
9<br />
13<br />
4<br />
7<br />
700<br />
250<br />
100<br />
825
Industries:<br />
Manufacturer<br />
23. Chambers Lumber Co.<br />
24. Davis-Washington Co.<br />
25. Lawson, I. L.<br />
.6. Strickland, Will D.<br />
.7. Tanner Lumber Co.<br />
28. Welchel, E. D.<br />
29. Gainesville Coop Shop<br />
30. Hudson, 1C. D., Coop Shop<br />
Number<br />
Kind <strong>of</strong> Product Bnployees<br />
Lumber<br />
Lumber<br />
Lumber<br />
Lumber<br />
Freezer Locker Plant - 350 Lockers<br />
Lu&ber<br />
Chicken Coops<br />
Chicken Coops .<br />
Flowery Branch<br />
16<br />
42<br />
119<br />
25<br />
5<br />
B<br />
3 to 8<br />
Hall<br />
County<br />
ExpcnmcBt<br />
Stirkm . . .<br />
Ctorgig<br />
1940 Population: SOS. Area <strong>of</strong> Municipality: 1 square mile.<br />
Altitude: 1,110 feet.<br />
Railroads: Southern, connecting Atlanta with Gainesville.<br />
Highways: U. S. Highway 23, State Highway 13, connecting Atlanta<br />
with Gainesville.<br />
Paved Streets; 1 mile; sidewalks; 1 mile.<br />
Tax Rate, 1943: 10 mills; tax rate, 1940: 10 mills.<br />
PublTe~Wrorks and Utilities; Fire Department inadequate, no fire<br />
engine. Health and Sanitary Departments adequate. Electricity supplied<br />
by <strong>Georgia</strong> Power Company. Source <strong>of</strong> water system: springs.<br />
Other Services: Grade and High schools: 1 white. Libraries:<br />
2 whitel Churches: 2 white.<br />
Industries;<br />
Manufacturer<br />
1. Eudlow Feed 4 Poultry Co.<br />
2. Chattahoochee Furniture Co.<br />
3. Mooney Mfg. Co.<br />
4. Waterpro<strong>of</strong> Leather Co.<br />
5. High Acres Mt. Guild<br />
Kind <strong>of</strong> Product<br />
Household Furniture<br />
Chests <strong>of</strong> Drawers<br />
Harnesses, Dog Collars<br />
Belts, Bill Folds, etc.<br />
Rugs 4 Bags<br />
Number<br />
Snployees<br />
50<br />
40<br />
35<br />
18 to 20<br />
1940 Population: 920.<br />
Eailroads: Southern, connecting Gainesville with Atlanta.<br />
Highways: U. S. Highway 23, State Highway 13, connecting Atlanta<br />
with Greenville, South Carolina.<br />
1940 Population: 1,308.<br />
Railroads: See Gainesville.<br />
Highways : See Gainesville.<br />
1940 Population;<br />
None.<br />
None.<br />
700.<br />
Gainesville Cotton Mills<br />
—264—<br />
Murrayville
Sew Holland<br />
1940 Population; 1,986.<br />
Railroads:Southern, connecting Gainesville with Toccoa,<br />
in Stephens County.<br />
Highways: U. S. Highway 23, State Highway 13, connecting<br />
Atlanta with Greenville, South Carolina.<br />
Industries:<br />
Manufacturer<br />
1 1. Pacelot Mfg. Co.<br />
Kind <strong>of</strong> Product<br />
Sateen, Sheeting<br />
Hall<br />
County<br />
Suit....<br />
Emibuiii»l<br />
Ezpcrimat<br />
SutioB . . .<br />
Grorgit<br />
K umber<br />
Bnployees<br />
1800<br />
—265—
hart County<br />
Population; 1940 Total: 15,512; white male: 5,886; white<br />
female 5,665; Negro male: 1,955; Hegro fenaler 2,006.<br />
Principal Crops> Cotton, hay, sweet potatoes and yams.<br />
lAnd Distribution; Total land area; 164,480 acres; laud<br />
in farms: 149,311 acres; land in pasture! 12,335 acres; land in woodlot:<br />
33,614 acres; other land in forests; 22,187 acres.<br />
Census <strong>of</strong> Manufactures;<br />
~Nu3Ee"r <strong>of</strong> establishments<br />
Average wage earners for year<br />
Wages<br />
Cost <strong>of</strong> materials<br />
Value <strong>of</strong> products<br />
Value added<br />
Retail Trade Summary;<br />
Total<br />
Food group<br />
General stores with food<br />
General merchandise<br />
Apparel group<br />
Furniture, radio group<br />
Automotive group<br />
Wholesale Trade Summary;<br />
Kuncer" <strong>of</strong> establishments:<br />
Total sales, 393S:<br />
Stores<br />
1939 ———5<br />
154<br />
1957<br />
5<br />
171<br />
98 t 962 miing stations<br />
34 256 Lumber, building,<br />
12 89 hardware<br />
5 166 Eating, drinking<br />
1 * places<br />
2 * Drug stores ,<br />
3 40 Other stores<br />
I565.0CO<br />
1935<br />
4<br />
190<br />
Sales<br />
(Add<br />
Stores 000)<br />
Weather Suircary;<br />
N<br />
Statidn<br />
Average Itoxisam. Teapera ti'<br />
Hartvell 53.8 56.7 C5.T7373" 81.9 88.fi §6.4 89V5 65.0 74.6 63.* E4.3<br />
Average Minimum Temperature<br />
33.7 34.4 41.U48.5 57.2 65.0 68.2 67.5 62.7 E0.6 -40.0 34.0<br />
HartKell, County Seat<br />
1940 Population; 2,372.<br />
Kailroads; "Hartwell, connecting Eartwell irith the Southern at<br />
Bowersville.<br />
Highways; U. S. Eighway 29, State Highway 8, connecting Athens and<br />
Andersen, South Carolina.<br />
Industi-jes<br />
Manufacturer<br />
Kind <strong>of</strong> Product<br />
23<br />
3<br />
7<br />
2<br />
6<br />
Number<br />
Employees<br />
1. EartBell Mfg. Co. Men's Fants ft Jackets 250<br />
Source: D. S. Census, other <strong>of</strong>ficial sources, and local sources.<br />
•Withheld to avoid disclosure.<br />
—266—<br />
153<br />
54<br />
17<br />
*<br />
75
Industries;<br />
Manufacturer<br />
2. Eartwell Mattress Co.<br />
3. Specialty Appliance Co.<br />
4. Eartwell Bills, #1<br />
Kind <strong>of</strong> Product<br />
Number<br />
Employees<br />
2<br />
125<br />
Hart<br />
County<br />
Sure . . . . •<br />
Experiment<br />
Surion . . .<br />
Gtorgia<br />
T«A<br />
Ittlutnil . .<br />
. . Efomomtc<br />
Rncjrcb . .<br />
See Franklin County.<br />
--267—
Jackson County<br />
Populationt 1940 Total: 20,089; white male: 8,216; white<br />
fscale: 8,333; Hegro male: 1,766; Hegro female: 1,775.<br />
Principal Crops: Cotton, hay, sweet potatoes and yams.<br />
Land Distribution: Total land area: 215,680 acres; land<br />
in farms: 176,873 acres; land in pasture: 14,999; land in<br />
woodlot: 46,464 acres; other land in forests: 49,996 acres.<br />
Census <strong>of</strong> Manufactures;<br />
Humber <strong>of</strong> establishments<br />
Average wage earners for year<br />
Wages<br />
Cost <strong>of</strong> materials<br />
Value <strong>of</strong> products<br />
Value added<br />
Betail Trade Summary<br />
Total<br />
Food group<br />
General stores with food<br />
General merchandise<br />
Apparel group<br />
Furniture, radio group<br />
Automotive group<br />
Wholesale Trade Summary:<br />
Number <strong>of</strong> establishments:<br />
Total sales, 1939:<br />
Sales<br />
(Add<br />
Stores 000)<br />
1939<br />
1,445<br />
1937<br />
1,443<br />
I 892,872<br />
13,161,879<br />
14,722,511<br />
11,560,632<br />
183 42,403 Filling stations<br />
61 S44 Lumber, building,<br />
11 183 hardware<br />
13 404 Eating, drinking<br />
5 21 places<br />
5 67 Drug stores<br />
6 361 Other sterns<br />
15<br />
11,247,000<br />
Jefferson, County Seat<br />
Son ....<br />
Eflgiaemac<br />
Ezpcriouat<br />
Sutim . . .<br />
CfOCaif<br />
Tid,<br />
bulucrol . .<br />
.<br />
Rcmitb .<br />
1955<br />
659<br />
I 336,797<br />
£-.,995,808<br />
14,292,296<br />
11,296,488<br />
Sales<br />
(Add<br />
Stores OOP)<br />
43<br />
5<br />
11<br />
6<br />
17<br />
230<br />
98<br />
53<br />
78<br />
364<br />
1940 Population: 1,839. Area <strong>of</strong> Municipality: 3 square miles.<br />
Railroads: Gainesville Midland, connecting Gainesville with Athens.<br />
Highways: State Highway 11, connecting Blairsville with Macon.<br />
State Highway 15, connecting Cornelia with Athens.<br />
Paved Streets; 4 miles; sidewalks- 5 miles.<br />
Tai Bate, 1943: 2 mills; tax rate, 1940: 2 mills.<br />
Public Tories and Ptilities: Fire, Health, and Sanitary Departments<br />
adequate. Ko gas. Electricity supplied by <strong>Georgia</strong> Power Company. Water<br />
frcm Turkey Creek. •<br />
Other Services: Grade schools: 1 white, 1 non-white; High schools:<br />
1 white, 1 non-white. Churches: 4 white, 3 non-white. Libraries: 1<br />
white. Banks: 1, with total capital and surplus <strong>of</strong> $100,000.<br />
Industries:<br />
Manufacturer<br />
1. Jefferson Implement Co.<br />
2. Jefferson Mills #1, The<br />
3. Haysville Mop Co.<br />
4. Jefferson Frozen Foods Bank<br />
Kind <strong>of</strong> Product<br />
Flannels i Cotton Cloths<br />
Hops<br />
KuDber<br />
Employees<br />
Source: D. S. Census, other <strong>of</strong>ficial sources, and local sources.<br />
—268--<br />
550
Commerce<br />
Jackson<br />
Sountv<br />
Sure ....<br />
Enfintcriac<br />
Experiment<br />
Stition . . .<br />
1940 Population; 3,294. Area <strong>of</strong> Municipality: 2 square<br />
iciles"Altitude-. 980 feet.<br />
Railroads: Southern, connecting Gainesville and Toccoa<br />
with Athens.<br />
Highways; State Highway 15, connecting Athens with<br />
Cornelia. State Highway 24, connecting Commerce with Athens.<br />
State Highway 59, connecting Commerce with Carnesville.<br />
Paved Streets; 10 miles; -sidewalksi 10 miles.<br />
Tax Bate. 1943; 16 mills; tax rate. 1940; 16 mills.<br />
Public Torts and UtilitiesiFire Department inadequate - need new<br />
equipment.' Health Department adequate. Sanitary Department inadequate.<br />
Indm.mil . .<br />
. .Eamomic<br />
Research . .<br />
No gas. Electricity supplied by <strong>Georgia</strong> Power Company. Hater from'Turkey<br />
creek<br />
Ȯther Services; Grade schools; 1 white, 1 non-white; high schools: 1<br />
Hospitals: 1. Bants:<br />
white, 1 non-white. Churches: 4 white, 4 non-white.<br />
Z, with total capital and surplus <strong>of</strong> $147.000.<br />
Batail Trade Summary;<br />
Total<br />
Food group<br />
General stores with food<br />
General merchandise<br />
Apparel group<br />
Furniture, radio group<br />
Automotive group<br />
Industries:<br />
Stores<br />
Manufacturer<br />
1. Slue Bell, Inc.<br />
2. Commerce Kfg. Co.<br />
3. Harmony Grove Hills, Inc.<br />
4. Lumber - Rough A Dressed<br />
Gorion, 11033, Lumber Co.<br />
5. Frozen Food Lockers, Inc.<br />
See Banks County.<br />
70<br />
19<br />
3<br />
8<br />
3<br />
3<br />
5<br />
Sales<br />
(Add<br />
OOP)<br />
| 1,128<br />
239<br />
40<br />
187<br />
*<br />
*<br />
*<br />
Filling stations<br />
Lumber, building,<br />
hardware<br />
Eating, drinking<br />
places<br />
Drug stores<br />
Other stores<br />
Kind <strong>of</strong> Product<br />
Overalls, Dungarees<br />
Overalls, Dungarees<br />
Sheeting and Drills<br />
365 Lockers<br />
Ibysvilla<br />
S;toro(<br />
11<br />
•<br />
3<br />
6<br />
3<br />
6<br />
33<br />
60<br />
63<br />
Number<br />
Employees<br />
^20<br />
'300<br />
600<br />
60 to 75<br />
•Withheld to avoid disclosure.<br />
--269 —
LurnpKin County<br />
Population: 1940 Total: 6,223; -white male: 3,017; white<br />
fenale: 2,286; Negro male: 120; Negro females 106.<br />
Principal Crops; Cotton, hay, Irish potatoes.<br />
Land Distribution; Total land area: 186,880 acres; land<br />
in farms: 75,37b acres; land in pasture: 2,912 acres; land in<br />
woodlot: 52,267 acres; other land in forests: 109,031 acres.<br />
Census <strong>of</strong> Manufactures;<br />
"HunEe'r <strong>of</strong> establishments<br />
Average wage earners for year<br />
TTages<br />
Cost <strong>of</strong> materials<br />
Value <strong>of</strong> products<br />
Value added<br />
1939 1937 1935<br />
Betail Trade Sunnary;<br />
Sales<br />
(Add<br />
Stores OOP)<br />
Salee<br />
(Add<br />
Stores 000)<br />
Total<br />
Food group<br />
General stores with food<br />
General merchandise<br />
Apparel group<br />
Furniture, radio group<br />
Automotive group<br />
73<br />
40<br />
7<br />
3<br />
1<br />
3<br />
1<br />
358<br />
90<br />
117<br />
2*<br />
12<br />
Filling stations<br />
Lumber, building,<br />
hardware<br />
Bating, drinking<br />
places<br />
Drug stores<br />
Other stores<br />
Wholesale Trade Summary;<br />
Hunter <strong>of</strong> establishments: 1<br />
Total sales, 1939: *<br />
Tfeather Surmary:<br />
J F 1IAUJJAS 0 KD<br />
Station Average Maximum Temperature<br />
Dahlonega 50.6 52.7 61.5 70.4 78.2 84.9 86.5 85.4" 80.2 70.6 60.0 51.2<br />
Average Minimum Temperature<br />
31.9 32.5 40.0 46.6 54.4 61.7 64.S 64.£ 60.2 48.7 39.0 32.7<br />
Dahlonega, County Seat<br />
1940 Population; 1,294. Area <strong>of</strong> Municipality; 3.5 square miles.<br />
Altitude: 1,520 feet. ~<br />
Railroads: None.<br />
Highways: U. S. Highway 19, 129, State Highway 9, connecting Atlanta<br />
with Murphy, H. C.<br />
Paved Streets; 4 Biles; sidewalks: 3 miles.<br />
.Tax Bate, 1943; 1 mill; tax rate, 1940; 1 mill.<br />
Pualic Works and Utilities; Fire Department inadequate. Health<br />
Department adequate. Sanitary Department inadequate. No gas. Electricity<br />
supplied by <strong>Georgia</strong> Power Company. Source <strong>of</strong> water system: Chestatee River<br />
and springs.<br />
Source: U. S. Census, other <strong>of</strong>ficial sources, and local sources.<br />
•Withheld to avoid disclosure.<br />
—270—
Other Services: Grade schools: 1 white, 1 non-white;<br />
High schoolsi 1 white; Colleges! 1 white. Churches: 3 white,<br />
1 non-white. Libraries: S white. Banks: 1, with total<br />
capital and surplus <strong>of</strong> (850,000.<br />
Industries:<br />
Manufacturer<br />
1. Foore, G. A.<br />
Kind <strong>of</strong> Product<br />
Lumber<br />
Huniber<br />
Employees<br />
13<br />
Lumpkin<br />
County<br />
Satt ....<br />
Eafinmint<br />
Expcriaat<br />
Station . . .<br />
Tldl<br />
.<br />
.. Ecounk<br />
Rcturcb . .<br />
—271—
Madison County<br />
Populations 1940 Totali 13,431; -white male: 5,SOS;<br />
white femalsj 5,321; Hegro male: 1,284; Hegro female: 1,320.<br />
Prlnoipal Crops; Cotton, hay, sweat potatoes and yarns.<br />
land Distribution! Total land area: 179,840 acres; land<br />
in farms: 152,448 acres; land in pasture: 8,219 acres; land in<br />
•iroodlot: 53,298 acres; other land in forests: 15,323 acros.<br />
Census <strong>of</strong> Manufactures!<br />
Hunber ~af establishments<br />
Average wage earners for year<br />
Wages<br />
Cost <strong>of</strong> materials<br />
Value <strong>of</strong> products<br />
Value added<br />
1939 1957<br />
4<br />
16<br />
I 3,541<br />
|51,081<br />
(76,853<br />
$25,772<br />
Expgnmtnt<br />
Satioo . . .<br />
1935<br />
15<br />
I 4,826<br />
$147,788<br />
|184,471<br />
t 36,683<br />
TlA<br />
Indutml .<br />
Be tall Trade Smmary:<br />
Sales<br />
(Add<br />
Stores OOP)<br />
Total<br />
107 | 823 filling stations<br />
Tood group<br />
General stores trlth food 39 24 101 253 Lumber, building,<br />
hardware<br />
Seneral merchandise<br />
3 48 Eating, drinking<br />
Apparel group<br />
places<br />
Furniture, radio group — Drug stores<br />
Automotive group<br />
5 156 Other stores<br />
Danielsville, County Seat<br />
Sales<br />
(Add<br />
Stores 000)<br />
1940 Populations 333<br />
Railroads; ffoM<br />
Highways; U. S. Highway 29, State Highway 8, connecting Atlanta with<br />
Greenville, 3outh Carolina. State Highway 26, connecting Danielsville<br />
trith Cconaru.<br />
Coiner<br />
f«t7 1940 ———————— Population; 811. ——— Area — <strong>of</strong> Municipality: 4 mileo. ——————<br />
Altitude;<br />
575<br />
Hailroads; Seaboard Air Line, connecting Atlanta with Elberton.<br />
Highways; State Highway 72, connecting Athens with Elberton. State<br />
Highway 36, connecting Comer with Danielsville<br />
Paved Streets; Hone; sidewalks; 2 miles<br />
Tag Bate, 1943; 8<br />
Public Works and Utilities; Tire Department inadequate. So gas.<br />
Electricity supplied by <strong>Georgia</strong> Power Company. Source <strong>of</strong> water supply:<br />
wells<br />
Ȯther Services; Grade schools: 1 white, 1 non-white; High schools:<br />
1 white; Libraries: 1 white, 1 non-white; Churohesj 3 white, 1 non-white';<br />
Banks: 1, with a total capital and surplus <strong>of</strong> 450,000.<br />
Source: 3. S. Census, other <strong>of</strong>ficial sources, and loo»l sources.<br />
"Withheld to avoid disclosure.<br />
--27Z—
Industries;<br />
Manufacturer Kind <strong>of</strong> Product Employees<br />
1. Monarch Co., The Boys' Pants & Jodhpurs 100<br />
2. Whitehead & Gholston — 27<br />
3. Luster - Rough & Dressed<br />
Stone, J. 15<br />
Ibdison<br />
County<br />
Exptriaott<br />
Sario. . . .<br />
Gnrgu<br />
..<br />
. .Eomuc<br />
Rotinb .<br />
See Franklin County.<br />
—273—
Rabun County<br />
Population; 1940 Totals 7,821; -white male: 3,878; -white<br />
feaale: 3,808; Kegro males 68; Negro females 67.<br />
Principal Crops s Hay, Irish potatoes, sweet potatoes and<br />
Eipucriaf<br />
Exptrinait<br />
|] Station . . .<br />
Gtorfia<br />
T«*<br />
Indunial . .<br />
.Economic<br />
II Raarch . .<br />
yaits.<br />
Land Distribution: Total land areas 236,160 acres; land in fannss<br />
£6,981 acres; land in pasture: 3,657 acres; land in woodl<strong>of</strong>c: 36,998 acres;<br />
other land in forests: 171,297 acres.<br />
Census <strong>of</strong> Manufacturess 1933 1937 1935<br />
Kunber <strong>of</strong> establishments 3<br />
Average wage earners for year 25<br />
Wages $11,015<br />
Cost <strong>of</strong> materials 4l2,365<br />
Value <strong>of</strong> products $35,716<br />
Value added *23,351<br />
Retail Trade Smar.s.rys<br />
Total<br />
Food group<br />
General stores with food<br />
General merchandise<br />
Apparel group<br />
Furniture, radio group<br />
Automotive group<br />
Wholesale Trade Surjne.ry:<br />
NuEber'<strong>of</strong> establishments:<br />
Total sales, 1S39:<br />
Weather SuEEary;<br />
50.7 52.5<br />
30.2 30.1<br />
Sales<br />
(Add<br />
Stores 000)<br />
87 f<br />
28<br />
7<br />
5<br />
1<br />
2<br />
2<br />
2 * '<br />
1,012<br />
178<br />
48<br />
87<br />
*<br />
*<br />
*<br />
Filling stations<br />
Lumber, building;<br />
hardware<br />
Eating, drinking<br />
places<br />
Drug stores<br />
Other stores<br />
Sales<br />
(Add<br />
Stores OOP)<br />
16 105<br />
4 165<br />
11 71<br />
3 39<br />
8 102<br />
II A V J J A<br />
Average Maximum Temperature<br />
60.'5 69.4 77.3 83.3 85.6 84. 79.6 69.9 59.5 50.6'<br />
Average Vlniinum Temperature<br />
37.7 f 52.0 59.4 63.0 62.4 57.2 45.E 36.1 30.6<br />
Clayton, County Seat<br />
1940 Population: 1,088. Area <strong>of</strong> Municipality; 4 square miles.<br />
Altitude: '2,000 feet.<br />
Bailroads: Tallulah Falls, connecting Franklin, North Carolina -with<br />
Cornelia (Southern from there).<br />
Highways: C. S. Highway 76, State Highway 2, conrecting Chattanooga,<br />
Tennessee with Anderson, South Carolina. IT. S. Highway 23, State Highway<br />
15, connecting Atlanta with Franklin, Worth Carolina.<br />
Fayed Streets: 4.5 miles; sidewalks: 4 miles.<br />
lax Sate, 194"3; 1.75 raills; tax rate, 1940; l.EO mills.<br />
Source: U. S. Census, other <strong>of</strong>ficial sources, and local sources.<br />
•Withheld to avoid disclosure.<br />
__274--
Public Works and Utilities: Fire and Sanitary Departments<br />
adequate.Health Department inadequate. Ho gas. Electricity<br />
supplied by <strong>Georgia</strong> Power Company. Source <strong>of</strong> water system:<br />
Chattooga River.<br />
Other Services! Grade schoolst 1 white, 1 non-white;<br />
High schools» 1 white, 1 non-white. Churches: 2 white, 2<br />
non-white. Libraries: 1 white. Banks: 1, with total capital'<br />
and surplus <strong>of</strong> $50,000. •<br />
Industries:<br />
Manufacturer<br />
1. Kt. City Packing Co.<br />
2. Seville, E. 3.<br />
3. Tiger )tt. Orchard<br />
4. Williams, Tf. X., Machine Shop<br />
5. Clayton Dye Works<br />
6. Cabin Handicrafters, Inc.<br />
7. Lessund Engineering Co.<br />
8. Chambers County Lumber Co.<br />
9. Eeeves Lumber Co.<br />
10. Kisinger, E. L.<br />
11. five Counties Lumber Corp.<br />
12. Jones Manufacturing Co.<br />
Freezer Locker Plant - 254 Lockers<br />
Kind <strong>of</strong> Product<br />
Apples<br />
Apples<br />
Apples<br />
Stokers<br />
Mountain City<br />
Airplane Accessories<br />
Lumber<br />
Barrel Staves<br />
Miscellaneous Wood<br />
Katun<br />
ounty<br />
State ....<br />
Enfiaeninf<br />
Experiment<br />
Station . . .<br />
Ttdi<br />
Indutriil . .<br />
. . Eeoaotaic<br />
Rcmtch . .<br />
Number<br />
Snployees<br />
5<br />
10<br />
7 to 15<br />
3 to 8<br />
4<br />
18<br />
12<br />
11<br />
7<br />
35<br />
50<br />
7<br />
194O Population: 524.<br />
Railroads:Tallulah Bills, connecting Cornelia with Franklin, North<br />
Carolina.<br />
Highways; U. S. Highway 23, State Highway 15, connecting Atlanta<br />
vith Franklin, North Carolina.<br />
—275—
Stephens County<br />
State .<br />
Expcriaat<br />
Station . . .<br />
Cfocgit<br />
Population: 1940 Total: 12,972; white male: 5,523; white T>th<br />
Indnnrul..<br />
female:"5,593; Negro male: 852; Hogro female: 1,004.<br />
.. Ecomiic<br />
Principal Crops; Cotton, hay, sweet potatoes and yams. Rntaitb . .<br />
Land Distribution; Total land area: 115,200 acres; land<br />
in farms: 7i5,bO!J acres; land in pasture; 6,885 acres; land in woodlot:<br />
36,614 acres; other land in forests: 24,358 acres.<br />
Census <strong>of</strong> Manufactures; 1939 1937 1935<br />
HumBer <strong>of</strong> establishments 15 T2 13<br />
Average wage earners for year 663 467 393<br />
Wages I 463,988 | 286,724 (224,596<br />
Cost <strong>of</strong> materials | 741,642 | 642,645 $502,353<br />
Value <strong>of</strong> products fl>658,134 $1,213,922 $873,406<br />
Value added $ 916,492 $ 571,277 $371,053<br />
Retail Trade Sumnary;<br />
Total<br />
Food group<br />
General stores with food<br />
General cerchandise<br />
Apparel group<br />
Furniture, radio group<br />
Automotive group<br />
Wholesale Trade Summary;<br />
Humoer'<strong>of</strong> establishments:<br />
Total sales, 1939:<br />
Sales<br />
(Add<br />
Stores OOP)<br />
129 $ 2,114 Filling stations<br />
35 478 Lumber,, building,<br />
6 47 hardware<br />
8 324 Eating, drinking<br />
2 * places<br />
5 134 Drug stores<br />
6 483 Other stores<br />
11<br />
$846,000<br />
Sales<br />
(Add<br />
Stores 000)<br />
Weather Sunaary;<br />
————— JFMA1IJJASOHD<br />
Station Average Maximum Temperature<br />
Toccoa" 52.3 54.7 63.£—72T3~80.fi 87.2 88.5 87.8 82.9 72.6 61.8 63.5<br />
Average Minimum Temperature<br />
32.2 32.8 40.8 47.7 56.1 63.9 67.0 66.4 61.5 60.0 39.7 33.4<br />
Toccoa, County Seat<br />
1940 Population; 5,494. Area <strong>of</strong> Municipality; 3 square miles.<br />
Altitude; 1,050 feet.<br />
Hailroadg; Southern, connecting Atlanta with Greenville, South<br />
Carolina!Southern, connecting Toccoa with Abbeville, South Carolina.<br />
Highways; State Highway 13, U. S. Highway 23, connecting Atlanta with<br />
Seneca, South Carolina. State Highway 17, connecting with State Highway 15<br />
to the Berth and connecting Toccoa with Washington, <strong>Georgia</strong>.<br />
Paved Streets; 11 miles; sidewalksi 12 miles.<br />
Tag rate. 1943; 2 mills; tax rate, 1S40; 2 mills.<br />
Public Works and Utilities: Fire and Health "Departments adequate.<br />
Sanitary Department inadequate. Ho gas, sor.e bottled gas used.<br />
Source: U. S. Census, other <strong>of</strong>ficial sources, and local sources.<br />
^Withheld to nvoJr! disclosure.<br />
—276—
Electricity supplied by <strong>Georgia</strong> Power Company. Source <strong>of</strong> water<br />
system: stream to reservoir.<br />
Other Services: Grade schools: 1 white, 1 non-white; High<br />
schools: 1 white, 1 non-white; Colleges: 1 white. Churches:<br />
7 white, 3 non-white. Hospitals: 1. Banks: 1, with total<br />
capital and surplus <strong>of</strong> $115,000. Airportss 1, with runway <strong>of</strong><br />
3,130 feet.<br />
Industries:<br />
——————— . Hi<br />
Stephens<br />
County<br />
Sun ....<br />
Exp«riacat<br />
Sario. . . .<br />
7>e»*<br />
IllluKcul . .<br />
. . Ecoooaic<br />
Rmardi . .<br />
——<br />
nober<br />
Manufacturer Kind <strong>of</strong> Product Employees<br />
1. Klassy-Klad Manufacturing Co. Rayon Underwear<br />
2. Stephens Garment Co. Men's Cotton Pants<br />
3. Currahee Furniture Co. Bedroom Furniture<br />
4. Metal Furniture Co. Aluminum Chairs<br />
5. Toccoa Manufacturing Co. Household Furniture<br />
6. Toccoa lovelty Mfg. Co. Tables, Bookcases &<br />
Smoking stands<br />
7. Trogdon Furniture Co. Dining Room Furniture<br />
t C<strong>of</strong>fee Tables<br />
8. LeTourneau Company <strong>of</strong> <strong>Georgia</strong> Earth Moving Equipment<br />
9. Tournapull Housing Corp. Metal Houses<br />
10. North <strong>Georgia</strong> Processing Co. Bleaching i Dyeing<br />
11. Hartwell Mills #2, The Sheeting<br />
12. Toocoa Casket Co. Caskets<br />
Retail Trade Summary:<br />
6<br />
160<br />
132<br />
30<br />
125<br />
Sales<br />
Sales<br />
Stores (Add<br />
000) Stores (Add<br />
000)<br />
35<br />
200<br />
1250<br />
71<br />
800<br />
150<br />
140<br />
Total 99 * 1,979 Filling stations 17 f 147<br />
Food group 24 442 Lumber, building,<br />
General stores with food 2 * hardware 5 139<br />
General merchandise Apparel group 8 2 324 Sating, drinking<br />
* places 17 • *<br />
Furniture, radio group Automotive group 5 6 134 Drug stores 483 Other stores Z 11 *<br />
121<br />
Wholesale Trade Summary:<br />
Number <strong>of</strong> establishments: 10<br />
Total sales, 1939 i *<br />
Source: U. S. Census, other <strong>of</strong>ficial sources, and local sources.<br />
•Withheld to avoid disclosure<br />
—277—
Towns County State ....<br />
Engineering<br />
Experiment<br />
Station . . .<br />
Ctoryia<br />
7«*<br />
Indutria! . .<br />
. . Economic<br />
Retearth . .<br />
Population; 1940 Total: 4,925; white male: 2,544; white<br />
female: 2,381.<br />
Principal Crops; Hay, Irish potatoes, sweet potatoes and<br />
yams.<br />
land Distribution; Total land area: 110,080 acres; land in farast<br />
37,616 aoresj land in pasture: 4,265 acres; land in woodlot: 16,555 aoresi<br />
other land in forests: 79,489 acres.<br />
Retail Trade Summary;<br />
Total<br />
Food group<br />
General stores with food<br />
General merchandise<br />
Apparel group<br />
Furniture, radio group<br />
Automotive group<br />
Stores<br />
47<br />
9<br />
19<br />
2<br />
1<br />
1<br />
Sales<br />
(Add<br />
000)<br />
t 146<br />
7<br />
73<br />
*<br />
• —<br />
*<br />
*<br />
Hiawassee, County Seat<br />
Filling stations<br />
Lumber, building<br />
hardware<br />
Bating, drinking<br />
places<br />
Drug stores<br />
Other stores<br />
Stores<br />
5<br />
__<br />
7<br />
1<br />
2<br />
Sales<br />
(Add<br />
000)<br />
* 8<br />
1940 Population: 163.<br />
Pailroads:Hone.<br />
Highways; U. S. Highway 76, State Highway 2, connecting Chattanooga,<br />
Tennessee with Anderson, South Carolina.<br />
_-<br />
22<br />
*<br />
*<br />
Sourcei U. S. Census, other <strong>of</strong>ficial sources, and local sources.<br />
•Withheld to avoid disclosure.<br />
—279—
Union County<br />
Statt ....<br />
Enfnucriaf<br />
Eipirimtat<br />
Station . . .<br />
Population; 1940 Totalj 7,660; white male; 3,919; white<br />
femalei 3,750; Negro malex 4; Negro femalei 7.<br />
Principal Crops; Bay, Irish potatoes, sweet potatoes and<br />
TVrfi<br />
ladutru! . .<br />
. . ECOMOBU<br />
Rourch . .<br />
yams.<br />
land Distribution; Total land areai 204,160 aores; land in farasj<br />
.94,732 acres; land in'pasture: 5,399 acres; land in woodlot; 57,760 acres;<br />
other land in forests: 121,873 acres.<br />
Census <strong>of</strong> Manufactures; Number <strong>of</strong> establishments 1939 1 1937 — 1955<br />
1<br />
Average wage earners for year Wages • — — — —<br />
—<br />
• Cost <strong>of</strong> materials Value <strong>of</strong> products — •— —<br />
•—<br />
Value added<br />
Retail Trade Summary;<br />
Total<br />
Food group<br />
General stores with food<br />
General merchandise<br />
Apparel group<br />
Furniture, radio group<br />
Automotive group<br />
Iholesale Trade Summary:<br />
Stores<br />
68<br />
42<br />
8<br />
1<br />
Number <strong>of</strong> establishments: 1<br />
Total sales, 1939: *<br />
Blalrsvllle, County Seat<br />
1<br />
1<br />
Sales<br />
(Add<br />
OOP)<br />
t 230<br />
86<br />
59<br />
*<br />
*<br />
*<br />
Filling stations<br />
Lumber, building,<br />
hardware<br />
Bating, drinking<br />
places<br />
Drug stores<br />
Other stores<br />
Stores<br />
1940 Population; 358. Altitude; 1925 feet.<br />
Railroads: nonT.<br />
Highways; U. S. Highway 76, connecting Chattano<strong>of</strong>a with Andersen,<br />
South Carolina. State Highway 11, connecting Blairsville with Murphy,<br />
Horth Carolina. U. S. Highway 19 and 129, connecting Blairsville with<br />
Gainesville.<br />
8<br />
1<br />
4<br />
1<br />
1<br />
Sales<br />
(Add<br />
000)<br />
* 44<br />
*<br />
*<br />
*<br />
*<br />
Source: U. S. Census, other <strong>of</strong>ficial sources, and local sources.<br />
"Withheld to avoid disclosure.<br />
—279—
vThite County<br />
Expcraat<br />
Saticm . . .<br />
Population; 1940 Total: 6,417; white Dale: 3,060; white<br />
female: 2,990; Hegro male: 200; Hegro female: 167.<br />
principal Crops: Cotton, hay, Irish potatoes.<br />
Land Distribution; Total land area: 155,520 acres; land<br />
in farms: 72,239 acres; land in pasture: 6,125 acres; land in woodlot:<br />
39,853 acres; other land in forests: 90,029 acres.<br />
. .<br />
. . EcoaoMk<br />
Ratucli . .<br />
Census <strong>of</strong> Manufactures:<br />
Humber~<strong>of</strong> establishments<br />
Average wage earners for year<br />
Wages<br />
Cost <strong>of</strong> materials<br />
Value <strong>of</strong> products<br />
Value added<br />
1939 1937 1935<br />
Retail Trade Summary:<br />
Total<br />
Food group<br />
Goneral stores with food<br />
General merchandise<br />
Apparel group<br />
Furniture, radio group<br />
Automotive group<br />
Wholesale Trade Summary;<br />
Mumber'<strong>of</strong> establishments: 1<br />
Total sales, 1939: *<br />
Sales<br />
(Add<br />
Stores 000)<br />
64 * 265 Filling stations<br />
34 86 Lumber, building.<br />
18 120 hardware<br />
— —• Bating, drinking<br />
— — places<br />
1 * Drug stores<br />
1 * Other stores<br />
Sales<br />
(Add<br />
Stores OOP)<br />
27<br />
Cleveland, County Seat<br />
1940 Population: 471. Area <strong>of</strong> Municipality; 4 square miles.<br />
Altitude: 1,555 feet.<br />
ilroads; Bone. „<br />
ays; U. S. Highway 129, State Highway 11, connecting Murphy,<br />
H. C. with Gainesville.<br />
Paved Streets: 1.5 miles.<br />
Tax Bate, 1943; 7.5 mills; tax rate, 1940: 7.5 mills.<br />
Public Worlcs and Utilities: Fire and Health Departments inadequate.<br />
Sanitary Department inadequate. Ho gas. Electricity supplied by <strong>Georgia</strong><br />
Power Company and T.VJL. Source <strong>of</strong> water system: Chattahoochee River.<br />
Other Services: Grade schools; 1 white, 1 non-whits; High schools:<br />
1 white, 1 non-white; Churches: 2 white. Hospitals: 1.<br />
Industries:<br />
Manufacturer<br />
Kind <strong>of</strong> Product<br />
Number<br />
Employees<br />
1. Dairies, G. L.<br />
Lumber<br />
13<br />
Source: U. S. Census, other <strong>of</strong>ficial sources, and local sources.<br />
•Withheld to avoid disclosure.<br />
—280—
Publications <strong>of</strong><br />
State Engineering Experiment Station<br />
"<strong>Georgia</strong> School <strong>of</strong> Technol'ogy<br />
Circulars<br />
Ho. 4. The Electron Microscope at <strong>Georgia</strong> Tech, by B. H. Well,<br />
C-. A. Rosselot, and E. VfT~Koza. BVatis.<br />
*<br />
Bulletins<br />
Bo. 1. Studies in the Cotton Drawing Process—I. Effect <strong>of</strong> Roll Speed on<br />
Tensile "Strength <strong>of</strong> Spun Yarn, by B. E. Peacock, T53SI Twentyfive<br />
Cents.<br />
No. 2.<br />
No. 3.<br />
No. 4.<br />
No. 5.<br />
Ho. 6.<br />
Bo. 7.<br />
Ho. 8.<br />
Empirical Specific Heat<br />
R. L. Sweigert and H. W.<br />
[uations Based on Spectroscopjc Data, by<br />
.rdsley, 1938T" Twenty-five Cents.<br />
Studies in the Viscose Rayon Process— 2. The Suitability <strong>of</strong><br />
<strong>Georgia</strong> Pine Pulp for the Production <strong>of</strong> Viscose Rayon--IT. The<br />
Viscosity <strong>of</strong> Viscose Solution from <strong>Georgia</strong> Pine Pulp—III. The<br />
Effect <strong>of</strong> Various Spinning Baths oa the Cross-Section and Physical<br />
Properties <strong>of</strong> Viscose Rayon from 'Pine Pulp, by~Harold Hunger,<br />
Edward Doud, and Nathan Suganaan, 1938. Fifty Cents.<br />
Studies in the Utilization <strong>of</strong> <strong>Georgia</strong> Pecans—I. Composition,<br />
Properties, and Uses <strong>of</strong> Hulls, Oils, and Ifeats'J by<br />
Thomas H. Whitehead and Hilda Warshaw, 1938. Twenty-five Cents.<br />
Testing the Abilities <strong>of</strong> Tortile Workers, by Willard Harrell,<br />
1940. Twenty-five Cents.<br />
Food Preservation Prospectus, by Joseph B. Hosmer, J. G. Woodro<strong>of</strong>,<br />
Noah Warren, J. W. Mason, J. William Firor, R. L. Keener, and<br />
Hyron C. Davis, 3.941. Seventy-five Cents.<br />
Wool Industry Prospectus, by Joseph B. Hosmer, II. A. Strickland,<br />
and associates, 1941.Seventy-five Cents.<br />
Ceramic Whiteware Prospectus, by Joseph B. Hosmer and associates,<br />
1945. ""Seventy-TTve Cents.<br />
Ho. 5. The Effect <strong>of</strong> Attic Fan Operation on the Cooling <strong>of</strong> a Structure, by<br />
W. A. Hinton and A. F. Poor, 1942. Twenty Cents. ~<br />
Ho. 6. Spinning Plaic for Bags on Cotton Mill Machinery, prepared oy the<br />
State Engineering Experiment Station <strong>of</strong> the <strong>Georgia</strong> School <strong>of</strong> Tech<br />
nology, Atlanta, <strong>Georgia</strong>, June 1943.- Gratis.<br />
No. 7. Modifications <strong>of</strong> the Relative Stability Test for Sewage, by Samuel<br />
H. Hopper and Otto W. Briscoe, 1944. Twenty-five Cents.<br />
No. 6. Density <strong>of</strong> Potassium Chloride, by Dwight A. Hutchison, 1944.<br />
Twenty-five Cents.<br />
—231 —
Reprints (continued)<br />
DATE DUE<br />
Ho. 9. Location <strong>of</strong> Line Faults, by H. A. Honnell,•1944. Gratis.. gj-^<br />
Eafiocniaf<br />
Ho. 10. A Statistical Study £f the Relations Between Flax Fiber SBtlon ' •<br />
Humbers and tfiameters and STzes <strong>of</strong> Stems, by Julian H.<br />
MillerJ H. Gwendolyn "Burton, andTroy Manning, 1945. bdutml . .<br />
. . ECOWOBIC<br />
Gratis.<br />
Rtiorcb . .<br />
Ho<br />
11. ____ Molecular Weight Comparisons from Density and X-Ray Data.<br />
The Atomic __ WeigEts <strong>of</strong> Calcium and Fluorine, by~Dwight A. Hutchison,<br />
19451 Twenty-five Twenty-, Tjents'.<br />
Ho. 12. A Direct Method <strong>of</strong> Estimating the Performance <strong>of</strong> a Helicopter In<br />
Towered~K.ight, b"y Walter Castles, 1945. Twenty-five Cents.<br />
Ho. 13. Efficiency <strong>of</strong> the Electrolytic Separation <strong>of</strong> Chlorine Isotopes. by<br />
Dwight A. HuteEis~on, 1945. Twenty-five Cents.<br />
Ho. 14. Single Sideband Generator, by II. A. Honnell, 1945.<br />
Gratis.<br />
Ho. 15. The Homographic Representation <strong>of</strong> Polynomials, by W. H. Burrows,<br />
19461Twenty-five Cents.<br />
Ho. 16. Thcmody"'''^ c Properties <strong>of</strong> Gases-- Carbon Dioxide, by R. L.<br />
Sweigert, Paul Weber, and R. L. Alien, 1946. Twenty-five Cents.<br />
Ho. 17. Construction <strong>of</strong> Homographs With Hyperbolic Coordinates, by<br />
W. H. Burrows, 1946. Twenty-five Cents.<br />
Special Reports<br />
Ho. 1. Economic Study <strong>of</strong> Mtcon Area, by Industrial Economic Research Staff,<br />
1943. JSoToOf<br />
Ho. 2. Economic Study <strong>of</strong> Augusta Area, by Industrial Economic Research<br />
Staff, 1944. 35.S<strong>of</strong><br />
Ho. 3. Abattoir Prospectus, 1945* Ho. 7. Freezer-Locker Combination,<br />
Ho. 4. Butter Manufacture, 1945* 1945*<br />
Ho. E. Cheese Manufacture, 1945* Ho. 8. Dehydration Sumaary, 1945*<br />
Ho. 6. Severance Taxes, 1945* Ho. 9. Canning Prospectus, 1945*<br />
Ho. JO. Economic Study <strong>of</strong> Ifeyeross Area, by Industrial Economic Research<br />
Staff, 1945. f28.OOf<br />
Ho. 11. Economic Study <strong>of</strong> Yaldosta Area, by Industrial Economic Research<br />
Staff, 1945.