SOL MELIA ANNUAL REPORT 00 COMP
SOL MELIA ANNUAL REPORT 00 COMP
SOL MELIA ANNUAL REPORT 00 COMP

Create successful ePaper yourself
Turn your PDF publications into a flip-book with our unique Google optimized e-Paper software.
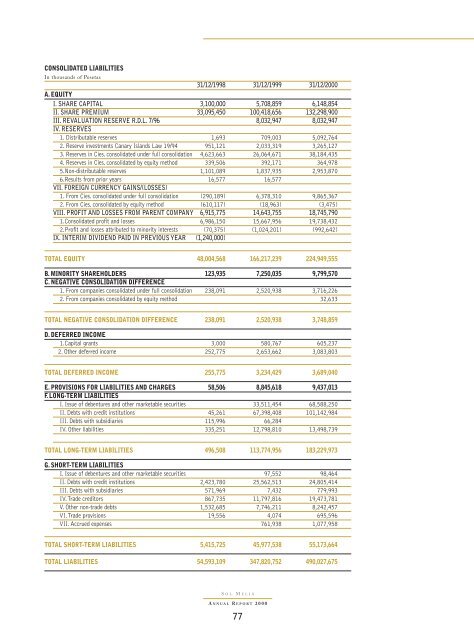
CON<strong>SOL</strong>IDATED LIABILITIES<br />
In thousands of Pesetas<br />
31/12/1998 31/12/1999 31/12/2<strong>00</strong>0<br />
A. EQUITY<br />
I. SHARE CAPITAL 3,1<strong>00</strong>,<strong>00</strong>0 5,708,859 6,148,854<br />
II. SHARE PREMIUM 33,095,450 1<strong>00</strong>,418,656 132,298,9<strong>00</strong><br />
III. REVALUATION RESERVE R.D.L. 7/96 8,032,947 8,032,947<br />
IV. RESERVES<br />
1. Distributable reserves 1,693 709,<strong>00</strong>3 5,092,764<br />
2. Reserve investments Canary Islands Law 19/94 951,121 2,033,319 3,265,127<br />
3. Reserves in Cies. consolidated under full consolidation 4,623,663 26,064,671 38,184,435<br />
4. Reserves in Cies. consolidated by equity method 339,506 392,171 364,978<br />
5.Non-distributable reserves 1,101,089 1,837,935 2,953,870<br />
6.Results from prior years 16,577 16,577<br />
VII. FOREIGN CURRENCY GAINS/(LOSSES)<br />
1. From Cies. consolidated under full consolidation (290,189) 6,378,310 9,865,367<br />
2. From Cies. consolidated by equity method (610,117) (18,963) (3,475)<br />
VIII. PROFIT AND LOSSES FROM PARENT <strong>COMP</strong>ANY 6,915,775 14,643,755 18,745,790<br />
1.Consolidated profit and losses 6,986,150 15,667,956 19,738,432<br />
2.Profit and losses attributed to minority interests (70,375) (1,024,201) (992,642)<br />
IX. INTERIM DIVIDEND PAID IN PREVIOUS YEAR (1,240,<strong>00</strong>0)<br />
TOTAL EQUITY 48,<strong>00</strong>4,568 166,217,239 224,949,555<br />
B. MINORITY SHAREHOLDERS 123,935 7,250,035 9,799,570<br />
C. NEGATIVE CON<strong>SOL</strong>IDATION DIFFERENCE<br />
1. From companies consolidated under full consolidation 238,091 2,520,938 3,716,226<br />
2. From companies consolidated by equity method 32,633<br />
TOTAL NEGATIVE CON<strong>SOL</strong>IDATION DIFFERENCE 238,091 2,520,938 3,748,859<br />
D. DEFERRED INCOME<br />
1.Capital grants 3,<strong>00</strong>0 580,767 605,237<br />
2. Other deferred income 252,775 2,653,662 3,083,803<br />
TOTAL DEFERRED INCOME 255,775 3,234,429 3,689,040<br />
E. PROVISIONS FOR LIABILITIES AND CHARGES 58,506 8,845,618 9,437,013<br />
F. LONG-TERM LIABILITIES<br />
I. Issue of debentures and other marketable securities 33,511,454 68,588,250<br />
II. Debts with credit institutions 45,261 67,398,408 101,142,984<br />
III. Debts with subsidiaries 115,996 66,284<br />
IV. Other liabilities 335,251 12,798,810 13,498,739<br />
TOTAL LONG-TERM LIABILITIES 496,508 113,774,956 183,229,973<br />
G. SHORT-TERM LIABILITIES<br />
I. Issue of debentures and other marketable securities 97,552 98,464<br />
II. Debts with credit institutions 2,423,780 25,562,513 24,805,414<br />
III. Debts with subsidiaries 571,969 7,432 779,993<br />
IV.Trade creditors 867,735 11,797,816 19,473,781<br />
V. Other non-trade debts 1,532,685 7,746,211 8,242,457<br />
VI.Trade provisions 19,556 4,074 695,596<br />
VII. Accrued expenses 761,938 1,077,958<br />
TOTAL SHORT-TERM LIABILITIES 5,415,725 45,977,538 55,173,664<br />
TOTAL LIABILITIES 54,593,109 347,820,752 490,027,675<br />
S OL<br />
M ELIÁ<br />
A NNUAL R EPORT 2<strong>00</strong>0<br />
77