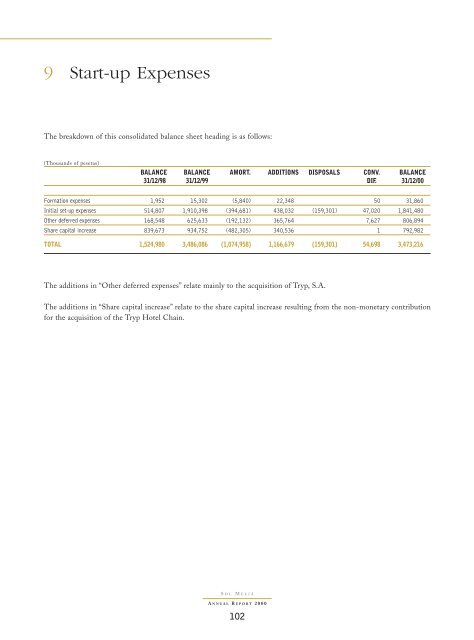
9 Start-up Expenses The breakdown of this consolidated balance sheet heading is as follows: (Thousands of pesetas) BALANCE BALANCE AMORT. ADDITIONS DISPOSALS CONV. BALANCE 31/12/98 31/12/99 DIF. 31/12/<strong>00</strong> Formation expenses 1,952 15,302 (5,840) 22,348 50 31,860 Initial set-up expenses 514,807 1,910,398 (394,681) 438,032 (159,301) 47,020 1,841,480 Other deferred expenses 168,548 625,633 (192,132) 365,764 7,627 806,894 Share capital increase 839,673 934,752 (482,305) 340,536 1 792,982 TOTAL 1,524,980 3,486,086 (1,074,958) 1,166,679 (159,301) 54,698 3,473,216 The additions in “Other deferred expenses” relate mainly to the acquisition of Tryp, S.A. The additions in “Share capital increase” relate to the share capital increase resulting from the non-monetary contribution for the acquisition of the Tryp Hotel Chain. S OL M ELIÁ A NNUAL R EPORT 2<strong>00</strong>0 102
10 Intangible Fixed Assets The breakdown of the cost and accumulated amortisation of intangible fixed assets is as follows: (Thousands of pesetas) COST BALANCE AT BALANCE AT ADDITIONS TRANSFER DISPOSALS CONV. BALANCE AT 31/12/98 31/12/99 TANG. ASSETS DIF. 31/12/<strong>00</strong> Land 273 540,174 3,071 (27,226) (62,431) 453,588 Buildings 81,831 23,011,612 6,233,692 (14,513,742) (207,618) 3,215 14,527,158 Installations 5,431,109 6,285,961 (508,848) 11,208,222 Machinery 602,031 475,607 (82,272) 995,365 Tools 436,<strong>00</strong>5 2,4<strong>00</strong> (236,933) (903) 2<strong>00</strong>,569 Furniture 5,271,652 2,125,623 (393,<strong>00</strong>1) 7,<strong>00</strong>4,274 Data processing equip. 85,986 381,385 (24,845) 442,526 Vehicles 30,406 10,645 1,989,617 2,030,668 Ind.Prop rights/R+D exp. 897,671 187,361 493,873 (11,993) 669,241 Goodwill 1,257,444 164,341 7,320 1,429,105 Transfer rights 786 12,8<strong>00</strong>,598 (196,177) 12,605,208 Software 177,<strong>00</strong>8 365,517 2,814,907 (7,352) 429 3,173,5<strong>00</strong> TOTAL COST 1,156,783 37,219,295 18,992,291 (996,652) (278,304) (197,206) 54,739,424 ACCUMULATED BALANCE AT BALANCE AT CHARGE FOR ADDITIONS TRANSFER DISPOSALS DIF. BALANCE AT AMORTISATION 31/12/98 31/12/99 THE YEAR TANG. ASSETS CONV. 31/12/<strong>00</strong> Buildings 17,315 801,991 178,010 45,714 (527,8<strong>00</strong>) (38,253) 439 460,1<strong>00</strong> Installations 406,181 484,194 1,282 (98,928) 1 792,731 Machinery 43,329 46,528 (15,<strong>00</strong>0) 74,857 Tools and fittings 32,196 7<strong>00</strong> (938) (230) 31,728 Furniture 479,233 421,015 5,562 (94,144) (1) 811,665 Data processing equip. 28,488 16,982 (9,882) 35,588 Vehicles 2,682 103,026 (1,036) 104,672 Ind.Prop rights/R+D exp. 126,268 234 1,082 455,902 (11,398) 445,821 Goodwill 295,720 159,525 147,465 (5,321) 597,389 Transfer rights 392,772 169,367 (17,236) 544,903 Software 26,897 116,874 1<strong>00</strong>,784 15,811 (1,972) 271 231,768 Provisions 152,<strong>00</strong>0 152,<strong>00</strong>0 TOTAL ACCUM. AMORT. 170,480 2,358,929 1,903,918 672,436 (578,361) (40,455) (33,245) 4,283,168 NET BOOK VALUE 986,303 34,860,366 50,456,255 S OL M ELIÁ A NNUAL R EPORT 2<strong>00</strong>0 103