Homework Assignment 4 - McCombs School of Business
Homework Assignment 4 - McCombs School of Business
Homework Assignment 4 - McCombs School of Business
- No tags were found...

Create successful ePaper yourself
Turn your PDF publications into a flip-book with our unique Google optimized e-Paper software.
<strong>Homework</strong> <strong>Assignment</strong> 4<br />
Carlos M. Carvalho<br />
Statistics – Texas MBA<br />
<strong>McCombs</strong> <strong>School</strong> <strong>of</strong> <strong>Business</strong><br />
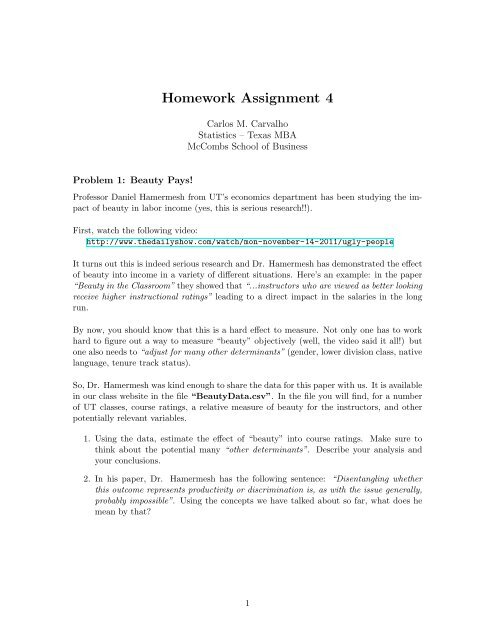
Problem 1: Beauty Pays!<br />
Pr<strong>of</strong>essor Daniel Hamermesh from UT’s economics department has been studying the impact<br />
<strong>of</strong> beauty in labor income (yes, this is serious research!!).<br />
First, watch the following video:<br />
http://www.thedailyshow.com/watch/mon-november-14-2011/ugly-people<br />
It turns out this is indeed serious research and Dr. Hamermesh has demonstrated the effect<br />
<strong>of</strong> beauty into income in a variety <strong>of</strong> different situations. Here’s an example: in the paper<br />
“Beauty in the Classroom” they showed that “...instructors who are viewed as better looking<br />
receive higher instructional ratings” leading to a direct impact in the salaries in the long<br />
run.<br />
By now, you should know that this is a hard effect to measure. Not only one has to work<br />
hard to figure out a way to measure “beauty” objectively (well, the video said it all!) but<br />
one also needs to “adjust for many other determinants” (gender, lower division class, native<br />
language, tenure track status).<br />
So, Dr. Hamermesh was kind enough to share the data for this paper with us. It is available<br />
in our class website in the file “BeautyData.csv”. In the file you will find, for a number<br />
<strong>of</strong> UT classes, course ratings, a relative measure <strong>of</strong> beauty for the instructors, and other<br />
potentially relevant variables.<br />
1. Using the data, estimate the effect <strong>of</strong> “beauty” into course ratings. Make sure to<br />
think about the potential many “other determinants”. Describe your analysis and<br />
your conclusions.<br />
2. In his paper, Dr. Hamermesh has the following sentence: “Disentangling whether<br />
this outcome represents productivity or discrimination is, as with the issue generally,<br />
probably impossible”. Using the concepts we have talked about so far, what does he<br />
mean by that<br />
1
Problem 2: Housing Price Structure<br />
The file MidCity.xls, available on the class website, contains data on 128 recent sales <strong>of</strong><br />
houses in a town. For each sale, the file shows the neighborhood in which the house is<br />
located, the number <strong>of</strong> <strong>of</strong>fers made on the house, the square footage, whether the house<br />
is made out <strong>of</strong> brick, the number <strong>of</strong> bathrooms, the number <strong>of</strong> bedrooms, and the selling<br />
price. Neighborhoods 1 and 2 are more traditional whereas 3 is a more modern, newer and<br />
more prestigious part <strong>of</strong> town. Use regression models to estimate the pricing structure <strong>of</strong><br />
houses in this town. Consider, in particular, the following questions and be specific in your<br />
answers:<br />
1. Is there a premium for brick houses everything else being equal<br />
2. Is there a premium for houses in neighborhood 3<br />
3. Is there an extra premium for brick houses in neighborhood 3<br />
4. For the purposes <strong>of</strong> prediction could you combine the neighborhoods 1 and 2 into a<br />
single “older” neighborhood<br />
2
Problem 3: What causes what<br />
Listen to this podcast:<br />
http://www.npr.org/blogs/money/2013/04/23/178635250/episode-453-what-causes-what<br />
1. Why can’t I just get data from a few different cities and run the regression <strong>of</strong> “Crime”<br />
on “Police” to understand how more cops in the streets affect crime (“Crime” refers<br />
to some measure <strong>of</strong> crime rate and “Police” measures the number <strong>of</strong> cops in a city)<br />
2. How were the researchers from UPENN able to isolate this effect Briefly describe<br />
their approach and discuss their result in the “Table 2” below.<br />
3. Why did they have to control for METRO ridership What was that trying to capture<br />
4. In the next page, I am showing you “Table 4” from the research paper. Just focus<br />
on the first column <strong>of</strong> the table. Can you describe the model being estimated here<br />
What is the conclusion<br />
effect <strong>of</strong> police on crime 271<br />
TABLE 2<br />
Total Daily Crime Decreases on High-Alert Days<br />
(1) (2)<br />
High Alert<br />
7.316*<br />
(2.877)<br />
6.046*<br />
(2.537)<br />
Log(midday ridership) 17.341**<br />
(5.309)<br />
R 2 .14 .17<br />
Note.—The dependent variable is the daily total number <strong>of</strong> crimes<br />
(aggregated over type <strong>of</strong> crime and district where the crime was<br />
Figurecommitted) 1: The in dependent Washington, variable D.C., during is the theperiod daily March total 12, number 2002– <strong>of</strong> crimes in D.C. This table<br />
present July the 30, estimated 2003. Both regressions coefficients contain anday-<strong>of</strong>-the-week their standard fixederrors effects. in parenthesis. The first column<br />
refersThe to anumber model<strong>of</strong> where observations the only is 506. variable Robust used standard in errors the High are inAlert dummy whereas the model<br />
parentheses.<br />
in column * Significantly (2) controls different formfrom the zero METRO at the 5ridership. percent level. * refers to a significant coeficient at the<br />
5% level, ** ** Significantly at the 1% different level. from zero at the 1 percent level.<br />
local <strong>of</strong>ficials. In addition to increasing its physical presence, the police<br />
department increases its virtual street presence by activating a closed-circuit<br />
camera system that covers sensitive areas <strong>of</strong> the National Mall. The camera<br />
system is not permanent; it is activated only during heightened terror alert<br />
periods or during major events such as presidential inaugurations. 10<br />
IV.<br />
Results<br />
The results from our most basic regression are presented in Table 2, where<br />
we regress daily D.C. crime totals against the terror alert level (1 p high,<br />
0 p elevated) and a day-<strong>of</strong>-the-week indicator. The coefficient on the alert<br />
level is statistically significant at the 5 percent level and indicates that on<br />
high-alert days, total crimes decrease by an average 3 <strong>of</strong> seven crimes per day,<br />
or approximately 6.6 percent. We use dummy variables (not shown) for each<br />
day <strong>of</strong> the week to control for day effects (crime is highest on Fridays).
274 the journal <strong>of</strong> law and economics<br />
TABLE 4<br />
Reduction in Crime on High-Alert Days: Concentration on the National Mall<br />
Coefficient<br />
(Robust)<br />
High Alert # District 1<br />
2.621**<br />
(.044)<br />
High Alert # Other Districts .571<br />
(.455)<br />
Log(midday ridership) 2.477*<br />
(.364)<br />
Constant<br />
11.058**<br />
(4.211)<br />
Coefficient<br />
(HAC)<br />
2.621*<br />
(1.19)<br />
.571<br />
(.366)<br />
2.477**<br />
(.522)<br />
11.058<br />
(5.87)<br />
Coefficient<br />
(Clustered by Alert<br />
Status and Week)<br />
2.621*<br />
(1.225)<br />
.571<br />
(.364)<br />
2.477**<br />
(.527)<br />
11.058 <br />
(5.923)<br />
Note.—The dependent variable is daily crime totals by district. Standard errors (in parentheses) are<br />
clustered by district. All regressions contain day-<strong>of</strong>-the-week fixed effects and district fixed effects. The<br />
2<br />
number <strong>of</strong> observations is 3,542. R p .28. HAC p heteroskedastic autocorrelation consistent.<br />
<br />
Significantly different from zero at the 10 percent level.<br />
* Significantly different from zero at the 5 percent level.<br />
** Significantly different from zero at the 1 percent level.<br />
Figure 2: The dependent variable is the daily total number <strong>of</strong> crimes in D.C. District 1<br />
refers to a dummy variable associated with crime incidents in the first police district area.<br />
This table present the estimated coefficients and their standard errors in parenthesis.* refers<br />
to a significant coeficient at the 5% level, ** at the 1% level.<br />
an <strong>of</strong>ficial news release from February 27, 2003. 17 Un<strong>of</strong>ficially, we were told<br />
that during heightened alert periods, the police department switches from<br />
three 8-hour shifts a day to two 12-hour shifts, thus increasing the effective<br />
police presence by 50 percent. 18 Despite several requests, however, the D.C.<br />
police would neither confirm nor deny this exact procedure. Nevertheless, if<br />
we take 50 percent as an approximate figure, then we estimate an elasticity<br />
<strong>of</strong> crime with respect to police presence <strong>of</strong> 15 percent/50 percent p .3.<br />
As it turns out, this is exactly the figure estimated by Thomas Marvell and<br />
Carlisle Moody and is also consistent with a range <strong>of</strong> elasticities on different<br />
crimes from approximately .2 to .9 analyzed by Levitt, Corman and Mocan,<br />
and Di Tella and Schargrodsky. 19<br />
Crime may come in waves; we control for some <strong>of</strong> this using day-<strong>of</strong>-theweek<br />
effects, but there may be other sources <strong>of</strong> dependence that result in<br />
serial correlation and thus downwardly biased standard errors. 20 To address<br />
this problem, the second column <strong>of</strong> Table 4 reruns the regression using hetero-<br />
17<br />
See Metropolitan Police Department, supra note 10.<br />
18<br />
With three shifts <strong>of</strong> x police, there are 3x police on the street per day; with two shifts,<br />
there are 2y, assuming that 2y p 3x (the same number 4<strong>of</strong><br />
police are allocated over the day);<br />
then y p 3/2x, an increase <strong>of</strong> 50 percent.<br />
19<br />
Marvell & Moody, supra note 4; Levitt, Reply, supra note 4; Corman & Mocan, supra<br />
note 4; Di Tella & Schargrodsky, supra note 7.<br />
20