pdf - ALD Vacuum Technologies
pdf - ALD Vacuum Technologies
pdf - ALD Vacuum Technologies

You also want an ePaper? Increase the reach of your titles
YUMPU automatically turns print PDFs into web optimized ePapers that Google loves.
Li<br />
6.9<br />
LITHIUM<br />
Sr<br />
Sc<br />
45.0<br />
Ti<br />
47.9<br />
Zr<br />
87.6 91.2<br />
V<br />
50.9<br />
Nb<br />
Ta<br />
181.0<br />
Cr<br />
52.0<br />
Mo<br />
Mn<br />
54.9<br />
Fe<br />
Ni<br />
Cu Zn<br />
55.9 58.7<br />
63.5 65.4<br />
SCANDIUM TITANIUM VANADIUM CHROMIUM MANGANESE IRON<br />
NICKEL COPPER ZINC<br />
B<br />
10.8<br />
BORON<br />
Al<br />
27.0<br />
ALUMINUM<br />
C<br />
12.0<br />
CARBON<br />
Si<br />
28.1<br />
Sn<br />
Sb<br />
92.9 95.9<br />
118.7<br />
121.8<br />
STRONTIUM<br />
ZIRCONIUM NIOBIUM MOLYBDENUM<br />
TIN ANTIMONY<br />
TANTALUM<br />
SILICON<br />
Ce<br />
140.1<br />
CERIUM<br />
U<br />
238.0<br />
URANIUM<br />
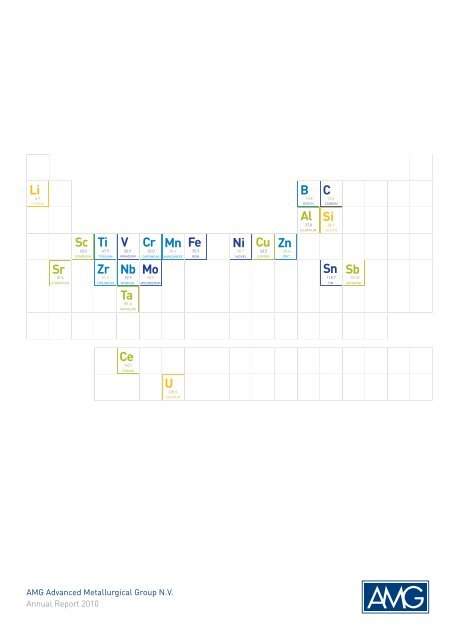
AMG Advanced Metallurgical Group N.V.<br />
Annual Report 2010
Vanadium—<br />
strengthens steel for<br />
use in infrastructure<br />
V<br />
Cr<br />
Nb<br />
Niobium—used to<br />
harden steel<br />
Chromium—<br />
alloy used in<br />
stainless steel<br />
Antimony—used as<br />
a flame retardant in<br />
industrial applications<br />
Sb<br />
Essential materials we use everyday<br />
Highlights 2<br />
CEO Letter to Shareholders 4<br />
Market Focus Reports 10<br />
Report of the Management Board 16<br />
Report of the Supervisory Board 36<br />
Sustainable Development 44<br />
Corporate Governance 53<br />
Financial Review 59
Ti<br />
Silicon Metal—used<br />
for solar energy<br />
Si<br />
Titanium—used in<br />
turbine engines<br />
V<br />
C<br />
Vanadium—alloys<br />
required for aerospace<br />
Carbon—an essential<br />
element in natural graphite,<br />
is used in insulation<br />
Ta<br />
Tantalum—critical<br />
element used in smart<br />
phones and electronics<br />
AMG serves growing end markets with high value added specialty<br />
metal products and engineering solutions. AMG’s products are<br />
critical for the development of advanced technologies used to reduce<br />
CO 2<br />
and conserve natural resources for the Energy, Aerospace,<br />
Infrastructure and Specialty Metals and Chemicals markets. AMG<br />
implements this strategy through secure control of raw materials,<br />
economies of scale and continuous investment in technology.<br />
AMG Advanced Metallurgical Group N.V. | 2010 Annual Report 1
Highlights<br />
Revenue $M<br />
Gross Profit $M EBITDA $M Cash $M* Debt $M* Net Debt $M*<br />
990.5<br />
867.4<br />
165.6 178.6<br />
69.1<br />
84.9<br />
117.0<br />
89.3<br />
237.1<br />
203.8<br />
86.8<br />
147.8<br />
09 10<br />
09 10<br />
09 10<br />
09 10<br />
09 10<br />
09 10<br />
Consolidated Revenue 2010<br />
$M<br />
62%<br />
Advanced Materials 616.3<br />
09<br />
10<br />
429.1<br />
616.3<br />
25%<br />
Engineering Systems 245.6<br />
09<br />
10<br />
320.5<br />
245.6<br />
13%<br />
Graphit Kropfmühl 128.6<br />
09<br />
10<br />
117.8<br />
128.6<br />
Revenue by End Market 2010<br />
$M<br />
21%<br />
Energy 211.2<br />
09<br />
10<br />
294.6<br />
211.2<br />
26%<br />
Aerospace 258.8<br />
09<br />
10<br />
220.5<br />
258.8<br />
17%<br />
Infrastructure 162.7<br />
09<br />
10<br />
108.0<br />
162.7<br />
36%<br />
Specialty Metals<br />
& Chemicals 357.8<br />
09<br />
10<br />
244.3<br />
357.8<br />
* As of December 31<br />
2 Highlights
AMG produces high value added specialty metal products and<br />
engineering solutions used to reduce CO 2<br />
and conserve natural resources.<br />
Using secure raw material strategies, industry consolidation<br />
and investments in technology, AMG provides metallurgical solutions<br />
for responsible energy production, infrastructure, light weight materials<br />
for aerospace and the specialty metals and chemicals markets.<br />
AMG Share Price January 1, 2010—March 31, 2011<br />
g74%<br />
15.42<br />
8.84<br />
ADVANCED MATERIALS<br />
ENGINEERING SYSTEMS<br />
$187.2 million increase in revenue, up 44%, from 2009<br />
$39.8 million increase in EBITDA<br />
Acquired:<br />
• antimony mining rights and metal smelter in Turkey<br />
• a commercial operation in India during early 2011<br />
to expand AMD’s geographic presence<br />
• aluminum master alloy producer KB Alloys during<br />
early 2011<br />
Expanded spent catalyst handling capacity and diversified<br />
spent catalyst sourcing in North America<br />
Completed:<br />
• the lithium mineral pilot plant in Brazil<br />
• long-term sales contracts for tantalum concentrate<br />
in early 2011<br />
15% EBITDA margins generated despite a decline in revenue<br />
13% increase in order backlog at December 2010 from<br />
December 2009<br />
Acquired:<br />
• an equity interest in Dynatech Furnaces (Mumbai) Private<br />
Ltd, a vacuum technologies company in India to increase<br />
ESD’s market presence<br />
• the innovative Mono 2 solar technology from BP Solar,<br />
to produce monocrystalline-like ingots using traditional<br />
multicrystalline furnaces<br />
• an equity interest in nuclear furnace specialist Thermique<br />
Industrie Vide, France<br />
Developed:<br />
• the next generation of DSS solar furnaces, the SCU600plus,<br />
capable of approximately 30% lower operating costs per<br />
kilogram of silicon and therefore lower cost of solar energy<br />
• a new heat treatment system, SyncroTherm ® , which can<br />
reduce operating costs through combining multiple step<br />
processes into one operation<br />
Publicly listed investments:<br />
GRAPHIT KROPFMÜHL AG<br />
$10.7 million increase in revenue, up 9% from 2009<br />
$1.3 million increase in EBITDA, up 21% from 2009<br />
AMG acquired an additional 8.5% of Graphit Kropfmühl<br />
in December 2010, increasing its ownership position<br />
to 88.0%<br />
TIMMINCO LIMITED<br />
Timminco sold 49% of its silicon metal operation to Dow<br />
Corning for $40.1 million in cash and up to an additional<br />
$10.0 million based upon hitting certain performance<br />
objectives. Timminco used the proceeds of this transaction<br />
to repay all of its senior bank debt and for other general<br />
corporate purposes.<br />
Highlights 3
Dear Shareholder,<br />
AMG’s 2010 performance can be understood as a bridge<br />
to its intrinsic profitability levels following a challenging<br />
2009. Operating profit more than doubled to $43.3 million<br />
and EBITDA increased 23% to $84.9 million with the fourth<br />
quarter up 62% over the same period in 2009. For 2011, it<br />
is our objective to surpass the EBITDA level of 2010. That<br />
depends on whether the fallout of the recent events in Japan,<br />
northern Africa and the Middle East lead to disruptions in<br />
global economic activity.<br />
“Built-In Stabilizers”<br />
As seen in 2009, the Advanced Material Division (AMD), in a severe economic downturn, loses<br />
earnings power quickly. In line with this, AMD’s EBITDA in 2009 dropped to a break-even level.<br />
Having been “first in”, it was also “first out” in 2010 generating EBITDA of $39.8 million. In contrast,<br />
the Engineering Systems Division (ESD), was shielded against the crisis somewhat in 2009<br />
by its relatively large order backlog. In line with this, ESD still produced $62.9 million in EBITDA<br />
during 2009. The order backlog reached its low point in April 2010 at $121 million. It rebounded<br />
by year end 2010 to $183 million. Despite this EBITDA declined 40% to $37.5 million from 2009.<br />
The reaction time lag of ESD appears to be about one year vis-à-vis AMD and the volatility of<br />
AMG consolidated is significantly lower than the individual volatility of AMD and ESD.<br />
Revenue $M EBITDA $M<br />
1300<br />
180<br />
1040<br />
780<br />
520<br />
260<br />
135<br />
90<br />
45<br />
0<br />
0<br />
07 08 09 10 07 08 09 10<br />
Advanced Materials<br />
Engineering Systems<br />
Graphit Kropfmühl<br />
4 Letter to Shareholders
It is a strategic objective of AMG to reduce this “downside”<br />
volatility. We are working on this by increasing productivity<br />
to reduce "break-even" prices in all units. We are also<br />
continuing to identify potential “vertical” moves upstream<br />
on the supply lines of our various niche metal markets<br />
and “horizontal” industry consolidation opportunities.<br />
Advanced Materials: The Market for Critical Metals<br />
On balance, in 2010, our markets have begun to return<br />
to a healthy activity level. The global steel industry is<br />
expected to move into record territory in 2011; and the<br />
solar industry, led by China, is continuing its high growth<br />
rates. The aerospace industry is operating on a high level<br />
of backlog with the caveat of projected delays of the new<br />
titanium intensive airplanes.<br />
Prices for non-ferrous metals, the only exchange-traded<br />
metal category, increased substantially in 2010, copper by<br />
33%, the LME index by 24%. The prices for “our” metals<br />
have not moved uniformly. Vanadium, molybdenum and<br />
titanium prices continue to be rather low, chrome metal<br />
has risen by 30% in 2010, silicon metal by 36%, tantalum<br />
has more than doubled, antimony metal almost tripled, so<br />
has the average price of rare earth metals where we are<br />
exposed to cerium for our polishing powder production. The<br />
price explosion in rare earth metals and in antimony metal<br />
is related to export restrictions in China in addition to growing<br />
demand. In antimony metal and rare earth metals the<br />
most important parameter affecting the global market is<br />
China’s export management which reflects concerns about<br />
resource depletion and environmental legacies. In tantalum<br />
it is the reluctance of consumers to use materials resulting<br />
from so called non-ethical mining operations.<br />
16 Quarter Prices $000<br />
250<br />
200<br />
150<br />
100<br />
50<br />
0<br />
15<br />
12<br />
9<br />
6<br />
3<br />
0<br />
Ferrovanadium<br />
Nickel<br />
Tantalum Oxide<br />
07 08 09 10<br />
Chrome<br />
Antimony<br />
Silicon<br />
07 08 09 10<br />
Upstream Integration<br />
We procure the feedstock for our production of metallic<br />
alloys, powders and coatings through three channels:<br />
market purchases, recycling services, and through our<br />
mining operations. Nearly 100% of our production of<br />
vanadium materials (ferro-vanadium, vanadium chemicals<br />
and by-products, such as ferronickel-molybdenum) is<br />
sourced from industrial waste streams (spent catalysts<br />
and other residues from oil refineries and power plants).<br />
In 2010 we contracted for a substantial increase in the<br />
recycling throughput of spent catalysts from oil refineries.<br />
The feedstock for titanium alloys is sourced through<br />
market purchases of titanium sponge and through the<br />
internal production and market purchases of master<br />
alloys, especially vanadium chemicals, which again<br />
are partly sourced through market purchases and our<br />
recycling services. Aluminum master alloys are based<br />
on market purchases and internal production of various<br />
metallic components. Chrome metal is based on market<br />
purchases of chrome oxide and aluminum powders.<br />
Tantalum and niobium are sourced from our mine in<br />
Brazil and from market purchases. We mine graphite in<br />
Sri Lanka and our mine in Germany is on stand by. Quartz<br />
for silicon metal is sourced partially from the market and<br />
also from our mine in Quebec. We also source cerium,<br />
a rare earth metal for polishing powders and hydrogen<br />
storage alloys, from China.<br />
Supply Lines<br />
AMG Products<br />
Antimony Trioxide<br />
Al-Alloys Powders<br />
Chromium Metal<br />
FerroVanadium<br />
FerroNickel-Molybdenum<br />
Fe-Titanium<br />
Tantalum<br />
Natural Graphite<br />
Niobium<br />
Polishing Powders<br />
Silicon Metal<br />
Titanium Alloys<br />
Vanadium Chemicals<br />
Market AMG Recycling AMG Mines<br />
Feed<br />
Metal<br />
Metals<br />
Oxide<br />
Concentrates<br />
Concentrates<br />
Scrap<br />
Concentrates<br />
Ore<br />
Oxide<br />
Cerium<br />
Quartz<br />
Sponge<br />
Concentrates<br />
In 2010 AMG acquired an antimony mining and smelting<br />
property in Turkey. This acquisition was the result of a<br />
global analysis of upstream options for our antimony<br />
trioxide business in Europe. This business was becoming<br />
increasingly risky because of the spiking antimony metal<br />
prices following aforementioned export restrictions in<br />
China, the dominant producer of antimony metal, and<br />
“foreign” acquisition efforts by Chinese producers of antimony<br />
mining properties. We expect to start our antimony<br />
mining and smelting production later in 2011 and ramp<br />
up in 2012. This illustrates that we have started a broad<br />
effort to apply our mining expertise to upstream options<br />
as various rare metal markets show signs of market<br />
imbalances, and also as a result of new demand from<br />
Letter to Shareholders 5
advanced technological developments. Strategic agility is<br />
important to manage those market imbalances.<br />
Industry Consolidation<br />
In February 2011 we completed the acquisition of KB Alloys,<br />
LLC (“KB”), the leading producer of aluminum master<br />
alloys in the United States, with production facilities in<br />
Kentucky and Washington, USA, and China. This is a transformational<br />
acquisition in the aluminum alloy market. We<br />
combine our aluminum master alloy business in the United<br />
Kingdom, Brazil and China with KB and thereby establish<br />
a clear market leader with global reach and a strong<br />
presence in China. We believe this move to be low risk as<br />
we are very familiar with the products, people, markets,<br />
technology, customers and suppliers.<br />
Engineering Systems<br />
An important metric for our heat treatment series, global<br />
automotive demand for fuel efficient vehicles, is improving,<br />
and that includes the North American market where our<br />
services are especially critical to the industry.<br />
In addition to order backlog, an important metric that we<br />
follow closely at ESD is the universe of active outstanding<br />
quotes in which ESD has participated. A certain percentage<br />
of this universe will ultimately be converted into firm<br />
orders and eventually revenue and cash flow. As backlog<br />
is more of a short term indicator, total quotes outstanding<br />
are a measure of healthiness in the medium term. The<br />
trend of the universe of total quotes outstanding is a good<br />
barometer for how ESD is likely to perform over the next<br />
few years. While we do not publish the total volume of<br />
the outstanding quotes, the universe presently exceeds<br />
$2.0 billion and has experienced a double digit percentage<br />
increase over the past twelve months.<br />
350%<br />
300%<br />
250%<br />
200%<br />
150%<br />
100%<br />
50%<br />
0%<br />
05 06 07 08 09 10 11<br />
This increase in quotes is reflected in the increase in<br />
order intake pictured above. The second half of 2010<br />
produced the first positive book to bill quarters since<br />
early 2008. The order intake and quotes are fairly welldistributed<br />
amongst the specialty steel, super alloy,<br />
titanium and solar industries.<br />
While external factors such as overall macroeconomic<br />
health and demand in specific geographic or industry<br />
sectors influence the size of the universe of outstanding<br />
quotes, factors related specifically to ESD’s capabilities<br />
not only influence this pool, but more importantly impact<br />
the conversion of quotes into firm orders. ESD has over<br />
2,000 furnaces installed worldwide and processed more<br />
than a million parts requiring high wear resistance heat<br />
treatment in its Own & Operate unit. Such an extensive<br />
installed base of reference accounts builds on ESD’s<br />
credibility, facilitating to securing orders across a spectrum<br />
of geographic markets. In addition, the continuous<br />
investment in new products and technologies in selected<br />
niche markets provides ESD with a distinct competitive<br />
position, making it the engineering firm of choice in most<br />
of its markets.<br />
We have made several investments in certain technologies<br />
that we expect will enhance ESD’s growth in the near term.<br />
Here are a few examples:<br />
• Heat Treatment: Conventional automotive gear manufacturing<br />
concepts rely on the separation of different<br />
operations such as soft machining, heat treatment and<br />
hard machining. We have developed a new furnace<br />
module called SyncroTherm ® which synchronizes<br />
heat treatment with machining, permitting a one-step<br />
process versus a multiple-step process. Not only does<br />
SyncroTherm ® offer significant cost reductions, but<br />
also provides a more homogenous, higher quality<br />
treatment of parts versus traditional methods. ESD’s<br />
combination of material science and furnace technology<br />
provides a truly disruptive technology in the mass<br />
production of certain automotive parts. This heat<br />
treatment technology is a key component of the fuel<br />
efficiency improvements in the transportation industry.<br />
• Solar: We have developed crystallization furnaces<br />
capable of using much larger crucibles, resulting in<br />
approximately 30% lower operating costs per kilogram<br />
of silicon and therefore lower cost of solar energy. Also,<br />
with the acquisition of the Mono 2 technology from<br />
BP Solar, we will offer an upgraded line of furnace<br />
systems to produce monocrystalline-like ingots using<br />
traditional multicrystalline furnaces that will provide a<br />
higher sunlight to electricity conversion rate at lower<br />
cost per watt.<br />
We have also launched several initiatives in the electron<br />
beam (Blade Runner line smart coaters for turbine<br />
blades), primary melting of specialty steels with vacuum<br />
induction, secondary melting of large ingots and featuring<br />
parallel withdrawal systems, and precision casting for<br />
titanium-aluminides used in aerospace engines.<br />
Social Responsibility<br />
Alongside our financial goals, our three core sustainable<br />
development objectives of being responsible stewards<br />
of the environment, meeting or exceeding regulatory<br />
standards and being a valued contributor to the local<br />
economies and communities in which we operate<br />
continue to guide us.<br />
6 Letter to Shareholders
We continue to focus on products and services that improve energy efficiencies<br />
and to deliver them through a supply chain that aims to continually improve<br />
efficiencies by managing resource use, including raw materials, energy and<br />
water and reducing wastes. We are also committed to making our products in<br />
an ethical way that respects internationally recognized declarations on human<br />
rights. For example, our vertically integrated supply chain for tantalum products<br />
means we can reassure our customers that they are free of the human rights<br />
issues often associated with this conflict mineral. We demonstrate our commitment<br />
through membership of the United Nations Global Compact, the Extractive<br />
Industries Transparency Initiative and through our Organizational Stakeholder<br />
role within the Global Reporting Initiative.<br />
Manufacturing metallurgical products safely is our goal, and in 2010 AMG reemphasized<br />
its commitment to improve safety performance at every site. Earlier<br />
this year I attended AMG’s first Global Safety Conference which included representatives<br />
from all our companies and operations around the world. Once again this<br />
year we are able to report improvement—a 20% reduction in lost time accidents,<br />
but at the Conference I re-emphasized that health and safety is a core element of<br />
the Company’s values and there is urgency to reach our aim of zero injuries.<br />
This increased emphasis on safety and health is simply the right thing for AMG<br />
to do. But putting AMG employees’ safety first also makes good business sense,<br />
since fewer accidents directly convert to reduced costs and increased productivity.<br />
Developing the behaviors that lead to great safety performance spills over into<br />
almost all other areas of a site’s operations from quality to the bottom line. AMG is<br />
implementing a program to include a portion of senior management’s compensation<br />
based upon the health and safety performance of their respective business<br />
unit. A reputation for safe production will also limit risks for our investors and<br />
make us an employer of choice in the sector.<br />
Accomplishments<br />
Developed the next generation<br />
single crucible solar melting and<br />
crystallization vacuum furnaces—<br />
the SCU 600plus<br />
Transitioned Safeguard International<br />
Fund L.P. as a major shareholder<br />
(Dr. Schimmelbusch retains his<br />
1% ownership in AMG)<br />
Purchased an additional 8.5% of<br />
Graphit Kropfmühl<br />
Acquired intellectual property<br />
and manufacturing assets related<br />
to the Mono 2 suite of solar casting<br />
technologies from BP Solar<br />
Acquired an antimony mining<br />
concession and metal smelter<br />
in Turkey<br />
Completed the qualification work at<br />
our lithium concentrate pilot plant<br />
Outlook<br />
We continue in the steadfast pursuit of our strategic objectives. We aspire to be<br />
an industry leader through continued innovation, improving cost efficiency and<br />
focusing on our end markets to achieve stable profitability levels above industry<br />
average. In 2010 we moved closer to those goals by exceeding 2009 revenue and<br />
EBITDA. In 2011 our objective is to exceed 2010 revenue, EBITDA and cash flow.<br />
The strategic changes that we made in the Advanced Materials Division including<br />
the acquisition of the antimony mine and smelter, cost reductions made in the<br />
aerospace master alloys and coatings products, the acquisition of aluminum<br />
alloy producer KB Alloys, LLC and rising prices and demand for tantalum should<br />
yield double digit percentage revenue growth in 2011. The Engineering Systems<br />
division began 2011 with a 13% larger order backlog than it began 2010 due to<br />
improved demand in the specialty steel and solar industries. We expect strengthening<br />
demand for natural graphite and improved pricing especially for silicon<br />
products to result in growth at Graphit Kropfmühl in 2011. As we have seen from<br />
the results of the first two months, 2011 has started well and that supports our<br />
confidence when analyzing the risks associated with our volatile times.<br />
Dr. Heinz C. Schimmelbusch<br />
Chief Executive Officer<br />
Letter to Shareholders 7
In recent years, technological innovation, growth in clean energy,<br />
increased focus on strategic resource management and the<br />
development of emerging markets has increased the demand on<br />
raw materials. In addition, geopolitical/economic changes are<br />
impacting the supply of critical raw materials.<br />
AMG: Critical, Secure, Connected<br />
AMG’s long-term goal remains unchanged: to provide metallurgical solutions to the growing<br />
trend of sustainable development of natural resources and CO 2<br />
reduction for the Energy, Aerospace,<br />
Infrastructure and Specialty Metals and Chemicals markets. The demand on critical raw<br />
materials and technologies needed to meet this goal is increasing. Structural changes involving<br />
infrastructure growth in emerging economies, natural resource scarcity and control, increasing<br />
demand for safe and secure environmentally responsible energy production and demand for<br />
more fuel efficient transportation continue to evolve. AMG, through vertical integration, seeks to<br />
secure many of the critical materials required to serve these growing end markets. AMG’s unique<br />
market position, with a combination of vacuum technology leadership, recycling services, conversion<br />
activities, and mines, is well positioned to capitalize on the long-term growth of critical raw<br />
materials and technologies.<br />
EU Critical Raw Materials<br />
The European Union (EU) issued the “Critical Raw Materials for the EU” 1 report (“EU Report”) in<br />
June 2010. The EU Report noted that “the EU is highly dependent on imports of ‘high tech’ metals<br />
such as cobalt, platinum, rare earths, and titanium. Such materials play an essential role in the<br />
development of innovative ‘environmental technologies’ for boosting energy efficiency and reducing<br />
greenhouse gas emissions. The EU Report concluded that some raw materials can be considered<br />
to be particularly critical, because of three reasons: their significant economic importance<br />
for key sectors, high supply risks and lack of substitutes”.<br />
AMG’s Secure Supply<br />
AMG believes that its MIBRA mine in Brazil is presently the world’s largest producer of “conflict<br />
free” tantalum, as described in the United States “Conflict Minerals Law”, enacted in July 2010.<br />
This law requires U.S. listed companies to report and make public the use of so-called “conflict<br />
minerals” from the Democratic Republic of the Congo or adjoining countries in their products.<br />
Tantalum is primarily used in capacitors for electronic equipment due to its high capacitance that<br />
can be achieved in a small volume, thus helping enable miniaturization of electronics.<br />
Through its secure contracts with producers of oil from the Canadian Oil Sands, AMG is the<br />
world’s largest recycler of spent catalysts used for the production of ferrovanadium and ferronickel-molybdenum.<br />
Ferrovanadium is a key component in the production of carbon steel used for<br />
infrastructure. FeNiMoly ® is used to create high quality stainless steel and special bar quality steel.<br />
In 2010 AMG acquired significant antimony mining rights and an adjacent antimony metal smelter<br />
in Turkey. The acquisition secured a significant supply of antimony metal used in AMG’s antimony<br />
trioxide operation for the specialty chemical flame retardant market.<br />
Natural graphite from AMG’s mine in Sri Lanka is used to produce a wide variety of products<br />
including insulation for infrastructure and electric motors for transportation.<br />
1 Ad-hoc Working Group on defining critical raw materials Critical raw materials for the EU The ad-hoc Working<br />
Group is a sub-group of the Raw Materials Supply Group and is chaired by the European Commission.<br />
8 AMG: Critical, Secure, Connected
Critical Raw Materials for the EU<br />
This report studied the “criticality” of 41 minerals. Based on a criticality methodology,<br />
the EU Report made conclusions regarding the economic importance and supply risk of<br />
the 41 minerals. The EU Report chart is below. The minerals in which AMG is involved<br />
are highlighted. AMG has secure raw material sources for 4 of the 14 minerals that the<br />
EU Report considered to be “critical raw materials”.<br />
Ce<br />
Rare Earths<br />
Supply Risk<br />
Barytes<br />
Diatomite<br />
Talc Perlite<br />
Clays<br />
Sb<br />
PGM<br />
Germanium<br />
Magnesium<br />
Antimony Gallum<br />
Indium<br />
Tungsten<br />
Fluorspar<br />
Ta<br />
C<br />
Beryllium<br />
Graphite<br />
Tantalum<br />
Cobalt<br />
V<br />
Cr<br />
Li<br />
Lithium<br />
Rhenium Magmesote<br />
Mo Vanadium Chromium<br />
Limestone Si<br />
Tellurium<br />
Manganese<br />
Gypsum Ti Bentonite<br />
Molybdenum<br />
Silica<br />
Iron<br />
Zinc<br />
Silver<br />
Copper<br />
Aluminum Bauxite<br />
Feldspar<br />
Fe<br />
Zn Nickel<br />
Titanium Cu<br />
Al Ni<br />
Economic Importance<br />
Nb<br />
Niobium<br />
Critical Raw Materials<br />
AMG: Securing Supplies of Critical Raw Materials<br />
AMG has a wholly owned mine in Brazil that produces tantalum and niobium concentrates.<br />
AMG is the world’s largest recycler of spent catalysts used for the production of ferrovanadium<br />
and ferronickel-molybdenum through its secure contracts with producers of oil<br />
from the Canadian Oil Sands. In Turkey, AMG owns significant antimony mining rights and<br />
an adjacent antimony metal smelter. Through Graphit Kropfmühl, AMG has a high purity<br />
natural graphite mine in Sri Lanka.<br />
Mo<br />
Ni<br />
V<br />
Ferro Vanadium<br />
Vanadium Chemicals<br />
Sb<br />
Antimony<br />
Ta<br />
Tantalum<br />
Nb<br />
Niobium<br />
C<br />
Graphite<br />
AMG: Critical, Secure, Connected 9
Selected Materials and their End Markets<br />
AMG has mining assets of these raw materials<br />
Sb<br />
C<br />
Nb<br />
Ta<br />
m<br />
m<br />
m<br />
m<br />
AMG mines antimony<br />
AMG mines graphite<br />
AMG mines columbite<br />
AMG mines tantalite<br />
AMG smelts and<br />
reduces antimony to<br />
make antimony metal<br />
AMG oxidizes antimony<br />
metal to make<br />
antimony trioxide<br />
AMG refines and purifies the natural graphite<br />
to levels > 99.99 % carbon, producing graphite<br />
powders, parts and dispersions<br />
AMG produces<br />
niobium oxides<br />
AMG produces<br />
tantalum oxide<br />
(Ta 2<br />
O 5<br />
) concentrates<br />
ESD furnace<br />
technology 1<br />
ESD furnace<br />
technology 1<br />
ESD furnace<br />
technology 1<br />
AMG has long-term recycling contracts<br />
Ni<br />
V<br />
Mo<br />
r<br />
r<br />
r<br />
AMG recycles spent<br />
catalysts from the<br />
Canadian Oil Sands<br />
AMG reclaims<br />
vanadium containing<br />
oil residues<br />
AMG recycles spent<br />
catalysts from the<br />
Canadian Oil Sands<br />
AMG produces FeNiMo<br />
(ferronickel-molybdenum),<br />
a product used to produce<br />
stainless steel<br />
AMG produces FeV (ferrovanadium), a product used<br />
to improve the strength to weight ratio in steel<br />
AMG produces<br />
vanadium chemicals<br />
such as V 2<br />
O 5<br />
AMG aluminothermically<br />
reduces the vanadium to<br />
produce vanadium<br />
aluminum for use<br />
in titanium alloys<br />
ESD furnace<br />
technology 1<br />
ESD furnace<br />
technology 1<br />
Ce<br />
AMG purchases<br />
cerium oxides<br />
AMG melts, mills and mixes<br />
cerium oxide to produce<br />
polishing powders<br />
Cr<br />
AMG purchases<br />
chrome oxides<br />
AMG aluminothermically<br />
reduces chromium oxide<br />
to produce chrome metal<br />
ESD furnace<br />
technology 1<br />
Si<br />
AMG purchases coal,<br />
quartz and wood chips<br />
AMG melts and reduces<br />
these products to create<br />
Si Metal, > 99.3% pure silicon<br />
ESD furnace<br />
technology 1,2<br />
Ti<br />
AMG sources titanium, aluminum,<br />
molybdenum, chromium, boron,<br />
copper, tin, etc.<br />
Through a proprietary melting process<br />
AMG creates a number of alloys including<br />
Gamma Titanium Aluminum (Gamma Ti).<br />
It is approx. half the weight of steel, corrosionresistant,<br />
able to withstand high temperatures<br />
and has a stiffness that is close to steel<br />
ESD furnace<br />
technology 1<br />
m mining<br />
r recycling<br />
1<br />
ESD furnace technology used by processors of AMG end products<br />
2<br />
ESD furnace technology used by AMG and processors of AMG end products<br />
10 Selected Materials and their End Uses
plastics<br />
infrastructure<br />
medical<br />
batteries<br />
alloys<br />
textiles<br />
electronics<br />
rubber<br />
infrastructure<br />
transportation<br />
video games<br />
titanium<br />
specialty steel<br />
steel<br />
computers<br />
carbon steel<br />
steel<br />
smart phones<br />
aerospace<br />
HSLA steel<br />
rubber<br />
UV absorption<br />
in glass<br />
emissions control<br />
catalyst<br />
pigments<br />
emissions control<br />
acid<br />
electronics<br />
glass<br />
glazes<br />
batteries<br />
optics<br />
superalloys<br />
nickel-base alloys<br />
aluminum alloys<br />
stainless steel<br />
aluminum<br />
solar panels<br />
Gamma Ti<br />
infrastructure<br />
electronics<br />
power<br />
generation<br />
alloys<br />
aerospace<br />
superalloys<br />
energy aerospace infrastructure specialty metals and chemicals<br />
Selected Materials and their End Uses 11
Energy<br />
Energy demand is expected to grow faster than population growth<br />
as the standard of living continues to rise in emerging markets;<br />
an 86% increase in energy demand is forecast by 2050. 1<br />
Growth in energy demand will lead to significant investments in energy infrastructure<br />
needed to supply both conventional and alternative energy. AMG is meeting this<br />
demand through research and development for the safe storage of nuclear waste,<br />
vacuum furnaces used in the production of solar silicon ingots and specialty alloys<br />
used to help make industrial gas turbines more fuel efficient. In 2010 AMG acquired<br />
intellectual property and manufacturing assets related to the Mono 2 solar casting<br />
technology. Mono 2 is a proprietary process whereby high-efficiency monocrystallinelike<br />
silicon ingots are produced utilizing standard SCU furnaces using a variety of<br />
solar silicon feedstock. This technology is being integrated into AMG’s Engineering<br />
Systems Division’s SCU400plus and SCU600plus solar melting and crystallization<br />
vacuum furnaces. AMG has a global installed capacity of over 3.5 GW peak or the<br />
equivalent of over 500 SCU furnaces and is recognized as a leading technology<br />
provider to the solar wafer industry.<br />
AMG produces high purity silicon metal (greater than 99% purity), the basic building<br />
block for polysilicon used in solar and semiconductor wafers. AMG estimates that<br />
silicon metal demand for solar applications was 180,000 metric tons or 10% of global<br />
silicon metal production in 2010. Silicon metal is produced by melting silica and coke<br />
in a submerged electric arc furnace at high temperatures, to produce a reaction<br />
where the oxygen is removed, leaving behind silicon. AMG has an annual capacity<br />
to produce 30,000 metric tons of silicon metal annually. Timminco Limited, in which<br />
AMG has a minority investment, has a capacity to produce approximately 24,000<br />
metric tons of silicon metal annually through its 51% ownership of Quebec Silicon.<br />
AMG also produces high purity natural graphite, a material which is used as an anode<br />
in lithium ion batteries, a rapidly growing market.<br />
$211.2M 21% $47.3M 22%<br />
AMG revenue<br />
of total AMG<br />
revenue<br />
gross profit<br />
gross margin<br />
12 Market Focus Report | Energy
End Markets<br />
ADVANCED MATERIALS<br />
Superalloys for industrial<br />
gas turbines<br />
Coating materials for thin<br />
film solar applications<br />
Energy storage technologies<br />
ENGINEERING SYSTEMS<br />
Solar vacuum furnaces<br />
<strong>Vacuum</strong> melting and precision<br />
casting systems for industrial<br />
gas turbines<br />
<strong>Vacuum</strong> furnaces used to<br />
produce nuclear fuels<br />
GRAPHIT KROPFMÜHL<br />
Energy storage technologies<br />
Silicon metal for use in polysilicon<br />
production for solar cells<br />
TIMMINCO<br />
Silicon metal for use in polysilicon<br />
production for solar cells<br />
C<br />
Carbon—which occurs naturally<br />
as graphite, is used in lithium<br />
ion batteries as an anode<br />
Si<br />
Silicon Metal—used in the<br />
production of solar energy<br />
1<br />
Energy Information Agency’s International Energy Outlook 2009<br />
Market Focus Report | Energy 13
Aerospace<br />
Global aviation accounts for about 2% of global CO 2<br />
emissions. 1 A 1% reduction of aerospace fuel burn is<br />
equivalent to a fuel saving of 250 liters per flight. 2<br />
Reducing structural weight is one of the major ways to improve aircraft performance.<br />
AMG produces a number of specialty alloys and coatings including gamma titanium<br />
aluminum used to help reduce weight and improve operational performance of<br />
aircraft. These lightweight, high strength materials are critical to enabling the next<br />
generation commercial aircraft to reduce CO 2<br />
emissions and fuel usage. AMG’s<br />
high-purity master alloys improve the physical properties of titanium alloys used<br />
in jet engines, airframes, and other critical-quality applications. The landing gears,<br />
airframes, and turbine blades of jet engines rely on strong, light-weight titanium<br />
alloys strengthened with these high-purity master alloys. In addition to producing<br />
light-weight materials, AMG’s coatings products such as thermal barrier coatings<br />
play a crucial role in jet aircraft engines and other aerospace applications. These<br />
coatings help materials withstand higher temperatures and mechanical stresses,<br />
while extending the useful life of the end products. These materials are highly<br />
engineered products designed to meet the needs of today’s high stress operating<br />
environments. With more than 90 years of know-how AMG is continuously developing<br />
new tailor-made materials according to our customers' requirements.<br />
AMG also develops and produces advanced vacuum furnace systems used to make<br />
titanium and other high purity materials used in aerospace applications. AMG produces<br />
electron beam /physical vapour deposition systems for corrosion protection and<br />
vacuum arc remelting systems used to produce high purity titanium and superalloys<br />
for aerospace. Some of these technologies have been used to help the Boeing 787<br />
achieve its goal of being 20% more efficient than similarly sized airplanes. 3<br />
$258.8M 26% $54.3M 21%<br />
AMG revenue<br />
of total AMG<br />
revenue<br />
gross profit<br />
gross margin<br />
14 Market Focus Report | Aerospace
N<br />
Nickel & Molybdenum–<br />
used in high-purity<br />
aerospace applications<br />
Mo<br />
V<br />
Vanadium—used in<br />
superalloys and<br />
titanium alloys<br />
Nb<br />
Niobium—alloys<br />
used in Titanium<br />
Ti<br />
Titanium—alloys<br />
used in turbine engines<br />
End Markets<br />
ADVANCED MATERIALS<br />
Titanium alloys<br />
Superalloys<br />
Titanium aluminide for<br />
turbine fan blades<br />
ENGINEERING SYSTEMS<br />
<strong>Vacuum</strong> furnaces for titanium<br />
Electron beam coating systems<br />
for aerospace turbines<br />
1<br />
The Committee on Climate Change, September 9, 2009<br />
2<br />
IATA The IATA Technology Roadmap Report June 2009<br />
3<br />
Boeing.com<br />
Market Focus Report | Aerospace 15
Infrastructure<br />
It is estimated between $25 trillion and $30 trillion<br />
will be spent on global infrastructure over the coming<br />
two decades. 1<br />
Long term fundamental changes involving infrastructure growth in emerging economies<br />
and natural resource scarcity are impacting demand on AMG’s infrastructure<br />
products. AMG produces ferrovanadium, which, when added to crude steel, creates a<br />
product that is lightweight and extremely high in tensile strength and wear resistance.<br />
AMG also produces ferronickel-molybdenum which is used to create high quality<br />
stainless steel and special bar quality steel. AMG produces these ferroalloys via recycling<br />
spent oil catalysts from the Canadian Oil Sands. In this unique business model,<br />
AMG’s technologically advanced process recovers these valuable specialty metals<br />
from hazardous waste, eliminating the need to landfill this waste. AMG estimates that<br />
the energy consumption used to produce recycled vanadium is approximately 60%<br />
of primary manufacturing routes. AMG is the largest recycler of spent catalysts in<br />
the world and has an estimated 30% ferrovanadium market share in North America.<br />
Demand for these alloys is driven both by infrastructure expenditures and an increase<br />
in vanadium usage per metric ton of steel in developing countries. For example,<br />
structural steel in China contains only 1 / 3 of the vanadium per metric ton of steel as<br />
in North America. 2<br />
AMG also produces high purity natural graphite at Graphit Kropfmühl. Natural<br />
graphite is known for its conductivity, lubrication, heat resistance, and bonding<br />
properties. Graphit Kropfmühl produces the highest quality graphite through<br />
its own source mines and vertically integrated production facilities. This high<br />
purity natural graphite is primarily used in the infrastructure industry as thermal<br />
insulation for the building materials.<br />
$162.7M 17% $34.7M 21%<br />
AMG revenue<br />
of total AMG<br />
revenue<br />
gross profit<br />
gross margin<br />
16 Market Focus Report | Infrastructure
End Markets<br />
ADVANCED MATERIALS<br />
Ferrovanadium for<br />
building materials<br />
(structural steel)<br />
Niobium to harden steel<br />
Nickel molybdenum for<br />
stainless steel<br />
ENGINEERING SYSTEMS<br />
<strong>Vacuum</strong> furnaces for<br />
specialty steel<br />
GRAPHIT KROPFMÜHL<br />
Graphite insulation<br />
Chromium —alloy used to<br />
produce stainless steel<br />
Cr<br />
Carbon—which occurs naturally<br />
as graphite, used in insulation<br />
C<br />
V<br />
Vanadium—used to<br />
improve the strengthto-weight<br />
ratio in steel<br />
Ni<br />
Nickel molybdenum—<br />
used in steel production<br />
Mo<br />
Niobium—used<br />
to harden steel<br />
Nb<br />
1<br />
Benjamin Tal, CIBC World Bank, 2009<br />
2<br />
Evraz Group S.A.<br />
Market Focus Report | Infrastructure 17
Specialty metals and chemicals<br />
The specialty chemicals industry was valued at $393 billion<br />
in 2009. China’s specialty chemicals market is expected to<br />
grow at 9% annually over the next five years. 1<br />
Antimony—used as<br />
a flame retardant<br />
in textiles<br />
Sb<br />
Utilizing its extensive background in metals based material technologies, AMG<br />
produces innovative specialty metals and chemicals for a wide variety of applications.<br />
AMG focuses on securing the raw materials to create intermediate products<br />
that enhance the performance of our customer’s end products while promoting<br />
sustainable development.<br />
Over the last century AMG’s predecessor companies have been developing the “next<br />
generation” materials to improve the quality of life and spur innovation. Specifically,<br />
AMG is focused on producing customized metallurgical solutions that meet the<br />
market’s exacting demands. AMG has secure raw material supplies for two of<br />
its critical materials used in the specialty metal and chemical markets. These<br />
two materials—tantalum and antimony—are listed as “critical” by the European<br />
Commission due to supply risk and economic importance.<br />
Included in AMG’s product portfolio is tantalum, a material used as a capacitor<br />
in electronics due to its high capacitance that can be achieved in a small volume,<br />
thus helping enable miniaturization of electronics. Demand and pricing of tantalum<br />
has increased substantially in recent years due to the significant use of tantalum<br />
for electronic capacitors in high tech electronic goods. Tantalum is vital in making<br />
smart phones, tablets and computers smaller, faster, and more efficient. AMG is<br />
the world’s largest producer of “conflict free” tantalum, as described in the United<br />
States “Conflict Minerals Law”, enacted in July 2010. This law requires U.S. listed<br />
companies to report and make public the use of so-called “conflict minerals” from<br />
the Democratic Republic of the Congo or adjoining countries in their products. AMG<br />
produces tantalum concentrate from its MIBRA mine in Brazil.<br />
AMG also produces antimony trioxide, a flame retardant used in a number of specialty<br />
chemical applications including plastics, textiles and infrastructure applications. In<br />
2010 AMG acquired significant antimony mining rights and an adjacent antimony<br />
metal smelter in Turkey. Antimony metal is the feedstock used to produce antimony<br />
trioxide and over 90% of the world’s antimony metal is currently produced in China.<br />
This investment will help secure AMG’s raw material supply.<br />
V<br />
Vanadium—<br />
used to improve<br />
UV absorption<br />
in glass<br />
$357.8M 36% $42.3M 12%<br />
AMG revenue<br />
of total AMG<br />
revenue<br />
gross profit<br />
gross margin<br />
18 Market Focus Report | Specialty Metals and Chemicals
Chromium—added to steel<br />
to make stainless steel<br />
Cr<br />
Ta<br />
Tantalum—critical<br />
element used in smart<br />
phones and electronics<br />
Sb<br />
Antimony—added to plastics<br />
as a flame retardant for<br />
industrial refractories<br />
End Markets<br />
ADVANCED MATERIALS<br />
Aluminum powders for<br />
paints and pigments<br />
Tantalum for capacitors<br />
Coatings for glass, tools<br />
and optics<br />
ENGINEERING SYSTEMS<br />
<strong>Vacuum</strong> systems for high<br />
performance materials<br />
GRAPHIT KROPFMÜHL<br />
Silicon metal for silicones<br />
and aluminum<br />
Graphite for Industrial<br />
Refractories<br />
TIMMINCO<br />
Silicon metal for silicones<br />
and aluminum<br />
1<br />
SRI Consulting<br />
Market Focus Report | Specialty Metals and Chemicals 19
Report of the Management Board<br />
Dr. Heinz Schimmelbusch<br />
Chairman & Chief Executive Officer<br />
66<br />
William Levy<br />
Chief Financial Officer<br />
51<br />
Eric Jackson<br />
President, Advanced Materials<br />
58<br />
Dr. Reinhard Walter<br />
President, Engineering Systems<br />
59<br />
20 Report of the Management Board
Dr. Schimmelbusch was appointed Chief Executive Officer and Chairman of the Management<br />
Board on November 21, 2006. He has served in a similar capacity for businesses comprising<br />
AMG since 1998. Dr. Schimmelbusch also serves as nonexecutive chairman of the board of<br />
various companies, including Allied Resource Corporation, United States, and Chairman<br />
of the Supervisory Board of PFW Aerospace, Speyer, Germany. Dr. Schimmelbusch is also<br />
Chairman and CEO of Timminco Limited and a General Partner, Managing Director and a<br />
founder of Safeguard International Fund, L.P. Dr. Schimmelbusch served as Chairman of<br />
Metallgesellschaft AG from 1989 until he resigned in 1993. His directorships have included<br />
Allianz Versicherung AG, Mobil Oil AG, Teck Corporation, Methanex Corporation and MMC<br />
Norilsk Nickel. Dr. Schimmelbusch served as Chairman of the Executive Board of The<br />
Federation of German Industries (BDI) and President of the International Chamber of<br />
Commerce (ICC). Dr. Schimmelbusch received his graduate degree (with distinction) and<br />
his doctorate (magna cum laude) from the University of Tübingen, Germany.<br />
Mr. Levy was appointed Chief Financial Officer and member of the Management Board on<br />
April 1, 2007 and he was reappointed for a term of four years on May 13, 2009. Mr. Levy<br />
has been employed by a subsidiary of AMG since 2005. Previously, he was CFO of PQ<br />
Corporation, a leading global chemicals and engineered glass materials company. He<br />
was appointed Vice-President and Chief Financial Officer of PQ Corporation in 2002.<br />
From 1984 to 1996, Mr. Levy held various senior positions in finance and marketing with<br />
Imperial Chemical Industries plc in the United Kingdom and the United States. In 1984,<br />
Mr. Levy qualified as a certified public accountant with PricewaterhouseCoopers LLP, in<br />
the United States. Mr. Levy received a BS degree in accountancy (magna cum laude) from<br />
Villanova University, United States.<br />
Mr. Jackson was appointed President of the Advanced Materials Division and member of<br />
the Management Board on April 1, 2007 and he was reappointed for a term of four years<br />
on May 13, 2009. Mr. Jackson has served in various senior capacities for businesses<br />
now owned by AMG since 1996. He previously acted as Director at Phibro, a division of<br />
Salomon, Inc, and as Vice-President at Louis Dreyfus Corporation. In addition, from 1979<br />
to 1989 Mr. Jackson acted in various roles for Cargill Incorporated in Canada and the<br />
United States. Mr. Jackson received a BS degree in economics and an MBA, both from the<br />
University of Saskatchewan, Canada.<br />
Dr. Walter was appointed President of the Engineering Systems Division and member of<br />
the Management Board on April 1, 2007 and he was reappointed for a term of four years on<br />
May 13, 2009. He has served on the management board of directors of companies in the<br />
Division since December 2001, and has served as chairman of the management board<br />
of <strong>ALD</strong> since September 2004. From 1997 to 2001, Dr. Walter acted as Chief Financial<br />
Officer and Deputy Chairman of VBH Holding AG, Germany. He was a member of the<br />
management board in Berzelius Umwelt-Service AG, a recycler of industrial residues.<br />
From 1983 to 1988, he was Managing Director of Uraphos Chemie GmbH, a company<br />
operating engineering and recycling services for industrial waste. Dr. Walter received<br />
a business administration degree and a doctorate in economics from the University of<br />
Saarbrücken, Germany.<br />
Report of the Management Board 21
22 Report of the Management Board | Business Review: Advanced Materials Division<br />
Advanced Materials Division<br />
Master Alloy Production<br />
C<br />
Si<br />
Ni<br />
Cr<br />
V<br />
Ti<br />
Ta<br />
Sc<br />
Li<br />
Sr<br />
Zr<br />
Fe<br />
Cu Zn<br />
Sn<br />
B<br />
Al<br />
Ce<br />
U<br />
Mn<br />
Mo<br />
Nb<br />
Sb<br />
12.0<br />
28.1<br />
27.0<br />
58.7 65.4<br />
63.5<br />
181.0<br />
140.1<br />
121.8<br />
118.7<br />
95.9<br />
92.9<br />
91.2<br />
87.6<br />
45.0 47.9 50.9 52.0 54.9 55.9<br />
10.8<br />
6.9<br />
238.0<br />
MOLYBDENUM<br />
ZIRCONIUM<br />
LITHIUM<br />
MANGANESE<br />
NICKEL<br />
CARBON<br />
SILICON<br />
URANIUM<br />
SCANDIUM TITANIUM VANADIUM CHROMIUM IRON<br />
NIOBIUM<br />
COPPER<br />
TIN<br />
ALUMINUM<br />
BORON<br />
ZINC<br />
ANTIMONY<br />
TANTALUM<br />
STRONTIUM<br />
CERIUM<br />
H<br />
1.0<br />
HYDROGEN<br />
Be<br />
9.0<br />
BERYLLIUM<br />
Na<br />
23.0<br />
SODIUM<br />
Mg<br />
24.3<br />
MAGNESIUM<br />
K<br />
39.1<br />
POTASSIUM<br />
Ca<br />
40.1<br />
CALCIUM<br />
Co<br />
58.9<br />
COBALT<br />
Ga<br />
69.7<br />
GALLIUM<br />
Ge<br />
72.6<br />
GERMANIUM<br />
As<br />
74.9<br />
ARSENIC<br />
Se<br />
79.0<br />
SELENIUM<br />
Br<br />
79.9<br />
BROMINE<br />
Kr<br />
83.8<br />
KRYPTON<br />
P<br />
31.0<br />
PHOSPHORUS<br />
S<br />
32.1<br />
SULFUR<br />
Cl<br />
35.5<br />
CHLORINE<br />
Ar<br />
40.0<br />
ARGON<br />
N<br />
14.0<br />
NITROGEN<br />
O<br />
16.0<br />
OXYGEN<br />
F<br />
19.0<br />
FLORINE<br />
Ne<br />
20.2<br />
NEON<br />
He<br />
4.0<br />
HELIUM<br />
Te<br />
127.6<br />
TELLURIUM<br />
I<br />
126.9<br />
IODINE<br />
Xe<br />
131.3<br />
XENON<br />
Ag<br />
107.9<br />
SILVER<br />
Cd<br />
112.4<br />
CADMIUM<br />
In<br />
114.8<br />
INDIUM<br />
Ru<br />
101.0<br />
RUTHENIUM<br />
Rh<br />
102.9<br />
RHODIUM<br />
Pd<br />
106.4<br />
PALLADIUM<br />
Tc<br />
99<br />
TECHNETIUM<br />
Y<br />
88.9<br />
YITRIUM<br />
Rb<br />
85.5<br />
RUBIDIUM<br />
Po<br />
210.0<br />
POLONIUM<br />
At<br />
210.0<br />
ASTATINE<br />
Rn<br />
222.0<br />
RADON<br />
Au<br />
197.0<br />
GOLD<br />
Hg<br />
200.6<br />
MERCURY<br />
Tl<br />
204.4<br />
THALLIUM<br />
Os<br />
190.2<br />
OSMIUM<br />
Ir<br />
192.2<br />
IRIDIUM<br />
Pt<br />
195.1<br />
PLATINUM<br />
Re<br />
186.2<br />
RHENIUM<br />
57-71<br />
Cs<br />
132.9<br />
CAESIUM<br />
Hf<br />
178.5<br />
HAFNIUM<br />
Ba<br />
137.4<br />
BARIUM<br />
W<br />
183.9<br />
TUNGSTEN<br />
Pb<br />
207.2<br />
LEAD<br />
Bi<br />
209.0<br />
BISMUTH<br />
Uuh<br />
292<br />
UNUNHEXIUM<br />
Rg<br />
272<br />
ROENTGENIUM<br />
277<br />
UNUNBIUM<br />
Uut<br />
284<br />
UNUNTRIUM<br />
Hs<br />
265<br />
HASSIUM<br />
Mt<br />
266<br />
MEITNERIUM<br />
Ds<br />
269<br />
DARMSTADTIUM<br />
Bh<br />
264<br />
BOHRIUM<br />
89-103<br />
Fr<br />
223.0<br />
FRANCIUM<br />
Rf<br />
88.9<br />
RUTHERFORDLIUM<br />
Ra<br />
226.0<br />
RADIUM<br />
Sg<br />
263<br />
SEABORGIUM<br />
Uuq<br />
289<br />
UNUNQUADIUM<br />
Uup<br />
288<br />
UNUNPENTIUM<br />
Db<br />
262<br />
DUBNIUM<br />
Tm<br />
168.9<br />
THALLIUM<br />
Yb<br />
173.0<br />
YTTERBIUM<br />
Lu<br />
175.0<br />
LUTETIUM<br />
Gd<br />
157.3<br />
GADOLINIUM<br />
Tb<br />
158.9<br />
TERBIUM<br />
Dy<br />
162.5<br />
DYSPROSIUM<br />
Pm<br />
147.0<br />
PROMETHIUM<br />
Sm<br />
150.4<br />
SAMARIUM<br />
Eu<br />
152.0<br />
EUROPIUM<br />
Nd<br />
144.2<br />
NEODYMIUM<br />
La<br />
138.9<br />
LANTHANUM<br />
Pr<br />
140.9<br />
PRASEODYMIUM<br />
Ho<br />
164.9<br />
HOLMIUM<br />
Er<br />
167.3<br />
ERBIUM<br />
Lr<br />
257.0<br />
LAWRENCIUM<br />
No<br />
254.0<br />
NOBELIUM<br />
Md<br />
256.0<br />
MENDELEVIUM<br />
Cm<br />
247.0<br />
CURIUM<br />
Cf<br />
251.0<br />
CALIFORNIUM<br />
Np<br />
237.0<br />
NEPTUNIUM<br />
Pu<br />
242.0<br />
PLUTONIUM<br />
Am<br />
243.0<br />
AMERICIUM<br />
Ac<br />
132.9<br />
ACTINIUM<br />
Pa<br />
231.0<br />
PROTACTINIUM<br />
Es<br />
254.0<br />
EINSTEINIUM<br />
Fm<br />
253.0<br />
FERMIUM<br />
Th<br />
232.0<br />
THORIUM<br />
Bk<br />
247.0<br />
BERKELIUM<br />
Related Elements
The Advanced Materials Division’s financial<br />
performance rebounded strongly from the<br />
recession of late 2008 and a very weak 2009.<br />
2010 revenue increased by 44% to $616.3 million, gross margins increased<br />
by 98% to $94.7 million and EBITDA increased from break even in 2009 to<br />
$39.8 million. SG&A increased by 4% from 2009, and was flat compared to 2008.<br />
The division invested in product innovation, positioning our businesses more<br />
profitably in the value chain, securing strategic sources of raw materials and, in<br />
some cases, industry consolidation during 2010 and early 2011. A key indicator of<br />
the strength of our business is gross margin return on working capital investment.<br />
This improved to 71%, from a depressed 42% in 2009, as gross margins<br />
and working capital turns both increased. This metric combines our pricing and<br />
sourcing power, operating efficiency and effective use of working capital.<br />
These significantly improved results across all of the division’s major business<br />
segments over 2009 are a reflection of the initiative and commitment of our<br />
people as the cost reductions and productivity improvements made in 2008<br />
and 2009 resulted in increased financial leverage as the business environment<br />
improved. The division also executed a number of the strategic projects which we<br />
expect will position us for higher base level financial performance and, in some<br />
cases, reduce the volatility of earnings.<br />
Accomplishments<br />
Acquired antimony mining rights<br />
and metal smelter in Turkey<br />
Acquired aluminum master alloy<br />
producer KB Alloys (1Q2011),<br />
with production facilities in<br />
North America and China<br />
Expanded spent catalyst handling<br />
capacity and diversification<br />
of spent catalyst sourcing in<br />
North America<br />
Signed long-term sales contracts<br />
for tantalum concentrate<br />
in early 2011<br />
Completed lithium mineral<br />
(spodumene) pilot plant in Brazil—<br />
moving to feasibility study<br />
Acquired established<br />
commercial operation in India<br />
End Markets<br />
The Advanced Materials Division produces and supplies specialty metals, alloys,<br />
chemicals, coatings, powders and ceramic materials that are used in high performance<br />
environments. The majority of these materials are the basis of critical<br />
components used in aerospace, infrastructure, energy and specialty metal and<br />
chemical applications. We use management estimates and consistent assumptions<br />
in making the following segmental end market comments.<br />
Aerospace<br />
AMD produces a multitude of critical metals and alloys for titanium and super<br />
alloy customers in the aerospace market. AMD’s master alloys are used in the<br />
titanium and super alloy industries as alloying elements to improve mechanical<br />
properties such as anti-corrosion and high temperature heat resistance. There<br />
are a very limited number of companies, globally, with the certification to supply<br />
these materials for aerospace applications. AMD’s 2010 sales to this segment<br />
increased from $84.1 million to $105.1 million and margins improved by<br />
Advanced Materials<br />
616.3<br />
94.7<br />
39.8<br />
429.1<br />
47.9<br />
09 10<br />
Revenue<br />
09 10<br />
Gross Profit<br />
-<br />
09 10<br />
EBITDA<br />
Report of the Management Board | Business Review: Advanced Materials Division 23
The generally improving business environment, well controlled costs<br />
and the investments and acquisitions that were completed in 2010 will<br />
be important contributors to the anticipated improved performance in<br />
2011 and, more significantly, in future years.<br />
$12 million. The titanium and super alloy industries saw strong growth in demand, supported<br />
by improved short, medium and long-term forecasts for commercial aviation. We expect these<br />
markets to continue to be strong in 2011.<br />
Infrastructure<br />
AMD produces chromium metal, ferrovanadium, ferrotitanium, ferronickel-molybdenum and<br />
nickel boron that are used primarily in structural and stainless steels for infrastructure applications.<br />
AMD’s 2010 sales to this market segment were $118.6 million, up 59% from 2009<br />
and gross margins improved from $7.8 million in 2009 to $26.5 million. AMD’s ferrovanadium<br />
sales volumes remained below capacity levels as the North American steel industry operated<br />
at an average capacity utilization rate of only 70%; however, sales and margins on chromium<br />
metal and ferronickel-molybdenum were strong, in line with the stronger specialty steel market.<br />
Ferrovanadium index prices increased from $10.93 per pound vanadium in 2009 to $14.48 in 2010,<br />
yet still well below prior year’s levels and sales continued to be finalized at substantial discounts<br />
to the index. Steel capacity utilization rates are likely to improve gradually in 2011.<br />
Energy<br />
AMD produces metal and ceramic based target materials and coatings for photovoltaic end<br />
markets and high purity chromium metal that is a critical element in super alloys used in land<br />
based turbines. AMD’s primary product in this end market is a transparent conductive oxide<br />
used in thin film photovoltaics. 2010 sales increased by 33% to $34.8 million and gross margin<br />
percentages were maintained, increasing proportionately with higher volumes.<br />
Specialty Metals and Chemicals<br />
We produce a number of specialty metals, chemicals and powders used in diverse, critical<br />
application end markets. Four of these are significant drivers of the division’s performance and<br />
strategically important to the growth of AMD.<br />
These primary products are: i) antimony trioxide and antimony based master-batches supplied<br />
to the chemical industry for flame retardant applications, ii) aluminum master alloys and grain<br />
refiners supplied to the aluminum industry to enhance the physical and mechanical properties<br />
of aluminum, iii) tantalum concentrate and oxides used in electronics, and iv) super alloys and<br />
aluminum alloy powders supplied to the pigments, coatings and chemicals industries. AMD<br />
made substantial investments in these business lines in 2010 and expects that they will be<br />
important components of our improved performance in the next several years.<br />
This diverse end market segment generated sales of $357.8 million in 2010, a 46% increase<br />
over 2009 and increased gross margins by 53%. The improvement in margins was driven largely<br />
by increased volumes of aluminum master alloys as the aluminum industry rebounded from the<br />
depressed levels of 2009. Strong operating performance improvements in aluminum powders,<br />
primarily process and yield related, and increasing prices and higher volumes in antimony trioxide<br />
were also significant factors in the improved performance in this segment.<br />
24 Report of the Management Board | Business Review: Advanced Materials Division
Regional<br />
Breakdown<br />
$14.3M ROW<br />
$47.2M South America<br />
$86.3M Asia<br />
$157.0M North America<br />
$311.5M Europe<br />
Outlook<br />
Antimony—Antimony is one of 14 critical raw materials listed by the European<br />
Union and 90% plus of all antimony metal is mined and produced in China.<br />
The Chinese government has imposed export quotas and closed mines that do<br />
not meet increasingly restrictive environmental standards. These actions have<br />
resulted in prices rising nearly 3-fold over the past year. For many years AMD<br />
searched for an opportunity to backward integrate our antimony trioxide businesses.<br />
In 2010 AMD acquired a mining concession and smelter in Turkey that uniquely<br />
positions AMD as the only non-Chinese vertically integrated supplier of antimony<br />
products. Securing low cost, strategically situated raw materials is a cornerstone<br />
of our business strategy and we will continue to search for new opportunities.<br />
Tantalum—We have, for some time, been convinced that depressed market prices,<br />
the closure of non-economic mines and strong demand from the electronics<br />
and super alloy industries would result in a shortage of tantalum. The global<br />
recovery in 2010 plus the electronics industry and the US government initiatives<br />
to stop the flow of conflict minerals (including tantalum) from the Democratic<br />
Republic of the Congo and adjacent countries has lead to sharply higher prices.<br />
AMD recently sold 24 months of tantalum production, to be delivered April 2011<br />
forward, at prices that will deliver improved operating profit. We will continue to<br />
evaluate additional expansion possibilities based on market opportunities.<br />
Aluminum master alloys—Historically AMD produced aluminum master alloys and<br />
grain refiners in Brazil, the UK and China. We have been the technical and market<br />
leader in those regions but have had a small share of the North American market.<br />
In early 2011, AMD acquired the North American market leader in aluminum<br />
master alloys, KB Alloys, LLC (“KB”). KB has two production facilities in North<br />
America and a joint venture in China complementary to AMG’s 100% owned facility<br />
in China. As a former competitor to KB, we have great respect for the quality and<br />
culture of their people. Combining the number 1 and number 2 global players will<br />
result in improved customer service and logistics, economies of scale and faster<br />
new product development.<br />
Spent catalyst processing—AMD has invested in capability and expanded<br />
capacity to process metal containing spent refinery catalysts, extracting<br />
nickel, molybdenum and vanadium. The company’s unique process has been<br />
exceptionally well received by oil refiners as they look to send these typically<br />
hazardous wastes to the most environmentally responsible processors. We<br />
are very enthusiastic about this business model in which the spent catalyst<br />
generator pays AMD to process the material and AMD in return pays the<br />
refiner a percentage of the recovered metals credits. We will continue to invest<br />
in this business in 2011.<br />
End Market Uses<br />
/// ENERGY<br />
Superalloys for industrial<br />
gas turbines<br />
Coating materials for thin<br />
film solar applications<br />
Energy storage technologies<br />
/// AEROSPACE<br />
Titanium alloys<br />
Superalloys<br />
Turbine coatings<br />
/// INFRASTRUCTURE<br />
Ferrovanadium for building<br />
materials (structural steel)<br />
/// SPECIALTY METALS & CHEMICALS<br />
Aluminum powders for<br />
paints and pigments<br />
Tantalum for capacitors<br />
Coatings for glass, tools<br />
and optics<br />
Report of the Management Board | Business Review: Advanced Materials Division 25
26 Report of the Management Board | Engineering Systems Division<br />
Engineering Systems Division<br />
<strong>Vacuum</strong> Heat Treatment<br />
C<br />
Si<br />
Ni<br />
Cr<br />
V<br />
Ti<br />
Ta<br />
Sc<br />
Li<br />
Sr<br />
Zr<br />
Fe<br />
Cu Zn<br />
Sn<br />
B<br />
Al<br />
Ce<br />
U<br />
Mn<br />
Mo<br />
Nb<br />
Sb<br />
12.0<br />
52.0<br />
50.9<br />
47.9<br />
45.0<br />
6.9<br />
87.6 91.2<br />
55.9<br />
118.7<br />
10.8<br />
140.1<br />
238.0<br />
54.9<br />
95.9<br />
92.9 121.8<br />
28.1<br />
27.0<br />
58.7 65.4<br />
63.5<br />
181.0<br />
52.0<br />
50.9<br />
47.9<br />
91.2<br />
238.0<br />
95.9<br />
92.9<br />
MOLYBDENUM<br />
ZIRCONIUM<br />
LITHIUM<br />
MANGANESE<br />
NICKEL<br />
CARBON<br />
SILICON<br />
URANIUM<br />
SCANDIUM TITANIUM VANADIUM CHROMIUM IRON<br />
NIOBIUM<br />
COPPER<br />
TIN<br />
ALUMINUM<br />
BORON<br />
ZINC<br />
ANTIMONY<br />
TANTALUM<br />
STRONTIUM<br />
CERIUM<br />
H<br />
1.0<br />
HYDROGEN<br />
Be<br />
9.0<br />
BERYLLIUM<br />
Na<br />
23.0<br />
SODIUM<br />
Mg<br />
24.3<br />
MAGNESIUM<br />
K<br />
39.1<br />
POTASSIUM<br />
Ca<br />
40.1<br />
CALCIUM<br />
Co<br />
58.9<br />
COBALT<br />
Ga<br />
69.7<br />
GALLIUM<br />
Ge<br />
72.6<br />
GERMANIUM<br />
As<br />
74.9<br />
ARSENIC<br />
Se<br />
79.0<br />
SELENIUM<br />
Br<br />
79.9<br />
BROMINE<br />
Kr<br />
83.8<br />
KRYPTON<br />
P<br />
31.0<br />
PHOSPHORUS<br />
S<br />
32.1<br />
SULFUR<br />
Cl<br />
35.5<br />
CHLORINE<br />
Ar<br />
40.0<br />
ARGON<br />
N<br />
14.0<br />
NITROGEN<br />
O<br />
16.0<br />
OXYGEN<br />
F<br />
19.0<br />
FLORINE<br />
Ne<br />
20.2<br />
NEON<br />
He<br />
4.0<br />
HELIUM<br />
Te<br />
127.6<br />
TELLURIUM<br />
I<br />
126.9<br />
IODINE<br />
Xe<br />
131.3<br />
XENON<br />
Ag<br />
107.9<br />
SILVER<br />
Cd<br />
112.4<br />
CADMIUM<br />
In<br />
114.8<br />
INDIUM<br />
Ru<br />
101.0<br />
RUTHENIUM<br />
Rh<br />
102.9<br />
RHODIUM<br />
Pd<br />
106.4<br />
PALLADIUM<br />
Tc<br />
99<br />
TECHNETIUM<br />
Y<br />
88.9<br />
YITRIUM<br />
Rb<br />
85.5<br />
RUBIDIUM<br />
Po<br />
210.0<br />
POLONIUM<br />
At<br />
210.0<br />
ASTATINE<br />
Rn<br />
222.0<br />
RADON<br />
Au<br />
197.0<br />
GOLD<br />
Hg<br />
200.6<br />
MERCURY<br />
Tl<br />
204.4<br />
THALLIUM<br />
Os<br />
190.2<br />
OSMIUM<br />
Ir<br />
192.2<br />
IRIDIUM<br />
Pt<br />
195.1<br />
PLATINUM<br />
Re<br />
186.2<br />
RHENIUM<br />
57-71<br />
Cs<br />
132.9<br />
CAESIUM<br />
Hf<br />
178.5<br />
HAFNIUM<br />
Ba<br />
137.4<br />
BARIUM<br />
W<br />
183.9<br />
TUNGSTEN<br />
Pb<br />
207.2<br />
LEAD<br />
Bi<br />
209.0<br />
BISMUTH<br />
Uuh<br />
292<br />
UNUNHEXIUM<br />
Rg<br />
272<br />
ROENTGENIUM<br />
277<br />
UNUNBIUM<br />
Uut<br />
284<br />
UNUNTRIUM<br />
Hs<br />
265<br />
HASSIUM<br />
Mt<br />
266<br />
MEITNERIUM<br />
Ds<br />
269<br />
DARMSTADTIUM<br />
Bh<br />
264<br />
BOHRIUM<br />
89-103<br />
Fr<br />
223.0<br />
FRANCIUM<br />
Rf<br />
88.9<br />
RUTHERFORDLIUM<br />
Ra<br />
226.0<br />
RADIUM<br />
Sg<br />
263<br />
SEABORGIUM<br />
Uuq<br />
289<br />
UNUNQUADIUM<br />
Uup<br />
288<br />
UNUNPENTIUM<br />
Db<br />
262<br />
DUBNIUM<br />
Tm<br />
168.9<br />
THALLIUM<br />
Yb<br />
173.0<br />
YTTERBIUM<br />
Lu<br />
175.0<br />
LUTETIUM<br />
Gd<br />
157.3<br />
GADOLINIUM<br />
Tb<br />
158.9<br />
TERBIUM<br />
Dy<br />
162.5<br />
DYSPROSIUM<br />
Pm<br />
147.0<br />
PROMETHIUM<br />
Sm<br />
150.4<br />
SAMARIUM<br />
Eu<br />
152.0<br />
EUROPIUM<br />
Nd<br />
144.2<br />
NEODYMIUM<br />
La<br />
138.9<br />
LANTHANUM<br />
Pr<br />
140.9<br />
PRASEODYMIUM<br />
Ho<br />
164.9<br />
HOLMIUM<br />
Er<br />
167.3<br />
ERBIUM<br />
Lr<br />
257.0<br />
LAWRENCIUM<br />
No<br />
254.0<br />
NOBELIUM<br />
Md<br />
256.0<br />
MENDELEVIUM<br />
Cm<br />
247.0<br />
CURIUM<br />
Cf<br />
251.0<br />
CALIFORNIUM<br />
Np<br />
237.0<br />
NEPTUNIUM<br />
Pu<br />
242.0<br />
PLUTONIUM<br />
Am<br />
243.0<br />
AMERICIUM<br />
Ac<br />
132.9<br />
ACTINIUM<br />
Pa<br />
231.0<br />
PROTACTINIUM<br />
Es<br />
254.0<br />
EINSTEINIUM<br />
Fm<br />
253.0<br />
FERMIUM<br />
Th<br />
232.0<br />
THORIUM<br />
Bk<br />
247.0<br />
BERKELIUM<br />
Related Elements
Although the market environment for the<br />
Engineering Systems Division remained<br />
volatile in 2010, the division generated<br />
EBITDA of $37.5 million, 15% of revenue.<br />
The division’s late cyclical markets have begun to recover from depressed levels<br />
of activity that existed from 2009 through mid-year 2010. The division typically<br />
follows economic and market trends by a twelve month time lag due to the long<br />
lead time for investment decisions for its complex furnace systems. By the end<br />
of 2010, requests for quotation returned to pre-crisis levels resulting in a yearover-year<br />
order intake increase of 53% from 2009 to $280.8 million in 2010. This<br />
very positive development is also reflected by the growth in order backlog by<br />
13% from $162.0 million to $183.3 million. This strong year end development<br />
indicates a positive development for 2011 and beyond.<br />
Low levels of order intake in 2009 and early 2010 lead to a 23% decline in 2010<br />
revenue to $245.6 million. EBITDA was 15% of revenue or $37.5 million. As a<br />
result of increased competition especially in the Asian markets, gross margins<br />
declined to $70.1 million or 29% of revenue from 33% of revenue in 2009.<br />
Rigorous cost reduction measures and improved efficiency helped to reduce<br />
SG&A by 20% from $58.1 million to $46.6 million, in line with our declining<br />
sales volume. In a truly difficult stage of the business cycle our return on<br />
capital employed was still strong at 52%. The division proved its ability to adapt<br />
to changing market conditions and end market demand through its diverse<br />
portfolio and considers itself well positioned to benefit from growing demand in<br />
virtually all markets served.<br />
Accomplishments<br />
Acquired interest in an experienced<br />
vacuum technologies<br />
company in Mumbai, India<br />
Acquired equity interest in<br />
nuclear furnace specialist<br />
Thermique Industrie Vide,<br />
Grenoble, France<br />
Acquired innovative Mono 2<br />
solar technology and launch of<br />
the next generation of DSS<br />
solar furnaces<br />
Developed of Single Piece Flow<br />
Technology for integrated heat<br />
treatment processes<br />
Operations<br />
In 2010 the Engineering Systems Division focused on improving operations<br />
and entering new geographic markets. In particular, the division expanded the<br />
internally manufactured products beyond the solar DSS furnaces. In order to<br />
better respond to market demands and lead time requirements, we accelerated<br />
our insourcing activities, which will help reduce costs beginning in 2011. The<br />
other benefit of this process is an increase in product portfolio that will help to<br />
ensure an optimal capacity to achieve economies of scale and shorten delivery<br />
lead times and lead to improved profitability.<br />
Engineering Systems<br />
320.5<br />
245.6<br />
105.8<br />
70.1<br />
62.9<br />
37.5<br />
09 10<br />
Revenue<br />
09 10<br />
Gross Profit<br />
09 10<br />
EBITDA<br />
Report of the Management Board | Engineering Systems Division 27
The market prospects have improved substantially over the past twelve<br />
months. The division exited 2010 with an order backlog substantially<br />
higher than at the end of 2009. The improved 2010 order backlog and<br />
a positive book to bill ratio of 1.14x reinforce the positive developments<br />
in the market. Demand is expected to grow moderately in 2011.<br />
The Engineering Systems Division acquired an initial 30% stake in Dynatech Furnaces (Mumbai)<br />
Private Ltd, a provider of heat treatment furnaces, in order to gain entry into the Indian market.<br />
ESD will increase its ownership in Dynatech to 100% by 2015. The Dynatech investment, a key<br />
part of the division’s long term strategy, will enable the Engineering Systems Division to serve<br />
fast growing markets in India such as tool-steel, automotive, aerospace and nuclear industry. The<br />
division will also utilize Dynatech’s cost competitive production resources to produce certain heat<br />
treatment furnaces as well as provide local engineering and service support, which is a key factor<br />
for the Indian market.<br />
End Markets<br />
ESD’s principle products and services include vacuum furnace systems and operating facilities<br />
providing vacuum furnace services for the treatment of sophisticated industrial materials. The<br />
unit designs, engineers and produces vacuum furnace systems for metallurgical applications including<br />
melting high purity and sophisticated metals and alloys, heat treatment and high pressure<br />
gas quenching, precisions casting, turbine blade coating and sintering applications. The majority<br />
of products produced by these systems are the basis for critical components used in aerospace,<br />
electronics, energy, specialty metal and chemical applications. We use management estimates<br />
and consistent assumptions for the following remarks on segmental end markets.<br />
The division achieved its best quarterly order intake in two years during the fourth quarter<br />
2010. The division generated a 1.59x book to bill ratio and saw improved activity in all of its end<br />
markets. As in 2009, Asia was the most important market with 45% of order intake. Order intake<br />
in Asia was dominated by China, with a particular emphasis on vacuum furnaces used in the<br />
solar, specialty steel and titanium industries. North America and Europe accounted for the balance<br />
of the order intake with 27% and 28%, respectively. In the North American market, nuclear<br />
systems and the Own & Operate facilities were the most significant contributors. Order intake in<br />
Europe was dominated by the specialty steel, superalloys and aerospace industries.<br />
Energy<br />
Solar and Power Generation<br />
ESD produces a variety of vacuum furnaces for specialty steels and super alloys widely used for<br />
power generation. Sales of DSS furnaces accounted for 33% of revenue down from 54% in 2009.<br />
Order intake for solar increased by 98% to $81.1 million in 2010. Demand for solar furnaces increased<br />
by the end of the year, however, is still considered volatile since Chinese imitators have<br />
begun to enter the market. In order to protect the market share, the division developed the next<br />
generation of DSS furnace, the SCU600plus which has over 30% lower operating costs per ingot<br />
produced. The SCU600plus is currently in final testing for commercialization roll out in 2011.<br />
AMG acquired intellectual property and manufacturing assets related to Mono 2 solar casting<br />
technology from BP Solar International Inc. This proprietary technology is used to produce high<br />
efficiency monocrystalline silicon ingots in standard SCU furnaces using a variety of feedstock,<br />
including poly silicon and upgraded metallurgical silicon. This new process will offer a unique<br />
28 Report of the Management Board | Engineering Systems Division
Regional<br />
Breakdown<br />
$1.4M South America<br />
$37.1M North America<br />
$81.3M Europe<br />
$125.8M Asia<br />
$0M ROW<br />
value proposition to ESD’s market and improve the efficiency of alternative feedstock<br />
as an important contribution to achieving grid parity. Mono 2 is expected to<br />
increase the efficiency of cells produced from <strong>ALD</strong>’s SCU systems to above 17%<br />
at a competitive cost.<br />
Nuclear<br />
In 2010, ESD generated an increase of 100% over 2009 in nuclear order intake,<br />
albeit from low levels. In addition to the recycling of weapon grade plutonium<br />
on behalf of the United States Department of Energy in the Shaw AREWA MOX<br />
project, attractive new business was generated in the field of annealing of tubes<br />
for this segment. The division continues to develop Impermeable Graphite Matrix<br />
(“IGM”) technology in cooperation with European governmental agencies. Field<br />
testing of the IGM product and processes are expected to accelerate in 2011.<br />
Aerospace<br />
ESD is the world’s leading provider of vacuum furnaces used to produce high<br />
purity titanium and superalloys for the aerospace industry. Demand for these<br />
products increased in 2010 as the global markets began to rebound and commercial<br />
aerospace demand returned to pre-crisis levels. China, in particular,<br />
saw significant demand for high purity stainless steel and titanium vacuum<br />
systems. As the demand for more fuel-efficient aircraft continues to increase,<br />
ESD’s vacuum furnaces are well positioned to serve this market.<br />
Transportation<br />
ESD provides vacuum case hardening and heat treatment and other services<br />
through Own & Operate facilities in Germany, the United States and Mexico.<br />
These facilities utilize ESD’s proprietary vacuum heat treatment furnaces to<br />
provide tolling services to the transportation and aerospace industry. The division<br />
was able to overcome a difficult financial situation in the transportation market<br />
and grow its revenue by 55% in 2010 to $28.2 million. After years of development<br />
and expansion of the Own & Operate facilities, gross margins achieved are now<br />
fulfilling the expectations. The launch of new products and services in this segment<br />
should continue to improve margins and increase the positive contribution<br />
of the Own and Operate facilities.<br />
End Market Uses<br />
/// ENERGY<br />
Solar vacuum furnaces<br />
<strong>Vacuum</strong> furnaces used to<br />
produce nuclear fuels<br />
<strong>Vacuum</strong> melting and precision<br />
casting systems for industrial<br />
gas turbines<br />
/// AEROSPACE<br />
<strong>Vacuum</strong> furnaces for titanium<br />
Electron beam coating systems<br />
for aerospace turbines<br />
/// INFRASTRUCTURE<br />
<strong>Vacuum</strong> furnaces for<br />
specialty steel<br />
/// SPECIALTY METALS & CHEMICALS<br />
<strong>Vacuum</strong> systems for high<br />
performance materials<br />
Outlook/Strategic Update<br />
Although investment funding is still be dependent on global credit markets,<br />
increased demand from all segments and especially in countries like China and<br />
India provides a solid base for 2011. Innovation and expansion in the solar field<br />
will contribute to ESD’s improved performance in 2011 and beyond. The Engineering<br />
Systems Division remains well positioned for long term growth, predominantly<br />
based upon organic growth.<br />
Report of the Management Board | Engineering Systems Division 29
30 Report of the Management Board | Publicly Listed Investments<br />
Publicly Listed Investments<br />
Natural Graphite used in a crucible<br />
12.0<br />
52.0<br />
50.9<br />
47.9<br />
45.0<br />
6.9<br />
87.6 91.2<br />
55.9<br />
118.7<br />
10.8<br />
140.1<br />
54.9<br />
95.9<br />
92.9 121.8<br />
28.1<br />
27.0<br />
58.7 65.4<br />
63.5<br />
181.0<br />
45.0<br />
238.0<br />
C<br />
Si<br />
28.1<br />
CARBON<br />
SILICON<br />
12.0<br />
MOLYBDENUM<br />
ZIRCONIUM<br />
LITHIUM<br />
MANGANESE<br />
NICKEL<br />
CARBON<br />
SILICON<br />
URANIUM<br />
SCANDIUM TITANIUM VANADIUM CHROMIUM IRON<br />
NIOBIUM<br />
COPPER<br />
TIN<br />
ALUMINUM<br />
BORON<br />
ZINC<br />
ANTIMONY<br />
TANTALUM<br />
STRONTIUM<br />
CERIUM<br />
H<br />
1.0<br />
HYDROGEN<br />
Be<br />
9.0<br />
BERYLLIUM<br />
Na<br />
23.0<br />
SODIUM<br />
Mg<br />
24.3<br />
MAGNESIUM<br />
K<br />
39.1<br />
POTASSIUM<br />
Ca<br />
40.1<br />
CALCIUM<br />
Co<br />
58.9<br />
COBALT<br />
Ga<br />
69.7<br />
GALLIUM<br />
Ge<br />
72.6<br />
GERMANIUM<br />
As<br />
74.9<br />
ARSENIC<br />
Se<br />
79.0<br />
SELENIUM<br />
Br<br />
79.9<br />
BROMINE<br />
Kr<br />
83.8<br />
KRYPTON<br />
P<br />
31.0<br />
PHOSPHORUS<br />
S<br />
32.1<br />
SULFUR<br />
Cl<br />
35.5<br />
CHLORINE<br />
Ar<br />
40.0<br />
ARGON<br />
N<br />
14.0<br />
NITROGEN<br />
O<br />
16.0<br />
OXYGEN<br />
F<br />
19.0<br />
FLORINE<br />
Ne<br />
20.2<br />
NEON<br />
He<br />
4.0<br />
HELIUM<br />
Te<br />
127.6<br />
TELLURIUM<br />
I<br />
126.9<br />
IODINE<br />
Xe<br />
131.3<br />
XENON<br />
Ag<br />
107.9<br />
SILVER<br />
Cd<br />
112.4<br />
CADMIUM<br />
In<br />
114.8<br />
INDIUM<br />
Ru<br />
101.0<br />
RUTHENIUM<br />
Rh<br />
102.9<br />
RHODIUM<br />
Pd<br />
106.4<br />
PALLADIUM<br />
Tc<br />
99<br />
TECHNETIUM<br />
Y<br />
88.9<br />
YITRIUM<br />
Rb<br />
85.5<br />
RUBIDIUM<br />
Po<br />
210.0<br />
POLONIUM<br />
At<br />
210.0<br />
ASTATINE<br />
Rn<br />
222.0<br />
RADON<br />
Au<br />
197.0<br />
GOLD<br />
Hg<br />
200.6<br />
MERCURY<br />
Tl<br />
204.4<br />
THALLIUM<br />
Os<br />
190.2<br />
OSMIUM<br />
Ir<br />
192.2<br />
IRIDIUM<br />
Pt<br />
195.1<br />
PLATINUM<br />
Re<br />
186.2<br />
RHENIUM<br />
57-71<br />
Cs<br />
132.9<br />
CAESIUM<br />
Hf<br />
178.5<br />
HAFNIUM<br />
Ba<br />
137.4<br />
BARIUM<br />
W<br />
183.9<br />
TUNGSTEN<br />
Pb<br />
207.2<br />
LEAD<br />
Bi<br />
209.0<br />
BISMUTH<br />
Uuh<br />
292<br />
UNUNHEXIUM<br />
Rg<br />
272<br />
ROENTGENIUM<br />
277<br />
UNUNBIUM<br />
Uut<br />
284<br />
UNUNTRIUM<br />
Hs<br />
265<br />
HASSIUM<br />
Mt<br />
266<br />
MEITNERIUM<br />
Ds<br />
269<br />
DARMSTADTIUM<br />
Bh<br />
264<br />
BOHRIUM<br />
89-103<br />
Fr<br />
223.0<br />
FRANCIUM<br />
Rf<br />
88.9<br />
RUTHERFORDLIUM<br />
Ra<br />
226.0<br />
RADIUM<br />
Sg<br />
263<br />
SEABORGIUM<br />
Uuq<br />
289<br />
UNUNQUADIUM<br />
Uup<br />
288<br />
UNUNPENTIUM<br />
Db<br />
262<br />
DUBNIUM<br />
Tm<br />
168.9<br />
THALLIUM<br />
Yb<br />
173.0<br />
YTTERBIUM<br />
Lu<br />
175.0<br />
LUTETIUM<br />
Gd<br />
157.3<br />
GADOLINIUM<br />
Tb<br />
158.9<br />
TERBIUM<br />
Dy<br />
162.5<br />
DYSPROSIUM<br />
Pm<br />
147.0<br />
PROMETHIUM<br />
Sm<br />
150.4<br />
SAMARIUM<br />
Eu<br />
152.0<br />
EUROPIUM<br />
Nd<br />
144.2<br />
NEODYMIUM<br />
La<br />
138.9<br />
LANTHANUM<br />
Pr<br />
140.9<br />
PRASEODYMIUM<br />
Ho<br />
164.9<br />
HOLMIUM<br />
Er<br />
167.3<br />
ERBIUM<br />
Lr<br />
257.0<br />
LAWRENCIUM<br />
No<br />
254.0<br />
NOBELIUM<br />
Md<br />
256.0<br />
MENDELEVIUM<br />
Cm<br />
247.0<br />
CURIUM<br />
Cf<br />
251.0<br />
CALIFORNIUM<br />
Np<br />
237.0<br />
NEPTUNIUM<br />
Pu<br />
242.0<br />
PLUTONIUM<br />
Am<br />
243.0<br />
AMERICIUM<br />
Ac<br />
132.9<br />
ACTINIUM<br />
Pa<br />
231.0<br />
PROTACTINIUM<br />
Es<br />
254.0<br />
EINSTEINIUM<br />
Fm<br />
253.0<br />
FERMIUM<br />
Th<br />
232.0<br />
THORIUM<br />
Bk<br />
247.0<br />
BERKELIUM<br />
Ni<br />
Cr<br />
V<br />
Ti<br />
Ta<br />
Sc<br />
Li<br />
Sr<br />
Zr<br />
Fe<br />
Cu Zn<br />
Sn<br />
B<br />
Al<br />
Ce<br />
U<br />
Mn<br />
Mo<br />
Nb<br />
Sb<br />
Related Elements
Regional<br />
Breakdown<br />
$116.9M Europe<br />
$6.1M Asia<br />
$3.5M ROW<br />
$1.8M North America<br />
$0.3M South America<br />
Graphit Kropfmühl<br />
Graphit Kropfmühl (“GK”) is a majority controlled, publicly listed (Deutsche<br />
Börse: GKR.DE) specialist in the production of silicon metal and the extraction,<br />
processing and refining of natural crystalline graphite for a wide range of energy<br />
saving industrial applications. GK's revenue and EBITDA increased during 2010<br />
as global markets for silicon metal and natural graphite improved. GK’s 2010<br />
revenue increased by 9%, from 2009, to $128.6 million in 2010. GK generated<br />
$7.6 million in EBITDA during 2010, an increase of 21% from 2009.<br />
Silicon Metal<br />
GK produces 30,000 metric tons of metallurgical grade silicon metal and a<br />
byproduct of amorphous silicon dioxide from its facility in Germany. GK’s silicon<br />
metal products are used in the solar, chemical and aluminum industries. In<br />
2010, GK generated $84.4 million in revenue from silicon products. Demand<br />
increased across all end markets during the year.<br />
Natural Graphite<br />
GK’s graphite division extracts and refines natural graphite into high quality<br />
graphite with purities up to 99.99% carbon. GK’s high purity natural graphite<br />
products are used in the infrastructure industry for their heat resistance and in<br />
the chemical and transportation industries for their electrical conductivity. In<br />
2010 GK generated $44.2 million in revenue from natural graphite.<br />
Share Ownership<br />
During 2010, AMG acquired an additional 8.5% of GK’s common shares from a<br />
block of institutional investors in exchange for 2.1% of AMG’s common shares. The<br />
acquisition of the GK shares raised AMG’s ownership in GK to 88.0% as of December<br />
2010 and it is consistent with AMG’s goal to simplify its corporate structure.<br />
Outlook<br />
Graphit Kropfmühl expects strengthening demand for natural graphite and<br />
improved pricing for both natural graphite and silicon metal to result in revenue<br />
growth in 2011 as the global recovery for industrial specialty metals and<br />
chemicals continues.<br />
Graphit Kropfmühl<br />
117.8<br />
128.6<br />
11.9<br />
13.7<br />
6.3<br />
7.6<br />
09 10<br />
Revenue<br />
09 10<br />
Gross Profit<br />
09 10<br />
EBITDA<br />
Report of the Management Board | Publicly Listed Investments 31
Timminco Limited<br />
Timminco produces metallurgical grade silicon for the chemical, aluminum,<br />
electronic and solar industries. During 2010, Timminco sold 49% of its<br />
silicon metal operation to Dow Corning for $40.1 million in cash and up to an<br />
additional $10.0 million based upon achieving certain performance objectives<br />
relating to production cost and capacity improvements. Timminco used the<br />
proceeds of this transaction to repay all of its senior bank debt and for other<br />
general corporate purposes.<br />
AMG owned 42.5% of Timminco’s equity as of December 31, 2010. AMG accounts<br />
for its investment in Timminco via the IFRS equity accounting method.<br />
Timminco’s loss for 2010 is included in share of loss from associates on AMG’s<br />
income statement. The carrying value of AMG’s investment in Timminco of<br />
$17.7 million is listed as an asset on AMG’s balance sheet.<br />
Timminco is a publicly listed company (TSX: TIM) with headquarters in Toronto,<br />
Canada. More information about Timminco’s business operations and 2010<br />
results can be found in Timminco’s 2010 Annual Report and on their website<br />
(www.Timminco.com).<br />
32 Report of the Management Board | Publicly Listed Investments
Risk Management and Internal Controls<br />
Risk Management Approach<br />
AMG employs a traditional risk management approach,<br />
including a ‘top-down’ and ‘bottom-up’ analysis and assessment<br />
of the Company’s risks. Appropriate and diverse<br />
lines of property and liability insurance coverage are also<br />
an integral part of this risk management program. AMG<br />
has implemented a comprehensive risk management<br />
program centered on the Company’s Risk Assessment<br />
Package (“RAP”). The RAP is a detailed document requiring<br />
each business unit to:<br />
(i) identify potential risks and quantify the impact of<br />
such risks;<br />
(ii) prioritize the risks using a ranking system to determine<br />
the impact, likelihood and suddenness of<br />
occurrence;<br />
(iii) describe the risk mitigation or transfer procedures in<br />
place; and<br />
(iv) document the periodic monitoring of the risks.<br />
Each business unit undertakes a full review of its RAP on<br />
a quarterly basis. The RAPs are then reviewed in detail<br />
by AMG’s Risk Manager in coordination with the operating<br />
managers of the business units. Key risks from all<br />
business units are then summarized and presented to the<br />
Management Board. Individual risks of special note are<br />
discussed at the Management Board’s bi-weekly meeting.<br />
The Management Board has the responsibility to inform<br />
the Supervisory Board of the most significant risk exposures<br />
and the related risk management plans in place.<br />
The Audit Committee of the Supervisory Board carries out<br />
a semi-annual review of the Company’s internal control<br />
and risk management program. As in previous years,<br />
AMG’s Management Board and operating managers of<br />
business units evaluated the Company’s risk management<br />
activities during 2010. As was the case in 2009, the<br />
Company’s Internal Audit Director was in place for the full<br />
calendar year 2010. During 2010, special attention was<br />
given to:<br />
(i) refinancing the credit facility;<br />
(ii) credit facility amendments;<br />
(iii) liquidity management;<br />
(iv) Code of Conduct education, including a training<br />
course in General Antitrust Principles and Practices<br />
for select employees; and<br />
(v) Information Technology improvements.<br />
Risks<br />
Risks faced by AMG can broadly be categorized as:<br />
• Strategic: includes risks related to marketing and sales<br />
strategy, product innovation, technology innovation,<br />
overall raw material sourcing decisions, capacity decisions<br />
and acquisitions<br />
• Operational: includes risks related to executing the<br />
strategic direction, supply of raw materials, production,<br />
maintenance of production equipment, distribution of<br />
products, labor relations, human resources, IT infrastructure,<br />
health, safety and environmental, and sales<br />
and marketing<br />
• Market and External: includes risks related to global<br />
and regional economic conditions, market supply/<br />
demand characteristics, metal prices, product substitution,<br />
customer and competitor actions and community<br />
relations<br />
• Financial: includes risks related to accuracy and<br />
timeliness of financial reporting, compliance with<br />
IFRS accounting standards, compliance with AFM and<br />
Euronext Amsterdam requirements, compliance with<br />
credit facility covenants, currency fluctuations, liquidity,<br />
refinancing, budgeting, metal price and currency hedging,<br />
treasury and tax functions<br />
• Legal and Regulatory: includes risks related to the<br />
political, environmental, legislative, and corporate<br />
governance environment<br />
AMG, like most industrial companies, faces a combination<br />
of risks. The largest risks faced by the Company evolve<br />
throughout each calendar year and cannot be viewed as<br />
static challenges. It is not the intention to detail each risk<br />
posed to AMG in this report, but the most pertinent risks<br />
to the business are described below in no particular order.<br />
Report of the Management Board | Risk Management and Internal Controls 33
Customer Risk<br />
The tightening of global credit markets has exposed AMG<br />
to an increased risk of customer default and non-payment<br />
of accounts receivable. The relative lack of available<br />
financing options can cause rapid deterioration of a<br />
customer’s ability to fulfill payment obligations. Larger<br />
customer concentrations in particular business units<br />
exacerbate the importance of monitoring customer risk.<br />
AMG has insured its accounts receivable where economically<br />
feasible and has set credit limits on its customers,<br />
which are closely tracked. In addition to constant monitoring<br />
from business unit leaders, AMG’s Management Board<br />
reviews accounts receivable balances on a regular basis.<br />
As a result of the collection of prepayments from most of<br />
its customers, the Engineering Systems Division mitigates<br />
a portion of customer payment and performance risk.<br />
Metal Price Volatility Risk<br />
AMG is exposed to risk in the prices of certain metals.<br />
Risk can arise from changes in price between purchase,<br />
process and sale of the metals or from end-price risk for<br />
metals when raw materials are purchased under fixed<br />
price contracts. Most metals, alloys, and chemicals that<br />
AMG processes and sells, such as chromium, tantalum,<br />
graphite, ferrotitanium and antimony trioxide, cannot<br />
be hedged on an exchange. To mitigate price risk for<br />
these materials, AMG seeks to enter into complementary<br />
raw material supply agreements and sales agreements<br />
whereby the price is determined by the same index. AMG<br />
also attempts to time its raw material purchases with<br />
sales orders from customers. Further mitigation comes<br />
from establishing low-cost long positions in key raw<br />
materials through, for example, ownership positions in<br />
mining activities (antimony, tantalum, niobium, graphite,<br />
quartz), through structured long-term supply contracts<br />
(in ferrovanadium and ferronickel-molybdenum), or<br />
long-term fixed price sales contracts. During 2010, AMG<br />
purchased antimony mining rights in Turkey to secure<br />
supply of antimony metal used in AMG’s antimony trioxide<br />
production operation for the specialty chemical flame<br />
retardant market. AMG also expanded its tantalum and<br />
niobium mine in Brazil during 2010. Despite the mitigation<br />
strategies related to mine ownership, supply contracts,<br />
and sales contracts, AMG retains some exposure to price<br />
volatility. Success of the mitigation plans is dependent on<br />
the severity of metal price volatility and counterparties<br />
performing under their contracts. The Company hedges<br />
exchange-traded metals, such as aluminum, when possible.<br />
In its aluminum business, AMG also sells conversion<br />
services with no metal price risk.<br />
Supply Risk<br />
AMG’s Advanced Materials Division is dependent on supplies<br />
of metals and metal containing raw materials for the<br />
production of its products. Some of these raw materials<br />
are available from only a few sources or a few countries,<br />
including countries that have some amount of political risk.<br />
In order to mitigate the risk of supplies becoming difficult<br />
to source, AMG enters into longer-term contracts with<br />
its suppliers when practical. AMG’s Engineering Systems<br />
Division is dependent on a limited number of suppliers for<br />
many of the components of its vacuum furnace systems as<br />
a result of its stringent quality requirements. To mitigate<br />
this risk, the Engineering Systems Division has insourced<br />
the production of its DSS furnaces for the solar industry<br />
to a production facility in Berlin, Germany. If availability of<br />
AMG’s supplies or components is limited, the Company can<br />
suffer from reduced capacity utilization. This could result in<br />
fewer economies of scale and higher per unit costs. If AMG<br />
is not able to pass on its increased costs, financial results<br />
could be negatively impacted.<br />
Financing Risk<br />
A prolonged restriction on AMG’s ability to access the<br />
capital markets and additional financing may negatively<br />
affect AMG’s ability to fund future innovations and capital<br />
projects. The Company’s bank facility matures in August<br />
2012 and AMG does not currently have liquidity on hand<br />
to repay this facility without a further debt or equity raise.<br />
As of December 31, 2010, AMG’s Senior Leverage as<br />
calculated by its credit facility was 2.12x, compared to<br />
a covenant maximum of 3.00x. In order to preserve the<br />
Company’s financial flexibility and ability to take advantage<br />
of market opportunities, AMG reached an agreement<br />
to amend its credit facility in March 2010 to increase its<br />
34 Report of the Management Board | Risk Management and Internal Controls
Senior Leverage covenant to 3.00x. The Total Leverage<br />
covenant remained unchanged at 3.75x. AMG’s financing<br />
risk is also mitigated by its year-end 2010 liquidity of<br />
$137.1 million.<br />
Entrepreneurial Risk<br />
The continued growth of AMG’s business requires the<br />
development of new products and new production<br />
processes and highly capable management. Developing<br />
and investing in these products and processes involves<br />
the acceptance of certain measured entrepreneurial<br />
risks. As competitors duplicate successful technologies<br />
or develop new methodologies, AMG must continue to<br />
innovate in order to maintain leading positions in its<br />
strategic niches. It is particularly important to strike an<br />
appropriate balance between investments in innovation<br />
to secure future growth versus the need to preserve cash<br />
to withstand an economic crisis. For this reason, AMG<br />
management evaluates more than the projected internal<br />
rate of return or the discounted cash flows of a potential<br />
project. AMG also examines the consequences of declining<br />
projects and the possibility of lost cash flows from the<br />
inability to innovate. In addition to looking at the inherent<br />
risk on a project-by-project basis, AMG also evaluates<br />
the risk of a portfolio of projects being undertaken or<br />
developed in the pipeline. Evaluating a project within a<br />
portfolio of opportunities allows AMG to better manage<br />
its liquidity and capital allocation. While certain projects<br />
may be beneficial and profitable in the long run, timing of<br />
cash flows is critically important as AMG always seeks to<br />
maintain sufficient liquidity to operate its existing businesses.<br />
Managing entrepreneurial risk requires active<br />
management. Frequent Management Board meetings<br />
enable the senior executives of AMG to stay informed<br />
of all the latest information, allowing for quick action,<br />
further reducing risk. During 2010 AMG acquired Mono 2<br />
solar casting technology from BP Solar International Inc.,<br />
allowing AMG’s Engineering Systems Division to offer<br />
an advanced integrated solar melting and crystallization<br />
technology. Acquisitions of new technology such as this<br />
will help AMG avoid entrepreneurial risk. AMG’s highly<br />
educated and skilled workforce contributes greatly to<br />
AMG’s entrepreneurial success. High employee turnover<br />
or loss to a competitor of key personnel, many of whom<br />
possess specific technical and manufacturing knowledge,<br />
is a risk to AMG. Many incentives, financial and other, are<br />
used to maintain a motivated workforce.<br />
Currency Risk<br />
AMG’s largest currency risk exists where it incurs an<br />
imbalance in revenues and costs in a particular currency.<br />
While the single largest sensitivity of this nature exists<br />
for the Euro, risk also exists with the British Pound and<br />
Brazilian Real. AMG may enter into currency hedges to<br />
mitigate this risk. AMG also faces currency risk when it<br />
enters into a fixed price contract to sell a product in one<br />
currency while the costs incurred are in an alternate<br />
currency. AMG typically enters into currency hedges to<br />
mitigate this currency timing risk.<br />
Legal and Regulatory Risk<br />
Like all companies, AMG is exposed to the changing<br />
regulatory environment in the countries and regions<br />
where it conducts business. The most notable changes<br />
are coming in the form of environmental policy and to a<br />
lesser extent governmental restrictions on the freedom<br />
to operate in certain countries and jurisdictions. New<br />
environmental regulations or a change in regulatory bodies<br />
that have jurisdiction over AMG products and facilities<br />
could result in new restrictions, including those relating<br />
to the storage or disposal of legacy material at AMG<br />
owned properties, which may result in significantly higher<br />
costs to AMG (see note 35 to the Consolidated Financial<br />
Statements). The environmental regulations that are<br />
important for the growth in AMG’s business, however, may<br />
present operational challenges to AMG’s manufacturing<br />
processes. More stringent regulations may be enacted<br />
for the release of air emissions, wastewater discharge or<br />
solid waste, which may negatively impact AMG’s operations.<br />
Additionally, the REACH Directive became effective<br />
in the European Union in June 2007. REACH requires<br />
new operational procedures regarding the registration,<br />
evaluation and authorization of chemical substances.<br />
AMG’s business units have pre-registered all required<br />
materials and also made complete registrations for<br />
those products required in 2010 as a result of tonnage or<br />
hazardous properties. Plans are in place to meet 2013 and<br />
Report of the Management Board | Risk Management and Internal Controls 35
2018 deadlines. See note 35 to the Consolidated Financial<br />
Statements for information regarding legal matters<br />
affecting the Company. AMG has continuing obligations<br />
to comply with government regulations and practices<br />
concerning corporate organization and corporate governance.<br />
For example, in addressing possible conflicts<br />
of interest affecting its Management or Supervisory<br />
Board members, AMG follows strict rules of procedure.<br />
These procedures are described in the Company’s<br />
Articles of Association and the rules of procedure of the<br />
Management Board and Supervisory Board, respectively.<br />
Also, since AMG’s product mix is increasingly dependent<br />
on scarce natural resources, governmental policies may<br />
restrict AMG’s access to key materials in certain regions<br />
or countries. Compliance with both legal and regulatory<br />
matters is monitored and augmented by the Company’s<br />
General Counsel who makes use of the services of several<br />
prominent local and global law firms.<br />
Information Technology Risk<br />
AMG is dependent on effective and reliable IT systems<br />
that are not currently fully integrated among all business<br />
units. Failure of IT systems or major loss of key data<br />
could substantially impair AMG’s financial condition and<br />
results of operations. Therefore, AMG devises and implements<br />
procedures to protect data, applications, systems,<br />
networks and physical resources. Both internal and<br />
external analyses of weaknesses, risks and threats are<br />
executed and audited to ensure that IT security measures<br />
are implemented efficiently. Special attention has been<br />
paid to logical access, change management and business<br />
continuity. Furthermore, guidance has been strengthened<br />
by distributing additional policies and procedures<br />
throughout the Company. This ongoing process should<br />
ensure that amendments and improvements (such as<br />
continued migration toward an integrated worldwide IT<br />
system) are constantly made to the IT systems.<br />
Risk Monitoring and Procedures<br />
AMG has a strategic risk function that monitors and<br />
establishes internal controls to mitigate business and<br />
financial risks. AMG’s strategic risk function is complemented<br />
by its internal audit function. As a relatively<br />
young public company, the controls and procedures in<br />
place at AMG are in a continuing state of development<br />
and may not be as sophisticated as at other public companies<br />
with much longer operating histories. Through<br />
the risk reporting system, the Risk Manager works<br />
with business unit managers to develop risk mitigation<br />
strategies, where applicable. The purpose of the risk<br />
reporting and monitoring system is to manage rather<br />
than eliminate the risk of failure to achieve business<br />
objectives, and provides only reasonable, not absolute,<br />
assurance against material misstatement or loss.<br />
Statement on Internal Control Pursuant to the<br />
Dutch Corporate Governance Code<br />
Risks related to financial reporting include timeliness,<br />
accuracy and implementation of appropriate internal<br />
controls to avoid material misstatements. During 2010,<br />
the Management Board conducted an evaluation of the<br />
structure and operation of the internal risk management<br />
and control systems. The Management Board discussed<br />
the outcome of such assessment with the Supervisory<br />
Board (in accordance with best practice provision III.I.8).<br />
AMG’s Management Board believes internal risk management<br />
and control systems in place provide a reasonable<br />
level of assurance that AMG’s financial reporting does<br />
not include material misstatements. In relation to AMG’s<br />
financial reporting, these systems operated effectively<br />
during 2010.<br />
36 Report of the Management Board | Risk Management and Internal Controls
Management Board Statement of Responsibilities<br />
The Management Board hereby declares that, to the best<br />
of its knowledge, the consolidated financial statements<br />
prepared in accordance with IFRS and Part 9, Book 2,<br />
Article 362.8 of the Netherlands Civil Code provide a true<br />
and fair view of the assets, liabilities, financial position<br />
and profit or loss of the Company and the undertakings<br />
included in the consolidation taken as a whole, and that<br />
the management report includes a fair review of the<br />
development and performance of the business of the<br />
Company and the undertakings included in the consolidation<br />
taken as a whole, together with a description of the<br />
principal opportunities and risks associated with the<br />
expected development of the Company.<br />
Management Board<br />
AMG Advanced Metallurgical Group N.V.<br />
Heinz Schimmelbusch<br />
William Levy<br />
Eric Jackson<br />
Reinhard Walter<br />
March 31, 2011<br />
Report of the Management Board | Statement of Responsibilities 37
Report of the Supervisory Board<br />
Pedro Pablo Kuczynski<br />
Chairman<br />
72<br />
Wesley Clark<br />
66<br />
Martin Hoyos<br />
63<br />
Jack L. Messman<br />
71<br />
Norbert Quinkert<br />
68<br />
Guy de Selliers<br />
58<br />
38 Report of the Supervisory Board
Male/US and Peru<br />
Date of birth: October 3, 1938<br />
Date of initial appointment: June 6, 2007<br />
Date of end of term: 2011<br />
Economist & Investment Banker<br />
Current board positions: Agualimpia NGO (Chairman), The Taiwan<br />
Greater China Fund (Chairman), Westfield Capital/First Capital<br />
Investment Bank, Ternium Inc.<br />
Former positions: Prime Minister of Peru and Chairman,<br />
First Boston International (Credit Suisse)<br />
Male/US<br />
Date of birth: December 23, 1944<br />
Date of initial appointment: June 6, 2007<br />
Date of end of term: 2013<br />
Chairman & CEO, Wesley K. Clark & Associates<br />
Current board positions: Clark Bova Group., Bankers<br />
Petroleum Ltd., Prysmian S.R.L., Rodman and Renshaw LLC<br />
(Chairman), Juhl Wind, Inc., United Global Resources, Inc.,<br />
BNK Petroleum, Inc., GBS Laboratories (Chairman), Solace<br />
Systems, Clean Terra, Inc.<br />
Former position: NATO Supreme Allied Commander, Europe<br />
Male/Austria<br />
Date of birth: October 27, 1947<br />
Date of initial appointment: May 13, 2009<br />
Date of end of term: 2013<br />
Corporate Director<br />
Current board positions: KPMG Germany AG, Prinzhorn Holding AG,<br />
CAG Holding GmbH, Curanum AG<br />
Former positions: CEO KPMG Europe, Middle East and Africa<br />
Male/US<br />
Date of birth: March 13, 1940<br />
Date of initial appointment: June 6, 2007<br />
Date of end of term: 2013<br />
Corporate Director<br />
Current board positions: Celerant Consulting, Radio Shack<br />
Corporation, Safeguard Scientifics, Inc., Telogis, Inc. (Chairman),<br />
Timminco Limited<br />
Former positions: Chief Executive Officer, Novell, Inc. and<br />
Union Pacific Resources Corporation<br />
Male/Germany<br />
Date of birth: January 18, 1943<br />
Date of initial appointment: June 6, 2007<br />
Date of end of term: 2014<br />
CEO, TSB Technology Foundation Berlin<br />
Current board positions: PFW Aerospace AG, VTION Wireless<br />
AG (Vice Chairman), WISTA Management GmbH (Chairman)<br />
Former position: Motorola (Germany, Austria, Switzerland and<br />
The Netherlands) (Chairman)<br />
Male/Belgium<br />
Date of birth: June 14, 1952<br />
Date of initial appointment: June 6, 2007<br />
Date of end of term: 2014<br />
Corporate Director<br />
President, HCF International Advisers Ltd.<br />
Current board positions: Solvay SA, Wimm-Bill-Dann Foods<br />
OJSC, Wessex Grain, Ageas Group SA (Vice Chairman), Ageas<br />
UK, Ltd. (Chairman)<br />
Former position: Robert Fleming and Co. Limited, Eastern<br />
Europe (Chairman)<br />
Report of the Supervisory Board 39
Report of the Supervisory Board<br />
Powers of the Supervisory Board<br />
The Supervisory Board oversees both the policies<br />
pursued by the Management Board and the general<br />
course of AMG’s business. It also provides advice to<br />
the Management Board. In performing its duties, the<br />
Supervisory Board is required to act in the interests of<br />
the AMG Group and its businesses as a whole. While<br />
retaining overall responsibility, it has assigned certain<br />
of its preparatory tasks to three committees: the Audit<br />
Committee, the Selection and Appointment Committee<br />
and the Remuneration Committee, each of which reports<br />
on a regular basis to the Supervisory Board. The separate<br />
reports of each of these Committees are published below.<br />
The Supervisory Board further supervises the systems<br />
and management of the internal business controls and<br />
financial reporting processes and it determines the remuneration<br />
of the individual members of the Management<br />
Board within the remuneration policy adopted by the<br />
General Meeting of Shareholders.<br />
Composition of the Supervisory Board<br />
The Supervisory Board was first established on June<br />
6, 2007, and currently consists of six members. Messrs.<br />
Pedro Pablo Kuczynski (Chairman), Jack Messman (Vice<br />
Chairman), Guy de Selliers, Norbert Quinkert, General<br />
Wesley Clark and Martin Hoyos. The Supervisory Board<br />
aims for an appropriate level of experience in technological,<br />
manufacturing, economic, social and financial<br />
aspects of international business and public administration.<br />
The composition of the Supervisory Board must be<br />
such that the combined experience, expertise and independence<br />
of its members enables the Supervisory Board<br />
to carry out its duties. All Supervisory Board members<br />
qualify as independent as defined in the Dutch Corporate<br />
Governance Code. All members of the Supervisory Board<br />
completed a questionnaire to verify compliance in 2010<br />
with the applicable corporate governance rules and<br />
the rules governing the principles and practices of the<br />
Supervisory Board.<br />
The Resignation Schedule of the Supervisory Board<br />
is as follows:<br />
Pedro Pablo Kuczynski 2011<br />
Wesley Clark 2013<br />
Jack Messman 2013<br />
Martin Hoyos 2013<br />
Norbert Quinkert 2014<br />
Guy de Selliers 2014<br />
Mr. Kuczynski will resign by rotation from the Supervisory<br />
Board at the Annual General Meeting of Shareholders on<br />
May 11, 2011. Mr. Kuzcynski is eligible for immediate reappointment<br />
for a period of four years. The Supervisory Board<br />
proposes the reappointment of Mr. Kuzcynski as member<br />
of the Supervisory Board. A nomination for his appointment<br />
will be submitted to the 2011 Annual General Meeting of<br />
Shareholders. If the general meeting of shareholders will<br />
appoint Mr. Kuzcynski as supervisory board member again,<br />
the Supervisory Board intends to designate Mr. Kuzcynski<br />
as Chairman of the Supervisory Board again.<br />
Supervisory Board Meetings<br />
The Supervisory Board held eight meetings in the course<br />
of 2010, including meetings by telephone conference.<br />
Six of these meetings were held in the presence of the<br />
Management Board. Almost all meetings were attended<br />
by all members. None of the members of the Supervisory<br />
Board was frequently absent from Supervisory Board<br />
meetings. The items discussed in the meetings included<br />
recurring subjects, such as AMG’s financial position,<br />
objectives and results, strategy, potential acquisitions,<br />
business plans of the Advanced Materials (AMD) and<br />
Engineering Systems (ESD) Divisions, capital expenditure<br />
programs, succession planning, operations review as<br />
well as regular review of the strategic objectives and<br />
initiatives of the Company and the Company’s ongoing<br />
actions in the field of Corporate Social Responsibility.<br />
Financial metrics presented to the Supervisory Board to<br />
measure the performance of AMG include net income,<br />
earnings per share, EBITDA, financial leverage (net<br />
debt to EBITDA), debt to equity, return on shareholders’<br />
equity and return on capital employed. Furthermore, the<br />
40 Report of the Supervisory Board
Supervisory Board discussed the risks of AMG’s business<br />
and the assessment by the Management Board of the<br />
structure of the internal risk management and control<br />
systems, as well as any significant changes thereto. The<br />
regularly scheduled Supervisory Board meetings also<br />
included presentations by senior managers of the business<br />
lines to give Supervisory Board members a more<br />
in-depth understanding of the businesses. In addition<br />
to the scheduled meetings, the Chairman and other<br />
members of the Supervisory Board had regular contact<br />
with the Chief Executive Officer and other members of<br />
the Management Board as well as senior executives<br />
of the Company throughout the year. On November 9,<br />
2010 the Supervisory Board (without the presence of the<br />
Management Board) met and reviewed the performance<br />
of the Management Board and its members. At this<br />
meeting, the Supervisory Board also evaluated its own<br />
functioning and that of the three committees and their<br />
members. In doing so, the Chairman of the Supervisory<br />
Board had invited each member of the Supervisory Board<br />
to provide his comments on these topics to the Chairman.<br />
The Chairman then shared the main conclusions drawn<br />
from such comments with his fellow Supervisory Board<br />
members in a plenary private session of the Supervisory<br />
Board. During that session the Supervisory Board<br />
unanimously concluded that the Supervisory Board was<br />
functioning adequately and that the Supervisory Board’s<br />
composition was well balanced in terms of competence,<br />
nationality, age and experience. During that session, the<br />
Supervisory Board also expressed its continued desire<br />
to increase its diversity in terms of gender, but also<br />
acknowledged that given the particular industries in<br />
which the Company is operating, suitable candidates with<br />
different gender may be difficult to identify and select.<br />
Remuneration Supervisory Board<br />
In its meeting of May 13, 2009, the General Meeting of<br />
Shareholders had amended the remuneration of the<br />
members of the Supervisory Board with effect from<br />
January 1, 2009. The members of the Supervisory Board<br />
receive remuneration in the form of a cash component<br />
and a share component. No loans, guarantees or the<br />
like have been granted to any of the Supervisory Board<br />
members. In 2010 no changes were made or effected with<br />
respect to the remuneration of the Supervisory Board<br />
members compared to 2009.<br />
Cash remuneration: The cash remuneration of the<br />
Supervisory Board members as determined by the<br />
General Meeting of Shareholders was set at $95,000 for<br />
the Chairman, $70,000 for the Vice Chairman and $60,000<br />
for the other members. Chairmen of the Remuneration<br />
Committee, the Audit Committee and the Selection and<br />
Appointment Committee are each paid an additional<br />
$20,000 annually.<br />
Share remuneration: The members of the Supervisory<br />
Board do not participate in any of AMG’s incentive plans.<br />
As part of their annual remuneration in 2010, the General<br />
Meeting of Shareholders authorized the issue of a number<br />
of shares for no cash consideration to each member of<br />
the Supervisory Board as part of their remuneration.<br />
The number of shares issued to each member is computed<br />
with respect to a specified amount of Euros for each<br />
member. During 2010 the specified numbers of Euros were<br />
49,400 for the Chairman, 34,200 for the Vice Chairman and<br />
30,400 for each other member. Shares issued may not be<br />
disposed of by the relevant member of the Supervisory<br />
Board until the earlier of the third anniversary of the grant<br />
or the first anniversary of the date on which he ceases to<br />
be a member of the Supervisory Board.<br />
The Dutch Corporate Governance Code requires that the<br />
remuneration of a Supervisory Board Member not be<br />
dependent on the results of the Company. Best practice<br />
provision III.7.1 states that a Supervisory Board member<br />
may not be granted any shares and/or rights to shares<br />
by way of remuneration. AMG does not comply with best<br />
practice provision III.7.1 and III.7.2 for reasons further<br />
explained below under the chapter Corporate Governance<br />
(page 57). The table below shows the total remuneration<br />
of each member of the Supervisory Board for 2010.<br />
Report of the Supervisory Board 41
The table below shows the total remuneration of each member of the Supervisory board for 2010:<br />
For the year ended<br />
December 31, 2010<br />
Role<br />
Cash<br />
remuneration<br />
Share<br />
remuneration<br />
# of shares<br />
granted<br />
Pedro Pablo Kuczynski Chairman & Member $95,000 149,400 6,935<br />
Jack L. Messman Vice Chairman & Remuneration Committee Chair $90,000 134,200 4,801<br />
Wesley Clark Member $60,000 130,400 4,268<br />
Norbert Quinkert<br />
Member & Selection and Appointment<br />
Committee Chair<br />
$80,000 130,400 4,268<br />
Guy de Selliers Member & Audit Committee Chair $80,000 130,400 4,268<br />
Martin Hoyos Member $60,000 130,400 4,268<br />
Shares Held by Members of the Supervisory Board<br />
As of December 31, 2010, the members of the Supervisory<br />
Board held a total of 109,732 shares in the Company. Out<br />
of that number, a total of 76,352 shares were awarded to<br />
them during 2007, 2008, 2009 and 2010 as part of their<br />
annual remuneration.<br />
Remuneration Supervisory Board in 2011<br />
The remuneration of the members of the Supervisory<br />
Board in 2011 will not change as compared to the remuneration<br />
given in 2010 as explained above.<br />
Committees<br />
The Supervisory Board has three standing committees,<br />
the Audit Committee, the Selection and Appointment<br />
Committee and the Remuneration Committee.<br />
Audit Committee<br />
Composition: Messrs. de Selliers (Chairman) and Messman<br />
The Audit Committee is responsible for, among other things,<br />
considering matters relating to financial controls and<br />
reporting, internal and external audits, the scope and results<br />
of audits and the independence and objectivity of auditors as<br />
well as the Company’s process for monitoring compliance<br />
with laws and regulations and its Code of Business Conduct.<br />
It does monitor and review the Company’s audit function and,<br />
with the involvement of the independent auditor, focuses<br />
on compliance with applicable legal and regulatory requirements<br />
and accounting standards.<br />
The Audit Committee met five times during the year in addition<br />
to its meetings to review and approve annual and interim<br />
financial reports and statements of the Company and<br />
reported its findings periodically to the plenary meeting of<br />
the Supervisory Board. Topics of discussion at the meetings<br />
included IT infrastructure, the Internal Audit plan, the<br />
Audit Committee Charter, an enterprise risk management<br />
system, insurance, environmental risk situation, Code<br />
of Business Conduct training program, foreign currency<br />
exposure and hedging policies, tax structuring and spending<br />
approval matrices. Ernst & Young Accountants LLP<br />
also provided the audit committee with a mid-year review<br />
and year-end audit of the Company’s accounting policies<br />
and procedures. Furthermore, the Internal Audit director<br />
of the Company maintained regular contact with the Audit<br />
Committee and the external auditors of the Company. The<br />
Audit Committee held regular meetings with the external<br />
auditors without any member of the Management Board<br />
or financial or accounting staff of the Company present<br />
and the Audit Committee reviewed the contents of the<br />
2010 Management Letter of the external accountant and<br />
reported on this matter to the plenary meeting of the<br />
Supervisory board. The Audit Committee further reviewed<br />
the proposed audit scope and fees for the external auditors<br />
of the Company and after assessment of the performance<br />
of the external auditors, it advised the Supervisory Board<br />
to propose to the General Meeting of Shareholders to<br />
re-appoint Ernst & Young Accountants LLP through the<br />
December 31, 2012 financial year. Fees were established<br />
in the amount of 1400,000 per annum, which includes the<br />
cost of the mid-year review.<br />
Present at all meetings of the Audit Committee were<br />
the Chief Financial Officer, the Corporate Controller, the<br />
Internal Audit Director and AMG’s auditors Ernst & Young<br />
Accountants LLP. At certain meetings, the Company’s<br />
General Counsel and Treasurer were present.<br />
Selection and Appointment Committee<br />
Composition: Mr. N. Quinkert (Chairman) and<br />
General W. Clark<br />
The Selection and Appointment Committee is responsible<br />
for: (i) preparing the selection criteria, appointment<br />
procedures and leading searches for candidate<br />
Management Board and Supervisory Board members;<br />
(ii) periodically evaluating the scope and composition<br />
of the Management Board and the Supervisory Board;<br />
(iii) periodically evaluating the functioning of individual<br />
members of the Management Board and the Supervisory<br />
Board; and (iv) supervising the policy of the Supervisory<br />
Board in relation to the selection and appointment<br />
criteria for senior management of the Company.<br />
42 Report of the Supervisory Board
The Selection and Appointment Committee held one<br />
regular meeting during the year 2010, in addition to various<br />
informal meetings between the committee members and<br />
contacts with the Chairman of the Management Board and<br />
other members of the Supervisory Board, and reported its<br />
findings to the Supervisory Board. Particular attention was<br />
paid in 2010 to review of succession planning, potential<br />
conflicts of interests and the performance by Management<br />
Board members given the challenging times.<br />
Remuneration Committee<br />
Composition: Messrs. J. Messman (Chairman) and<br />
P.P. Kuczynski<br />
The Remuneration Committee is responsible for establishing<br />
and reviewing material aspects of the Company’s<br />
policy on compensation of members of the Management<br />
Board and preparing decisions for the Supervisory Board<br />
in relation thereto. This responsibility includes, but is not<br />
limited to, the preparation and ongoing review of: (i) the<br />
remuneration policy as adopted by the General Meeting of<br />
Shareholders; and (ii) proposals concerning the individual<br />
remuneration of the members of the Management<br />
Board to be determined by the Supervisory Board. The<br />
Remuneration Committee held two regular meetings in<br />
2010, in addition to various informal discussions among<br />
its members. Topics of discussion at the meetings<br />
included: (i) implementation of the remuneration policy<br />
of the Company, including policies with respect to the<br />
compensation of the Management Board; (ii) review of<br />
the base salary for members of the Management Board;<br />
(iii) annual bonuses for members of the Management<br />
Board. In performing its duties and responsibilities the<br />
Remuneration Committee was assisted by external<br />
remuneration experts.<br />
Remuneration Report<br />
The year 2010 concerned the second year in which<br />
the Supervisory Board had to implement the new<br />
Remuneration Policy for the Management Board, since<br />
this was approved and adopted by the General Meeting<br />
of Shareholders in May 2009 (“the Remuneration Policy”).<br />
The Remuneration Policy is posted on the Company’s<br />
website under the heading Corporate Governance. This<br />
Remuneration Report contains the following two sections:<br />
• Report on Remuneration of the Management<br />
Board in 2010<br />
• Remuneration of the Management Board in 2011<br />
Report on Remuneration of the<br />
Management Board in 2010<br />
The remuneration of AMG’s Management Board for 2010<br />
was based on the Remuneration Policy of the Company.<br />
The Remuneration Policy was developed with a group of<br />
peer companies drawn from the Hay Group Industrial<br />
Market Database. This peer group is an important<br />
yardstick for the Supervisory Board in determining<br />
performance by the Company and setting compensation<br />
for the Company’s Management Board. In addition, it is<br />
noted that pursuant to the Remuneration Policy, it has<br />
been accepted that the Remuneration Committee would<br />
honor existing contractual agreements of the current<br />
Management Board members and therefore would<br />
continue to accept the dual employment contract system<br />
as basis for the remuneration of the Management Board<br />
members. The main terms and conditions of the employment<br />
contracts of the Management Board members are<br />
published on the Company’s website under the heading<br />
Corporate Governance.<br />
In establishing the 2010 remuneration, the Supervisory<br />
Board has considered multiple scenarios on how the<br />
remuneration components would be affected given different<br />
sets of circumstances. Where in 2009, due to the very<br />
difficult economic environment facing the Company, all of<br />
the Management Board members had agreed to reduce<br />
their Base Salary for 2009 in return for stock options, this<br />
appeared not necessary in 2010.<br />
For the year ended<br />
December 31, 2010<br />
Base<br />
Salary<br />
Annual<br />
Bonus<br />
Value of<br />
vested options<br />
“in the money”<br />
at Dec. 31, 2010<br />
Option<br />
Compensation<br />
Performance<br />
Share Units<br />
Retirement<br />
benefits &<br />
pensions<br />
Other<br />
remuneration<br />
Dr. Heinz<br />
Schimmelbusch $ 1,081,750 $1,379,231 $ 1,081,321 $225,867 $853,992 $313,560 $ 87,432<br />
Eric Jackson $ 632,700 $ 616,883 $ 397,764 $130,744 $256,196 $972,637 $ 49,180<br />
Dr. Reinhard Walter $ 607,108 $ 614,613 $ 397,764 $141,322 $256,196 $358,187 $ 16,624<br />
William J. Levy $ 492,700 $ 480,383 $ 340,427 $102,465 $170,799 $643,890 $ 23,293<br />
Report of the Supervisory Board 43
Management Board Remuneration in 2010<br />
The remuneration contracts of the Management Board<br />
members were with more than one Company now comprising<br />
AMG. The remuneration levels in the table above show<br />
the aggregate amounts of the contracts per Management<br />
Board member. In addition, Dr. Schimmelbusch received<br />
compensation of $39,810 as Chairman of the Supervisory<br />
Board of AMG’s subsidiary Graphit Kropfmühl AG. A detailed<br />
explanation of the remuneration paid in 2010 is provided<br />
in Note 36 to the Consolidated Financial Statements.<br />
Dr. Schimmelbusch also received remuneration from AMG’s<br />
associate Timminco for his work for that company as Chief<br />
Executive Officer and Chairman of the Board.<br />
Base Salary<br />
The Base Salaries of the Management Board members<br />
were determined by the Supervisory Board in line with<br />
the Remuneration Policy of the Company. In 2010 for all<br />
Management Board members there was no increase in<br />
Base Salary compared to 2009 and 2008.<br />
Annual Bonus<br />
In line with the Remuneration Policy, the short-term<br />
incentive plan provides for an annual cash bonus, which<br />
depends on three key performance metrics:<br />
• 40%: Return on Capital Employed (ROCE)<br />
(excluding construction in progress)<br />
• 40%: Adjusted Earnings Before Interest, Tax,<br />
Depreciation and Amortization (EBITDA)<br />
• 20%: Individual Performance<br />
The Supervisory Board, on the recommendation of the<br />
Remuneration Committee, has established the Annual<br />
Bonus over 2010 as 150% of the target amount due to the<br />
outstanding results of the Company in 2010. Both EBITDA<br />
and ROCE realized in 2010 substantially outperformed<br />
the targets set by the Supervisory Board. The Individual<br />
Performance targets set by the Supervisory Board were<br />
fully met by each Management Board member.<br />
The table below shows the target and paid out Annual Bonus<br />
over 2010 as a percentage of Base Salary per Management<br />
Board member. The Base Salary for annual bonus calculation<br />
purposes corresponds to full year base salary.<br />
For the year ended December 31, 2010 Target (as a % of Base Salary) Payout (as a % of Base Salary)<br />
Dr. Heinz Schimmelbusch 85% 127.5%<br />
Eric Jackson 65% 97.5%<br />
Dr. Reinhard Walter 65% 97.5%<br />
William J. Levy 65% 97.5%<br />
Long-term incentives<br />
Each member of the Management Board participates<br />
in the AMG Option Plan introduced in 2007 and in the<br />
AMG Management Board Option Plan adopted as per<br />
the (new) Remuneration Policy in 2009. In addition each<br />
member of the Management Board participates in the<br />
AMG Performance Share Unit Plan adopted as part of the<br />
Remuneration Policy in 2009. The table below provides<br />
an overview of the options granted under the AMG Option<br />
Plan during 2007, 2008, 2009 and 2010. All options<br />
granted in 2007 and 2008 are unconditional and have a<br />
vesting scheme of 25% per year starting one year after<br />
the grant date. In 2009 the Management Board members<br />
received options twice, one part governed by the AMG<br />
Option Plan and unconditional and one part governed<br />
by the AMG Management Board Option Plan 2009 and<br />
conditional, all as further explained on pages 39 and 40<br />
of the 2009 Annual Report of the Company. In May 2010,<br />
options have been granted to the Management Board<br />
members pursuant to the Remuneration Policy as long<br />
term incentive. These options are all conditional and<br />
follow the conditions set forth in the Remuneration Policy<br />
and are governed by the AMG Management Board Option<br />
Plan adopted in 2009.<br />
44 Report of the Supervisory Board
AMG Option Plan<br />
(all currency amounts in Euros)<br />
For the year ended<br />
Dec. 31, 2010<br />
Year<br />
Dr. Heinz<br />
2007<br />
Schimmelbusch<br />
2008<br />
2009<br />
2009<br />
2010<br />
Eric Jackson 2007<br />
2008<br />
2009<br />
2009<br />
2010<br />
Dr. Reinhard Walter 2007<br />
2008<br />
2009<br />
2009<br />
2010<br />
William J. Levy 2007<br />
2008<br />
2009<br />
2009<br />
2010<br />
Date of<br />
grant<br />
7/11/2007<br />
11/12/2008<br />
5/13/2009<br />
11/10/2009<br />
5/12/2010<br />
7/11/2007<br />
11/12/2008<br />
5/13/2009<br />
11/10/2009<br />
5/12/2010<br />
7/11/2007<br />
11/12/2008<br />
5/13/2009<br />
11/10/2009<br />
5/12/2010<br />
7/11/2007<br />
11/12/2008<br />
5/13/2009<br />
11/10/2009<br />
5/12/2010<br />
# of<br />
options<br />
56,250<br />
66,666<br />
—<br />
101,626<br />
62,578<br />
25,000<br />
20,000<br />
—<br />
30,488<br />
18.773<br />
25,000<br />
20,000<br />
—<br />
30,488<br />
18,773<br />
25,000<br />
13,333<br />
—<br />
20,325<br />
12,516<br />
Non-vested options<br />
under the plans<br />
Present<br />
value at<br />
date of<br />
grant 1<br />
1,350,000<br />
635,000<br />
—<br />
500,000<br />
500,000<br />
600,000<br />
190,500<br />
—<br />
150,000<br />
150,000<br />
600,000<br />
190,500<br />
—<br />
150,000<br />
150,000<br />
600,000<br />
127,000<br />
—<br />
100,000<br />
100,000<br />
Exercise<br />
price at<br />
date of<br />
grant<br />
24.00<br />
12.70<br />
8.00<br />
9.84<br />
7.99<br />
24.00<br />
12.70<br />
8.00<br />
9.84<br />
7.99<br />
24.00<br />
12.70<br />
8.00<br />
9.84<br />
7.99<br />
24.00<br />
12.70<br />
8.00<br />
9.84<br />
7.99<br />
Vesting scheme<br />
25% per year<br />
25% per year<br />
By 12/31/2009<br />
50% after 3 rd year;<br />
50% after 4 th year<br />
25% per year<br />
25% per year<br />
By 12/31/2009<br />
50% after 3 rd year;<br />
50% after 4 th year<br />
25% per year<br />
25% per year<br />
By 12/31/2009<br />
50% after 3 rd year;<br />
50% after 4 th year<br />
25% per year<br />
25% per year<br />
By 12/31/2009<br />
50% after 3 rd year;<br />
50% after 4 th year<br />
1 Present value of the stock options under the AMG Option Plan is calculated as 50% of the exercise price at the date of grant.<br />
# of<br />
options<br />
168,750<br />
66,667<br />
165,463<br />
—<br />
75,000<br />
20,000<br />
95,779<br />
—<br />
75,000<br />
20,000<br />
103,528<br />
—<br />
75,000<br />
13,334<br />
75,063<br />
—<br />
Vested options<br />
under the plans<br />
Value at<br />
Dec. 31,<br />
2010<br />
—<br />
—<br />
138,939<br />
n/a<br />
—<br />
—<br />
80,454<br />
n/a<br />
—<br />
—<br />
86,964<br />
n/a<br />
—<br />
—<br />
63,053<br />
n/a<br />
Share<br />
price at<br />
Dec. 31,<br />
2010<br />
9.03<br />
9.03<br />
9.03<br />
9.03<br />
Performance Share Units<br />
In 2010 the Supervisory Board awarded performance<br />
share units for the second time to the Management Board<br />
members since adoption of the Remuneration Policy.<br />
The present value of the PSU award for the Management<br />
Board members in 2010 was as follows:<br />
Dr. Heinz Schimmelbusch 1500,000<br />
Eric Jackson 1150,000<br />
Dr. Reinhard Walter 1150,000<br />
William J. Levy 1100,000<br />
The present value of the PSUs is calculated as 80% of the<br />
fair market value at the grant date. These PSU awards<br />
will vest in accordance with the phased-in vesting scheme<br />
adopted as part of the Remuneration Policy.<br />
In 2010 one-third ( 1 / 3) of the PSU award granted in 2009<br />
vested (as part of the phased-in vesting scheme adopted<br />
as part of the Remuneration Policy). Vesting of the PSU’s<br />
was subject to:<br />
• A minimum average ROCE over the performance period<br />
• The relative Total Shareholder Return (“TSR”) compared<br />
to the Bloomberg World Fabricate/Hardware.<br />
The first threshold (minimum ROCE) over 2010 met the<br />
target set by the Supervisory Board. The relative TSR<br />
for the Company for 2010 was between 40-60% which<br />
resulted in a 100% pay-out of the vested PSU award in<br />
2010. As a result the following amounts were paid out in<br />
cash in 2010:<br />
Dr. Heinz Schimmelbusch $525,390<br />
Eric Jackson $157,617<br />
Dr. Reinhard Walter $157,617<br />
William J. Levy $105,078<br />
Pensions and Retirement Benefits<br />
The members of the Management Board, except for<br />
Dr. Walter, are members of a defined contribution plan<br />
maintained in the United States. Dr. Walter is provided<br />
pension benefits in accordance with the defined benefit<br />
plan at AMG’s German subsidiary, <strong>ALD</strong> <strong>Vacuum</strong><br />
<strong>Technologies</strong> GmbH. Dr. Schimmelbusch and Mr. Jackson<br />
receive additional retirement benefits from Metallurg’s<br />
Supplemental Executive Retirement Plan (“SERP”). With<br />
respect to Dr. Schimmelbusch, the supplemental benefits<br />
are payable commencing at the later of age 68 or the end<br />
of his employment with AMG. The benefit to be paid will<br />
be reduced by the amounts received under the normal<br />
retirement benefit under the Metallurg pension plan.<br />
See Note 25 to the Consolidated Financial Statements.<br />
Pursuant to Mr. Jackson’s SERP, if Mr. Jackson is<br />
employed by Metallurg or remains in Metallurg’s employment<br />
until he is 65, he is entitled, whether or not he has<br />
Report of the Supervisory Board 45
terminated his employment, to receive retirement benefits<br />
(reduced by amounts received under Metallurg’s pension<br />
plan). Mr. Jackson’s benefits will be reduced if his<br />
employment with Metallurg ends prior to his reaching age<br />
65. In 2010 the Supervisory Board has aligned the pension<br />
entitlements of Mr. Levy and Dr. Walter with those of<br />
Mr. Jackson. Accordingly, if either Mr. Levy or Dr. Walter are<br />
employed by AMG or remain in AMG’s employment until<br />
either of them is 65 whether or not he has terminated his<br />
employment, he is entitled to receive retirement benefits<br />
(reduced by amounts received under Metallurg’s respectively<br />
<strong>ALD</strong>’s pension plan). Total costs to AMG with respect<br />
to the pension and retirement benefits of the Management<br />
Board in 2010 is provided in the table above which sets<br />
forth total costs incurred in 2010 for Management Board<br />
remuneration.<br />
Other benefits<br />
All Management Board members receive benefits, which<br />
are in line with industry and individual country practice.<br />
No loans and guarantees are granted to any Management<br />
Board members. Total costs to the Company with respect<br />
to other remuneration of the Management Board is provided<br />
in the table on page 43 which sets forth total costs<br />
incurred in 2010 for Management Board remuneration.<br />
Contracts<br />
Each member of the Management Board has a contract<br />
of employment with AMG. In case AMG terminates the<br />
contract(s) of employment without cause, the maximum<br />
severance payment is limited to two years Base Salary<br />
and two years of target Annual Bonus. Current agreements<br />
with respect to severance payments do not comply<br />
with best practice provision II.2.7 of the Dutch Corporate<br />
Governance Code. As part of its approved and adopted<br />
Remuneration Policy, AMG will honor existing contractual<br />
agreements for its current Management Board members<br />
and adapts to individual country practices, which differ<br />
from best practice provision II.2.7 of the existing Dutch<br />
Corporate Governance Code.<br />
In addition to the employment contracts with AMG, the<br />
members of the Management Board have a contract with<br />
one of AMG’s subsidiaries. Details of the employment<br />
contracts of the Management Board members with AMG<br />
and its subsidiaries are provided on the Company’s website<br />
under the Corporate Governance section.<br />
Management Board Remuneration for 2011<br />
In line with the Remuneration Policy, the Remuneration<br />
Committee has set up the size and structure of the<br />
Management Board’s remuneration for 2011. The<br />
Remuneration Committee has analyzed the possible<br />
outcomes of the different remuneration components in<br />
view of various economic scenarios and how these may<br />
affect the remuneration of Management Board members.<br />
Base Salary<br />
The Supervisory Board has for 2011 decided that the<br />
Base Salary of the Management Board members will not<br />
change as compared to the Base Salary levels of 2010. The<br />
table below shows the Base Salaries for 2011 and 2010.<br />
Differences are only due to exchange rate assumptions.<br />
Base Salary 2011 2010<br />
Dr. Heinz<br />
$ 1,087,500 $ 1,081,750<br />
Schimmelbusch<br />
Eric Jackson $ 635,000 $ 632,700<br />
Dr. Reinhard Walter $ 641,250 $ 607,108<br />
William J. Levy $ 495,000 $ 492,700<br />
Annual Bonus<br />
Each year, a variable cash bonus can be earned based on<br />
achievement of challenging targets. The Annual Bonus criteria<br />
are set forth below and relate 80% to financial indicators<br />
of the Company and 20% to the individual performance<br />
of Management Board members. The Supervisory Board<br />
determines ambitious target ranges with respect to each<br />
performance metric with respect to the threshold, target<br />
and maximum pay-out and determines whether performance<br />
targets are met. It has the ability to adjust the value<br />
upward or downward if the predetermined performance<br />
criteria would produce an unfair result due to incorrect<br />
financial data or extraordinary circumstances.<br />
The Annual Bonus pay-out in any year relates to achievements<br />
realized during the preceding year in relation to the<br />
agreed targets.<br />
The Annual Bonus for 2011 will be determined as follows:<br />
• 40% from ROCE (excluding construction in progress)<br />
• 40% from adjusted EBITDA growth<br />
• 20% from Individual Performance—discretionary by the<br />
Supervisory Board<br />
The table below shows the Annual Bonus for each<br />
member of the Management Board as a percentage of<br />
Base Salary in case threshold, target and maximum performance<br />
levels are reached. Below threshold level the<br />
payout will be 0%. The Supervisory Board has considered<br />
whether given the continued challenging economic<br />
circumstances adjustment of the annual bonus components<br />
would be merited and has concluded that such<br />
46 Report of the Supervisory Board
adjustment is not needed. The Supervisory Board has<br />
the ability to adjust the value upward or downward if the<br />
predetermined performance criteria would produce an<br />
unfair result due to incorrect financial data or extraordinary<br />
circumstances.<br />
Management Board<br />
position<br />
Chairman and Chief<br />
Executive Officer<br />
Minimum<br />
payout<br />
Target<br />
payout<br />
Maximum<br />
payout<br />
0% 85% 255%<br />
Divisional head 0% 65% 195%<br />
Chief Financial Officer 0% 65% 195%<br />
Long-term incentives<br />
In line with the Remuneration Policy, the long-term<br />
incentives for the Management Board for 2011 consist<br />
of two programs: the Performance Share Unit Plan and<br />
the Stock Option Plan.<br />
To facilitate a smooth transition from the old remuneration<br />
policy to the (new) Remuneration Policy, the<br />
Performance Share Unit Plan has a phasing-in schedule<br />
as indicated below.<br />
PSU initial<br />
grant 2009 2010 2011 2012 2013 2014<br />
Grant #1<br />
Phase-in<br />
Grant #2<br />
Phase-in<br />
Grant #3<br />
Normal<br />
cliff<br />
Grant<br />
1<br />
1/3<br />
vest<br />
Grant<br />
2<br />
1/3<br />
vest<br />
No<br />
vest<br />
Grant<br />
3<br />
1/3<br />
vest<br />
1/3<br />
vest<br />
No<br />
vest<br />
2/3<br />
vest<br />
No<br />
vest<br />
3/3<br />
vest<br />
This year’s grant (2011) will be the third grant under the<br />
new plan and vesting will apply as outlined in the schedule<br />
above. Vesting of the Performance Share Units under<br />
the third grant is subject to:<br />
• A minimum average ROCE over the performance period<br />
• The relative Total Shareholder Return compared to the<br />
Bloomberg World Fabricate/Hardware Index.<br />
Each year the Supervisory Board determines the target<br />
range with respect to the ROCE performance metric<br />
which serves as threshold and determines whether such<br />
threshold has been achieved. In addition it monitors and<br />
establishes the applicable TSR Ranking for the relevant<br />
PSU period. The TSR Ranking used applies the Bloomberg<br />
World Metal Fabricate/Hardware Index as further explained<br />
in the Company’s Remuneration Policy, which is available<br />
in the Corporate Governance section of the Company’s<br />
website. The Supervisory Board has the ability to adjust<br />
the value upward or downward if the predetermined<br />
performance criteria would produce an unfair result due to<br />
incorrect financial data or extraordinary circumstances.<br />
The present value of the PSUs to be granted in 2011 is<br />
1500,000 for Dr. Schimmelbusch, 1150,000 for Mr. Jackson<br />
and Dr. Walter and 1100,000 for Mr. Levy. The present value<br />
of the PSUs is calculated as 80% of the fair market value at<br />
the grant date.<br />
With regard to the Stock Option Plan (“SOP”), each member<br />
of the Management Board will be granted stock options<br />
in 2011 in accordance with the Remuneration Policy.<br />
Vesting of the stock options is subject to a minimum<br />
three year average ROCE requirement. The stock options<br />
will vest half after the third anniversary and half after<br />
the fourth anniversary. The present value of the stock<br />
options under the SOP to be granted in 2011 is 1500,000<br />
for Dr. Schimmelbusch, 1150,000 for Mr. Jackson and<br />
Dr. Walter and 1100,000 for Mr. Levy. The present value of<br />
the stock options under the SOP is calculated as 50% of<br />
the fair market value of the shares at the grant date. The<br />
aggregate number of stock options to be granted under<br />
the Remuneration Policy to members of the Management<br />
Board shall not exceed 10% of the outstanding share<br />
capital of the Company from time to time.<br />
Pension and other benefits<br />
The pension and other benefits of the members of the<br />
Management Board will not change compared to 2010.<br />
Contracts<br />
The current contractual agreements will not change compared<br />
to 2010. Main elements of the contracts with the<br />
Management Board members are published under the<br />
Corporate Governance section of the Company’s website.<br />
Report of the Supervisory Board 47
Shares Held by Members of the Management Board<br />
As of December 31, 2010, Dr. Schimmelbusch and<br />
Dr. Walter directly held, respectively, 258,397 and 6,000<br />
of AMG’s shares. No other member of the Management<br />
Board holds any AMG shares as of that date.<br />
Appreciation for the Management Board and the<br />
Employees of AMG<br />
The Supervisory Board would like to thank the Management<br />
Board for its extraordinary efforts in leading the Company<br />
out of what has been one of the most difficult economic<br />
environments of the past 50 years. The economic and<br />
financial circumstances which adversely impacted the<br />
Company over the last two years appear to have changed<br />
for the better although uncertainty will continue to cloud<br />
the outlook of the Company going forward into 2011. The<br />
Management Board did an excellent job of keeping the<br />
Company focused on its operations despite the challenging<br />
economic and financial environment. The Supervisory<br />
Board would also like to thank all the employees of AMG<br />
Group for their daily commitment to AMG.<br />
Annual Report 2010<br />
The Annual Report and the 2010 Annual Accounts, audited<br />
by Ernst & Young Accountants LLP, have been presented<br />
to the Supervisory Board. The 2010 Annual Accounts and<br />
the report of the external auditor with respect to the audit<br />
of the annual accounts were discussed with the Audit<br />
Committee in the presence of the Management Board and<br />
the external auditor. The Supervisory Board endorses the<br />
Annual Report and recommends that the General Meeting<br />
of Shareholders adopts the 2010 Annual Accounts.<br />
Supervisory Board AMG<br />
Advanced Metallurgical Group N.V.<br />
Pedro Pablo Kuczynski, Chairman<br />
Wesley Clark<br />
Martin Hoyos<br />
Jack Messman, Vice Chairman<br />
Norbert Quinkert<br />
Guy de Selliers<br />
March 31, 2011<br />
48 Report of the Supervisory Board
Sustainable Development<br />
AMG Facilities 1 2010 2009<br />
Advanced Materials<br />
AMG Vanadium, Ohio Y Y<br />
SICA, Chauny Y Y<br />
PCDL, Lucette Y Y<br />
GfE, Nürnberg Y Y<br />
LSM UK, Rotherham Y Y<br />
LSM Brazil, Sao Joao del Rei Y Y<br />
Alpoco, Minworth Y Y<br />
Alpoco, Anglesey Y Y<br />
GfE Fremat, Freiburg Y Y<br />
CIF Mining, Nazareno Y Y<br />
Engineering Systems<br />
<strong>ALD</strong> Hanau Y Y<br />
<strong>ALD</strong> Berlin Y Y<br />
<strong>ALD</strong> Limbach Y Y<br />
<strong>ALD</strong> Port Huron, MI Y Y<br />
<strong>ALD</strong> Ramos Arizpe Y Y<br />
<strong>ALD</strong> Japan Y N<br />
<strong>ALD</strong> UK Y N<br />
<strong>ALD</strong> USA Y N<br />
<strong>ALD</strong> Singapore Y N<br />
<strong>ALD</strong> FNAG Y N<br />
Corporate Offices<br />
Wayne, PA Y Y<br />
Amsterdam Y Y<br />
1 The chart indicates which facilities were included in<br />
the scope of the sustainable development data.<br />
This section provides an evaluation of AMG’s social and environmental<br />
performance for 2010 compared to 2009. AMG utilizes the Global<br />
Reporting Initiative (GRI) G3 aspects, taken from its Mining and Metals<br />
Sector Supplement, which are most material to AMG’s manufacturing<br />
operations. The GRI is a network-based organization that publishes the<br />
world’s leading sustainability reporting framework.<br />
The total number of sites reporting in 2010 is 22 and includes mining,<br />
manufacturing and office locations. Some smaller sales and service<br />
office locations are included for the first time this year. The Engineering<br />
Systems Division closed its operations in Columbia, South Carolina<br />
during the year and this site has therefore not been included. The<br />
facilities included in the report are detailed in the Table below. All<br />
sites report their performance at the end of the fourth quarter and no<br />
forecast data are used. Of most significance, AMG has further expanded<br />
its sustainability data collection process to move from the C+ to B+ GRI<br />
reporting level this year. AMG utilizes a standard environmental reporting<br />
template on which all sites report their data in order to ensure<br />
consistency in the interpretation of definitions of the key indicators. This<br />
approach is supported by training and by consistent auditing by AMG’s<br />
third party check partner, Conestoga-Rovers & Associates. AMG’s<br />
publicly traded subsidiary, Graphit Kropfmühl, also collects sustainable<br />
development data for its six business units, as does Timminco for its<br />
Bécancour, Canada facility but these are not currently included in this<br />
report. Timminco includes a Sustainable Development section within<br />
its Annual Report to shareholders. The environmental key performance<br />
data for the Advanced Materials and Engineering Systems Divisions are<br />
summarized in the table on page 56.<br />
Sustainable Development 49
Labor Practices and Decent Work Indicators<br />
GRI Indicators LA1, LA4, LA6, LA7, LA10 and LA13<br />
As of year-end 2010, the Advanced Materials Division<br />
had a workforce of 1,229 and the Engineering Systems<br />
Division had 791 employees. Including Corporate employees<br />
the total AMG workforce was approximately 2,039. 1<br />
AMG assesses the diversity of its workforce in terms of<br />
gender and age. The multinational and therefore multicultural<br />
nature of the business means that ethnic diversity<br />
is significant, but because of the difficulty in defining<br />
minority employees in such an environment, the Company<br />
does not collect data on this aspect. Of the total employees<br />
17% are female; 22% are under 30 years of age, 51%<br />
between 30 and 50 and 27% over 50. The metals and<br />
mining industries are traditionally male dominated, and<br />
workforce rationalizations have led to a mature workforce,<br />
both areas of which AMG is mindful. The Management<br />
and Supervisory Boards are currently all male and all<br />
members are over 50 years of age.<br />
AMG respects the freedom of its individual employees<br />
and their rights to join, or choose not to join, unions.<br />
Across the combined Advanced Materials and Engineering<br />
Systems Divisions, including corporate staff, 66% of<br />
AMG employees were covered by collective bargaining<br />
agreements. For the Advanced Materials Division 82% of<br />
employees are covered by such arrangements, whereas<br />
in the Engineering Systems Division, which includes a<br />
higher proportion of professional salaried staff, 42% were<br />
in collective bargaining units.<br />
Manufacturing our products safely is a key focus for the<br />
AMG business units—one of our key principles is that<br />
no task is so important that it should put our employees<br />
at risk. AMG has never had a fatal accident in either its<br />
Advanced Materials or Engineering Systems Divisions<br />
since its formation. Our primary measures of safety<br />
performance remain the lost time accident (LTA) rate 2<br />
and accident severity rates 3 . In 2010 the Advanced<br />
Materials LTA rate was 3.3, a 13% reduction from 2009.<br />
The Engineering Systems LTA rate was coincidentally also<br />
3.3 for the year representing a reduction of 32%. Overall<br />
the Company LTA rate was 3.3 and while this represents<br />
an improvement of almost 20% over 2009, the Company<br />
will be taking a number of initiatives in 2011 to further<br />
increase the profile of safety and to achieve our ultimate<br />
goal of zero harm to any of our employees. The overall<br />
accident severity rate in the Company was 0.32 in 2010<br />
1 Includes Corporate, Advanced Materials and Engineering Systems Division<br />
employees but not GK or Timminco employees.<br />
2 Lost time accident frequency rate equals the number of lost time accidents<br />
multiplied by 200,000 divided by the total hours worked. Lost time injury was<br />
defined using local regulations and ranged from minimum one lost day to<br />
three lost days.<br />
3 Accident severity is defined as the number of worker-days lost as a result of<br />
disabling injuries per thousand worker-hours of exposure.<br />
and is unchanged from 2009. Formal Health and Safety<br />
committees with representatives from all levels of the<br />
organization are in place at all major production facilities<br />
and most of the smaller facilities, but not at administrative<br />
and sales offices. Overall, 84% of the AMG workforce<br />
is represented in these committees which are focused on<br />
improving each site’s safety performance.<br />
Lost time accident rate<br />
3.77<br />
2009<br />
4.83<br />
3.32 3.32<br />
2010<br />
Advanced Materials<br />
Accident severity<br />
0.26<br />
2009<br />
0.43<br />
Engineering Systems<br />
0.36<br />
2010<br />
0.23<br />
For the first time in 2010 the report includes data on the<br />
development of AMG employees through training. Investing<br />
in our people to develop their skills and maintain our<br />
technical competitive advantage is an important objective<br />
for AMG. Three employee categories were determined<br />
to be suitable to track AMG’s training and the number<br />
of employees in each category, and the data on average<br />
amount of training they received in the reporting period<br />
were collected. Data on corporate employees was not available.<br />
The results were Management (93 employees trained,<br />
averaging 17 hours), Professional, Technical, Sales and<br />
Administration (685 employees trained, averaging 16 hours)<br />
and Production and Maintenance (1089 employees trained,<br />
averaging 19 hours). Across all of AMG, on average each<br />
employee received a total of 17 hours of training time in<br />
2010 (approximately 1% of total hours worked). Categories<br />
of training included technical and professional development,<br />
quality, anti-corruption policies, human rights policies<br />
and health and safety. Because this is the first year of<br />
data collection, AMG believes that not all training has been<br />
captured and plans to make improvements to its systems<br />
in this area during 2011.<br />
Human Rights and Ethics<br />
GRI Indicators HR3, HR5, HR6 and SO3<br />
AMG supports and respects the protection of internationally<br />
proclaimed human rights and will work to make sure<br />
it is not complicit in human rights abuses. As part of<br />
this commitment the Company has surveyed each of its<br />
Advanced Materials and Engineering Systems Division<br />
sites to identify if there is the possibility of freedom of<br />
50 Sustainable Development
association or collective bargaining being put at risk as<br />
a result of political or business factors and found that no<br />
sites were at risk. Similarly the Company has reviewed<br />
sites to ensure that they are not at risk for employing<br />
child labor or exposing young workers to hazards and<br />
again found that no sites posed a risk at this time.<br />
Our policy on human rights is part of the Company Code<br />
of Business Conduct and Ethics. To further emphasize<br />
the importance of this to AMG, a new stand alone Human<br />
Rights policy has been developed and employees will<br />
be trained in this policy as part of our ongoing commitment.<br />
In 2010, data was only available for the Advanced<br />
Materials Division where 559 employees, representing<br />
45% of the workforce received training in the AMG<br />
Company Code of Business Conduct and Ethics. This<br />
included particular emphasis on managers and employees<br />
in positions where they may be required to make<br />
significant ethically based decisions. Because this is the<br />
first year of data collection, AMG believes not all training<br />
has been captured and plans to make improvements to<br />
its systems in this area during 2011.<br />
Resource Efficiency and Recycling<br />
GRI Indicators EN1 and EN2<br />
The AMG businesses fall into three distinct categories—<br />
those that produce metals, alloys and inorganic chemical<br />
products from primary, mined resources; those which<br />
produce metals and alloys from secondary, recycled<br />
resources; and those which provide technology and<br />
engineering services.<br />
The Engineering Systems Division provides predominantly<br />
technical and engineering services with additional furnace<br />
assembly operations and furnace service operations (heat<br />
treatment services). The Division therefore utilizes only<br />
limited amounts of raw materials, mainly component<br />
parts for furnaces and does not knowingly utilize recycled<br />
or secondary raw materials. The nature of these components<br />
means that they are routinely measured in units,<br />
rather than by mass and therefore limited data is available.<br />
In 2010 the Division reported using 5,480 metric tons<br />
of raw materials, all of which were classified as primary.<br />
However, much of this was steel components and these<br />
are likely to contain a proportion of recycled metal.<br />
The Advanced Materials Division uses a much more diverse<br />
range of raw materials; for example, the Brazilian mine<br />
uses pegmatite as its primary raw materials for tantalum<br />
production, but has also developed markets in the ceramics<br />
industry for materials previously considered overburden<br />
and is currently developing a process to isolate lithium<br />
concentrate from the spodumene content of the mine. In<br />
contrast GfE in Nürnberg and AMG Vanadium in Ohio use<br />
secondary raw materials including power plant wastes<br />
and spent refinery catalysts for the production of vanadium<br />
alloys. Across this Division, excluding the mine site in<br />
Brazil, 141,000 metric tons of raw materials were used in<br />
2010 of which 24,000 metric tons or 17% were secondary<br />
or recycled materials. The Brazilian mine used a further<br />
391,000 metric tons of primary raw materials.<br />
Energy Consumption<br />
GRI Indicators EN3 and EN4<br />
Energy usage was determined by collecting data on all<br />
energy carriers. In addition to the two most significant<br />
contributors, electricity and natural gas, minor energy<br />
sources such as gasoline, diesel, combustible bottled<br />
gases and purchased steam and compressed air are<br />
included in the data.<br />
The total energy usage for the Advanced Materials<br />
Division showed an expected increase from 830 terajoules<br />
(TJ) in 2009 to 1,008 TJ in 2010. This increase is directly<br />
related to the higher production quantities in 2010 as<br />
market conditions have recovered. Small increases also<br />
arose because of the increased scope of reporting in 2010.<br />
Direct (542 TJ) and indirect (466 TJ) energy usage continue<br />
to account for approximately half of the total energy usage<br />
each. The most significant energy carriers by a wide<br />
margin are electricity and natural gas. 4<br />
The Engineering Systems Division uses significantly less<br />
energy than Advanced Materials since they operate lower<br />
temperature processes. Once again, increased demand<br />
for products and services led to a similar increase in<br />
power usage. In 2010 the Division used a total of 187 TJ.<br />
Indirect energy, in the form of electricity, accounted for<br />
82% of the energy usage (153 TJ) while direct energy,<br />
primarily natural gas and some liquid fuels made up the<br />
remaining 18% (33 TJ), meaning the mix of energy carriers<br />
was unchanged from the prior year. At both Divisions,<br />
the unavailability of data from electricity utilities makes<br />
the split between renewable and non renewable energy<br />
sources difficult to accurately measure.<br />
Flooding in Brazil in early 2010 led to a landslide which<br />
damaged the canal supplying the generating turbines<br />
at the hydroelectric facility near Sao Joao del Rei. This<br />
meant the recently upgraded turbines could not be used<br />
until the water supply canal was repaired. Although this<br />
does not affect total energy usage, it did mean that energy<br />
was purchased from the local supplier, Companhia<br />
Energética de Minas Gerais (CEMIG), rather than generated<br />
internally. The renewable nature of the energy was<br />
unchanged since the utility generates over 97% of its<br />
power utilizing hydroelectric plants.<br />
4 Indirect energy consumption does not include the energy consumed by<br />
electricity producers to generate the electricity or transmission losses.<br />
Sustainable Development 51
Water Consumption<br />
GRI Indicator EN8<br />
Water is essential to many manufacturing processes and<br />
is used by AMG companies primarily for non contact,<br />
evaporative or single pass cooling purposes, although<br />
a small number of AMG facilities do use wet chemical<br />
processes for the production of metal oxides and other<br />
chemicals. Water utilized for cooling, process and sanitary<br />
usage is reported by all AMG companies.<br />
Both the Advanced Materials Division and Engineering<br />
Systems Divisions saw an increase in water usage in 2010<br />
compared to 2009. This reflects increased production<br />
and throughput at the manufacturing facilities. Closer<br />
monitoring of water use, including the installation of<br />
additional metering, also identified pipe fractures and<br />
leakage, in several cases resulting from unusually cold<br />
weather conditions, which although contributing to the<br />
higher use in 2010 will, in future, further control overall<br />
use. Excluding the Brazilian mine, which is the largest<br />
water user in the group, water use increased 24% from<br />
2009 (from 354 to 439 million liters).<br />
In contrast, the mine in Brazil saw lower water usage in<br />
2010 as a result of benefits from new processing equipment,<br />
and despite overall higher mine production. Water<br />
use reduced from 2,297 million liters in the previous year<br />
to 1,836 million liters (a 21% reduction). Since 2007 water<br />
use at the mine has seen a reduction of 61% through improved<br />
efficiency measures. As mine production expands,<br />
these efficiencies will continue to result in significant<br />
benefits, although absolute use may climb in future years.<br />
For AMG as a whole water use in 2010 therefore decreased<br />
by 14% over 2009.<br />
Mine Water Usage (millions of liters)<br />
4,977<br />
4,612<br />
2007<br />
2008<br />
Biodiversity<br />
2,297<br />
1,836<br />
2009<br />
2010<br />
GRI Indicator EN11<br />
Of the 22 sites reporting for 2010, four reported land areas<br />
on or adjacent to their property which had high biodiversity<br />
value, sensitive habitats or were protected. These areas<br />
included river frontage in Hanau Germany, native forest<br />
in Sao Joao del Rei, river frontage and setback areas in<br />
Nazareno, Brazil and wetlands in Cambridge, Ohio. AMG<br />
employees are mindful of their responsibilities to preserve<br />
these important natural areas.<br />
Climate Change<br />
GRI Indicator EN16<br />
Electricity used for the generation of heat for metallurgical<br />
processing has been, and remains, the most<br />
significant source of greenhouse gas (GHG) emissions<br />
for AMG. This electricity use gives rise to indirect GHG<br />
emissions of CO 2<br />
equivalent (CO2e) which are dependent<br />
on the fuels utilized in its generation. The emissions have<br />
been calculated using emission factors available from the<br />
electricity supplier, the local environmental agency or the<br />
GHG protocol. Indirect emissions, are defined as those<br />
emissions generated by sources outside of AMG’s control,<br />
but where AMG ultimately uses the energy. Whenever<br />
possible the most up to date emission factors have been<br />
utilized in the calculations. Direct GHG emissions result<br />
primarily from the combustion of carbon containing materials<br />
often as part of the metallurgical process, such as<br />
using coke as a reductant, but also for the generation of<br />
heat, such as burning natural gas in a boiler. Both indirect<br />
and direct emissions are reported. Other GHGs occurring<br />
from processes other than combustion, such as hydrofluorocarbons,<br />
perfluorocarbons and sulfur hexafluoride,<br />
are minimal for the AMG business units, but are included<br />
if relevant.<br />
As discussed above, increased production levels in 2010<br />
meant similar increases in energy usage, and the preponderance<br />
of fossil fuels for energy generation in turn gives<br />
rise to increased absolute CO2e emissions. The Advanced<br />
Materials Division GHG emissions rose from 88,500<br />
metric tons of CO2e, to 103,000 metric tons in 2010, or a<br />
16% increase. Of these emissions 60% are attributed to<br />
indirect sources and 40% to direct sources.<br />
The Engineering Systems Division’s GHG emissions in<br />
2010 were 24,500 metric tons, again an increase from 2009<br />
(20,000 metric tons) and once again related to increased<br />
production. These emissions come primarily (92%) from<br />
indirect emissions associated with electricity usage.<br />
In order to compare year on year performance, the<br />
Company has utilized the overall GHG intensity, defined<br />
as metric tons of CO2e produced per metric ton of<br />
product. Including the Advanced Materials Division,<br />
Engineering Systems Division (where available) and all<br />
offices, this figure was 0.49 metric tons of CO2e in 2009<br />
and was marginally higher at 0.52 in 2010.<br />
52 Sustainable Development
Greenhouse Gas Emissions<br />
(thousands of metric tons)<br />
1<br />
33<br />
Direct<br />
19<br />
56<br />
Indirect<br />
1<br />
41<br />
Direct<br />
2009 2010<br />
Advanced Materials<br />
Emissions to Air<br />
19<br />
62<br />
Indirect<br />
Engineering Systems<br />
GRI Indicators EN19 and EN20<br />
The emissions of ozone depleting substances (ODS) remain<br />
de minimis for both the Advanced Materials Division<br />
and Engineering Systems Division. During routine audits<br />
some small office air conditioning units were identified<br />
at one site which contained these substances and these<br />
will be retrofilled with non ozone depleting replacement<br />
materials as maintenance is required. The nature of the<br />
Engineering Systems business means that it has minimal<br />
air emissions for other pollutants, resulting from only<br />
small sources such as heating and hot water boilers;<br />
these are considered negligible for the purposes of this<br />
report. The manufacturing facilities of the Advanced<br />
Materials Division have more significant emissions<br />
including SOx (442 metric tons), NOx (110 metric tons)<br />
and particulate materials (21 metric tons). Reliable data is<br />
only available for regulated sources where measurements<br />
have been made. There may be other minor contributions<br />
from insignificant sources but they are not considered<br />
material for this report. The major changes from 2009<br />
include an increase in reported NOx emissions as a result<br />
of data becoming available for the new rotary kiln at GfE<br />
Nürnberg and a reduction in particulate emissions at the<br />
Brazilian manufacturing plant.<br />
Emissions to Water and Spills<br />
GRI Indicators EN21 and EN23<br />
AMG facilities continue to maintain records of the volume<br />
of aqueous effluents, including process water and<br />
non-sanitary sewer releases, discharged to local water<br />
courses. Clean water (typically freshwater used for cooling<br />
purposes that has not been affected in the process)<br />
is included in the figures given below. Chemical analysis<br />
of the effluent is utilized to determine the total mass of<br />
primary constituents of the water emissions. In 2010,<br />
the total waste water disposed to water courses by the<br />
Advanced Materials Division, excluding the Brazil mine,<br />
totaled 135 million liters compared to 151 million liters<br />
in 2009. The Brazil mine site, which as discussed above<br />
has significantly reduced water usage with new, more<br />
efficient processing equipment, has seen a commensurate<br />
reduction in water discharged to the local river from<br />
1,933 million liters in 2009 to 1,836 million liters in 2010.<br />
Most of the efficiency savings from this project have been<br />
now been realized and this discharge rate is expected to<br />
be typical of future years. Although most of the Division’s<br />
water is used for cooling purposes and therefore produces<br />
clean water discharges, some of the wet chemical<br />
processes generate aqueous waste streams. For the<br />
three production sites reporting industrial process water<br />
disposal, the major constituents were metals (4200 kg),<br />
fluoride (323 kg), sulfate (687 metric tons) and total<br />
suspended solids (7.9 metric tons). Additionally, this<br />
water included 3,021 kg of chemical oxygen demand<br />
(COD). The large volume of water discharged to surface<br />
water from the mine site in Brazil contains suspended<br />
solids but these have not been accurately quantified. The<br />
Engineering Systems Division also utilizes minimal water<br />
for non-contact, closed-cycle cooling purposes, and the<br />
discharges are therefore clean water and not considered<br />
material to this report.<br />
For the first time in 2010 AMG has collected information<br />
on the total number and volume of significant spills,<br />
including those of tailings and other process materials.<br />
A significant spill is defined by GRI as one which would<br />
affect the Company’s financial statement as a result of<br />
the ensuing liability or is recorded as a spill. In 2010 there<br />
were no such spills at any AMG site.<br />
Waste Disposal<br />
GRI Indicator EN 22<br />
Once again in 2010 all AMG facilities were required to<br />
report a detailed breakdown of their waste generation and<br />
disposal activities including the methodology for disposal<br />
or recycling. AMG believes landfill disposal should be<br />
minimized and seeks beneficial reuse opportunities for<br />
all by-product materials. In 2010 the Company has sought<br />
further customers for many of these materials which have<br />
value by virtue of their physical or chemical properties.<br />
Where this has not been possible disposal has become<br />
necessary, and in 2010 the decision was made to dispose<br />
of some materials that AMG has been unable to find a<br />
timely market for, most notably filter cake materials from<br />
niobium and tantalum chemicals production at the LSM<br />
Brazil facility.<br />
In 2010 the Advanced Materials Division saw an increase<br />
of 20% (13,981 metric tons compared to 11,655 metric<br />
tons in 2009) in overall waste disposed to landfill. This<br />
increase was a result of the disposal of the legacy filter<br />
cake material from Brazil described above offset by<br />
general decreases at our European and North American<br />
Sustainable Development 53
sites. This project is expected to continue and will also<br />
affect 2011 data. Of note is the Cambridge, Ohio facility<br />
where landfill disposal has dropped from over 6,100 metric<br />
tons in 2007 to below 1,300 metric tons in 2010. The<br />
identification of markets and customers for by-products<br />
and a rigorous on site waste elimination program which<br />
makes sure items such as pallets, paper and pop cans are<br />
sorted and recycled has enabled this reduction.<br />
The nature of the Engineering Systems Division operations<br />
means that it produces far less waste, with just<br />
120 metric tons disposed to landfill in 2010. Improved<br />
recycling means that this is also a significant reduction<br />
(over 75%) from the 524 metric tons reported in 2009.<br />
Overall, the Company disposed of 14,102 metric tons of<br />
waste to landfill in 2010, compared to the 7,580 metric<br />
tons which were recycled. Of the waste disposed, the<br />
majority (12,067 metric tons or 86%) was non hazardous.<br />
Total landfilled waste disposal (metric tons)<br />
15,843<br />
13,981<br />
11,655<br />
2008<br />
2009<br />
524<br />
Advanced Materials<br />
120<br />
2010<br />
Engineering Systems<br />
Significant Fines for Non-Compliance with<br />
Environmental and Other Laws<br />
GRI Indicator EN28<br />
The Advanced Materials and Engineering Systems<br />
Divisions did not receive any fines or equivalent penalties<br />
for non compliance with environmental laws in 2010.<br />
GRI Indicator SO8<br />
In 2010 the Advanced Materials and Engineering Systems<br />
Divisions did not receive any fines or equivalent penalties for<br />
non-compliance with other applicable laws and regulations<br />
in 2010.<br />
Product Responsibility<br />
GRI Indicator MM 11<br />
In addition to providing Safety Data Sheets for all products,<br />
including updates to reflect the recently implemented Global<br />
Harmonized System, AMG has continued with registrations<br />
under REACH in Europe. All high volume (›1,000 metric<br />
tons) or hazardous products have been registered and<br />
preparations are underway for 2013 and 2018 registrations.<br />
European subsidiary companies are involved with<br />
Consortia developing the health, safety and environmental<br />
data required for these registrations. AMG is also extremely<br />
active in a number of industry groups focused on developing<br />
health and safety knowledge of certain products, among<br />
them the Vanadium International Technical Committee<br />
(Vanitec) and the International Antimony Association (I2A).<br />
GRI Contents<br />
This section provides an overview of how AMG’s Annual<br />
Report correlates with the GRI G3 guidelines for the<br />
voluntary reporting of sustainable development indices.<br />
The table below serves as a reference guide to the sections<br />
of the report where information about each item can<br />
be found. The GRI G3 guidelines facilitate measurement<br />
of economic, environmental and social dimensions of<br />
company performance. Third party verification has been<br />
conducted to ensure that AMG’s reporting is consistent<br />
with the GRI reporting principles. AMG believes that in all<br />
material aspects the report meets the requirements of a<br />
B+ application level.<br />
United Nations Global Compact<br />
AMG commits its support to the principles of the United<br />
Nations Global Compact (“Global Compact”). The Global<br />
Compact, which is overseen by the United Nations (UN),<br />
is a strategic policy initiative for businesses that, like<br />
AMG, are committed to aligning their operations and<br />
strategies with ten universally accepted principles in<br />
the areas of human rights, labor, the environment and<br />
anti-corruption. In 2009, the Management Board of AMG<br />
approved its commitment to the Global Compact and the<br />
intent of AMG to support the ten principles of the Global<br />
Compact. AMG will reaffirm its support and submit its<br />
first Communication on Progress (COP) in April 2011.<br />
Extractive Industries Transparency Initiative<br />
AMG continues its support of the Extractive Industries<br />
Transparency Initiative (EITI, http://eiti.org/), a global<br />
initiative to improve governance in resource-rich countries<br />
through the verification and full publication of Company<br />
payments and government revenues from oil, gas, and<br />
mining. The Initiative works to build multi-stakeholder<br />
partnerships in developing countries in order to increase<br />
the accountability of governments. Over 30 countries<br />
have now committed to the EITI principles and criteria,<br />
although, as of today, AMG does not have any extractive<br />
operations in an EITI implementing country.<br />
54 Sustainable Development
Global Reporting Initiative<br />
AMG supports the Global Reporting Initiative (GRI), and<br />
is an Organizational Stakeholder (OS). GRI is a networkbased<br />
organization that has pioneered the development<br />
of the world’s most widely used sustainability reporting<br />
framework and is committed to its continuous improvement<br />
and application worldwide. In order to ensure<br />
the highest degree of technical quality, credibility, and<br />
relevance, the reporting framework is developed through<br />
a consensus-seeking process with participants drawn<br />
globally from business, civil society, labor, and professional<br />
institutions.<br />
This framework sets out the principles and indicators<br />
that organizations can use to measure and report their<br />
economic, environmental, and social performance.<br />
The cornerstone of the framework is the Sustainability<br />
Reporting Guidelines. The third version of the Guidelines—<br />
known as the G3 Guidelines—was published in 2006, and is<br />
a free public resource. Other components of the framework<br />
include Sector Supplements (unique indicators for industry<br />
sectors) and National Annexes (unique country level information).<br />
AMG has utilized the Metals and Mining Sector<br />
Supplement, 2010 as a guide in preparing this report.<br />
The Organizational Stakeholder Program is located at<br />
the center of the global multi-stakeholder network that<br />
constitutes GRI. Organizational Stakeholders put their<br />
name to the GRI mission, products and processes, and<br />
broadening participation around sustainability and transparency.<br />
The Organizational Stakeholders provide a key<br />
basis for legitimacy to GRI and reinforce its common commitment<br />
as a network to change. As an Organizational<br />
Stakeholder, AMG further supported the GRI in 2010 by<br />
attending its biennial conference in Amsterdam.<br />
Further information on AMG Sustainable Development<br />
and our commitments to these organizations, including<br />
our UNGC Communication on Progress can be found on<br />
the AMG website (www.amg-nv.com).<br />
Environmental, Health, Safety and Social Reporting<br />
Statement of Assurance<br />
Scope, Objectives & Responsibilities<br />
AMG’s environmental, health, safety and social performance<br />
reporting has been prepared by the management<br />
of AMG who were responsible for the collection and<br />
presentation of the information. Conestoga-Rovers &<br />
Associates (CRA) was retained by AMG to conduct an<br />
independent review and assurance of the information and<br />
data reported in the Sustainable Development section of<br />
this Report. The objective of the assurance process was to<br />
check the materiality of the issues included in the Report<br />
and the completeness of reporting. Any claims relating<br />
to financial information contained within the Report are<br />
excluded from the scope of this assurance process. CRA’s<br />
responsibility in performing our assurance activities is<br />
to the management of AMG only and in accordance with<br />
the terms of reference agreed with them. CRA does not<br />
accept or assume any responsibility for any other purpose<br />
or to any other person or organization. Any reliance that<br />
any third party may place on the Report is entirely at its<br />
own risk.<br />
Approach and Limitations<br />
CRA’s assurance engagement has been planned and<br />
performed in accordance with AMG’s internal guidance<br />
and definitions for the reported indices. The assurance<br />
approach was developed to be consistent with the GRI<br />
G3 Guidelines and international standards for assurance<br />
appointments. CRA conducted site visits to 6 of the 22<br />
sites, and met with/interviewed personnel responsible<br />
for collecting, reviewing and interpreting the data and<br />
information for presentation in the Report for all 22 sites.<br />
Stakeholder engagement was not within the scope of the<br />
assurance activities.<br />
Conclusions/Recommendations<br />
On the basis of the method and scope of work undertaken,<br />
and the information provided to CRA by AMG, the process<br />
undertaken by AMG provides a balanced representation of<br />
the issues concerning AMG’s sustainability performance<br />
and is an appropriate presentation of AMG’s environmental,<br />
safety, health and social performance in 2010.<br />
In our opinion the processes for collecting and reporting<br />
sustainability-related data that AMG introduced in 2007<br />
have been further enhanced through better communication<br />
and awareness, and more consistent application<br />
of the environmental indices. Some challenges remain<br />
related to ensuring consistency in the approach related<br />
to various performance metrics and providing consistent<br />
and complete data in an efficient manner. It is recommended<br />
that AMG continue to focus on these challenges<br />
to improve reporting, but they do not materially affect the<br />
conclusions presented herein.<br />
Julian Hayward, P. Eng., Associate<br />
Conestoga-Rovers & Associates<br />
Gregory A. Carli, P.E., Principal<br />
Conestoga-Rovers & Associates<br />
Sustainable Development 55
Overview of AMG Social and Environmental Key Performance Indicators and GRI Content Index<br />
Quantitative Social and Environmental Key Performance Indicators<br />
GRI Advanced Materials Engineering Systems<br />
Indicator Description 2009 2010 2009 2010<br />
LA1 Total workforce 1 1,140 1,229 672 791<br />
LA4 % of employees covered by collective<br />
76 82 43 42<br />
bargaining agreements<br />
LA7 Accident Rates Total 3.8 3.3 4.8 3.3<br />
LA7 Accident Severity Rate Total 0.26 0.36 0.43 0.23<br />
LA10 Average Hours of Training Per Year* Per person No Data 17 No Data 17<br />
HR3 Human Rights Training* % Trained No Data 45 No Data 45<br />
EN2 % Recycled Raw Materials (excluding mine) % 23 17 0 0<br />
EN3 Direct Energy Consumption TJ 446 542 27 33<br />
EN4 Indirect Energy Consumption TJ 385 466 122 153<br />
EN8 Water consumption (manufacturing) Million l 311 397 42 46<br />
EN8 Water consumption (mining) Million l 2,297 1,836 n/a n/a<br />
EN16 CO2 equivalent emissions mt 88,500 103,000 20,000 24,500<br />
EN20 SOx emissions mt 422 442 0 0<br />
EN20 NOx emissions mt 7 110 0 0<br />
EN20 Particulates discharged to air mt 37 21 0 0<br />
EN21 Metals discharged to water kg 179 4,200 0 0<br />
EN22 Hazardous waste (including recycled) mt 4,859 5,705 91 251<br />
EN22 Non-hazardous waste (including recycled) mt 11,629 17,561 614 644<br />
EN22 Percent of waste recycled % 29 40 34 86<br />
EN22 Waste disposed to landfill mt 11,655 13,981 524 120<br />
EN23 Spills L No Data 0 No Data 0<br />
EN28 Environmental Fines $ No Data 0 No Data 0<br />
SO8 Fines for non compliance with laws $ No Data 0 No Data 0<br />
1<br />
This figure excludes 18 corporate employees.<br />
GRI Content Index<br />
GRI Reference Indicator Pages<br />
General<br />
1.1 CEO and Chairman Statement 4–7<br />
2.1—2.2 Name, primary brands, products and services 1–32<br />
2.3—2.7 Structure, geographical presence, markets served 1–3, 8–32<br />
2.8 Scale of the organization 8–32<br />
2.9 Significant changes in size, structure or ownership 2–3, 22–32<br />
2.10 Awards received in 2010 n/a<br />
3.1—3.4 Reporting period, date of previous report, reporting cycle, contacts 57, 149<br />
3.5—3.12 Report scope, boundary of report, changes from previous report 49<br />
4.1—4.4 Structure and governance 57–62<br />
4.14—4.15 Stakeholder groups, basis for selection 40–48<br />
Environmental Indicators<br />
EN1—EN2 Materials used by weight or volume, recycling ratio 51<br />
EN3—EN4 Direct and indirect energy consumption by primary energy source 51<br />
EN8 Total water withdrawal by source 52<br />
EN11 Biodiversity 52<br />
EN16 Total direct and indirect greenhouse gas emissions by weight 52<br />
EN19—EN20 Ozone-depleting substances, NOx, SOx, and other significant emissions 53<br />
EN21, 23 Total water discharge by quality and destination and spills 53<br />
EN22 Total weight of waste by type and disposal method 53–54<br />
EN28, SO8 and MMII Fines, Materials stewardship 54<br />
Social Indicators<br />
LA1, 4, 6, 7, 10 and 13 Workforce, collective bargaining safety and diversity 50<br />
Economic Indicators<br />
EC1 Economic value generated and distributed 2<br />
Human Rights<br />
HR3, 5 and 6, SO3 Training, Collective bargaining and child labor, Anticorruption 50–51<br />
* Not broken down by Division<br />
56 Sustainable Development
Corporate Governance<br />
General<br />
AMG Advanced Metallurgical Group N.V. (“AMG” or the<br />
“Company”) is a company organized under Dutch law and<br />
is the parent company of the AMG Group. The Company<br />
was established in 2006 as the holding company for the<br />
AMG Group companies and its shares were first listed<br />
on Euronext Amsterdam by NYSE Euronext (“Euronext<br />
Amsterdam”) in July 2007.<br />
In this report the Company, as a Dutch listed company,<br />
sets forth its overall corporate governance structure and<br />
the extent to which it applies the provisions of the Dutch<br />
Corporate Governance Code (as amended most recently<br />
by the Corporate Governance Code Monitoring Committee<br />
issued on December 10, 2008 (“Dutch Corporate<br />
Governance Code”)). The Dutch Corporate Governance<br />
Code can be downloaded from www.corpgov.nl.<br />
The Supervisory Board and the Management Board, which<br />
are responsible for the corporate governance structure<br />
of the Company, hold the view that the vast majority of<br />
principles set forth in the Dutch Corporate Governance<br />
Code as applicable during 2010 are being applied, while<br />
certain deviations are discussed and explained hereafter.<br />
A full and detailed description of AMG’s Corporate<br />
Governance structure and AMG’s compliance with the<br />
Dutch Corporate Governance Code can be found on<br />
AMG’s website (www.amg-nv.com) under the chapter<br />
Corporate Governance.<br />
Annual Accounts and Dividend<br />
The Management Board and the Supervisory Board<br />
have approved AMG’s audited (consolidated) financial<br />
statements for 2010. Ernst & Young Accountants LLP<br />
audited these financial statements.<br />
The audited financial statements will be submitted for<br />
adoption to the General Meeting of Shareholders.<br />
AMG’s dividend policy is to retain future earnings to<br />
finance the growth and development of its business. As<br />
a result, the Management Board does not anticipate that<br />
AMG will pay any dividends for the foreseeable future.<br />
The dividend policy will, however, be reviewed from time<br />
to time. Payment of future dividends to shareholders<br />
will be at the discretion of the Management Board<br />
subject to the approval of the Supervisory Board after<br />
taking into account various factors, including business<br />
prospects, cash requirements, financial performance,<br />
new product development, expansion plans, the terms<br />
of the Company’s financing facilities and the compliance<br />
with applicable statutory and regulatory requirements.<br />
Additionally, payment of future dividends or other<br />
distributions to shareholders may be made only if the<br />
Company’s shareholders’ equity exceeds the sum of the<br />
issued share capital plus the reserves required to be<br />
maintained by law.<br />
Shares and Shareholders’ Rights<br />
As of December 31, 2010, the total issued share capital<br />
of AMG amounts to EUR 550,077.70 consisting of<br />
27,503,885 ordinary shares of EUR 0.02 each. Each<br />
ordinary share carries one vote. The ordinary shares are<br />
listed on Euronext Amsterdam. The ordinary shares are<br />
freely transferable.<br />
The Company was advised by Safeguard International<br />
Fund L.P. (“SIF”) on September 2, 2010 that SIF had<br />
successfully completed the distribution and transfer of<br />
its 26.6 percent shareholding in the Company to certain<br />
of the partners of SIF and other investors. As a result<br />
SIF ceased to be a shareholder in the Company effective<br />
from September 30, 2010. In addition, as a result of the<br />
distribution by SIF of its shareholding in the Company,<br />
Dr. H.C. Schimmelbusch, CEO and Chairman of the<br />
Management Board of the Company and general partner<br />
of SIF, acquired 229,247 ordinary shares in the Company<br />
bringing his total shareholding in the Company as of<br />
December 31, 2010 to a total of 258,397 ordinary shares.<br />
Pursuant to the Financial Markets Supervision Act (Wet<br />
op het financieel toezicht) and the Decree on Disclosure of<br />
Major Holdings and Capital Interests in Securities-Issuing<br />
Institutions (Besluit melding zeggenschap en kapitaalbelang<br />
in uitgevende instellingen), the Authority Financial Markets<br />
(Autoriteit Financiele Markten) has notified the Company<br />
that it had been notified about the following substantial<br />
holdings (›5%) in ordinary shares of AMG:<br />
As of February 28, 2011<br />
C. Leone/Luxor Management LLP 15.04%<br />
Hunter Hall Investment Management Ltd 5.10%<br />
Morgan Stanley Inc. 5.07%<br />
Shareholding table:<br />
2010 2009<br />
Number of ordinary shares outstanding 27,503,885 26,899,548<br />
Average daily turnover 213,730 580,653<br />
Highest closing price 9.37 11.59<br />
Lowest closing price 6.24 3.76<br />
Introduction of Preference Shares<br />
The General Meeting of Shareholders approved in its<br />
meetings of May 12, 2010 and July 6, 2010 that the Articles<br />
of Association of the Company would be changed in order<br />
to introduce a new class of preference shares which<br />
may be issued and used as an anti-takeover device in<br />
order to safeguard the interests of the Company and its<br />
stakeholders in all those situations where the Company’s<br />
interests and those of its stakeholders are at stake<br />
including but not limited to situations in which non-solicited<br />
public offers are made.<br />
Corporate Governance 57
The preference shares carry equal voting rights as<br />
ordinary shares and are entitled, if distribution to<br />
shareholders is permitted, to a fixed dividend equal<br />
to EURIBOR for deposit loans of one year increased<br />
with maximum of 400 basis points as determined by<br />
the Management Board of the Company and subject<br />
to approval by the Supervisory Board. The Articles of<br />
Association of the Company have been amended on<br />
July 6, 2010 and now provide for an authorized share<br />
capital of 65,000,000 ordinary shares and 65,000,000<br />
preference shares.<br />
Stichting Continuïteit AMG<br />
In line with Dutch law and corporate practice, on July 6,<br />
2010, the Stichting Continuïteit AMG (“Foundation”) was<br />
established in Amsterdam, the Netherlands, having<br />
as its main objective to safeguard the interests of<br />
the Company and its stakeholders. The Board of the<br />
Foundation is independent from the Company and consists<br />
of Mr. H de Munnik, Chairman and Mr. W.G. van Hassel and<br />
Mr. H. Borggreve as members. The main objective of the<br />
Foundation is to represent the interests of the Company<br />
and of the enterprises maintained by the Company and<br />
the companies affiliated with the Company in a group,<br />
in such a way that the interests of the Company and of<br />
those enterprises and of all parties involved in this are<br />
safeguarded in the best possible way, and that influences<br />
which could affect the independence and/or continuity<br />
and/or identity of the Company and those enterprises in<br />
breach of those interests are deterred to the best of the<br />
Foundation’s ability.<br />
Under the terms of an option agreement dated<br />
December 22, 2010 between the Company and the<br />
Foundation, the Foundation has been granted an option<br />
pursuant to which it may purchase a number of preference<br />
shares up to a maximum of the total number of ordinary<br />
shares outstanding at any given time.<br />
Voting Rights<br />
There are no restrictions on voting rights of ordinary<br />
and preference shares. Shareholders who hold shares<br />
on a predetermined record date (mandatory fixed at the<br />
twenty-eighth day prior to the day of the General Meeting<br />
of Shareholders) are entitled to attend and vote at the<br />
General Meeting of Shareholders regardless of a sale of<br />
shares after such date.<br />
As far as is known to AMG there is no agreement involving<br />
a shareholder of AMG that could lead to a restriction of<br />
the transferability of shares or of voting rights on shares,<br />
except as detailed below.<br />
Management Board<br />
The executive management of AMG is entrusted to<br />
its Management Board which is chaired by the Chief<br />
Executive Officer. The Articles of Association provide that<br />
the number of members of the Management Board shall<br />
be determined by the Supervisory Board. The members<br />
of the Management Board are appointed by the General<br />
Meeting of Shareholders for a maximum term of four<br />
years and may be re-appointed for additional terms not<br />
exceeding four years. The Supervisory Board is authorized<br />
to make a non-binding or binding nomination regarding<br />
the appointment of members of the Management Board.<br />
In the event of a binding nomination, the General Meeting<br />
of Shareholders appoints from a nomination of at least<br />
the number of persons prescribed by Dutch law (currently<br />
two) made by the Supervisory Board. A binding nomination<br />
means that the General Meeting of Shareholders may<br />
only appoint one of the nominated persons, unless the<br />
General Meeting of Shareholders rejects the nomination<br />
by an absolute majority (more than 50% of the votes cast)<br />
representing at least one-third of the issued share capital.<br />
If the Supervisory Board has not made a nomination,<br />
the appointment of the members of the Management<br />
Board is at the full discretion of the General Meeting of<br />
Shareholders. The General Meeting of Shareholders and<br />
the Supervisory Board may suspend a member of the<br />
Management Board at any time.<br />
A resolution of the General Meeting of Shareholders to<br />
suspend or dismiss a member of the Management Board<br />
requires an absolute majority (more than 50% of the<br />
votes cast), representing at least one-third of the issued<br />
share capital, unless the Supervisory Board has proposed<br />
the suspension or dismissal to the General Meeting of<br />
Shareholders, in which case an absolute majority is<br />
required but without any quorum requirement.<br />
The Management Board follows its own Rules of<br />
Procedure concerning the procedures for meetings,<br />
resolutions and similar matters. These Rules of<br />
Procedure are published on the Company’s website.<br />
The Company has rules to avoid and deal with conflicts<br />
of interest between the Company and members of the<br />
Management Board. The Articles of Association and<br />
the Rules of Procedure state that in the event of a legal<br />
act or a lawsuit between the Company and any of the<br />
members of the Management Board, the Company shall<br />
be represented by any other non-conflicted members<br />
of the Management Board or by a Supervisory Board<br />
member designated by the Supervisory Board. In<br />
addition, it is provided that the respective member of the<br />
Management Board shall not take part in the decisionmaking<br />
and voting in respect of such legal act or lawsuit,<br />
or any other subject whereby the respective member of<br />
58 Corporate Governance
the Management Board has a conflict of interest which<br />
is of material significance to the Company, and that any<br />
such legal act or subject require the approval of the<br />
Supervisory Board.<br />
The Rules of Procedure of the Management Board<br />
establish further rules on the reporting of (potential)<br />
conflicts of interest.<br />
Supervisory Board<br />
The Supervisory Board supervises the Management<br />
Board and its policies and the general course of affairs<br />
of the AMG Group. Under the two-tier corporate structure<br />
under Dutch law, the Supervisory Board is a separate<br />
body that is independent of the Management Board.<br />
Members of the Supervisory Board can neither be<br />
members of the Management Board nor an employee<br />
of the Company. The Supervisory Board in discharging<br />
its duties, will act in the interests of the Company and<br />
AMG Group taking into account the interests of all of<br />
the Company’s stakeholders. The Supervisory Board<br />
discusses and approves major management decisions<br />
and the Company’s strategy.<br />
The Supervisory Board has adopted its own Rules of<br />
Procedure concerning its own governance, committees,<br />
conflicts of interest etcetera. The Rules of Procedure<br />
are published on the Company’s website and include the<br />
charters of the committees to which the Supervisory<br />
Board has assigned certain preparatory tasks, while<br />
retaining overall responsibility. These committees are the<br />
Remuneration Committee, the Selection and Appointment<br />
Committee and the Audit Committee. The Supervisory<br />
board shall be assisted by the Company Secretary of the<br />
Company who shall be appointed by the Management<br />
Board after approval of the Supervisory Board has been<br />
obtained. The number of members of the Supervisory<br />
Board will be determined by the General Meeting of<br />
Shareholders with a minimum of three members.<br />
Members of the Supervisory Board shall be appointed for<br />
a maximum term of four years and may be reappointed<br />
for additional terms not exceeding four years. Unless the<br />
General Meeting of Shareholders provides otherwise, a<br />
member of the Supervisory Board cannot be reappointed<br />
for more than three terms of four years.<br />
The Supervisory Board is authorized to make a binding<br />
or non-binding nomination regarding the appointment of<br />
the members of the Supervisory Board. In the event of a<br />
binding nomination, the General Meeting of Shareholders<br />
appoints the members of the Supervisory Board from a<br />
nomination of at least the number of persons prescribed<br />
by Dutch law (currently two) made by the Supervisory<br />
Board. A binding nomination means that the General<br />
Meeting of Shareholders may only appoint one of the<br />
nominated persons, unless the General Meeting of<br />
Shareholders rejects the nomination with an absolute<br />
majority (more than 50% of the votes cast) representing<br />
at least one-third of the issued share capital. If the<br />
Supervisory Board has not made a nomination, the<br />
appointment of the members of the Management<br />
Board is at the full discretion of the General Meeting<br />
of Shareholders. The General Meeting of Shareholders<br />
may, at any time, suspend or remove members of the<br />
Supervisory Board. A resolution of the General Meeting<br />
of Shareholders to suspend or remove members of the<br />
Supervisory Board requires an absolute majority (more<br />
than 50% of the votes cast) representing at least one-third<br />
of the issued share capital, unless the Supervisory<br />
Board has proposed the suspension or dismissal, in<br />
which case an absolute majority is required, without any<br />
quorum requirement.<br />
As required under the Dutch Corporate Governance<br />
Code, the Company has formalized strict rules to avoid<br />
and deal with conflicts of interest between the Company<br />
and the members of the Supervisory Board, as further<br />
described in the Rules of Procedure of the Supervisory<br />
Board. Further information on the Supervisory Board and<br />
its activities is included in the Report of the Supervisory<br />
Board (pages 38–48 of this Annual Report).<br />
Each of the current members of the Supervisory Board<br />
has undertaken to AMG not to transfer or otherwise<br />
dispose of any shares granted as part of their annual<br />
remuneration until the earlier of the third anniversary of<br />
the date of grant and the first anniversary of the date on<br />
which he ceases to be a member of the Supervisory Board.<br />
General Meeting of Shareholders<br />
A General Meeting of Shareholders is held at least once<br />
per year. During the Annual Meeting, the Annual Report<br />
including the report of the Management Board, the annual<br />
(consolidated) financial statements and the report of<br />
the Supervisory Board are discussed as well as other<br />
matters pursuant to Dutch law or the Company’s Articles<br />
of Association. As a separate item on the agenda, the<br />
General Meeting of Shareholders is entrusted with the<br />
discharge of the members of the Management Board<br />
and the Supervisory Board from responsibility for the<br />
performance of their duties during the preceding financial<br />
year. The General Meeting of Shareholders is held in<br />
Amsterdam or Haarlemmermeer (Schiphol Airport), the<br />
Netherlands and takes place within six months from the<br />
end of the preceding financial year.<br />
Meetings are convened by public notice and by letter, or by<br />
use of electronic means of communication, to registered<br />
shareholders. Notice is given at least forty-two days prior<br />
to the date of the General Meeting of Shareholders. The<br />
Corporate Governance 59
main powers of the General Meeting of Shareholders<br />
are set forth in the Company’s Articles of Association<br />
which are published on the Company’s website and the<br />
applicable provisions of Dutch law.<br />
On May 12, 2010, the General Meeting of Shareholders<br />
resolved to authorize the Management Board for a<br />
period of 18 months from that date (until November 13,<br />
2011) as the corporate body which, subject to approval<br />
of the Supervisory Board is authorized to issue shares,<br />
including any grant of rights to subscribe to shares,<br />
with the power to exclude or restrict pre-emptive rights.<br />
This authorization allows the issue of up to 10% of the<br />
Company’s issued share capital as of December 31, 2009<br />
increased with 10% of the Company’s issued share capital<br />
as per December 31, 2009 in connection with or at the<br />
occasion of mergers, acquisitions or financial support<br />
arrangements.<br />
In addition on May 12, 2010 the General Meeting of<br />
Shareholders resolved to authorize the Management<br />
Board for a period of 18 months from that date (until<br />
November 13, 2011) as the corporate body which, subject<br />
to approval of the Supervisory Board, is authorized<br />
to effect acquisitions of its own shares by AMG. The<br />
number of shares to be acquired is limited to 10% of the<br />
Company’s issued share capital as of December 31, 2009<br />
taking into account the shares previously acquired and<br />
disposed of at the time of any new acquisition. Shares may<br />
be acquired through the stock exchange or otherwise, at<br />
a price between par value and 110% of the stock exchange<br />
price. The stock exchange price referred to in the previous<br />
sentence is the average closing price of the shares at<br />
Euronext Amsterdam on the five consecutive trading days<br />
immediately preceding the day of purchase by or for the<br />
account of the Company.<br />
Articles of Association<br />
The Company’s Articles of Association can be amended<br />
by a resolution of the General Meeting of Shareholders<br />
on a proposal of the Management Board which has been<br />
approved by the Supervisory Board. A resolution of the<br />
General Meeting of Shareholders to amend the Articles<br />
of Association which has not been taken on the proposal<br />
of the Management Board and the approval of the<br />
Supervisory Board, should be adopted by a majority of at<br />
least two-thirds of the votes cast in a meeting in which at<br />
least 50% of the issued share capital is represented.<br />
Corporate Social Responsibility<br />
AMG endorses and supports the definition of Corporate<br />
Social Responsibility as set by the World Business Council<br />
for Sustainable Development, being:<br />
“…the continuing commitment by business to behave<br />
ethically and contribute to economic development<br />
while improving the quality of life of the workforce and<br />
their families as well as of the local community and<br />
society at large”<br />
For AMG and its affiliated companies this translates into<br />
three main sustainable development objectives which the<br />
Company has formulated in connection with its financial<br />
objectives and its leading position at the heart of the<br />
global metallurgical industry: to be responsible stewards<br />
of the environment; to meet or exceed regulatory<br />
standards by engaging in ethical business practices and<br />
to be a valued member of the local economy, community<br />
and of society at large by contributing to solutions for<br />
increased energy consumption while addressing climate<br />
change. The Supervisory Board and the Management<br />
Board of the Company take continued guidance from these<br />
objectives when defining and implementing the Company’s<br />
strategic objectives.<br />
Decree on Article 10 of the Takeover Directive<br />
The information required by the Decree on Article 10<br />
of the Takeover Directive is included in this Corporate<br />
Governance section and the Report of the Supervisory<br />
Board which information is incorporated by reference in<br />
this Corporate Governance report.<br />
Below is an overview of the significant agreements to<br />
which the Company is a party, which are affected, changed<br />
or terminated subject to a condition of a change of control.<br />
The Company is a party to the following agreement that will<br />
be terminated under the condition of a change of control<br />
over the Company as a result of a public takeover offer.<br />
The Company’s Credit Facility Agreement (as amended)<br />
has a provision that requires the Company to repay<br />
the entire outstanding amount under its Credit Facility<br />
Agreement upon a change of control, as defined therein.<br />
The Company is also a party to the following agreements<br />
that will come into force upon a change of control<br />
pursuant to a public offer. Certain members of the<br />
Management Board have provisions in their contracts<br />
that pertain to a change of control. Additionally, the AMG<br />
Option Plan and the AMG Performance Share Unit Plan<br />
have provisions that permit the Supervisory Board to<br />
cancel or modify the options granted or performance<br />
share units awarded to Management Board members and<br />
other employees, upon a change of control.<br />
The Company is a party to an Option Agreement entered<br />
into with the Stichting Continuïteit AMG as further<br />
explained on page 58 above.<br />
60 Corporate Governance
Other than the above-mentioned agreements, the<br />
Company is not party to any other important agreements<br />
that will come into force, be amended or terminated upon<br />
a change of control pursuant to a public takeover offer.<br />
Compliance with the Dutch Corporate<br />
Governance Code<br />
In this chapter the Company discusses its compliance with<br />
the principles and provisions set forth in the Dutch Corporate<br />
Governance Code as amended in 2008 (hereinafter also<br />
referred to as the “Code”). In doing so, the outline and<br />
numbering of the Code is being followed.<br />
As a general statement the Company fully endorses the<br />
Corporate Governance Code’s principles and believes<br />
that virtually all best practice provisions as included in<br />
the Code are complied with. On certain matters involving<br />
the remuneration policy of the Company, the Company<br />
does not comply with the best practice provisions and it<br />
believes that it has sound reasons for doing so, which will<br />
be explained hereafter.<br />
Deviation from these best practice provisions stems<br />
from the specialized nature of the Company’s business,<br />
a reflection of local market practice in which executives<br />
may be employed and the recognition of pre-existing<br />
contractual agreements.<br />
AMG was formed in March 2007 through the merger<br />
of eight operating companies. The members of the<br />
Management Board had pre-existing contracts as<br />
executives of certain of the operating companies that<br />
formed AMG. These contracts reflect local market<br />
conditions and customary provisions in the countries<br />
in which the executives may have been employed. They<br />
have provisions that do not fully comply with the Code’s<br />
best practices. In view of the specialized nature of AMG’s<br />
business and the qualifications and expertise of the<br />
present members of the Management Board, AMG<br />
intends to honour its existing contractual commitments<br />
to those members of the Management Board, in order to<br />
retain their services and to maintain their commitment<br />
to the Company.<br />
The new remuneration policy for members of the<br />
Management Board was approved and adopted by the<br />
General Meeting of Shareholders in its Annual Meeting<br />
of May 13, 2009. This (revised) remuneration policy is<br />
published on the website of the Company under the<br />
heading Corporate Governance (hereafter referred to as<br />
“the Remuneration Policy”). Below the Company reviews<br />
in more detail to what extent its prevailing remuneration<br />
practice does not comply with the best practice provisions<br />
included in chapter II.2 of the Code.<br />
II.2.4<br />
Under the Company’s remuneration policy effective prior<br />
to 2009, the members of the Management Board have<br />
been granted unconditional options that do not have any<br />
performance criteria required to be met. Additionally,<br />
such options have a vesting schedule which permits a<br />
majority of the options to be exercised within the first<br />
three years after having been granted. Furthermore the<br />
members of the Management Board have been granted<br />
unconditional options, upon approval by the General<br />
Meeting of Shareholders in May 2009, in lieu of part of<br />
their base salary for 2009, as a measure to minimize cash<br />
expenditures by the Company. As a result the Company<br />
deviates from best practice provision II.2.4.<br />
II.2.5<br />
The Company has introduced under the Remuneration<br />
Policy so called performance share units (“PSUs”) for its<br />
Management Board members (as well as other senior<br />
executives). No Company shares have been or will be<br />
granted to Management Board members. The financial<br />
rationale and functioning of PSUs are explained in the<br />
Company’s remuneration policy, published on its website.<br />
PSUs pay out, if and when targets specified beforehand<br />
are met, after three (3) years from the date of allocation.<br />
The Company believes that this remuneration component<br />
does not violate any of the best practice provisions<br />
and spirit of the Code (the Code, incidentally, does not<br />
recognize performance share unit systems as such).<br />
However, by way of enhanced transparency, and because<br />
the Supervisory Board has decided to introduce<br />
a phased-in vesting scheme for the initial awards, it is<br />
felt appropriate to make specific reference to PSUs under<br />
this chapter.<br />
II.2.8<br />
Each member of the Management Board has a contract of<br />
employment with AMG as well as with a now-constituent<br />
entity of AMG Group prior to the formation of AMG. These<br />
contracts provide for payment of two years of base salary<br />
compensation in the event of termination by the Company<br />
without cause. In the case of Dr. Walter, his original<br />
contract, dated October 1, 2006, specified a term of five<br />
years; no reference is made to payments of severance in<br />
the event of termination. As a result the Company deviates<br />
from best practice provision II.2.8 for reasons explained<br />
above and in the Company’s Remuneration Policy.<br />
III.7.1<br />
A supervisory board member shall not be granted any<br />
shares and/or rights to shares by way of remuneration.<br />
Shareholders at the General Meeting of Shareholders<br />
held in May 2009 approved granting shares to members of<br />
the Supervisory Board as part of their remuneration, as<br />
further explained in the Company’s Remuneration Policy.<br />
Corporate Governance 61
III.7.2<br />
Any shares held by a Supervisory Board member in<br />
the Company on whose board he sits are long-term<br />
investments.<br />
The undertaking by members of the Supervisory Board<br />
not to transfer or otherwise dispose of shares in AMG’s<br />
share capital until the earlier of the third anniversary of<br />
the date of the grant and the first anniversary of the date<br />
on which such member ceases to be a member of the<br />
Supervisory Board is limited to shares granted as part<br />
of their annual remuneration and does not extend to any<br />
other shares in the Company held by such member.<br />
Conflicts of Interest<br />
Report on Transactions in 2010<br />
In June 2010, the Company acquired 15.4 million common<br />
shares of Timminco at a price of C$0.65 per share (at total<br />
cost of $9.7 million), as part of a C$13.1 million private<br />
placement by Timminco, the balance of which was fully<br />
subscribed by other investors. The proceeds of this private<br />
placement were used for general corporate purposes,<br />
including repayment of funds drawn on Timminco’s<br />
revolving credit facility.<br />
In December 2010, the Company renegotiated and<br />
extended the $5 million convertible senior subordinated<br />
promissory note issued in December 2009 by Bécancour<br />
Silicon Inc, a wholly owned subsidiary of Timminco (“BSI”).<br />
Under the new terms of this promissory note which<br />
is subordinated to the debt owed to Bank of America<br />
under Timminco’s credit facility, the note carries a 14%<br />
interest rate and matures on January 3, 2014 and has a<br />
conversion price of C$ 0.26 per share. The proceeds of<br />
this promissory note were used (upon issue in 2009) for<br />
working capital purposes.<br />
The transactions listed above (“Transactions”) were<br />
approved by the Management Board and the Supervisory<br />
Board in accordance with articles 11, 12 and 13 of<br />
the Rules of Procedure of the Management Board.<br />
Dr. Schimmelbusch, who also serves as Chairman and<br />
CEO of Timminco did not participate in the discussion<br />
on the vote on the Transactions in the meetings of the<br />
Management Board. Mr. Messman, who also serves as a<br />
non-executive Director of Timminco, did not participate<br />
in the discussion on the vote on the Transactions in the<br />
various meetings of the Supervisory Board. Accordingly,<br />
best practice provisions II.3.2 up to and including II.3.4 as<br />
well as best practice provisions III.6.1 up to and including<br />
III.6.3 of the Code have been complied with.<br />
No further conflicts of interest that were of material<br />
significance to the Company and/or members of the<br />
Management Board and Supervisory Board were reported<br />
in the period starting January 1, 2010 up to and including<br />
February 28, 2011 other than the conflicts of interest<br />
described above.<br />
Further during the period starting January 1st, 2010 up to<br />
and including February 28th, 2011, the Company did not<br />
enter into any material transaction with a shareholder<br />
holding an interest of 10% or more in the Company’s share<br />
capital. Accordingly the Company has complied with best<br />
practice provision III.6.4 of the Corporate Governance Code.<br />
Corporate Governance Statement<br />
The Decree of December 23, 2004 adopting further rules<br />
regarding the contents of the annual report, as amended<br />
and extended by the Decree of March 20, 2009 (“Decree”)<br />
requires that a statement is published annually by the<br />
Company on its compliance with Corporate Governance<br />
regulations in the Netherlands. The Company hereby<br />
submits that it has fully complied with this requirement<br />
by way of publication of this Annual Report and the<br />
specific references therein notably to the Report of the<br />
Management Board, Report of the Supervisory Board,<br />
the chapter on Risk Management and Internal Control,<br />
the chapter on Sustainable Development and the chapter<br />
on Corporate Governance, all of which are deemed to be<br />
incorporated by reference into the Company’s statement<br />
on corporate governance as required by the Decree.<br />
62 Corporate Governance
Financial Review<br />
Year ended December 31<br />
In thousands of US Dollars 2010 2009<br />
Revenue and expenses<br />
Advanced Materials revenue 616,267 429,083<br />
Engineering Systems revenue 245,652 320,530<br />
Graphit Kropfmühl revenue 128,576 117,834<br />
Total revenue 990,495 867,447<br />
Cost of sales 811,937 701,860<br />
Gross profit 178,558 165,587<br />
Selling, general and administrative expenses 128,934 137,537<br />
Restructuring and asset impairment expenses 1,025 9,500<br />
Environmental expense 6,421 3,998<br />
Other (income) expense, net (1,081) (6,009)<br />
Operating profit 43,259 20,561<br />
Revenue<br />
AMG’s revenue improved to $990.5 million in the year<br />
ended December 31, 2010 from $867.4 million in the year<br />
ended December 31, 2009, a 14% increase. 2010 was<br />
impacted by the benefits of the rebound in the economy<br />
as compared to 2009 which was a year of challenges.<br />
The Advanced Materials Division experienced the<br />
improvements in revenue and earnings that were expected<br />
based on the second half of 2009. Also as expected, the<br />
Engineering Systems Division was negatively impacted<br />
in the early part of 2010 by the deteriorating market for<br />
capital equipment. However, improvements were seen<br />
as order intake and order backlog improved throughout<br />
the second half. Graphit Kropfmühl continued to deliver<br />
consistent results throughout the year, driven by natural<br />
graphite volume and pricing.<br />
Advanced Materials’ 2010 revenue increased by<br />
$187.2 million, or 44%, from 2009, to $616.3 million.<br />
This was a direct result of increases in average selling<br />
prices and volumes for many products, most notably<br />
for antimony and titanium alloys.<br />
Engineering Systems’ order intake for 2010 was<br />
$280.8 million, up 53% from 2009. Despite this, the<br />
Engineering Systems’ 2010 revenue decreased by<br />
$74.9 million, or 23%, from 2009, to $245.7 million as a<br />
result of a low order backlog at the beginning of 2010<br />
and time delay of that backlog turning into revenue.<br />
Solar silicon systems revenue had the most rapid decline,<br />
with revenues declining by 53% year over year. The decline<br />
in furnace revenue was somewhat offset by improvements<br />
in own and operate revenue, which increased by over 50%<br />
due to the rebound in the automotive industry.<br />
Graphit Kropfmühl (“GK”) benefited from the natural<br />
graphite market in 2010. Revenues for this product line<br />
increased by 32%, driven by the improvement in industrial<br />
markets. Volumes increased by 25% and prices increased<br />
by 5%. Silicon metal revenue remained consistent year<br />
over year with volumes improving, but with lower pricing<br />
than in 2009 due to fixed price contracts which expired at<br />
the end of 2010.<br />
Gross profit<br />
AMG’s gross profit increased to $178.6 million in the<br />
year ended December 31, 2010 from $165.6 million in the<br />
year ended December 31, 2009, an 8% improvement. As<br />
a percentage of revenue, gross profit was 18.0% in 2010<br />
as compared to 19.1% in 2008. The decline in percentage<br />
was the effect of the mix of revenues. Engineering<br />
revenues, which historically provide higher gross margin,<br />
declined in the period while Advanced Materials revenues,<br />
which in total have lower gross margin, improved. The<br />
portfolio effect of these two different businesses provides<br />
consistency in AMG’s operational profitability. Advanced<br />
Materials 2010 gross profit increased by $46.9 million,<br />
or 98%, from 2009, to $94.7 million due to higher average<br />
selling prices and an increase in volumes of products,<br />
such as aluminum master alloys and antimony. Within<br />
Engineering Systems, gross margin decreased from 33%<br />
in 2009 to 29% in 2010. 2010 gross profit decreased by<br />
$35.7 million, or 34%, from 2009 to $70.1 million due to<br />
the significantly lower revenue and the resulting effect<br />
of diminished economies of scale. The gross margin<br />
contributed by Graphit Kropfmühl was $13.7 million in<br />
2010 as compared to $11.9 million in 2009 with natural<br />
graphite gross profit improving by 47%.<br />
Financial Review 63
Selling, general and administrative expenses<br />
Selling, general and administrative costs (“SG&A”) were<br />
$128.9 million in the year ended December 31, 2010 as<br />
compared to $137.5 million in the year ended December 31,<br />
2009. As a percentage of sales, SG&A costs improved to<br />
13% of sales in 2010 as compared to 16% of sales in 2009.<br />
The primary reasons for the decline were lower sharebased<br />
payment expense, lower research and development<br />
(“R&D”) expense and the reversal of a bad debt reserve.<br />
Those variances accounted for a $14.5 million decline<br />
in SG&A when comparing 2010 to 2009. These declines<br />
were offset by higher salaries and bonuses and higher<br />
professional fees. Personnel expenses decreased to<br />
$73.8 million in the year ended December 31, 2010 from<br />
$77.0 million in the year ended December 31, 2009. Due<br />
to improved performance in the year, salary and bonuses<br />
increased to $48.6 million in 2010 from $45.0 million in<br />
2009. Those costs were more than offset by the large<br />
decline in share-based payment expense. Due to the<br />
vesting of the options granted in 2007 and 2008, the<br />
largest portion of this expense was recognized through<br />
2009. Equity-settled option costs declined by $5.3 million<br />
year over year. The cash-settled expense also declined<br />
from $3.6 million in 2009 to $2.0 million in 2010. The<br />
Company incurs professional fees from global service<br />
providers for services including audit, tax planning and<br />
compliance and legal consultation. Professional fees were<br />
$19.2 million in 2010 as compared to $17.3 million in 2009,<br />
an 11% increase. The largest reason for this increase<br />
was related to amendments on the AMG credit facility,<br />
which increased legal expenses by $0.8 million. Additional<br />
consultants in certain operations also increased<br />
other professional fees by $1.0 million. Research and<br />
development expense declined to $6.0 million in the year<br />
ended December 31, 2010 as compared to $10.0 million in<br />
the year ended December 31, 2009. Engineering reduced<br />
its R&D spend during the year in order to right-size cash<br />
costs for the downturn in the business. All other SG&A<br />
expenses, such as travel and entertainment, insurance,<br />
occupancy, communication and bank fees decreased to<br />
$29.9 million in the year ended December 31, 2010 from<br />
$33.2 million in the year ended December 31, 2009. The<br />
primary reason for this decline was related to the reversal<br />
of bad debts. In 2009, a bad debt reserve was taken for a<br />
specific Engineering customer. This reserve was able to<br />
be reversed in 2010, resulting in a year over year variance<br />
of $3.6 million.<br />
Restructuring and asset impairment expenses<br />
Restructuring and asset impairment charges were<br />
$1.0 million in the year ended December 31, 2010 as<br />
compared to $9.5 million in 2009. In 2009, headcount<br />
reductions and facility closures were implemented<br />
globally as the businesses adapted to the slowing demand<br />
for products. These actions resulted in the $9.5 million<br />
charge. The continuation of one 2009 restructuring plan<br />
resulted in the $1.0 million charge in 2010.<br />
Environmental expense<br />
Environmental expense in 2010 primarily relates to<br />
two different environmental issues. The first portion<br />
of the expense relates to an adjustment to a purchase<br />
accounting reserve at GK. $3.1 million in expense was<br />
booked related to the recultivation provision at GK’s<br />
German mine. Revisions of estimates related to the<br />
decommissioning liability within the Company’s US<br />
operations accounted for $2.6 million of expense in 2010<br />
and $3.8 million of expense in 2009.<br />
Other income<br />
Other income for the year ended December 31, 2009 was<br />
primarily government grant income of $4.0 million within<br />
Engineering Systems and Graphit Kropfmühl. The terms<br />
of the most significant government grant were met during<br />
2009, which led to the decline in this income in the year<br />
ended December 31, 2010.<br />
Operating profit<br />
AMG’s operating profit increased to $43.3 million in the year<br />
ended December 31, 2010 from $20.6 million in the year<br />
ended December 31, 2009, a 110% improvement. The 2009<br />
results were severely impacted by the global recession.<br />
2010 saw the Advanced Materials Division completely<br />
rebound from its 2009 results while Engineering Systems<br />
only started to see its results rebound late in the year.<br />
Finance expenses<br />
The table below sets forth AMG’s net finance expense<br />
for the periods ended December 31, 2010 and 2009.<br />
Finance expense increased slightly during the year due<br />
to increasing debt levels offset by lower global rates.<br />
Finance income was positively impacted by income<br />
on notes receivable, a change in the discounting of a<br />
provision and finance income recognized on derivatives.<br />
64 Financial Review
In thousands of US Dollars Period ended December 31<br />
2010 2009<br />
Finance expense 18,727 18,419<br />
Finance (income) (5,429) (3,587)<br />
Foreign exchange loss (income) (2,799) 2,418<br />
Finance expense, net 10,499 17,250<br />
Income taxes<br />
The provision for income taxes decreased to $11.2 million<br />
for the year ended December 31, 2010 from $15.2 million<br />
for the period ended December 31, 2009. The decline in<br />
provision was primarily a result of the Company’s tax<br />
restructuring which was accomplished in 2009. Certain of<br />
the Company’s net operating losses were able to be used<br />
to offset income in profitable jurisdictions. The effective<br />
tax rate remains skewed due to the losses from AMG’s<br />
associates, primarily Timminco and Silmag. These losses<br />
were $19.4 million in 2010 and no tax benefit can be booked<br />
for these losses, which are booked on an equity basis.<br />
Net profit (loss)<br />
The Company recorded net profit attributable to<br />
shareholders of $2.4 million in the year ended<br />
December 31, 2010 as compared to a loss of $75.6 million<br />
in the year ended December 31, 2009. The 2009 results<br />
were primarily the result of Timminco’s equity losses as<br />
well as the loss recorded on discontinued operations.<br />
Liquidity and capital resources<br />
Sources of liquidity<br />
The Company’s sources of liquidity include cash and cash<br />
equivalents, cash from operations and amounts available<br />
under credit facilities. At December 31, 2010, the Company<br />
had $89.3 million in cash and cash equivalents and<br />
$47.8 million available on its revolving credit facility.<br />
Changes in the Company’s liquidity were due primarily to<br />
the investments in working capital, expansion projects<br />
and acquisitions for the year.<br />
In thousands of US Dollars 2010 2009<br />
Non-current loans and borrowings 187,813 168,319<br />
Current loans and borrowings 49,276 35,477<br />
Total debt 237,089 203,796<br />
Cash 89,311 117,016<br />
Net debt 147,778 86,780<br />
The table below summarizes the Company’s net cash provided by or used in its operating activities, investing activities<br />
and financing activities for the years ended December 31, 2010 and 2009.<br />
2010 2009<br />
Net cash provided by (used in):<br />
Operating activities (1,623) (2,091)<br />
Investing activities (62,572) (90,181)<br />
Financing activities 42,352 62,638<br />
Financial Review 65
Cash Flows<br />
Net cash used in operating activities was $1.6 million in<br />
the year ended December 31, 2010 as compared to cash<br />
used of $2.1 million in the year ended December 31, 2009, a<br />
$0.5 million improvement. Improved EBITDA was entirely<br />
utilized by increases in working capital and taxes paid.<br />
Net cash used in investing activities decreased to<br />
$62.6 million in the year ended December 31, 2010 from<br />
$90.2 million in the year ended December 31, 2009, a<br />
$27.6 million decline. 2009 investing activities included<br />
the discontinued operations of Timminco of $32.0 million.<br />
This was offset by increased capital expenditures of<br />
$7.5 million. The largest investing activities in the year<br />
ended December 31, 2010 included:<br />
• $16.5 million related the purchase of an antimony mine<br />
in Turkey<br />
• $3.7 million spent to acquire Mono² solar technology<br />
• $1.1 million invested in Engineering associates in<br />
France and India<br />
• $5.3 million to expand our spent catalyst processing<br />
capacity<br />
• $1.7 million to increase the capacity and efficiency<br />
of our own and operate business in Mexico<br />
• $1.3 million to expand the graphite milling capacity<br />
• $10.2 million in maintenance capital<br />
The remaining capital expenditures related to other<br />
smaller projects.<br />
Cash provided by financing activities was $42.4 million<br />
in the year ended December 31, 2010 as compared to<br />
$62.6 million in the year ended December 31, 2009.<br />
The cash provided by financing activities was lower in<br />
2009 due to exclusion of Timminco which had $47.6 million<br />
of financing in 2009. AMG did have increased borrowing<br />
within its core subsidiaries in 2010. Funds were used for<br />
working capital and capital projects.<br />
Outlook<br />
AMG improved its market position for a number of<br />
materials and metals technologies used in the end<br />
markets of Aerospace, Energy, Infrastructure and<br />
Specialty Metals and Chemicals during 2010. These<br />
activities combined with improving markets should<br />
generate continued revenue and earnings growth in<br />
2011. The Advanced Materials division’s acquisition of<br />
the antimony mine and smelter, cost reductions made in<br />
the aerospace master alloys and coatings products, the<br />
acquisition of aluminum alloy producer KB Alloys, LLC<br />
and rising prices and demand for tantalum and aerospace<br />
master alloys should yield double digit percentage<br />
revenue growth for this division in 2011. The Engineering<br />
Systems division began 2011 with a 13% larger order<br />
backlog than it began 2010 due to improved demand in the<br />
specialty steel and solar industries. This should result in<br />
a revenue growth rate during 2011 similar to the current<br />
increase in order backlog; however, margin pressure may<br />
increase. We expect strengthening demand for natural<br />
graphite and improved pricing to result in revenue growth<br />
at Graphit Kropfmühl in 2011. The growth in revenue<br />
across all business segments combined with ongoing<br />
capital investments to improve efficiencies should result<br />
in an increased EBITDA margin in 2011.<br />
66 Financial Review
Financial Statements<br />
Financial Statements<br />
Consolidated Income Statement 68<br />
Consolidated Statement of Comprehensive Income 69<br />
Consolidated Statement of Financial Position 70<br />
Consolidated Statement of Changes in Equity 71<br />
Consolidated Statement of Cash Flows 72<br />
Notes to the Consolidated Financial Statements<br />
1. Reporting entity 73<br />
2. Basis of preparation 76<br />
3. Significant accounting policies 77<br />
4. Segment reporting 91<br />
5. Acquisitions 94<br />
6. Discontinued operations 95<br />
7. Revenue 96<br />
8. Other income 96<br />
9. Personnel expenses 96<br />
10. Finance income and expense 97<br />
11. Income tax 97<br />
12. Exceptional items 100<br />
13. Property, plant and equipment 101<br />
14. Intangible assets 103<br />
15. Associates and joint ventures 105<br />
16. Inventories 107<br />
17. Trade and other receivables 107<br />
18. Other assets 108<br />
19. Restricted cash 109<br />
20. Cash and cash equivalents 109<br />
21. Capital and reserves 109<br />
22. Earnings per share 110<br />
23. Loans and borrowings 111<br />
24. Short term bank debt 112<br />
25. Employee benefits 112<br />
26. Share-based payments 118<br />
27. Provisions 120<br />
28. Government grants 122<br />
29. Other liabilities 123<br />
30. Trade and other payables 123<br />
31. Financial risk management objectives and policies 123<br />
32. Financial instruments 128<br />
33. Leases 132<br />
34. Capital commitments 133<br />
35. Contingencies 133<br />
36. Related parties 134<br />
37. Subsequent events 138<br />
Other Information 147<br />
Independent Auditor’s Report 148<br />
Shareholder Information 149<br />
Section Information Here B
Consolidated Income Statement<br />
For the year ended December 31 Note 2010 2009<br />
In thousands of US Dollars<br />
Continuing operations<br />
Revenue 7 990,495 867,447<br />
Cost of sales 811,937 701,860<br />
Gross profit 178,558 165,587<br />
Selling, general and administrative expenses 128,934 137,537<br />
Restructuring expense 27 423 7,782<br />
Asset impairment expense 13 602 1,718<br />
Environmental expense 27 6,421 3,998<br />
Other expenses 260 173<br />
Other income 8 (1,341) (6,182)<br />
Operating profit 43,259 20,561<br />
Finance expense 10 18,727 18,419<br />
Finance income 10 (5,429) (3,587)<br />
Foreign exchange (gain) loss 10 (2,799) 2,418<br />
Net finance costs 10 10,499 17,250<br />
Share of loss of associates and joint ventures 15 (19,405) (31,958)<br />
Profit (loss) before income tax 13,355 (28,647)<br />
Income tax expense 11 11,207 15,205<br />
Profit (loss) for the year from continuing operations 2,148 (43,852)<br />
Loss after tax for the year from discontinued operations 6 – (54,378)<br />
Profit (loss) for the year 2,148 (98,230)<br />
Attributable to:<br />
Shareholders of the Company 2,414 (75,642)<br />
Non-controlling interests (266) (22,588)<br />
2,148 (98,230)<br />
Earnings (loss) per share<br />
Basic earnings (loss) per share 22 0.09 (2.82)<br />
Diluted earnings (loss) per share 22 0.09 (2.82)<br />
Earnings (loss) per share from continuing operations<br />
Basic earnings (loss) per share from continuing operations 22 0.09 (1.77)<br />
Diluted earnings (loss) per share from continuing operations 22 0.09 (1.77)<br />
The notes are an integral part of these consolidated financial statements.<br />
68 Consolidated Income Statement
Consolidated Statement of Comprehensive Income<br />
For the year ended December 31 Note 2010 2009<br />
In thousands of US Dollars<br />
Profit (loss) for the period 2,148 (98,230)<br />
Exchange differences on translation of foreign operations 21 (4,311) 7,908<br />
Net gain on cash flow hedges, net of tax 21 1,865 13,435<br />
Other comprehensive loss 21 (298) (76,887)<br />
Attributable to:<br />
Shareholders of the Company 1,723 (57,731)<br />
Non-controlling interests (2,021) (19,156)<br />
The notes are an integral part of these consolidated financial statements.<br />
Consolidated Statement of Comprehensive Income 69
Consolidated Statement of Financial Position<br />
As at December 31 Note 2010 2009<br />
In thousands of US Dollars<br />
Assets<br />
Property, plant and equipment 13 228,612 211,022<br />
Intangible assets 14 27,002 28,253<br />
Investments in associates and joint ventures 15 25,186 34,794<br />
Derivative financial instruments 32 5,199 1,718<br />
Deferred tax assets 11 22,107 10,912<br />
Restricted cash 19 12,528 13,263<br />
Notes receivable 32 322 5,542<br />
Other assets 18 15,372 11,980<br />
Total non-current assets 336,328 317,484<br />
Inventories 16 207,204 193,378<br />
Trade and other receivables 17 175,421 147,787<br />
Derivative financial instruments 32 5,731 4,954<br />
Other assets 18 41,080 30,359<br />
Cash and cash equivalents 20 89,311 117,016<br />
Total current assets 518,747 493,494<br />
Total assets 855,075 810,978<br />
Equity<br />
Issued capital 741 725<br />
Share premium 381,636 379,518<br />
Other reserves 36,158 31,284<br />
Retained earnings (deficit) (196,481) (198,897)<br />
Equity attributable to shareholders of the Company 222,054 212,630<br />
Non-controlling interests 11,911 15,793<br />
Total equity 21 233,965 228,423<br />
Liabilities<br />
Loans and borrowings 23 187,813 168,319<br />
Employee benefits 25 88,372 91,358<br />
Provisions 27 20,607 14,862<br />
Government grants 28 642 669<br />
Other liabilities 29 5,517 7,984<br />
Derivative financial instruments 32 698 1,339<br />
Deferred tax liabilities 11 25,436 26,395<br />
Total non-current liabilities 329,085 310,926<br />
Loans and borrowings 23 4,254 3,464<br />
Short term bank debt 24 45,022 32,013<br />
Government grants 28 175 234<br />
Other liabilities 29 43,287 46,179<br />
Trade and other payables 30 102,253 69,791<br />
Derivative financial instruments 32 1,754 6,048<br />
Advance payments 7 49,597 54,764<br />
Current taxes payable 11 24,979 36,050<br />
Provisions 27 20,704 23,086<br />
Total current liabilities 292,025 271,629<br />
Total liabilities 621,110 582,555<br />
Total equity and liabilities 855,075 810,978<br />
The notes are an integral part of these consolidated financial statements.<br />
70 Consolidated Statement of Financial Position
Consolidated Statement of Changes in Equity<br />
In thousands of US Dollars<br />
Issued<br />
capital<br />
(note 21)<br />
Equity attributable to shareholders of the parent<br />
Share<br />
premium<br />
Other<br />
reserves<br />
(note 21)<br />
Retained<br />
deficit<br />
Total<br />
Noncontrolling<br />
interests<br />
Balance at January 1, 2009 724 379,297 (2,215) (123,110) 254,696 57,115 311,811<br />
Foreign currency translation – – 4,456 – 4,456 3,452 7,908<br />
Gain (loss) on cash flow hedges, net of tax – – 13,455 – 13,455 (20) 13,435<br />
Net income recognized directly in equity – – 17,911 – 17,911 3,432 21,343<br />
Total<br />
equity<br />
Results from continuing operations – – – (47,462) (47,462) 3,610 (43,852)<br />
Results from discontinuing operations – – – (28,180) (28,180) (26,198) (54,378)<br />
Loss for the year – – – (75,642) (75,642) (22,588) (98,230)<br />
Total comprehensive income (loss) for the year – – 17,911 (75,642) (57,731) (19,156) (76,887)<br />
Issuance of shares to Supervisory board 1 400 – – 401 – 401<br />
Share-based payment activity at subsidiary – – 1,559 – 1,559 1,559<br />
Equity-settled share-based payments – – 14,029 – 14,029 – 14,029<br />
Deemed disposal of non-controlling interest – – – – – (22,166) (22,166)<br />
Other – (179) – (145) (324) – (324)<br />
Balance at December 31, 2009 725 379,518 31,284 (198,897) 212,630 15,793 228,423<br />
Balance at January 1, 2010 725 379,518 31,284 (198,897) 212,630 15,793 228,423<br />
Foreign currency translation – – (2,556) – (2,556) (1,755) (4,311)<br />
Gain on cash flow hedges, net of tax – – 1,865 – 1,865 – 1,865<br />
Net loss recognized directly in equity – – (691) – (691) (1,755) (2,446)<br />
Profit (loss) for the year – – – 2,414 2,414 (266) 2,148<br />
Total comprehensive (loss) income for the year – – (691) 2,414 1,723 (2,021) (298)<br />
Issuance of shares to Supervisory board 1 272 – – 273 – 273<br />
Issuance of shares for acquisition of<br />
non-controlling interest 15 1,846 – – 1,861 (1,861) –<br />
Equity-settled share-based payments – – 5,565 – 5,565 – 5,565<br />
Other – – – 2 2 – 2<br />
Balance at December 31, 2010 741 381,636 36,158 (196,481) 222,054 11,911 233,965<br />
The notes are an integral part of these consolidated financial statements.<br />
Consolidated Statement of Changes in Equity 71
Consolidated Statement of Cash Flows<br />
For the year ended December 31 Note 2010 2009<br />
In thousands of US Dollars<br />
Cash flows used in operating activities<br />
Income (loss) for the period from continuing operations 2,148 (43,852)<br />
Loss for the period from discontinued operations 6 – (54,378)<br />
Income (loss) for the period 2,148 (98,230)<br />
Adjustments to reconcile income (loss) to net cash flows:<br />
Non-cash:<br />
Depreciation and amortization 13, 14 25,009 23,758<br />
Restructuring expense 27 423 7,782<br />
Asset impairment expense 13 602 1,718<br />
Environmental expense 27 6,421 3,998<br />
Net finance costs 10 10,499 17,250<br />
Share of loss of associates and joint ventures 15 19,405 31,958<br />
Loss on sale or disposal of property, plant and equipment 13 262 6,253<br />
Equity-settled share-based payment transactions 26 6,362 13,729<br />
Cash-settled share-based payment transactions 26 1,964 3,605<br />
Income tax expense 11 11,207 15,205<br />
Working capital adjustments<br />
Change in inventories (23,774) 45,338<br />
Change in trade and other receivables (40,033) (564)<br />
Change in prepayments (12,248) 12,490<br />
Change in trade payables, provisions, and other liabilities 35,488 (97,919)<br />
Change in government grants 28 (17) (7,783)<br />
Other 3,936 5,934<br />
Interest paid 10 (15,334) (15,289)<br />
Interest received 10 1,496 2,468<br />
Income tax paid, net 11 (35,439) (9,711)<br />
Cash flows from discontinued operations 6 – 35,919<br />
Net cash flows used in operating activities (1,623) (2,091)<br />
Cash flows used in investing activities<br />
Proceeds from sale of property, plant and equipment 13 983 129<br />
Asset acquisitions 5 (20,154) –<br />
Acquisition of property, plant and equipment and intangibles 13, 14 (32,973) (25,532)<br />
Related party loans 36 264 (5,262)<br />
Investments in/acquisition of associates 15 (10,765) (28,943)<br />
Change in restricted cash 19 151 1,410<br />
Other (78) 56<br />
Cash flows used in discontinued operations 6 – (32,039)<br />
Net cash flows used in investing activities (62,572) (90,181)<br />
Cash flows from financing activities<br />
Proceeds from issuance of debt 23, 24 45,546 30,175<br />
Repayment of borrowings 23, 24 (3,432) (15,785)<br />
Other 238 670<br />
Cash flows from discontinued operations 6 – 47,578<br />
Net cash flows from financing activities 42,352 62,638<br />
Net decrease in cash and cash equivalents (21,843) (29,634)<br />
Cash and cash equivalents at January 1 117,016 143,473<br />
Effect of exchange rate fluctuations on cash held (5,862) 3,177<br />
Cash and cash equivalents at December 31 20 89,311 117,016<br />
The notes are an integral part of these consolidated financial statements.<br />
72 Consolidated Statement of Cash Flows
Notes to the Consolidated<br />
Financial Statements<br />
1. Reporting entity<br />
The consolidated financial statements of AMG Advanced<br />
Metallurgical Group N.V. (herein referred to as “ the<br />
Company”, “AMG NV” or “AMG”) for the year ended<br />
December 31, 2010 were authorized for issuance in<br />
accordance with a resolution of the Supervisory Board<br />
on March 31, 2011.<br />
AMG is domiciled in the Netherlands. The address of<br />
the Company’s registered office is WTC Amsterdam,<br />
Toren C, Strawinskylaan 1343, 1077 XX Amsterdam.<br />
The consolidated financial statements of the Company<br />
as at and for the year ended December 31, 2010 comprise<br />
the Company and the companies that comprise its<br />
subsidiaries (together referred to as the “Group”)<br />
and the Company’s interest in associates and jointly<br />
controlled entities.<br />
AMG was incorporated in the Netherlands as a public<br />
limited liability company on November 21, 2006. In July<br />
2007, the Company completed an initial public offering<br />
(“IPO”) of 9,333,409 shares, which are listed on Euronext,<br />
Amsterdam the Netherlands.<br />
AMG is organized under three reportable segments:<br />
Advanced Materials, Engineering Systems and Graphit<br />
Kropfmühl.<br />
The subsidiaries that make up these three operating<br />
segments are primarily located in Europe, North America<br />
and South America. The Advanced Materials segment<br />
manufactures and sells high-quality specialty metals,<br />
alloys and metallic chemicals which are essential<br />
to the production of high-performance aluminum<br />
and titanium alloys, superalloys, steel and certain<br />
non-metallic materials for various applications in the<br />
Energy, Aerospace, Infrastructure, Specialty Metals and<br />
Chemicals end markets (see note 4). The Engineering<br />
Systems segment designs, engineers and produces<br />
advanced vacuum furnace systems and operates vacuum<br />
heat treatment facilities. It sells vacuum furnace systems<br />
to customers in the aerospace, energy (including solar<br />
and nuclear), transportation, electronics, superalloys and<br />
specialty steel industries. This segment also provides<br />
vacuum heat processing on a tolling basis to customers<br />
through its “Own & Operate” facilities equipped with<br />
vacuum heat treatment furnaces. The Graphit Kropfmühl<br />
segment manufactures silicon metal which is used in the<br />
Energy and Specialty Metals and Chemicals end markets.<br />
It also specializes in the extraction, processing and<br />
refining of natural crystalline graphite for a wide range of<br />
energy saving industrial applications.<br />
Timminco was deconsolidated as of September 28,<br />
2009, when the Company’s ownership went from 50.8%<br />
to 47.9%. Timminco primarily produces silicon metal,<br />
including solar grade silicon, which improves conductivity,<br />
provides corrosion resistance and increases harness<br />
for the electronic, solar-photovoltaic, chemical and<br />
aluminum industries. Timminco’s activity prior to the<br />
loss of control is recognized as discontinued operations<br />
in the comparable periods in the income statement and<br />
statement of cash flows. See note 6.<br />
These financial statements represent the consolidated<br />
financial statements of the Company. These consolidated<br />
financial statements as of December 31, 2010 present the<br />
consolidated financial position, results of operations and<br />
cash flows of the Company and its subsidiaries.<br />
The parent company financial statements are prepared<br />
in accordance with part 9, Book 2, article 362.8 of the<br />
Netherlands Civil Code. In accordance with part 9, Book 2,<br />
article 402 of the Netherlands Civil Code, the parent<br />
company income statement has been condensed.<br />
Notes to Consolidated Financial Statements 73
The consolidated financial statements of the Company include the accounts of all entities when a direct or indirect<br />
controlling interest exists through voting rights or qualifying variable interests at the reporting dates. The following<br />
table includes all entities in which AMG has any ownership interest.<br />
Percentage held<br />
(directly or indirectly)<br />
by the Company<br />
Percentage held<br />
(directly or indirectly)<br />
by the Company<br />
Name Country of incorporation December 31, 2010 December 31, 2009<br />
ABS Apparate-und Behälterbau Staßfurt GmbH Germany 49 49<br />
<strong>ALD</strong> Holcroft <strong>Vacuum</strong> <strong>Technologies</strong> Co. United States 50 50<br />
<strong>ALD</strong> Industrie-und Montagepark Staaken GmbH Germany 51 51<br />
<strong>ALD</strong> Own & Operate GmbH Germany 100 100<br />
<strong>ALD</strong> <strong>Technologies</strong> Polska S.z.o.o Poland 100 100<br />
<strong>ALD</strong> Thermal Treatment, Inc. United States 100 100<br />
<strong>ALD</strong> Thermo <strong>Technologies</strong> Far East Co., Ltd. Japan 100 100<br />
<strong>ALD</strong> Tratamientos Termicos S.A. Mexico 100 100<br />
<strong>ALD</strong> <strong>Vacuum</strong> <strong>Technologies</strong> GmbH Germany 100 100<br />
<strong>ALD</strong> <strong>Vacuum</strong> <strong>Technologies</strong> Inc. United States 100 100<br />
<strong>ALD</strong> <strong>Vacuum</strong> <strong>Technologies</strong> Ltd. United Kingdom 100 100<br />
<strong>ALD</strong> <strong>Vacuum</strong> <strong>Technologies</strong> Singapore PTE Ltd. Singapore 100 100<br />
<strong>ALD</strong> Vakuumnyje Technologii OOO Russia 100 100<br />
AMG Advanced Metallurgical Group Investment BV Netherlands 100 100<br />
AMG Brazilian Holding BV Netherlands 100 100<br />
AMG Coating <strong>Technologies</strong> GmbH Germany 100 100<br />
AMG Conversion Ltd Canada 100 100<br />
AMG Dutch Holdings CV Netherlands 100 –<br />
AMG Euro Holdings CV Netherlands 100 100<br />
AMG Idealcast Solar Corporation United States 100 –<br />
AMG Invest GmbH Germany 100 100<br />
Benda-Lutz-Alpoco Sp.z o.o. Poland 51 51<br />
Bogala Graphite Lanka Plc. (a) Sri Lanka 88 79.52<br />
Bostlan S.A. Spain 25 25<br />
Branwell Graphite Ltd. United Kingdom 88 79.52<br />
Companhia Industrial Fluminense Mineracao S.A. Brazil 100 100<br />
Dynatech Furnaces Private Ltd. India 30 –<br />
Ecopedras LTA Portugal 100 –<br />
Edelgraphit GmbH Germany 88 79.52<br />
EsteR-Technologie GmbH Germany 50.2 50.2<br />
EsteR-Separation GmbH Germany 60 60<br />
Fair Deal Trading (Pvt.) Ltd. (a) Sri Lanka 88 79.52<br />
FNE Forschungsinstitut für Nichteisen-Metalle GmbH Germany 100 100<br />
Furnaces Nuclear Applications Grenoble S.A. France 100 100<br />
GfE Fremat GmbH Germany 100 100<br />
GfE Gesellschaft für Elektrometallurgie mbH Germany 100 100<br />
GfE Materials Technology Inc. United States 100 100<br />
GfE Metalle und Materialien GmbH Germany 100 100<br />
GfE Unterstützungskasse GmbH Germany 100 100<br />
GK Asia Ltd. (formerly Mutual Sources Ltd) China 88 79.52<br />
GK Graphit Kropfmühl GmbH Germany 88 79.52<br />
Grafite Kropfmuehl de Mocambique, Limitada (b) Mocambique 97.5 –<br />
Graphit Kropfmühl AG Germany 88 79.52<br />
Graphite Tỳn spol. s r.o. Czech Republic 88 79.52<br />
Korin Grundstücks gesellschaft GmbH & Co. Projekt 30 KG Germany 94.9 94.9<br />
London & Scandinavian Metallurgical Co Limited United Kingdom 100 100<br />
LSM Brasil S.A. (formerly Companhia Industrial Fluminense) Brazil 100 100<br />
LSM Holdings BV Netherlands 100 100<br />
74 Notes to Consolidated Financial Statements
Percentage held<br />
(directly or indirectly)<br />
by the Company<br />
Percentage held<br />
(directly or indirectly)<br />
by the Company<br />
Name Country of incorporation December 31, 2010 December 31, 2009<br />
LSM (Jiaxing) Co Ltd China 100 100<br />
Metallurg Delaware Holding Company United States 100 100<br />
Metallurg Europe Limited United Kingdom 100 100<br />
Metallurg European Holdings LLC United States 100 100<br />
Metallurg Holdings Corporation United States 100 100<br />
Metallurg Holdings Inc. United States 100 100<br />
Metallurg, Inc. United States 100 100<br />
Metallurg International Holdings LLC United States 100 100<br />
Metallurg Mexico S.A. de C.V. Mexico 100 100<br />
Metallurg Servicios S.A. de R.L. de C.V. Mexico 100 100<br />
Metallurg Vanadium Corporation United States 100 100<br />
New Jersey Renewables Corporation United States 100 100<br />
Produits Chimiques de Lucette S.A.S. France 100 100<br />
Qingdao Kropfmuehl l Graphite Co. Ltd. China 88 79.52<br />
Qingdao Kropfmuehl Trading Co. Ltd. China – 79.52<br />
RW silicium GmbH Germany 88 79.52<br />
Share Investments (Pvt.) Ltd. Sri Lanka 88 79.52<br />
Shieldalloy Metallurgical Corporation United States 100 100<br />
Silmag DA Norway 50 50<br />
Société Industrielle et Chimique de l’Aisne S.A.S. France 100 100<br />
Suda Maden A.S. Turkey 99.99 –<br />
Sudamin France S.A.S France 100 100<br />
Sudamin Holding SPRL Belgium 100 100<br />
Sudamin IT S.A.R.L. France 100 100<br />
Sudamin SPRL Belgium 100 100<br />
Technologie-und Gründer-zentrum GmbH Germany 2.5 2.5<br />
The Aluminium Powder Company Limited United Kingdom 100 100<br />
Thermique Industrie Vide France 30 –<br />
Timminco Limited (c) Canada 42.5 42.5<br />
VACUHEAT GmbH Germany 100 100<br />
VACUHEAT Verwaltungs GmbH Germany 100 100<br />
Zimbabwe German Graphite Mines, Pvt. Ltd. (d) Zimbabwe 88 –<br />
(a)<br />
(b)<br />
(c)<br />
(d)<br />
Bogala Graphite and Fair Deal Trading are 90.4% owned by Graphit Kropfmühl, of which the Company owns 88%. Therefore, the<br />
Company indirectly holds 79.6% of these companies.<br />
Grafite Kropfmuehl de Mocambique, Limitada is a holding company 97.5% owned by Graphit Kropfmühl, of which the Company owns<br />
88%. Therefore, the Company indirectly holds 85.8% of this company.<br />
Timminco is a significant associate. For a complete list of all Timminco subsidiaries, please refer to the Timminco financial statements.<br />
Zimbabwe German Graphite Mines, Pvt. Ltd. is 50% owned by Graphit Kropfmühl, of which the Company owns 88%. Therefore, the<br />
Company indirectly holds 44% of this company. This company is not recognized according to the equity method of accounting as no<br />
decisive influence can be exerted on the business and financial policy of the Company due to political reasons.<br />
Notes to Consolidated Financial Statements 75
2. Basis of preparation<br />
(a) Statement of compliance<br />
EU law (IAS Regulation EC 1606/2002) requires that the<br />
annual Consolidated Financial Statements of the Company<br />
for the year ending December 31, 2010 be prepared in<br />
accordance with accounting standards adopted and<br />
endorsed by the European Union (“EU”) further to the IAS<br />
Regulation (EC 1606/2002) (further referred to as “IFRS,<br />
as endorsed by the EU”).<br />
The consolidated financial statements of AMG NV and<br />
its subsidiaries have been prepared in accordance with<br />
International Financial Reporting Standards (“IFRS”) as of<br />
December 31, 2010 as adopted by the EU.<br />
(b) Basis of measurement<br />
The consolidated financial statements have been prepared<br />
on the historical cost basis except for derivative financial<br />
instruments and financial instruments held for trading,<br />
which are measured at fair value. The carrying value of<br />
recognized assets and liabilities that are designated as<br />
hedged items in fair value hedges that would otherwise<br />
be carried at cost, are adjusted to record changes in the<br />
fair value attributable to the risks that are being hedged<br />
in effective hedge relationships. The methods used to<br />
measure fair values are discussed further in note 3.<br />
All amounts included in the consolidated financial<br />
statements and notes are presented in US Dollars and<br />
rounded to the nearest Dollar in thousands except for<br />
share amounts and where otherwise indicated.<br />
(c) Use of estimates and judgments<br />
The preparation of financial statements requires<br />
management to make judgments, estimates and<br />
assumptions that affect the application of accounting<br />
policies and the reported amounts of assets, liabilities,<br />
income and expenses. Actual results may differ from<br />
these estimates.<br />
Estimates and underlying assumptions are reviewed on<br />
an ongoing basis. Revisions to accounting estimates are<br />
recognized in the period in which the estimate is revised<br />
and in any future periods affected.<br />
In particular, information about significant areas of<br />
estimation uncertainty and critical judgments in applying<br />
accounting policies that have the most significant effect<br />
on the amount recognized in the financial statements are<br />
described in the following notes:<br />
• note 7—determination of furnace construction contract<br />
revenue<br />
• note 11—tax<br />
• note 14—measurement of the recoverable amounts of<br />
assets and cash-generating units<br />
• note 25—measurement of defined benefit obligations<br />
• note 26—measurement of share-based payments<br />
• note 27—measurement of provisions<br />
• note 32—measurement of financial instruments<br />
Key sources of estimation uncertainty<br />
The key assumptions concerning the future, and other<br />
key sources of estimation uncertainty at the reporting<br />
date that have a significant risk of causing a material<br />
adjustment to the carrying amounts of assets and<br />
liabilities within the next financial year, are discussed<br />
below or in the relevant note:<br />
Determination of furnace construction contract revenue<br />
Revenue related to furnace construction contracts<br />
is recorded based on the estimated percentage of<br />
completion of contracts as determined by management.<br />
Significant management judgment is required to<br />
determine this percentage of completion. Total percentage<br />
of completion revenue for the year ended December 31,<br />
2010 was $141,075 (2009: $200,522).<br />
Tax<br />
Uncertainties exist with respect to the interpretation<br />
of complex tax regulations and the amount and timing<br />
of future taxable income. Given the wide range of<br />
international business relationships and the longterm<br />
nature and complexity of existing contractual<br />
agreements, differences arising between the actual<br />
results and the assumptions made, or future changes to<br />
such assumptions, could necessitate future adjustments<br />
to taxable income and expense already recorded. The<br />
Company establishes provisions, based on reasonable<br />
estimates, for possible consequences of audits by the<br />
tax authorities of the respective countries in which it<br />
operates. The amount of such provisions is based on<br />
various factors, such as experience of previous tax audits<br />
and differing interpretations of tax regulations by the<br />
taxable entity and the responsible tax authority. Such<br />
differences of interpretation may arise on a wide variety<br />
of issues depending on the conditions prevailing in the<br />
respective subsidiary’s domicile.<br />
Deferred tax assets are recognized for all unused tax<br />
losses to the extent that it is probable that taxable<br />
profit will be available against which the losses can be<br />
utilized. Significant management judgment is required<br />
to determine the amount of deferred tax assets that can<br />
be recognized, based upon the likely timing and level of<br />
future taxable profits, together with future tax planning<br />
strategies. The carrying value of recognized tax losses at<br />
December 31, 2010 was $6,105 (2009: $6,956). There are<br />
significant unrecognized tax losses as described in more<br />
detail in note 11.<br />
76 Notes to Consolidated Financial Statements
Measurement of the recoverable amounts of assets and<br />
cash-generating units<br />
Goodwill<br />
The determination of whether goodwill is impaired<br />
requires an estimate of the recoverable amount of the<br />
cash-generating unit or group of cash-generating units to<br />
which the goodwill has been allocated. The recoverable<br />
amount is defined as the higher of a cash-generating<br />
unit’s fair value less costs to sell and its value in use. For<br />
Advanced Materials, <strong>ALD</strong> and Graphit Kropfmühl, the<br />
recoverable amount was determined as the value in use.<br />
The value in use requires the entity to estimate the future<br />
cash flows expected to arise from the cash-generating<br />
units or group of cash-generating units and to discount<br />
these cash flows with a risk adjusted discount rate. The<br />
carrying amount of goodwill at December 31, 2010 was<br />
$21,704 (2009: $23,325).<br />
Measurement of defined benefit obligations<br />
The cost of defined benefit pension plans is determined<br />
using actuarial valuations. The actuarial valuations involve<br />
making assumptions about discount rates, expected rates<br />
of return on assets, future salary increases, mortality<br />
rates and future pension increases. Due to the longterm<br />
nature of these plans, such estimates are subject<br />
to significant uncertainty. The net employee liability at<br />
December 31, 2010 was $88,372 (2009: $91,358).<br />
Measurement of share-based payments<br />
The group measures the cost of cash-settled and equitysettled<br />
transactions with employees by reference to<br />
the fair value of the equity instruments at the date at<br />
which they are granted. Estimating fair value requires<br />
determining the most appropriate valuation model for a<br />
grant of equity instruments, which is dependent on the<br />
terms and conditions of the grant. This also requires<br />
determining the most appropriate inputs into the valuation<br />
model including the expected life of the option, volatility,<br />
and dividend yield and making assumptions about them.<br />
Equity-settled transactions maintain the same fair value<br />
throughout the life of the option, while the fair value<br />
of cash-settled transactions are remeasured at each<br />
reporting date. The assumptions and model used in<br />
determining the fair value of share-based payments are<br />
disclosed in note 26.<br />
Measurement of provisions<br />
Provisions have been recorded with respect to<br />
environmental, restructuring, warranties, project costs,<br />
partial retirement and other liabilities. These provisions<br />
require management’s judgment with respect to the<br />
amounts recorded and the expected timing of payments.<br />
Amounts or timing of payments may change due to<br />
changes in circumstances or execution of plans related to<br />
these liabilities. As at December 31, 2010, the provisions<br />
balance was $41,311 (2009: $37,948).<br />
Measurement of financial instruments<br />
Fair value of non-derivative financial instruments,<br />
which is determined for disclosure purposes, is calculated<br />
based on the present value of future principal and interest<br />
cash flows, discounted at the market rate of interest<br />
at the reporting date. Management’s judgment is used<br />
to determine the appropriate discount rates used for<br />
these calculations.<br />
3. Significant accounting policies<br />
(a) Basis of consolidation<br />
(i) Consolidation Principles<br />
Basis of consolidation from January 1, 2010<br />
The consolidated financial statements comprise the<br />
financial statements of the Company and its subsidiaries<br />
as at December 31, 2010.<br />
Subsidiaries are fully consolidated from the date of<br />
acquisition, being the date on which the Company obtains<br />
control, and continue to be consolidated until the date<br />
when such control ceases. The financial statements of the<br />
subsidiaries are prepared for the same reporting period<br />
as the parent company, using consistent accounting<br />
policies. All intra-group balances, transactions,<br />
unrealized gains and losses resulting from intra-group<br />
transactions and dividends are eliminated in full.<br />
Losses within a subsidiary are attributed to the noncontrolling<br />
interest even if that results in a deficit balance.<br />
In the consolidated statement of comprehensive income<br />
of the reporting period, and of the comparable period,<br />
income and expenses from discontinued operations are<br />
reported separately from income and expenses from<br />
continuing operations, down to the level of profit after<br />
taxes, even when the Company retains a non-controlling<br />
interest in the subsidiary after the sale. The resulting<br />
profit or loss (after taxes) is reported separately in the<br />
statement of comprehensive income.<br />
A change in the ownership interest of a subsidiary, without<br />
a loss of control, is accounted for as an equity transaction.<br />
If the Company loses control over a subsidiary, it:<br />
• Derecognizes the assets (including goodwill) and<br />
liabilities of the subsidiary<br />
• Derecognizes the carrying amount of any<br />
non-controlling interest<br />
• Derecognizes the cumulative translation differences,<br />
recorded in equity<br />
• Recognizes the fair value of the consideration received<br />
• Recognizes the fair value of any investment retained<br />
Notes to Consolidated Financial Statements 77
• Recognizes any surplus or deficit in profit or loss<br />
• Reclassifies the parent’s share of components<br />
previously recognized in other comprehensive income to<br />
profit or loss or retained earnings, as appropriate.<br />
Basis of consolidation prior to January 1, 2010<br />
The consolidated financial statements of the Company<br />
include the accounts of all entities when a direct or<br />
indirect controlling interest exists through voting rights<br />
or other contractual rights at the reporting dates and<br />
therefore the results of operations and cash flows of<br />
the subsidiaries of the Company are presented on a<br />
consolidated basis under the control of the Company.<br />
Profit (loss) for the year is allocated to the shareholders of<br />
the Company and non-controlling interests. Acquisitions<br />
of non-controlling interests, prior to January 1, 2010, were<br />
accounted for using the parent entity extension method,<br />
whereby, the difference between the consideration and the<br />
book value of the share of the net assets acquired were<br />
recognized in goodwill. The non-controlling interests are<br />
disclosed separately in the consolidated income statement<br />
and in the equity section of the consolidated statement of<br />
financial position.<br />
All intra-group balances, transactions, income and<br />
expenses and profit and losses resulting from intra-group<br />
transactions that are recognized in assets, are eliminated<br />
in full.<br />
In the consolidated statement of comprehensive income<br />
of the reporting period, and of the comparable period,<br />
income and expenses from discontinued operations are<br />
reported separately from income and expenses from<br />
continuing operations, down to the level of profit after<br />
taxes, even when the Company retains a non-controlling<br />
interest in the subsidiary after the sale. The resulting<br />
profit or loss (after taxes) is reported separately in the<br />
statement of comprehensive income.<br />
If the Company lost control over a subsidiary prior to<br />
January 1, 2010, it:<br />
• Derecognized the assets and liabilities of the subsidiary<br />
• Derecognized the carrying amount of any<br />
non-controlling interest<br />
• Derecognized cumulative translation differences<br />
recorded in equity, based on the change in ownership<br />
percentage<br />
• Maintained the book value of the retained investment<br />
• Recognized the differences between the previous<br />
investment value and the revised investment value as<br />
part of the loss on discontinued operations<br />
(ii) Associates<br />
Associates are those entities in which the Company has<br />
significant influence, but not control, over the financial<br />
and operating policies. Associates are accounted for using<br />
the equity method (“equity accounted investees”). The<br />
consolidated financial statements include the Company’s<br />
share of the profit and loss and other comprehensive<br />
income of equity accounted investees from the date<br />
that significant influence commences until the date that<br />
significant influence ceases. When the Company’s share<br />
of losses exceeds its interest in an equity accounted<br />
investee, the carrying amount of that interest (including<br />
any long-term investments) is reduced to nil and the<br />
recognition of further losses is discontinued except to the<br />
extent that the Company has an obligation or has made<br />
payments on behalf of the investee. Profits and losses<br />
resulting from transactions between the Company and the<br />
associate are eliminated to the extent of the interest in the<br />
associate. See note 15 for further details.<br />
(iii) Joint Ventures<br />
A joint venture is a contractual arrangement where two<br />
or more parties undertake an economic activity that is<br />
subject to joint control, and a jointly controlled entity<br />
is a joint venture that involves the establishment of a<br />
separate entity in which each venturer has an interest.<br />
The Company recognizes its interest in joint ventures<br />
under the equity method. The consolidated financial<br />
statements include the Company’s share of the profit and<br />
loss and other comprehensive income of jointly controlled<br />
investees from the date that joint control commences until<br />
the date that joint control ceases. When the Company’s<br />
share of losses exceeds its interest in a jointly controlled<br />
investee, the carrying amount of that interest (including<br />
any long-term investments) is reduced to nil and the<br />
recognition of further losses is discontinued except to the<br />
extent that the Company has an obligation or has made<br />
payments on behalf of the investee.<br />
When the Company contributes or sells assets to the joint<br />
venture, any portion of gain or loss from the transaction<br />
is recognized based on the substance of the transaction.<br />
When the Company purchases assets from the joint<br />
venture, the Company does not recognize its share of the<br />
profits of the joint venture from the transaction until it<br />
resells the assets to an independent party.<br />
(b) Foreign currency<br />
(i) Functional and presentation currency<br />
The local currency is the functional currency for the<br />
Company’s significant operations outside the US, except<br />
certain operations in the United Kingdom and Brazil,<br />
where the US Dollar is used as the functional currency.<br />
The determination of functional currency is based on<br />
appropriate economic and management indicators.<br />
These consolidated financial statements are presented<br />
in US Dollars, which is the Company’s functional and<br />
presentation currency.<br />
78 Notes to Consolidated Financial Statements
All financial information is presented in US Dollars<br />
and has been rounded to the nearest thousand, unless<br />
otherwise stated.<br />
(ii) Foreign currency transactions<br />
Transactions in foreign currencies are translated to<br />
the respective functional currencies of the Company’s<br />
entities at exchange rates at the dates of the transactions.<br />
Monetary assets and liabilities denominated in foreign<br />
currencies are retranslated at the functional currency<br />
rate of exchange at the reporting date. All differences<br />
are taken to profit or loss. Non-monetary items that are<br />
measured in terms of historical cost in a foreign currency<br />
are translated using the exchange rates as at the dates<br />
of the initial transactions. Non-monetary assets and<br />
liabilities denominated in foreign currencies that are<br />
measured at fair value are retranslated to the functional<br />
currency at the exchange rate at the date that the fair<br />
value was determined. Foreign currency differences<br />
arising on retranslation are recognized in profit or loss.<br />
Any goodwill arising on the acquisition of a foreign<br />
operation and any fair value adjustments to the carrying<br />
amounts of assets and liabilities arising on the acquisition<br />
are treated as assets and liabilities of the foreign<br />
operation and translated at the closing rate.<br />
(iii) Foreign operations<br />
The assets and liabilities of foreign operations, including<br />
goodwill and fair value adjustments arising on acquisition,<br />
are translated to US Dollars at exchange rates at the<br />
reporting date. The income and expenses of foreign<br />
operations are translated to US Dollars at the average<br />
exchange rates calculated at the reporting date. On<br />
consolidation, exchange differences arising from the<br />
translation of the net investments in foreign operations<br />
are taken directly to other comprehensive income.<br />
Since January 1, 2005, the Company’s date of transition to<br />
IFRS, such differences have been recognized in the foreign<br />
currency translation reserve. When a foreign operation<br />
is disposed of, in part or in full, the relevant amount in<br />
the foreign currency translation reserve is transferred to<br />
profit or loss.<br />
The Company treats certain intra-group loan balances,<br />
which are not intended to be repaid in the foreseeable<br />
future, as part of its net investment. When a foreign entity<br />
is sold, such exchange differences are recognized in the<br />
income statement as a part of gain or loss on the sale.<br />
The Company has no foreign operations in<br />
hyperinflationary economies. The Company does not<br />
hedge its net investments in foreign operations.<br />
(c) Financial instruments<br />
(i) Non-derivative financial instruments<br />
Non-derivative financial instruments comprise trade and<br />
other receivables, cash and cash equivalents, restricted<br />
cash, investments in associates and joint ventures,<br />
investment in equity instruments, notes receivable, loans<br />
and borrowings, short term bank debt, and trade and<br />
other payables. The Company does not have any nonderivative<br />
financial instruments which are classified<br />
as held-to-maturity investments or available-for-sale<br />
financial assets.<br />
Trade and other receivables are initially recorded at fair<br />
value, which is the invoiced amount, and are subsequently<br />
measured at amortized cost. The Company provides<br />
an allowance for impairment for known and estimated<br />
potential losses arising from sales to customers based<br />
on a periodic review of these accounts. Impaired debts<br />
are derecognized when it is probable that they will not<br />
be recovered.<br />
Cash and cash equivalents comprise cash balances<br />
and call deposits with maturities of 90 days or less.<br />
For the purpose of the consolidated statement of cash<br />
flows, cash and cash equivalents consist of cash and<br />
cash equivalents, as defined above, net of outstanding<br />
bank drafts.<br />
Restricted cash, which in whole or in part is restricted<br />
for specific purposes including guarantees, is included<br />
in a separate line item within non-current assets in<br />
the statement of financial position. Restricted cash is<br />
measured at amortized cost.<br />
The investments in associates and joint ventures of the<br />
Company are accounted for using the equity method of<br />
accounting. Associates and joint ventures are entities in<br />
which the Company has significant influence and which<br />
are not subsidiaries. Under the equity method, these<br />
investments are carried in the statement of financial<br />
position at cost plus post-acquisition changes in the<br />
Company’s share of net assets of the associate or joint<br />
venture. The income statement reflects the share of the<br />
results of operations of the associate or joint venture.<br />
Where there has been a change recognized directly in<br />
the equity of an associate or joint venture, the Company<br />
recognizes its share of any changes and discloses this,<br />
when applicable, in the statement of changes in equity.<br />
Investments in equity instruments whose fair value cannot<br />
be reliably measured and must be settled by delivery of<br />
those equity instruments are measured at cost less any<br />
impairment. If a reliable fair value measurement becomes<br />
available, the investment will be remeasured at that fair<br />
value and the gain or loss reported in profit and loss.<br />
Notes receivable are financial instruments with fixed and<br />
determinable payments that are not quoted in an active<br />
Notes to Consolidated Financial Statements 79
market. They are initially recorded at the fair value of<br />
the note plus direct issuance costs, if any. After initial<br />
recognition, notes receivable are subsequently measured<br />
at amortized cost using the effective interest method.<br />
Convertible notes receivable are bifurcated, if necessary,<br />
into the note receivable and the derivative instrument.<br />
The derivative instrument is valued first at inception, with<br />
the remaining balance being attributed to the note. If<br />
bifurcated convertible notes receivable are amended, the<br />
derivative instrument is valued at amendment, with the<br />
remaining balance being attributed to the note.<br />
Loans and borrowings are initially recorded at the fair<br />
value of the proceeds received less direct issuance<br />
costs. After initial recognition, loans and borrowings<br />
are subsequently measured at amortized cost using the<br />
effective interest method.<br />
Short term bank debt, trade and other payables are<br />
accounted for at amortized cost.<br />
Fair value of non-derivative liabilities, which is determined<br />
for disclosure purposes, is calculated based on the<br />
present value of future principal and interest cash flows,<br />
discounted at the market rate of interest at the reporting<br />
date. For finance leases, the market rate of interest is<br />
determined by reference to similar lease agreements.<br />
(ii) Derivative financial instruments<br />
The Company views derivative instruments as risk<br />
management tools and does not use them for trading<br />
or speculative purposes. The Company uses derivative<br />
instruments, primarily forward contracts, swaps and<br />
caps, to manage certain foreign currency, commodity<br />
price and interest rate exposures. Such derivative<br />
financial instruments are initially recognized at fair value<br />
on the date on which a derivative contract is entered<br />
into and are subsequently remeasured at fair value, with<br />
gains or losses that do not qualify for hedge accounting<br />
taken directly to profit or loss. Such derivative financial<br />
instruments are carried as assets when the fair value is<br />
positive and as liabilities when the fair value is negative.<br />
For the purpose of hedge accounting, all hedges are<br />
classified as:<br />
• cash flow hedges when hedging exposure to variability<br />
in cash flows that is either attributable to a particular<br />
risk associated with a recognized asset or liability or<br />
a highly probable forecast transaction or the foreign<br />
currency risk in an unrecognized firm commitment; or<br />
• fair value hedges when hedging the exposure to changes<br />
in the fair value of a recognized asset or liability or<br />
an unrecognized firm commitment (except for foreign<br />
currency risk).<br />
At the inception of a cash flow hedge relationship, the<br />
Company formally designates and documents the hedge<br />
relationship to which the Company wishes to apply hedge<br />
accounting and the risk management objective and<br />
strategy for undertaking the hedge. The documentation<br />
includes the identification of the hedging instrument,<br />
the hedged item or transaction, the nature of the risk<br />
being hedged and how the Company will assess the<br />
hedge effectiveness in offsetting the exposure to changes<br />
in the hedged item’s fair value or cash flows attributable<br />
to the hedged risk. Such hedges are expected to be<br />
highly effective in achieving offsetting changes in fair<br />
value or cash flows and are assessed on an ongoing<br />
basis to determine that they actually have been highly<br />
effective throughout the financial periods for which they<br />
were designated.<br />
For cash flow hedges, the effective portion of the gain or<br />
loss on the hedging instrument is recognized directly in<br />
other comprehensive income, while any ineffective portion<br />
is recognized immediately in the income statement.<br />
Amounts taken to other comprehensive income are<br />
transferred to the income statement when the hedged<br />
transaction affects the income statement.<br />
For fair value hedges, the change in value of the hedging<br />
derivative is recognized immediately in the income<br />
statement. The change in the fair value of the hedged item<br />
attributable to the risk hedged is recorded as part of the<br />
carrying value of the hedged item and is also recorded in<br />
the income statement.<br />
The fair value of forward exchange contracts is calculated<br />
by reference to current forward exchange rates for<br />
contracts with similar maturity profiles. The fair value of<br />
interest rate swaps is determined by reference to market<br />
values for similar instruments. The fair value of forward<br />
commodity contracts is calculated by reference to current<br />
forward prices on the London Metals Exchange (“LME”)<br />
for commodity contracts with similar maturity profiles.<br />
If the hedging instrument expires or is sold, terminated<br />
or exercised, then hedge accounting is discontinued<br />
prospectively. The cumulative gain or loss previously<br />
recognized in other comprehensive income remains there<br />
until the forecast transaction or firm commitment occurs.<br />
If the forecast transaction or firm commitment is no<br />
longer expected to occur, amounts previously recognized<br />
in other comprehensive income are transferred to the<br />
income statement.<br />
The Company enters into certain derivatives that<br />
economically hedge monetary assets and liabilities that<br />
do not qualify for hedge accounting. Any gains or losses<br />
arising from changes in fair value of derivatives during<br />
the year that do not qualify for hedge accounting are taken<br />
directly to the income statement. They are categorized as<br />
financial assets or financial liabilities at fair value through<br />
profit or loss.<br />
80 Notes to Consolidated Financial Statements
(d) Derecognition of financial assets and liabilities<br />
Financial assets<br />
A financial asset (or where applicable, a part of a financial<br />
asset or part of a group of similar financial assets) is<br />
derecognized when:<br />
• The rights to receive cash flows from the asset<br />
have expired<br />
• The Company retains the right to receive cash flows<br />
from the asset but has assumed an obligation to pay<br />
them in full without material delay to a third party under<br />
a pass-through arrangement; or<br />
• The Company retains the right to receive cash flows<br />
from the asset and either (a) has transferred<br />
substantially all the risks and rewards of the asset, or<br />
(b) has neither transferred nor retained substantially all<br />
the risks and rewards of the asset, but has transferred<br />
the asset.<br />
When the Company has transferred its rights to receive<br />
cash flows from an asset and has neither transferred<br />
nor retained substantially all the risks and rewards of<br />
the asset nor transferred control of the asset, the asset<br />
is recognized to the extent of the Company’s continuing<br />
involvement in the asset. In that case, the Company also<br />
recognizes an associated liability. The transferred asset<br />
and the associated liability are measured on a basis that<br />
reflects the rights and obligations that the Company has<br />
retained. Continuing involvement that takes the form of a<br />
guarantee over the transferred asset is measured at the<br />
lower of the original carrying amount of the asset and<br />
the maximum amount of consideration that the Company<br />
could be required to pay.<br />
Financial liabilities<br />
A financial liability is derecognized when the obligation<br />
under the liability is discharged, canceled or expires.<br />
Where an existing financial liability is replaced by another<br />
from the same lender on substantially different terms,<br />
or the terms of an existing liability are substantially<br />
modified, such exchange or modification is treated as a<br />
derecognition of the original liability and the recognition<br />
of a new liability, and the difference in the respective<br />
carrying amounts is recognized in the income statement.<br />
(e) Property, plant and equipment<br />
(i) Recognition and measurement<br />
Items of property, plant and equipment are measured<br />
at cost less accumulated depreciation and impairment<br />
losses.<br />
Cost includes expenditures that are directly attributable to<br />
the acquisition of the asset. The cost of self-constructed<br />
assets includes the cost of materials and direct labor, any<br />
other costs directly attributable to bringing the asset to<br />
a working condition for its intended use, and the costs of<br />
dismantling and removing the items and restoring the site<br />
on which they are located.<br />
When parts of an item of property, plant and equipment<br />
have different useful lives, they are accounted for as<br />
separate items (major components) of property, plant<br />
and equipment.<br />
Costs associated with developing mine reserves are<br />
recognized in property, plant and equipment when they<br />
are established as commercially viable. These costs<br />
can include amounts that were previously recognized as<br />
intangible assets during the evaluation phase of the mine<br />
development.<br />
Borrowing costs directly attributable to the acquisition,<br />
construction or production of an asset that necessarily<br />
takes a substantial period of time to get ready for its<br />
intended use or sale are capitalized as part of the cost<br />
of the respective assets. All other borrowing costs are<br />
expensed in the period they occur. Borrowing costs<br />
consist of interest and other costs that an entity incurs in<br />
connection with the borrowing of funds.<br />
The Company capitalizes borrowing costs for all eligible<br />
assets where construction was commenced on or after<br />
January 1, 2009. The Company continues to expense<br />
borrowing costs relating to construction projects that<br />
commenced prior to January 1, 2009.<br />
(ii) Subsequent costs<br />
The cost of replacing part of an item of property, plant<br />
and equipment and the costs of major inspections are<br />
recognized in the carrying amount of the item if it is<br />
probable that the future economic benefits embodied<br />
within the part will flow to the Company and its cost<br />
can be measured reliably. The costs of the day-to-day<br />
servicing of property, plant and equipment are recognized<br />
in profit or loss as incurred.<br />
(iii) Depreciation<br />
Depreciation is generally recognized in profit or loss on a<br />
straight-line basis over the estimated useful lives of each<br />
part of an item of property, plant and equipment. Land<br />
and construction in progress are not depreciated. Mining<br />
costs are depreciated on a units of production basis and<br />
are discussed below.<br />
The estimated useful lives for the current and comparative<br />
periods are as follows:<br />
• buildings and leasehold improvements 2-50 years<br />
• machinery<br />
2-20 years<br />
• mining costs<br />
4-20 years<br />
• office furniture and equipment<br />
2-13 years<br />
• transportation equipment<br />
2-7 years<br />
• finance leases<br />
4-34 years<br />
Notes to Consolidated Financial Statements 81
Depreciation methods, useful lives and residual values<br />
are reassessed at the reporting date.<br />
The depreciation of certain mining costs is linked to the<br />
production levels from the mine. Therefore, these assets<br />
are amortized using a units of production basis. Using that<br />
basis currently approximates a 7 year life of the mine. Other<br />
mining assets are depreciated on a straight-line basis<br />
ranging from 4-20 years, depending on the useful life.<br />
An item of property, plant and equipment is derecognized<br />
upon disposal or when no future economic benefits are<br />
expected from its use or disposal. Any gain or loss arising<br />
on derecognition of the asset (calculated as the difference<br />
between the net disposal proceeds and the carrying<br />
amount of the asset) is included in the income statement<br />
in the year the asset is derecognized.<br />
(f) Business Combinations and Goodwill<br />
Goodwill (negative goodwill) may arise on the acquisition<br />
of subsidiaries, associates and joint ventures.<br />
Business combinations from January 1, 2010<br />
Business combinations are accounted for using the<br />
acquisition method. The cost of an acquisition is measured<br />
as the aggregate of the consideration transferred,<br />
measured at acquisition date fair value and the amount<br />
of any non-controlling interest in the acquiree. For each<br />
business combination, the acquirer measures the<br />
non-controlling interest in the acquiree either at fair value<br />
or at the proportionate share of the acquiree’s identifiable<br />
net assets. Acquisition costs incurred are expensed and<br />
included in administrative expenses.<br />
When the Company acquires a business, it assesses the<br />
financial assets and liabilities assumed for appropriate<br />
classification and designation in accordance with the<br />
contractual terms, economic circumstances and pertinent<br />
conditions as at the acquisition date.<br />
If the business combination is achieved in stages, the<br />
acquisition date fair value of the acquirer’s previously<br />
held equity interest in the acquiree is remeasured to fair<br />
value at the acquisition date through profit or loss. Any<br />
contingent consideration to be transferred by the acquirer<br />
will be recognized at fair value at the acquisition date.<br />
Subsequent changes to the fair value of the contingent<br />
consideration which is deemed to be an asset or liability,<br />
will be recognized in accordance with IAS 39 either in<br />
profit or loss or as a change to other comprehensive<br />
income. If the contingent consideration is classified as<br />
equity, it should not be remeasured until it is finally settled<br />
within equity.<br />
Goodwill is initially measured at cost being the excess of<br />
the aggregate of the consideration transferred and the<br />
amount recognized for non-controlling interest over the<br />
net identifiable assets acquired and liabilities assumed.<br />
If this consideration is lower than the fair value of the<br />
net assets of the subsidiary acquired, the difference is<br />
recognized in profit or loss.<br />
After initial recognition, goodwill is measured at cost less<br />
any accumulated impairment losses. For the purpose<br />
of impairment testing, goodwill acquired in a business<br />
combination is, from the acquisition date, allocated<br />
to each of the Group’s cash-generating units that are<br />
expected to benefit from the combination, irrespective<br />
of whether other assets or liabilities of the acquiree are<br />
assigned to those units. Where goodwill forms part of<br />
a cash-generating unit and part of the operation within<br />
that unit is disposed of, the goodwill associated with the<br />
operation disposed of is included in the carrying amount<br />
of the operation when determining the gain or loss on<br />
disposal of the operation. Goodwill disposed of in this<br />
circumstance is measured based on the relative values<br />
of the operation disposed of and the portion of the cashgenerating<br />
unit retained.<br />
If the Company completes a transaction that does not<br />
meet the definition of a business combination due to the<br />
acquiree not meeting the definition of a business, the<br />
Company:<br />
• identifies and recognizes the individual identifiable<br />
assets acquired and liabilities assumed; and<br />
• allocates the cost of the group of assets and liabilities<br />
to the individual identifiable assets and liabilities on the<br />
basis of their relative fair values at the date of purchase<br />
Acquisitions on or after January 1, 2005 prior to<br />
January 1, 2010<br />
For acquisitions on or after January 1, 2005 prior to<br />
January 1, 2010, goodwill represents the excess of the<br />
cost of the acquisition over the Company’s interest in<br />
the net fair value of the identifiable assets, liabilities and<br />
contingent liabilities of the acquiree. When the excess is<br />
negative (negative goodwill), it is recognized immediately<br />
in profit or loss.<br />
Fair value of identifiable assets is determined as follows:<br />
(i) Property, plant and equipment<br />
The fair value of property, plant and equipment recognized<br />
as a result of a business combination is based on market<br />
values. The market value of property is the estimated<br />
amount for which a property could be exchanged on<br />
the date of valuation between a willing buyer and a<br />
willing seller in an arm’s length transaction after<br />
proper marketing wherein the parties had each acted<br />
knowledgeably, prudently and without compulsion. The<br />
market value of items of plant and equipment is based on<br />
the quoted market prices for similar items.<br />
82 Notes to Consolidated Financial Statements
(ii) Intangible assets<br />
The fair value of intangible assets acquired in a business<br />
combination is the amount for which the asset could be<br />
exchanged between knowledgeable, willing parties in an<br />
arm’s length transaction based on active markets or the<br />
discounted cash flows generated by the respective asset.<br />
(iii) Inventory<br />
The fair value of work in process and finished goods<br />
inventory acquired in a business combination is<br />
determined based on its estimated selling price in the<br />
ordinary course of business less the estimated costs<br />
of completion and sale, and a reasonable profit margin<br />
based on the effort required to complete and sell<br />
the inventory.<br />
(iv) Trade and other receivables<br />
The fair value of trade and other receivables is estimated<br />
as the present value of future cash flows, discounted at<br />
the market rate of interest at the acquisition date. For<br />
short term trade and other receivables, discounting is<br />
not required.<br />
Subsequent measurement<br />
Goodwill is measured at cost less accumulated<br />
impairment losses. In respect of equity accounted<br />
investees, the carrying amount of goodwill is included in<br />
the carrying amount of the investment.<br />
(g) Intangible assets<br />
(i) Patents and technology<br />
The Company has patents for certain manufacturing<br />
processes. Patents and technology are carried at cost<br />
less any amortisation and impairment losses. The patents<br />
are being amortized over a life of 10 years.<br />
(ii) Development Costs<br />
Development costs are capitalized if and only if the<br />
Company can meet the following criteria:<br />
• the intangible asset is clearly identified and the related<br />
costs are individualized and reliably monitored;<br />
• the technical feasibility of completing the intangible<br />
asset so that it will be available for use or sale;<br />
• there is a clear intention to complete the intangible<br />
asset and use or sell it;<br />
• its ability to use or sell the intangible asset arising from<br />
the project;<br />
• how the intangible asset will generate probable future<br />
economic benefits;<br />
• the availability of adequate technical, financial and other<br />
resources to complete the development and to use or<br />
sell the intangible asset<br />
Research costs are expensed as incurred.<br />
Every cost recognized as an asset is amortized on the<br />
basis of the expected life of the sales related to the<br />
project. The amortization period is reviewed at least<br />
annually. The development costs are carried at cost less<br />
any amortization and impairment losses.<br />
(ii) Other intangible assets<br />
Other intangible assets that are acquired by the Company,<br />
which have finite useful lives, are measured at cost less<br />
accumulated amortization and accumulated impairment<br />
losses. Amortization is recognized in profit or loss on<br />
a straight-line basis over the estimated useful lives of<br />
intangible assets, other than goodwill, from the date that<br />
they are available for use. These intangible assets have<br />
useful lives of 3 – 5 years or rights of use that have lives of<br />
5 years.<br />
(h) Leased assets<br />
Leases for which the Company assumes substantially<br />
all the risks and rewards of ownership are classified as<br />
finance leases. Upon initial recognition the leased asset is<br />
measured at an amount equal to the lower of its fair value<br />
and the present value of the minimum lease payments.<br />
Subsequent to initial recognition, capitalized lease<br />
assets are depreciated over the shorter of the estimated<br />
useful life of the asset and the lease term, if there is<br />
no reasonable certainty that the Company will obtain<br />
ownership by the end of the lease term.<br />
Minimum lease payments made under finance leases are<br />
apportioned between finance expense and the reduction of<br />
the outstanding liability. The finance expense is allocated<br />
to each period during the lease term so as to produce<br />
a constant periodic rate of interest on the remaining<br />
balance of the liability.<br />
The Company also enters into operating leases under<br />
which the leased assets are not recognized on the<br />
Company’s statement of financial position. Payments<br />
made under operating leases are recognized in profit or<br />
loss on a straight-line basis over the term of the lease.<br />
Lease incentives received are recognized as an integral<br />
part of the total lease expense, over the term of the lease.<br />
(i) Inventories<br />
Inventories are measured at the lower of cost and net<br />
realizable value. The cost of inventories is determined<br />
based on the average cost and specific identification<br />
methods, and includes expenditures incurred in acquiring<br />
the inventories and bringing them to their existing location<br />
and condition. In the case of finished goods inventory and<br />
work in process, cost includes materials and labor as well<br />
as an appropriate share of production overhead based on<br />
normal operating capacity.<br />
Notes to Consolidated Financial Statements 83
Net realizable value is the estimated selling price in the<br />
ordinary course of business, less the estimated costs of<br />
completion and necessary selling expenses. The Company<br />
estimates the net realizable value of its inventories at<br />
least quarterly and adjusts the carrying amount of these<br />
inventories as necessary.<br />
Cost of inventories includes the transfer from other<br />
comprehensive income of gains and losses on qualifying<br />
cash flow hedges in respect of purchases of raw<br />
materials.<br />
(j) Deferred stripping costs<br />
Within the Company’s mining operations, advanced<br />
stripping costs incurred during the production stage of<br />
operations are recognized in prepaid inventory using<br />
the specific identification approach. This methodology is<br />
based on the variability of stripping costs over the course<br />
of a stripping campaign. The ability to strip the mine is<br />
largely seasonal. These amounts are included in prepaid<br />
expenses when the costs are directly attributable to a<br />
specific section of ore body that becomes accessible as a<br />
result of the stripping campaign. Amortization of<br />
the stripping costs into cost of goods sold occurs as the<br />
ore body, to which the stripping has been allocated,<br />
is processed.<br />
(k) Impairment<br />
(i) Financial assets<br />
A financial asset is considered to be impaired if objective<br />
evidence indicates that one or more events have had a<br />
negative effect on the estimated future cash flows of that<br />
asset. Financial assets are assessed collectively in groups<br />
that share similar credit risk characteristics.<br />
An impairment loss in respect of a financial asset<br />
measured at amortized cost is calculated as the<br />
difference between its carrying amount and the present<br />
value of the estimated future cash flows discounted at the<br />
original effective interest rate. All impairment losses are<br />
recognized in profit or loss.<br />
An impairment loss is reversed if the reversal can<br />
be related objectively to an event occurring after the<br />
impairment loss was recognized. For financial assets<br />
measured at amortized cost, the reversal is recognized in<br />
profit or loss.<br />
(ii) Non-financial assets<br />
The carrying amounts of the Company’s non-financial<br />
assets, other than inventories and deferred tax assets,<br />
are reviewed at each reporting date to determine<br />
whether there is any indication of impairment. If any such<br />
indication exists, then the asset’s recoverable amount<br />
is estimated.<br />
For goodwill and intangible assets that have indefinite<br />
lives or that are not yet available for use, the recoverable<br />
amount is estimated at each reporting date.<br />
An impairment loss is recognized if the carrying amount<br />
of an asset or its cash-generating unit exceeds its<br />
recoverable amount. A cash-generating unit is the<br />
smallest identifiable asset group that generates cash<br />
flows that largely are independent from other assets and<br />
groups. Impairment losses are recognized in profit or<br />
loss. Impairment losses recognized in respect of cashgenerating<br />
units are allocated first to reduce the carrying<br />
amount of any goodwill allocated to the units and then to<br />
reduce the carrying amount of the other assets in the unit<br />
(group of units) on a pro rata basis.<br />
The recoverable amount of an asset or cash-generating<br />
unit or group of cash-generating units is the greater of its<br />
value in use and its fair value less costs to sell. In testing<br />
goodwill for impairment, the value in use is determined<br />
by the Company for the cash-generating unit or group<br />
of cash-generating units to which the goodwill has been<br />
assigned. However if tangible assets with a definite<br />
remaining useful life have to be tested for impairment<br />
and the value in use is below the corresponding carrying<br />
amount, a fair value less costs to sell methodology is<br />
utilized. Fair value differs from value in use. Fair value<br />
reflects the knowledge and estimates of knowledgeable,<br />
willing buyers and sellers. In contrast, value in use<br />
reflects the entity’s estimates, including the effects<br />
of factors that may be specific to the entity and not<br />
applicable to entities in general. Thus, in assessing value<br />
in use, the estimated future cash flows are discounted<br />
to their present value using a pre-tax discount rate that<br />
reflects current market assessment of the time value of<br />
money and the risks specific to the asset.<br />
An impairment loss in respect of goodwill is not reversed.<br />
In respect of other assets, impairment losses recognized<br />
in prior periods are assessed at each reporting date<br />
for any indications that the loss has decreased or no<br />
longer exists. An impairment loss is reversed if there<br />
has been a change in the estimates used to determine<br />
the recoverable amount. An impairment loss is reversed<br />
only to the extent that the asset’s carrying amount does<br />
not exceed the carrying amount that would have been<br />
determined, net of depreciation or amortization, if no<br />
impairment loss had been recognized.<br />
(iii) Associates and joint ventures<br />
After application of the equity method, the Company<br />
determines whether it is necessary to recognize an<br />
additional impairment loss on the Company’s investment<br />
in its associates and joint ventures. The Company<br />
determines at each reporting date whether there is any<br />
objective evidence that an investment in any associate or<br />
84 Notes to Consolidated Financial Statements
joint venture is impaired. If this is the case, the Company<br />
calculates the amount of impairment as being the<br />
difference between the higher of fair value less cost to sell<br />
and value in use of the associate or joint venture and its<br />
carrying amount and recognizes the amount in the income<br />
statement.<br />
(l) Employee benefits<br />
(i) Defined contribution plans<br />
Certain subsidiaries provide defined contribution pension<br />
plans for their employees. Obligations for contributions<br />
to defined contribution pension plans are recognized as<br />
an expense in profit or loss in the period in which the<br />
obligation was incurred.<br />
(ii) Defined benefit plans<br />
The Company maintains defined benefit plans for its<br />
employees in the United States, Germany, France, and the<br />
United Kingdom.<br />
The Company’s net obligation in respect of defined benefit<br />
pension plans is calculated separately for each plan by<br />
estimating the amount of future benefit that employees<br />
have earned in return for their service in the current and<br />
prior periods; that benefit is discounted to determine its<br />
present value, and any unrecognized actuarial net gains<br />
(losses), unrecognized past service costs and the fair<br />
value of any plan assets are deducted. The discount rate<br />
is based on the appropriate corporate bond yields for<br />
the maturity dates in the country where the obligation<br />
exists. Plan assets are assets that are held by a longterm<br />
employee benefit fund or qualifying insurance<br />
policies. Plan assets are not available to creditors of the<br />
Company nor can they be paid directly to the Company.<br />
Fair value is based on market price information and in<br />
the case of quoted securities, it is the published bid price.<br />
The value of any plan asset recognized is restricted to<br />
the sum of any unrecognized actuarial net gains (losses),<br />
unrecognized past service costs and the present value of<br />
economic benefits available in the form of refunds from<br />
the plan or reductions in future contributions to the plan.<br />
The calculation is performed by a qualified actuary using<br />
the projected unit credit method.<br />
When the benefits of a plan are improved, the portion<br />
of the increased benefit relating to past service by<br />
employees is recognized in profit or loss on a straight-line<br />
basis over the average period until the benefits become<br />
vested. To the extent that the benefits vest immediately,<br />
the expense is recognized immediately in profit or loss.<br />
All actuarial gains and losses as at January 1, 2005, the<br />
date of transition to IFRS, were recognized. Subsequent<br />
to January 1, 2005 a corridor approach is used for<br />
actuarial gains and losses that arise in calculating the<br />
Company’s obligation in respect of a plan. To the extent<br />
that any cumulative unrecognized actuarial gain or loss<br />
exceeds 10 percent of the greater of the present value of<br />
the defined benefit obligation and the fair value of plan<br />
assets, that portion is recognized in the income statement<br />
over the expected average remaining working lives of<br />
the employees participating in the plan. Otherwise, the<br />
actuarial gain or loss is not recognized.<br />
The Company also has supplemental executive retirement<br />
plans (“SERPs”) with five current and previous officers of<br />
the Company (see note 25). The liability for these plans is<br />
accounted for using the same methodology as other defined<br />
benefit plans, with more specific assumptions related to the<br />
people who are the beneficiaries of the SERP.<br />
(iii) Short term benefits<br />
Short term employee benefit obligations are measured<br />
on an undiscounted basis and are expensed as the related<br />
service is provided.<br />
A liability is recognized for the amount expected to be<br />
paid under short term cash bonuses or profit-sharing<br />
plans if the Company has a present legal or constructive<br />
obligation to pay this amount as a result of past service<br />
provided by the employee and the obligation can be<br />
estimated reliably.<br />
(iv) Share-based payment transactions<br />
AMG has share-based compensation plans, which are<br />
described in note 26.<br />
Equity-settled plans<br />
The cost of equity-settled transactions, related to these<br />
share-based compensation plans, is measured by<br />
reference to the fair value at the date on which they are<br />
granted. Estimating the fair value requires determining<br />
the most appropriate valuation model for a grant of<br />
equity instruments, which is dependent on the terms and<br />
conditions of the grant. This also requires determining the<br />
most appropriate inputs to the valuation model including<br />
the expected life of the option, volatility and dividend yield,<br />
and other assumptions. The assumptions and models<br />
used are described in note 26.<br />
The cost of these equity-settled transactions is<br />
recognized, together with a corresponding increase in<br />
equity, over the period in which the service conditions<br />
are fulfilled using a graded vesting methodology, ending<br />
on the date on which the relevant employees (or other<br />
benefactors) become fully entitled to the award (“vesting<br />
date”). The cumulative expense recognized for equitysettled<br />
transactions at each reporting date until the<br />
vesting date reflects the extent to which the vesting<br />
period has expired and the Company’s best estimate of<br />
the number of equity instruments that will ultimately vest.<br />
The income statement charge for the period represents<br />
Notes to Consolidated Financial Statements 85
the movement in cumulative expense recognized as at the<br />
beginning and end of the period.<br />
No expense is recognized for awards that do not ultimately<br />
vest, except for equity-settled transactions where vesting<br />
is conditional upon a market or non-vesting condition,<br />
which are treated as vesting irrespective of whether or<br />
not the market or non-vesting condition is satisfied,<br />
provided that all other performance and/or service<br />
conditions are satisfied.<br />
Where the terms of an equity-settled transaction award<br />
are modified, the minimum expense recognized is the<br />
expense as if the terms had not been modified, if the<br />
original terms of the award are met. An additional expense<br />
is recognized for any modification that increases the total<br />
fair value of the share-based payment transaction, or is<br />
otherwise beneficial to the employee as measured at the<br />
date of modification.<br />
Where an equity-settled award is canceled, it is treated as<br />
if it vested on the date of cancelation, and any expense not<br />
yet recognized for the award is recognized immediately.<br />
This includes any award where non-vesting conditions<br />
within the control of either the entity or the employee<br />
are not met. However, if a new award is substituted for<br />
the canceled award, and designated as a replacement<br />
award on the date that it is granted, the canceled and new<br />
awards are treated as if they were a modification of the<br />
original award, as described in the previous paragraph.<br />
All cancelations of equity-settled transaction awards are<br />
treated equally.<br />
The dilutive effect of outstanding options is reflected as<br />
additional share dilution in the computation of earnings<br />
per share, when appropriate (further details are provided<br />
in note 22).<br />
Cash-settled plans<br />
In May 2009, the Annual General Meeting of Shareholders<br />
approved and the Company implemented a performance<br />
share unit plan (“PSUP”) for certain members of the<br />
Company’s management. Under the PSUP, each manager<br />
receives an award of an approved value of performance<br />
share units (“PSUs”). The issue price of each PSU is equal<br />
to the weighted average share price at which common<br />
shares of the Company trade on the Euronext Amsterdam<br />
Stock Exchange during the 10-day period subsequent to<br />
the annual earnings release. The PSUs vest after three<br />
years, except in the first two years where transitional<br />
vesting provisions are in place. The vesting is subject to<br />
certain return on capital employed (“ROCE”) performance<br />
requirements. The value of the PSUs, when converted<br />
to cash, will be equivalent to the market value of the<br />
common shares at the time the conversion takes place.<br />
The value of the outstanding PSUs, remeasured to fair<br />
value as at December 31, 2010 and 2009 was $3,681 and<br />
$3,639, respectively.<br />
(m) Provisions<br />
Provisions are recognized when:<br />
• the Company has a present obligation (legal or<br />
constructive) as a result of a past event;<br />
• it is probable that an outflow of resources embodying<br />
economic benefits will be required to settle the<br />
obligation; and<br />
• a reliable estimate can be made for the amount of<br />
the obligation.<br />
If the effect of the time value of money is material,<br />
provisions are discounted using a current pre-tax rate<br />
that reflects, where appropriate, the risks specific to the<br />
liability. Where discounting is used, the increase in the<br />
provision due to the passage of time is recognized as a<br />
finance cost.<br />
(i) Environmental remediation costs and recoveries<br />
Certain subsidiaries of the Company are faced with a<br />
number of issues relating to environmental cleanup<br />
requirements, largely resulting from historical solid<br />
and hazardous waste handling and disposal practices<br />
at their facilities. In accordance with the Company’s<br />
environmental policy and applicable legal requirements,<br />
provisions associated with environmental remediation<br />
obligations are accrued when such losses are deemed<br />
probable and reasonably estimable. Such accruals<br />
generally are recognized no later than the completion of<br />
the remedial feasibility study and are adjusted as further<br />
information develops or circumstances change.<br />
A provision is made for shutdown, restoration and<br />
environmental rehabilitation costs in the financial period<br />
when the related environmental disturbance occurs,<br />
based on the estimated future costs using information<br />
available at the reporting date. The provision is discounted<br />
using a current market-based pre-tax discount rate and<br />
the unwinding of the discount is included in finance costs.<br />
The provision is reviewed on an annual basis for changes<br />
to obligations, legislation or discount rates that may lead<br />
to changes in cost estimates or the expected timeline<br />
for payments.<br />
Where the Company expects some or all of an<br />
environmental provision to be reimbursed, for example<br />
using a trust account, the reimbursement is recognized<br />
as a separate asset but only when the reimbursement is<br />
virtually certain. The expense relating to any provision<br />
is presented in the income statement net of any<br />
reimbursement. The subsidiaries of the Company have<br />
been required, in certain instances, to create trust funds<br />
for the environmental rehabilitation. Once established,<br />
86 Notes to Consolidated Financial Statements
the subsidiaries have a 100% interest in these funds.<br />
Rehabilitation and restoration trust funds holding monies<br />
committed for use in satisfying environmental obligations<br />
are included on a discounted basis within other noncurrent<br />
assets on the statement of financial position, only<br />
to the extent that a liability exists for these obligations.<br />
Environmental expense recoveries are generally<br />
recognized in profit upon final settlement with the<br />
Company’s insurance carriers.<br />
Additional environmental remediation costs and<br />
provisions may be required, if the Company were to decide<br />
to close certain of its sites. Certain of the Company’s<br />
restructuring programs have involved closure of several<br />
sites to date. Remediation liabilities are recognized when<br />
the site closure has been announced. In the opinion of<br />
the Company, it is not possible to estimate reliably the<br />
costs that would be incurred on the eventual closure of<br />
its continuing sites, where there is no present obligation<br />
to remediate, because it is neither possible to determine<br />
a time limit beyond which the sites will no longer be<br />
operated, nor what remediation costs may be required on<br />
their eventual closure.<br />
(ii) Restructuring<br />
A provision for restructuring is recognized when the<br />
Company or a subsidiary of the Company has approved<br />
a detailed and formal restructuring plan, and the<br />
restructuring either has commenced or has been<br />
announced publicly. Provisions are not made for future<br />
operating costs.<br />
(iii) Warranty<br />
A provision for warranty is recognized when the Company<br />
or a subsidiary of the Company has determined that it<br />
has a basis for recording a warranty provision based on<br />
historical returns for warranty work.<br />
(iv) Partial retirement<br />
In an effort to reduce unemployment and create jobs<br />
for younger job-seekers, Germany implemented certain<br />
regulations in 1996 to enable employees to take early<br />
retirement. Although the law is no longer in effect, the<br />
Company’s German subsidiaries have made provisions for<br />
those employees who are eligible per their employment<br />
contracts. According to German law, the Company is<br />
required to pay a deposit for partial retirements to secure<br />
payments to the employees in the case of insolvency. The<br />
Company records the related deposits and provisions on a<br />
net basis.<br />
(v) Cost estimates<br />
As part of its process to provide reliable estimations of<br />
profitability for long-term contracts, the Company makes<br />
provisions for cost estimates. These provisions are<br />
developed on a contract by contract basis and are based<br />
on contractor estimates.<br />
(n) Revenue<br />
(i) Goods sold<br />
Revenue from the sale of goods is measured at the<br />
fair value of the consideration received or receivable.<br />
Revenue from product sales to the Company’s customers<br />
is recognized when the significant risks and rewards of<br />
ownership have been transferred to the buyer, recovery<br />
of the consideration is probable, the associated costs<br />
and possible return of goods can be estimated reliably,<br />
and there is no continuing management involvement with<br />
the goods.<br />
Transfer of risks and rewards usually occurs when title<br />
and risk of loss pass to the customer. In the case of export<br />
sales, title may not pass until the product reaches a<br />
foreign port.<br />
(ii) Furnace construction contracts<br />
Certain furnace construction contracts are reported using<br />
the percentage of completion (“POC”) method. Cumulative<br />
work and services performed to date, including the<br />
Company’s share of profit, is reported on a pro rata basis<br />
according to the percentage completed. The percentage<br />
of completion is measured as the ratio of contract costs<br />
incurred for work performed so far to total contract costs<br />
(cost-to-cost method). Contracts are reported in trade<br />
receivables and advance payments, as “gross amount<br />
due to / from customers for/from contract work (POC)”.<br />
If cumulative work performed to date (contract costs<br />
plus contract net profit) of contracts in progress exceeds<br />
progress payments received, the difference is recognized<br />
as an asset and included in trade and other receivables in<br />
the consolidated statement of financial position. If the net<br />
amount after deduction of progress payments received<br />
is negative, the difference is recognized as a liability<br />
and included in advance payments in the consolidated<br />
statement of financial position. Anticipated losses on<br />
specific contracts are estimated taking account of all<br />
identifiable risks and are accounted for using the POC<br />
method. Contract income is recognized according to<br />
the income stipulated in the contract and/or any change<br />
orders confirmed in writing by the client.<br />
(iii) Commissions<br />
In certain instances, the Company arranges sales for<br />
which the supplier invoices the customer directly. In such<br />
Notes to Consolidated Financial Statements 87
cases, the Company receives commission income, in<br />
its role as agent, which is recognized when the supplier<br />
passes title to the customer. The Company assumes no<br />
significant credit or other risk with such transactions.<br />
When the Company acts in the capacity of an agent<br />
rather than as the principal in a transaction, the revenue<br />
recognized is the net amount of commission made by<br />
the Company.<br />
(o) Research and development<br />
Expenditure on research activities, undertaken with the<br />
prospect of gaining new scientific or technical knowledge<br />
and understanding, is recognized in profit or loss when<br />
incurred. Development costs are expensed until the<br />
following occur: technical feasibility; both the intention<br />
and ability to complete for internal use or as an external<br />
sale; probable generation of future economic benefits;<br />
marketability existence; and the reliable measurements<br />
of expenditures accumulated during development.<br />
Research and development costs are shown within selling,<br />
general and administrative expenses in the consolidated<br />
income statement.<br />
(p) Finance income and expenses<br />
Finance income comprises interest income on funds<br />
invested, interest recognized on loans to related parties,<br />
interest recognized on notes receivable, changes in<br />
the discount on provisions, foreign currency gains and<br />
derivative income gains on hedging instruments. Interest<br />
income is recognized as it is earned, using the effective<br />
interest method.<br />
Finance expenses comprise interest expense on<br />
borrowings, finance charges on finance leases, changes<br />
in the discount on provisions, foreign currency losses,<br />
losses on hedging instruments, and any loss recorded on<br />
debt extinguishment. All borrowing costs are recognized<br />
in profit or loss using the effective interest method.<br />
(q) Government grants<br />
Certain subsidiaries receive government grants related<br />
to early retirement provisions and workforce creation.<br />
Government grants are recognized when there is<br />
reasonable assurance that the grant will be received and<br />
all attached conditions will be complied with. There are<br />
two types of grants. For grants that relate to expense<br />
items, they are recognized as income over the period<br />
necessary to match the grant on a systematic basis to<br />
the costs for which they are intended to compensate.<br />
For grants that relate to investment in property, they are<br />
recognized as a liability and the liability is then reduced as<br />
money is spent on capital expansion.<br />
(r) Income tax expense<br />
Income tax expense comprises current and deferred tax.<br />
Income tax expense is recognized in profit or loss except<br />
to the extent that it relates to items recognized directly in<br />
equity, in which case it is recognized in equity.<br />
Current income tax assets and liabilities for the current<br />
and prior periods are measured at the amount expected<br />
to be recovered from or paid to the taxation authorities.<br />
These amounts are calculated using tax rates enacted<br />
or substantively enacted at the reporting date, in the<br />
countries where the Company generates taxable income.<br />
Current income tax relating to items recognized directly<br />
in equity is recognized in equity and not in the income<br />
statement.<br />
Deferred tax is provided using the liability method on<br />
temporary differences at the reporting date between the<br />
taxes bases of assets and liabilities and their carrying<br />
amounts for financial reporting purposes.<br />
Deferred tax liabilities are recognized for all taxable<br />
temporary differences, except:<br />
• where the deferred tax liability arises from the initial<br />
recognition of goodwill or of an asset or liability in a<br />
transaction that is not a business combination and,<br />
at the time of the transaction, affects neither the<br />
accounting profit nor taxable profit or loss; and<br />
• in respect of taxable temporary differences associated<br />
with investments in subsidiaries, associates and<br />
interests in joint ventures, where the timing of the<br />
reversal of the temporary differences can be controlled<br />
and it is probable that the temporary differences will<br />
not reverse in the foreseeable future.<br />
Deferred tax assets are recognized for all deductible<br />
temporary differences, carryforwards of unused tax<br />
credits and unused tax losses, to the extent that it is<br />
probable that taxable profit will be available against<br />
which the deductible temporary differences, and the<br />
carryforwards of unused tax credits and unused tax<br />
losses can be utilized except:<br />
• where the deferred tax asset relating to the deductible<br />
temporary difference arises from the initial recognition<br />
of an asset or liability in a transaction that is not a<br />
business combination and, at the time of the transaction,<br />
affects neither the accounting profit nor taxable profit<br />
or loss; and<br />
• in respect of deductible temporary differences<br />
associated with investments in subsidiaries, associates<br />
and interests in joint ventures, deferred tax assets are<br />
recognized only to the extent that it is probable that the<br />
temporary differences will reverse in the foreseeable<br />
future and taxable profit will be available against which<br />
the temporary differences can be utilized.<br />
88 Notes to Consolidated Financial Statements
The carrying amount of deferred tax assets is reviewed at<br />
each reporting date and adjusted to the extent that it has<br />
become probable or is no longer probable that sufficient<br />
taxable profit will be available to allow all or part of the<br />
deferred tax asset to be utilized.<br />
Unrecognized deferred tax assets are reassessed at each<br />
reporting date and are recognized to the extent that it has<br />
become probable that future taxable profit will allow the<br />
deferred tax asset to be recovered.<br />
Deferred tax assets and liabilities are measured at the tax<br />
rates that are expected to apply to the year when the asset<br />
is realized or the liability is settled, based on tax rates<br />
(and tax laws) that have been enacted or substantively<br />
enacted at the reporting date.<br />
Deferred tax relating to items recognized outside profit<br />
or loss is recognized outside profit or loss. Deferred tax<br />
items are recognized in correlation to the underlying<br />
transaction either in other comprehensive income or<br />
directly in equity.<br />
Deferred tax assets and deferred tax liabilities are offset,<br />
if a legally enforceable right exists to set off current tax<br />
assets against current income tax liabilities and the<br />
deferred taxes relate to the same taxable entity and the<br />
same taxation authority.<br />
Sales tax<br />
Revenues, expenses and assets are recognized net of the<br />
amount of sales tax except:<br />
• where the sales tax incurred on a purchase of assets or<br />
services is not recoverable from the taxation authority,<br />
in which case the sales tax is recognized as part of the<br />
cost of acquisition of the asset or as part of the expense<br />
item as applicable; and<br />
• receivables and payables that are stated with the<br />
amount of sales tax included.<br />
The net amount of sales tax recoverable from, or payable<br />
to, the taxation authority is included as part of receivables<br />
or payables in the statement of financial position.<br />
Additional income taxes that arise from the distribution of<br />
dividends are recognized at the same time as the liability<br />
to pay the related dividend is recognized.<br />
(s) Segment reporting<br />
IFRS 8 defines an operating segment as: a component<br />
of an entity (a) that engages in business activities<br />
from which it may earn revenues and incur expenses<br />
(including revenues and expenses relating to transactions<br />
with other components of the same entity), (b) whose<br />
operating results are regularly reviewed by the entity’s<br />
chief operating decision maker to make decisions about<br />
resources to be allocated to the segment and assess<br />
its performance, and (c) for which discrete financial<br />
information is available.<br />
(t) New and amended standards<br />
The accounting policies and improvement to IFRSs<br />
adopted are consistent with those of the previous financial<br />
year except as follows:<br />
The following new standards, amendments to standards<br />
and interpretations are effective for the year ended<br />
December 31, 2010. If applicable, these standards and<br />
interpretations have been applied in preparing these<br />
consolidated financial statements:<br />
• IFRS 2 Share-based Payment: Company Cash-settled<br />
Share-based Payment Transactions clarifies the scope<br />
and accounting for company cash-settled share-based<br />
payment transactions. The Company adopted this<br />
amendment as of January 1, 2010. It did not have a<br />
material impact on the financial position or performance<br />
of the Company.<br />
• IFRS 3 Business Combinations (Revised) and IAS 27<br />
Consolidated and Separate Financial Statements<br />
(Amended) introduce significant changes in the<br />
accounting for business combinations occurring after<br />
becoming effective. Changes affect the valuation of a<br />
non-controlling interest, the accounting for transaction<br />
costs, the initial recognition and subsequent measurement<br />
of a contingent consideration and business<br />
combinations achieved in stages. These changes impact<br />
the amount of goodwill recognized, the reported results<br />
in the period that an acquisition occurs and future reported<br />
results. IAS 27 (Amended) requires that a change<br />
in the ownership interest of a subsidiary (without loss of<br />
control) is accounted for as a transaction with owners in<br />
their capacity as owners. Therefore, such transactions<br />
will no longer give rise to goodwill, nor will it give rise<br />
to a gain or loss. Furthermore, the amended standard<br />
changes the accounting for losses incurred by the<br />
subsidiary as well as the loss of control of a subsidiary.<br />
The changes by IFRS 3 (Revised) and IAS 27 (Amended)<br />
affect acquisitions or loss of control of subsidiaries<br />
and transactions with non-controlling interests after<br />
January 1, 2010. The change in accounting policy was<br />
applied prospectively and had no material impact on<br />
earnings per share.<br />
• IFRIC 17 Distributions of Non-cash Assets to Owners<br />
provides guidance on accounting for arrangements<br />
whereby an entity distributes non-cash assets to<br />
shareholders either as a distribution of reserves or as<br />
dividends. The interpretation has no effect on either the<br />
financial position or performance of the Company.<br />
Notes to Consolidated Financial Statements 89
Other amendments resulting from improvements to IFRSs<br />
to the following standards did not have any impact on the<br />
accounting policies, financial position or performance of<br />
the Company:<br />
• IAS 17 Leases<br />
(u) Future changes in accounting policies<br />
The following new standards, amendments to standards<br />
and interpretations are not yet effective for the year ended<br />
December 31, 2010. They may, however, be implemented<br />
in future years.<br />
• IAS 24 Related Party Disclosures (Amendment) is<br />
effective for annual periods beginning on or after<br />
January 1, 2011. It clarified the definition of a related<br />
party to simplify the identification of such relationships<br />
and to eliminate inconsistencies in its application.<br />
The revised standard introduces a partial exemption<br />
of disclosure requirements for government related<br />
entities. The Company does not expect any impact on its<br />
financial position or performance.<br />
• IAS 32 Financial Instruments: Presentation –<br />
Classification of Rights Issues (Amendment) is effective<br />
for annual periods beginning on or after February 1,<br />
2010 and amended the definition of a financial liability<br />
in order to classify rights issues (and certain options or<br />
warrants) as equity instruments in cases where such<br />
rights are given pro rata to all of the existing owners<br />
of the same class of an entity’s non-derivative equity<br />
instruments, or to acquire a fixed number of the entity’s<br />
own equity instruments for a fixed amount in any<br />
currency. This amendment will have no impact on the<br />
Company after initial application.<br />
• IFRS 9 Financial Instruments: Classification and<br />
Measurement reflects the first phase of the IASBs<br />
work on the replacement of IAS 39 and applies to<br />
classification and measurement of financial assets as<br />
defined in IAS 39. The standard is effective for annual<br />
periods beginning on or after January 1, 2013. In<br />
subsequent phases, the IASB will address classification<br />
and measurement of financial liabilities, hedge<br />
accounting and derecognition. The completion of<br />
this project is expected in early 2011. The adoption of<br />
the first phase of IFRS 9 will have an effect on the<br />
classification and measurement of the Company’s<br />
financial assets. The Company will quantify the effect<br />
in conjunction with the other phases, when issued, to<br />
present a comprehensive picture.<br />
• IFRIC 14 Prepayments of a minimum funding requirement<br />
(Amendment) effective for annual periods<br />
beginning on or after January 1, 2011 with retrospective<br />
application. The amendment provides guidance on<br />
assessing the recoverable amount of a net pension<br />
asset. The amendment permits an entity to treat the<br />
prepayment of a minimum funding requirement as<br />
an asset. The amendment is not expected to have any<br />
impact on the financial statements of the Company.<br />
• IFRIC 19 Extinguishing Financial Liabilities with Equity<br />
Instruments is effective for annual periods beginning<br />
on or after July 1, 2010. The interpretation clarifies that<br />
equity instruments issued to a creditor to extinguish a<br />
financial liability qualify as consideration paid. The<br />
equity instruments issued are measured at their fair<br />
value. In case that this cannot be reliably measured,<br />
the instruments are measured at the fair value of the<br />
liability extinguished. Any gain or loss is recognized<br />
immediately in profit or loss. The adoption of this<br />
interpretation will have no effect on the financial<br />
statements of the Company.<br />
Improvements to IFRSs (issued in May 2010)<br />
The IASB issued Improvements to IFRSs, an omnibus of<br />
amendments to its IFRS standards. The amendments<br />
have not been adopted as they become effective for annual<br />
periods on or after either July 1, 2010 or January 1, 2011.<br />
The amendments listed below, are considered to have a<br />
possible impact on the Company’s disclosures:<br />
• IFRS 3 Business Combinations<br />
• IFRS 7 Financial Instruments: Disclosures<br />
• IAS 1 Presentation of Financial Statements<br />
• IAS 27 Consolidated and Separate Financial Statements<br />
• IFRIC 13 Customer Loyalty Programmes<br />
The Company, however, expects no impact from the<br />
adoption of the amendments on its financial position<br />
or performance.<br />
90 Notes to Consolidated Financial Statements
4. Segment reporting<br />
For management purposes, the Company is organized<br />
under three separate operating segments: Advanced<br />
Materials, Engineering Systems and Graphit Kropfmühl<br />
(“GK”). Advanced Materials produces specialty metals,<br />
alloys and chemicals and has major production facilities<br />
in the United Kingdom, United States, Germany, Brazil,<br />
Turkey and France. The Engineering Systems Division<br />
provides specialty engineering services through its<br />
development and manufacturing of vacuum furnace<br />
systems and has production facilities that are located<br />
in Germany, France, Singapore, Mexico and the United<br />
States. GK produces specialty graphite and silicon metal<br />
and is located mainly in Germany, Czech Republic, China,<br />
Zimbabwe and Sri Lanka.<br />
As at September 28, 2009, the Company’s ownership<br />
of Timminco went from 50.8% to 47.9%, resulting in a<br />
deemed disposal. Timminco’s activity prior to the loss of<br />
control is recognized as discontinued operations in the<br />
comparable period income statement and statement of<br />
cash flows.<br />
The management reporting format is determined by<br />
operating segments as the operating results for each<br />
segment are organized and managed separately according<br />
to the nature of the products and services provided. Each<br />
segment represents a strategic business unit that offers<br />
different products and serves different markets.<br />
Advanced Materials – This division manufactures and<br />
sells high-quality specialty metals, alloys and metallic<br />
chemicals which are essential to the production of<br />
high-performance aluminum and titanium alloys,<br />
superalloys, steel and certain non-metallic materials<br />
for various applications in the Energy, Aerospace,<br />
Infrastructure, Specialty Metals and Chemicals end<br />
markets. Within Advanced Materials, seven operating<br />
units are aggregated to create one reportable segment.<br />
Engineering Systems – This division is the leading<br />
global supplier of processes and services supplying<br />
technologically advanced vacuum furnace systems to<br />
customers in the aerospace, energy (including solar<br />
and nuclear), transportation, electronics, superalloys<br />
and specialty steel industries. Core specialties of the<br />
Engineering Systems Division are the development of<br />
processes and the design of plants, which are made to<br />
concept by partners in the supplier industry. Engineering<br />
Systems has three operating units and those three<br />
operating units are aggregated to create one reportable<br />
segment.<br />
Graphit Kropfmühl – This division’s operations are mainly<br />
in Germany with its own secured and controlled raw<br />
material resources for graphite in Asia, Africa and Europe.<br />
Graphit Kropfmühl manufactures silicon metal which is<br />
used in the Energy and Specialty Metals and Chemicals<br />
end markets. It also specializes in the extraction,<br />
processing and refining of natural crystalline graphite<br />
for a wide range of energy saving industrial applications.<br />
Graphit Kropfmühl AG is a majority controlled, publicly<br />
listed subsidiary in Germany. GK has two operating units<br />
and those two operating units are aggregated to create<br />
one reportable segment.<br />
AMG headquarters costs and assets are allocated<br />
sixty percent to Advanced Materials and forty percent<br />
to Engineering Systems in 2010 and 2009 based on an<br />
estimation of services provided to the segments.<br />
Management monitors the operating results of its<br />
business units separately for the purpose of making<br />
decisions about resource allocation and performance<br />
assessment. Segment performance is evaluated based<br />
on operating profit or loss and is measured consistently<br />
with operating profit or loss in the consolidated financial<br />
statements. The Company’s headquarters costs, financing<br />
(including finance costs and finance income) and assets<br />
are managed on a group basis and are allocated to<br />
operating segments.<br />
Transfer prices between operating segments are on an<br />
arm’s length basis in a manner similar to transactions<br />
with third parties.<br />
Notes to Consolidated Financial Statements 91
Advanced<br />
Materials<br />
Engineering<br />
Systems<br />
Other and<br />
eliminations<br />
Year ended December 31, 2010<br />
GK<br />
Total<br />
Revenue<br />
Revenue from external customers 616,267 245,652 128,576 – 990,495<br />
Intersegment revenue 524 1,983 – (2,507) –<br />
Total revenue 616,791 247,635 128,576 (2,507) 990,495<br />
Segment results<br />
Operating profit (loss) 20,678 22,916 (335) – 43,259<br />
Finance income 10,920 6,311 869 (12,671) 5,429<br />
Finance expense 9,605 12,164 9,629 (12,671) 18,727<br />
Share of loss of associates and joint ventures (3,066) (4,880) – (11,459) (19,405)<br />
Profit (loss) before income tax 17,910 15,667 (8,763) (11,459) 13,355<br />
Income tax expense 1,862 9,028 317 – 11,207<br />
Profit (loss) for the year 16,048 6,639 (9,080) (11,459) 2,148<br />
Statement of financial position<br />
Segment assets 633,979 368,863 78,476 (251,429) 829,889<br />
Investments in associates and joint ventures 2,439 5,041 – 17,706 25,186<br />
Total assets 636,418 373,904 78,476 (233,723) 855,075<br />
Segment liabilities 290,828 240,237 194,085 (233,723) 491,427<br />
Employee benefits 45,626 29,977 12,769 – 88,372<br />
Provisions 17,003 19,368 4,940 – 41,311<br />
Total liabilities 353,457 289,582 211,794 (233,723) 621,110<br />
Other information<br />
Capital expenditures for expansion – tangible assets 14,420 5,651 2,682 – 22,753<br />
Capital expenditures for maintenance – tangible assets 5,826 1,173 1,507 – 8,506<br />
Capital expenditures – intangible assets 238 1,053 423 – 1,714<br />
Intangible assets acquired 100 100<br />
Depreciation and amortization 12,977 7,604 4,428 – 25,009<br />
Asset impairment – 602 – – 602<br />
92 Notes to Consolidated Financial Statements
Year ended<br />
December 31, 2009<br />
Revenue<br />
Advanced<br />
Materials<br />
Engineering<br />
Systems<br />
GK<br />
Other and<br />
eliminations<br />
Total<br />
continuing<br />
operations<br />
Timminco*<br />
(discontinued)<br />
Revenue from external customers 429,083 320,530 117,834 – 867,447 – 867,447<br />
Intersegment revenue 3,363 5,834 – (9,197) – – –<br />
Total revenue 432,446 326,364 117,834 (9,197) 867,447 – 867,447<br />
Segment results<br />
Operating (loss) profit (28,761) 48,015 1,307 – 20,561 – 20,561<br />
Finance income 5,816 6,283 99 (8,611) 3,587 – 3,587<br />
Finance expense 9,153 12,282 5,595 (8,611) 18,419 – 18,419<br />
Share of loss of associates and<br />
joint ventures (2,758) (1,702) – (27,498) (31,958) – (31,958)<br />
(Loss) profit before income tax (34,929) 37,886 (4,106) (27,498) (28,647) – (28,647)<br />
Income tax (benefit) expense (1,365) 17,851 (1,281) – 15,205 – 15,205<br />
(Loss) profit for the year (33,564) 20,035 (2,825) (27,498) (43,852) – (43,852)<br />
Discontinued operations – – – – – (54,378) (54,378)<br />
(Loss) profit for the year (33,564) 20,035 (2,825) (27,498) (43,852) (54,378) (98,230)<br />
Statement of financial position<br />
Segment assets 546,829 374,549 100,731 (245,925) 776,184 – 776,184<br />
Investments in associates and<br />
joint ventures 5,772 9,562 – 19,460 34,794 – 34,794<br />
Total assets 552,601 384,111 100,731 (226,465) 810,978 – 810,978<br />
Segment liabilities 231,969 289,455 177,750 (245,925) 453,249 – 453,249<br />
Employee benefits 47,609 30,888 12,861 – 91,358 – 91,358<br />
Provisions 15,509 19,815 2,624 – 37,948 – 37,948<br />
Total liabilities 295,087 340,158 193,235 (245,925) 582,555 – 582,555<br />
Other information<br />
Capital expenditures for<br />
expansion – tangible assets 7,161 4,961 6,096 – 18,218 – 18,218<br />
Capital expenditures for<br />
maintenance – tangible assets 4,141 1,173 850 – 6,164 – 6,164<br />
Capital expenditures –<br />
intangible assets 244 601 305 – 1,150 – 1,150<br />
Depreciation and amortization 12,247 7,167 4,344 – 23,758 – 23,758<br />
Asset impairment – 1,718 – – 1,718 1,718<br />
* As at September 28, 2009, the Company’s ownership of Timminco went from 50.8% to 47.9%, resulting in a deemed disposal. Timminco’s<br />
activity prior to the loss of control is recognized as discontinued operations and the comparable periods in the income statement and<br />
statement of cash flows have been restated to reflect this change. See note 6.<br />
Total<br />
Notes to Consolidated Financial Statements 93
Geographical Information<br />
Geographical information for the Company is provided below. Revenues are based on the shipping location of the<br />
customer while non-current assets are based on the physical location of the assets.<br />
2010 2009<br />
Revenues<br />
Non-current<br />
assets Revenues<br />
Non-current<br />
assets<br />
Germany 218,623 95,943 187,101 103,673<br />
US 171,079 48,040 142,238 40,059<br />
Canada 8,779 6,711 4,562 6,746<br />
UK 43,026 21,822 30,088 19,974<br />
Brazil 44,277 31,687 28,341 28,523<br />
France 46,417 17,250 37,576 17,909<br />
Norway 34,595 3 42,373 –<br />
Italy 44,403 – 39,131 –<br />
China 96,012 3,927 110,968 3,985<br />
Japan 28,201 – 17,895 23<br />
Mexico 15,981 19,588 9,983 18,305<br />
Russia 16,218 7 16,725 –<br />
Austria 25,862 74 19,104 –<br />
Belgium 18,943 27 9,705 29<br />
Other Countries 178,079 25,907 171,657 12,029<br />
Total 990,495 270,986 867,447 251,255<br />
Non-current assets for this purpose consist of property, plant and equipment, intangible assets and other<br />
non-current assets.<br />
5. Acquisitions<br />
Acquisition of additional shares of Graphit Kropfmühl<br />
On December 22, 2010 the Company acquired additional<br />
shares in Graphit Kropfmühl. The acquisition of shares<br />
caused the ownership percentage to increase from<br />
79.5% to 88.0%. The Company chose to measure the noncontrolling<br />
interest (”NCI”) at its proportionate share of<br />
the recognized amount of the GK’s net identifiable assets<br />
at the acquisition date. This methodology is allowed as per<br />
IFRS 3R.19. Upon obtaining additional ownership interests,<br />
no additional goodwill was recognized and the transaction<br />
was measured as an equity transaction.<br />
The following is the calculation of the equity transaction:<br />
Non-controlling interest at December 22, 2010 4,502<br />
Transfer to AMG (8.5%) 1,861<br />
12% interest carried forward 2,641<br />
Adjustment to equity:<br />
Fair value of consideration 1 6,431<br />
Change to NCI (as per above) 1,861<br />
Dilution in AMG equity from purchase of NCI 4,570<br />
Acquisition of solar silicon cast technology<br />
On December 20, 2010, the Company acquired intellectual<br />
property and manufacturing assets related to the<br />
Mono 2 suite of solar casting technologies from BP Solar<br />
for $4,000. In addition to acquiring intellectual property<br />
and equipment, an experienced team of scientists and<br />
engineers with significant expertise in silicon casting<br />
were transferred to AMG. AMG will continue research and<br />
development activities, using manufacturing operations<br />
at the BP Solar facility in Frederick, Maryland USA. This<br />
acquisition does not qualify as a business combination<br />
since operational assets and intellectual property were<br />
acquired rather than an existing business. Therefore, this<br />
purchase is being accounted for as an asset acquisition.<br />
The purchase price was allocated as follows based on the<br />
relative fair values at the date of purchase:<br />
Allocated<br />
Value<br />
Equipment 3,600<br />
Inventory 300<br />
Patents 100<br />
Total acquired 4,000<br />
1<br />
calculated as 575,529 AMG shares issued * 18.50 per share<br />
94 Notes to Consolidated Financial Statements
Acquisition of mine in Turkey<br />
On August 31, 2010, the Company signed an agreement to<br />
acquire significant antimony mining rights and an adjacent<br />
antimony metal smelter in Turkey for a total investment<br />
of $17,200, including the assumption of certain liabilities,<br />
other operational improvements, and options to acquire<br />
additional mining rights. The Company acquired 100% of<br />
the shares in Ecopedras LTA from Rolden LLC (“Rolden”),<br />
for a total purchase price of $12,200. Ecopedras then<br />
acquired the 99.99% of the shares in Suda Maden A.S. in<br />
Turkey along with certain operational assets including<br />
inventory, machinery and equipment for $5,000. Suda<br />
Maden A.S. holds certain mining rights over land in<br />
Turkey. This acquisition does not qualify as a business<br />
combination since operational assets were acquired<br />
rather than an existing business. Therefore, this purchase<br />
is being accounted for as an asset acquisition. The<br />
purchase price was allocated as follows based on the<br />
relative fair values at the date of purchase:<br />
Allocated<br />
Value<br />
Building 202<br />
Equipment 1,201<br />
Construction in progress – mining 1,041<br />
Inventory 1,788<br />
Furniture 5<br />
Value added tax receivable 763<br />
Licenses 12,200<br />
Total acquired 17,200<br />
Acquisition of Dynatech Furnaces Private Ltd.<br />
On June 24, 2010, <strong>ALD</strong> GmbH entered into a share<br />
purchase contract to make an investment of $443 to<br />
purchase 30% ownership in Dynatech Furnaces Private<br />
Ltd. (“Dynatech”) from its current ownership. Dynatech is<br />
the largest vacuum heat treatment furnace manufacturer<br />
in India. Dynatech has been in business since 1985 with a<br />
manufacturing and assembly facility in Ambernath, near<br />
Mumbai. The Company is accounting for this investment as<br />
an associate.<br />
Acquisition of additional shares of Timminco Limited<br />
In the first quarter of 2010, Timminco issued 16.2 million<br />
shares to settle a customer contract termination as<br />
well as trade payables. These issuances lowered AMG’s<br />
ownership of Timminco to 38.6%. Between May 13, 2010<br />
and June 14, 2010, Timminco issued 20.2 million shares in<br />
a private placement. The Company acquired 15.4 million<br />
of these private placement shares at a cost of $9,705.<br />
After the private placement, AMG had 42.5% ownership<br />
in Timminco. The Company continues to account for this<br />
investment as an associate.<br />
Acquisition of Thermique Industrie Vide<br />
On March 31, 2010, the Company acquired a 30% interest<br />
in Thermique Industrie Vide (“TIV”), a French engineering<br />
company which specializes in the design, manufacturing<br />
and maintenance of vacuum furnaces for $617. TIV is being<br />
accounted for as an associate.<br />
6. Discontinued operations<br />
On September 28, 2009, one of Timminco’s lenders,<br />
Safeguard International Fund (“SIF”), exercised its option<br />
to convert debt into equity. AMG had the right to retain<br />
its ownership interest upon SIF’s conversion but opted<br />
not to exercise this option. This conversion reduced<br />
AMG’s ownership percentage from 50.8% to 47.9%, thus<br />
triggering a deemed disposal. The loss of control is<br />
accounted for under IFRS 5 guidelines as a discontinued<br />
operation.<br />
The results of Timminco for the discontinued operations<br />
related to the nine months in 2009 are presented below:<br />
2009<br />
Revenue 67,868<br />
Expenses 119,066<br />
Gross profit (51,198)<br />
Finance costs 500<br />
Share of loss of associates –<br />
Impairment loss recognized on the<br />
remeasurement to fair value –<br />
Loss before tax from a<br />
discontinued operation (51,698)<br />
Tax expense: (1,549)<br />
Related to current pre-tax loss (1,549)<br />
Loss for the year from a<br />
discontinued operation (53,247)<br />
Net cash flows incurred by Timminco are as follows:<br />
2009<br />
Operating (18,459)<br />
Investing (32,039)<br />
Financing 47,578<br />
Net cash outflow (2,920)<br />
Loss per share: 2009<br />
Basic, from discontinued operations (1.05)<br />
Diluted, from discontinued operations (1.05)<br />
Notes to Consolidated Financial Statements 95
All assets and liabilities of Timminco were<br />
deconsolidated as at September 28, 2009 and are now<br />
accounted for under the equity method of accounting.<br />
2009<br />
Assets<br />
Non-current assets 192,650<br />
Current assets, excluding cash<br />
and cash equivalents 60,820<br />
Cash and cash equivalents 4,914<br />
Liabilities<br />
Non-current liabilities 67,066<br />
Current liabilities 103,818<br />
Net assets 87,500<br />
Following the classification, a loss on deemed disposal<br />
resulting from the dilution of the share in Timminco of<br />
$1,131 was recognized to reduce the carrying amount of<br />
the net assets and was recognized in the consolidated<br />
income statement in the line item Loss after tax for the<br />
year from discontinued operations.<br />
7. Revenue<br />
2010 2009<br />
Sales of goods 990,042 866,869<br />
Rendering of services (commissions) 453 578<br />
Total 990,495 867,447<br />
For construction contracts, the following has been<br />
recognized using the percentage of completion revenue<br />
recognition method:<br />
2010 2009<br />
Contract revenue recognized 141,075 200,522<br />
Contract expenses recognized 100,470 142,834<br />
Recognized profits 40,605 57,688<br />
Contract costs incurred and<br />
recognized profits 183,714 258,144<br />
Progress billings and advances received 190,367 272,325<br />
Net amount due to customers (6,653) (14,181)<br />
Gross amount due from customers<br />
for contract work (note 17) 42,944 40,583<br />
Gross amount due to customers for<br />
contract work (shown as advance<br />
payments in consolidated statement<br />
of financial position) (49,597) (54,764)<br />
Net amount due to customers (6,653) (14,181)<br />
8. Other income<br />
Note 2010 2009<br />
Grant income i 216 4,030<br />
Gains from asset sales ii - 84<br />
Release of unused provisions iii 254 824<br />
Rental income iv 244 238<br />
Other miscellaneous income v 627 1,006<br />
Total 1,341 6,182<br />
In 2010, other income of $1,341 consisted of:<br />
(i) government grant income of $216 associated with<br />
Graphit Kropfmühl; (ii) income from asset sales of nil;<br />
(iii) release of unused provisions of $254; (iv) rental<br />
income of $244 at two subsidiaries which rent out unused<br />
space and (v) other miscellaneous income of $627.<br />
In 2009, other income of $6,182 consisted of:<br />
(i) government grant income of $4,030 associated with<br />
our Berlin operation and at Graphit Kropfmühl; (ii) income<br />
from asset sales of $84; (iii) release of unused provisions<br />
of $824; (iv) rental income of $238 at two subsidiaries<br />
which rent out unused space and (v) other miscellaneous<br />
income of $1,006.<br />
9. Personnel expenses<br />
Note 2010 2009<br />
Wages and salaries 129,413 118,117<br />
Contributions to defined<br />
contribution plans 25 2,210 2,320<br />
Expenses related to defined<br />
benefit plans 25 8,777 8,164<br />
Social security and<br />
other benefits 26,756 24,989<br />
Performance share units 26 1,964 3,605<br />
Equity-settled<br />
share-based payments 26 6,362 13,729<br />
Total 175,482 170,924<br />
Included in the following<br />
lines of the consolidated<br />
income statement:<br />
Cost of sales 101,724 93,884<br />
Selling, general and<br />
administrative expenses 73,758 77,040<br />
Total 175,482 170,924<br />
96 Notes to Consolidated Financial Statements
10. Finance income and expense<br />
2010 2009<br />
Interest income on bank deposits 525 2,670<br />
Interest income on notes receivable 1,401 470<br />
Gain on valuation of convertible note 371 –<br />
Finance income on derivatives 1,474 49<br />
Discount on provisions 832 –<br />
Other 826 398<br />
Finance income 5,429 3,587<br />
Foreign exchange (gain) loss (2,799) 2,418<br />
Amortization of loan issuance costs 1,849 1,781<br />
Amortization of rate cap instrument – 99<br />
Finance lease expense 53 6<br />
Loss on valuation of convertible note – 187<br />
Interest expense on loans and borrowings 10,884 11,682<br />
Interest expense on interest rate swap 1,375 1,673<br />
Discount for provisions 161 72<br />
Guarantees 1,107 918<br />
Finance costs on derivatives 153 750<br />
Amendment fees 1,675 –<br />
Commitment/unutilized fees 490 551<br />
Other 980 700<br />
Finance expense 18,727 18,419<br />
Net finance costs 10,499 17,250<br />
On May 27, 2010, the Company amended its term loan and revolving credit facility agreement to change several<br />
provisions including certain financial covenants. The Company incurred fees of $1,675 related to the amendments.<br />
See note 23 for further details.<br />
11. Income tax<br />
Significant components of income tax expense for the years ended:<br />
Current tax expense 2010 2009<br />
Current period 27,953 31,266<br />
Adjustment for prior periods (4,775) (2,089)<br />
Total current taxation charges for the year 23,178 29,177<br />
Deferred tax expense<br />
Origination and reversal of temporary differences (13,733) (23,719)<br />
Changes in previously unrecognized tax losses, tax credits<br />
and unrecognized temporary differences (1,245) 19,818<br />
Changes in previously recognized tax losses, tax credits and recognized<br />
temporary differences for changes in enacted tax rates (1,579) (5,066)<br />
Adjustment for prior periods 4,586 (5,005)<br />
Total deferred taxation for the year (11,971) (13,972)<br />
Total income tax expense reported in the income statement 11,207 15,205<br />
The deferred tax related to the net gain on revaluation of cash flow hedges in the amount of $873 (2009: $707) is the only<br />
tax charged or credited directly to equity during the year.<br />
Notes to Consolidated Financial Statements 97
Reconciliation of effective tax rate<br />
A reconciliation of income tax expense applicable to accounting profit (loss) before income tax at the weighted average<br />
statutory income tax rate of 40.42% to the Company’s effective income tax rate for the years ended is as follows:<br />
2010 2009<br />
Profit (loss) before income tax from continuing operations 13,355 (28,647)<br />
Income tax using the Company’s weighted average tax rate 5,398 (5,650)<br />
Non-deductible expenses 8,822 10,336<br />
Current year losses for which no deferred tax asset was recognized<br />
and changes in unrecognized temporary differences (847) 20,084<br />
Recognition of previously unrecognized tax losses, tax credits<br />
and temporary differences of a prior year (397) (266)<br />
Changes in previously recognized tax losses, tax credits and recognized<br />
temporary differences for changes in enacted tax rates (1,579) (5,066)<br />
Under (over) provided in prior periods (190) (7,094)<br />
Other – 2,861<br />
Income tax expense reported in consolidated income statement 11,207 15,205<br />
Income tax attributable to discontinued operations – –<br />
Total income tax expense 11,207 15,205<br />
The weighted average statutory income tax rate is the<br />
average of the statutory income tax rates applicable in<br />
the countries in which the Company operates, weighted<br />
by the profit (loss) before income tax of the subsidiaries in<br />
the respective countries as included in the consolidated<br />
accounts. Some entities have losses for which no deferred<br />
tax assets have been recognized.<br />
During the year ended December 31, 2010, the income<br />
tax benefits related to the current year losses of certain<br />
US, German, and Dutch subsidiaries as well as a Dutch<br />
joint venture were not recognized. During the year ended<br />
December 31, 2009 the income tax benefits related to<br />
the current year losses of certain US, German, Dutch,<br />
UK subsidiaries and a Norwegian joint venture were<br />
not recognized. In total, ($847) and $20,084 were not<br />
recognized in 2010 and 2009, respectively, as it is not<br />
probable that these amounts will be realized.<br />
During the year ended December 31, 2010, certain income<br />
tax benefits related to previously unrecognized tax losses<br />
and temporary differences related to a German subsidiary<br />
were recognized. During the year ended December 31,<br />
2009, certain income tax benefits related to previously<br />
unrecognized tax losses and temporary differences<br />
related to a Brazilian subsidiary were recognized. In<br />
total, $397 and $266 were recognized in 2010 and 2009,<br />
respectively, through an increase to the net deferred tax<br />
asset. The income tax benefits were recognized since it is<br />
probable the amounts will be realized.<br />
In 2009, the Canadian magnesium business was a part<br />
of Timminco and therefore was moved to discontinued<br />
operations. The tax effect of the 2009 discontinued<br />
operation loss is $1,550 which is reflected in loss after tax<br />
for the year from discontinued operations.<br />
Also during the years ended December 31, 2010 and 2009,<br />
the net recognized deferred tax assets (liabilities) were<br />
adjusted for changes in the enacted tax rates in Canada,<br />
Mexico and Germany. The net recognized deferred tax<br />
asset/(liabilities) were also adjusted to reflect accurate tax<br />
rates. The impact of the tax rate changes was a decrease<br />
to income tax expense of $1,579 and $5,066 for 2010 and<br />
2009, respectively.<br />
There were no income tax consequences attached to the<br />
payment of dividends in either 2010 or 2009 by AMG to its<br />
shareholders, as no dividend payments were made.<br />
The main factors considered in assessing the realizability<br />
of deferred tax benefits were improved profitability, higher<br />
forecast profitability and the indefinite carryforwards<br />
period of the tax losses. After assessing these factors, the<br />
Company determined that it is probable that the deferred<br />
tax benefit of the tax losses and temporary differences will<br />
be realized.<br />
98 Notes to Consolidated Financial Statements
Deferred tax assets and liabilities<br />
Deferred taxes reflect the net tax effects of temporary<br />
differences between the carrying amounts of assets<br />
and liabilities for financial reporting purposes and the<br />
amounts used for income tax purposes, as well as tax loss<br />
and tax credit carry-forwards.<br />
Deferred tax assets are recognized to the extent it is<br />
probable that the temporary differences, unused tax<br />
losses and unused tax credits will be realized. The<br />
realization of deferred tax assets is reviewed each<br />
reporting period and includes the consideration of<br />
historical operating results, projected future taxable<br />
income exclusive of reversing temporary differences and<br />
carryforwards, the scheduled reversal of deferred tax<br />
liabilities and potential tax planning strategies.<br />
Recognized deferred tax assets and liabilities<br />
Deferred tax assets and liabilities have been recognized in respect of the following items:<br />
Consolidated<br />
Consolidated statement of financial position income statement<br />
Assets<br />
Liabilities<br />
2010 2009 2010 2009 2010 2009<br />
Inventories 35,625 39,599 17 25 989 (18,890)<br />
Long-term contracts – – 51,217 68,095 (11,814) 23,336<br />
Prepaids and other current assets 1,454 80 11 4 (1,376) (191)<br />
Property, plant and equipment 2,046 1,921 5,126 6,153 (1,039) 662<br />
Deferred charges and non-current assets 114 445 4,718 2,767 2,361 585<br />
Accruals and reserves 8,331 9,171 1,646 1,213 (48) 7,832<br />
Environmental liabilities 173 65 468 1,233 (783) (111)<br />
Retirement benefits 6,090 5,854 – – (677) (937)<br />
Tax loss and tax credit carryforwards 6,105 6,956 64 84 416 1,686<br />
Tax assets and liabilities 59,938 64,091 63,267 79,574<br />
Set off of tax (37,831) (53,179) (37,831) (53,179)<br />
Net tax assets and liabilities 22,107 10,912 25,436 26,395<br />
Deferred tax (benefit) provision (11,971) 13,972<br />
Unrecognized deferred tax assets and liabilities<br />
Certain deferred tax assets and liabilities have not been<br />
recognized in respect of tax loss carryforwards and<br />
temporary differences as they may not be used to offset<br />
taxable profits elsewhere in the Company and they have<br />
arisen in subsidiaries that have been loss-making for<br />
some time.<br />
At December 31, 2010 there were gross unrecognized<br />
tax loss carryforwards of $99,842 from US operations<br />
which expire through 2030, and $29,909 from German<br />
operations, which do not expire, $5,505 from Canadian<br />
operations which expire through 2030 and $93,587<br />
from Dutch operations which expire through 2019. At<br />
December 31, 2009 there were gross unrecognized tax<br />
loss carryforwards of $112,102 from US operations<br />
which expire through 2029, and $112,105 from German<br />
operations, which do not expire and $81,992 from Dutch<br />
operations which expire through 2018.<br />
Notes to Consolidated Financial Statements 99
Deferred tax assets and liabilities have not been recognized in respect of the following items:<br />
Assets<br />
Liabilities<br />
2010 2009 2010 2009<br />
Inventories 309 477 25 47<br />
Prepaids and other current assets 14 708 – 9<br />
Property, plant and equipment 998 75 2,299 2,568<br />
Accruals and provisions 4,498 3,806 55 809<br />
Deferred charges and non-current assets 17,060 906 285 65<br />
Environmental liabilities 4,750 3,723 – –<br />
Retirement benefits 10,136 10,805 – –<br />
Tax loss and tax credit carryforwards 73,970 91,633 – –<br />
Tax assets and liabilities 111,735 112,133 2,664 3,498<br />
Set off of tax (1,567) (2,202) (1,567) (2,202)<br />
Net tax 110,168 109,931 1,097 1,296<br />
12. Exceptional items<br />
Operating profit is adjusted for exceptional items.<br />
Exceptional items comprise income and expense items<br />
that, in the view of management, do not arise in the<br />
normal course of business and items that, because of<br />
their nature and / or size, should be presented separately<br />
to enable a better analysis of the results.<br />
In the years ended December 31, 2010 and 2009, operating<br />
profit was adjusted for exceptional items which arose<br />
during the year.<br />
Operating profit includes the exceptional items noted in the following reconciliation:<br />
2010 2009<br />
Operating profit 43,259 20,561<br />
Asset impairment of fixed assets 602 1,718<br />
Environmental expense 6,421 3,998<br />
Restructuring expense 423 7,782<br />
Adjusted operating profit 50,705 34,059<br />
100 Notes to Consolidated Financial Statements
13. Property, plant and equipment<br />
Cost<br />
Mining<br />
costs<br />
Land and<br />
buildings<br />
Machinery<br />
and<br />
equipment<br />
Furniture<br />
and fixtures<br />
Construction<br />
in progress<br />
Finance<br />
leases<br />
Balance at January 1, 2009 10,261 148,880 397,226 24,876 29,558 965 611,766<br />
Discontinued operations in opening – (46,804) (139,615) – (210) (426) (187,055)<br />
Additions 400 1,747 9,925 1,244 11,066 – 24,382<br />
Retirements and transfers 4,042 1,494 20,355 (3,301) (27,517) – (4,927)<br />
Effect of movements<br />
in exchange rates 185 2,134 3,771 566 50 16 6,722<br />
Balance at December 31, 2009 14,888 107,451 291,662 23,385 12,947 555 450,888<br />
Balance at January 1, 2010 14,888 107,451 291,662 23,385 12,947 555 450,888<br />
Additions – 1,261 11,340 2,181 15,252 1,225 31,259<br />
Acquisition 12,200 202 4,801 5 1,041 – 18,249<br />
Retirements and transfers 274 (1,553) 3,791 (4,675) (4,854) (257) (7,274)<br />
Effect of movements in<br />
exchange rates (493) (5,051) (6,357) (1,314) (101) (43) (13,359)<br />
Balance at December 31, 2010 26,869 102,310 305,237 19,582 24,285 1,480 479,763<br />
Depreciation and impairment<br />
Balance at January 1, 2009 (138) (53,074) (229,591) (15,163) – (330) (298,296)<br />
Discontinued operations in opening – 15,780 64,132 – – 269 80,181<br />
Depreciation for the year (690) (3,566) (15,357) (1,939) – (36) (21,588)<br />
Retirements and transfers (3,052) 89 4,848 2,863 – – 4,748<br />
Impairments – (439) (1,279) – – – (1,718)<br />
Effect of movements in<br />
exchange rates (79) (776) (2,002) (333) – (3) (3,193)<br />
Balance at December 31, 2009 (3,959) (41,986) (179,249) (14,572) – (100) (239,866)<br />
Balance at January 1, 2010 (3,959) (41,986) (179,249) (14,572) – (100) (239,866)<br />
Depreciation for the year (1,142) (2,926) (17,461) (1,850) – (128) (23,507)<br />
Retirements and transfers – 2,934 (1,543) 4,380 – 129 5,900<br />
Impairments – – (602) – – – (602)<br />
Effect of movements in<br />
exchange rates 205 1,845 4,059 807 – 8 6,924<br />
Balance at December 31, 2010 (4,896) (40,133) (194,796) (11,235) – (91) (251,151)<br />
Total<br />
Carrying amounts<br />
At January 1, 2009 10,123 95,806 167,635 9,713 29,558 635 313,470<br />
At December 31, 2009 10,929 65,465 112,413 8,813 12,947 455 211,022<br />
At January 1, 2010 10,929 65,465 112,413 8,813 12,947 455 211,022<br />
At December 31, 2010 21,973 62,177 110,441 8,347 24,285 1,389 228,612<br />
Notes to Consolidated Financial Statements 101
Mining costs<br />
The Company expanded its tantalum mine during 2008.<br />
The mine expansion included developmental stripping<br />
costs of $4,698. Depreciation of these costs began in 2009<br />
using the units of production methodology. During the<br />
years ended December 31, 2010 and 2009, $755 and $297<br />
of these costs have been depreciated. Additional mining<br />
assets exist from the acquisition of GK. Depreciation<br />
of the acquired assets was $387 during the year ended<br />
December 31, 2010 (2009: $393).<br />
Property, plant and equipment under construction<br />
During the year ended December 31, 2010, the<br />
subsidiaries of the Company embarked on several<br />
different expansion projects as well as certain required<br />
maintenance projects. Costs incurred up to December 31,<br />
2010, which are included in construction in progress,<br />
totaled $24,285 (2009: $12,947).<br />
Borrowing costs<br />
The Company had no capitalized borrowing costs incurred<br />
during the years ended December 31, 2010 and 2009.<br />
Finance leases<br />
At December 31, 2010, the Company had $1,389 (2009: $455)<br />
of finance leases for equipment and software.<br />
Sale of equipment<br />
Certain equipment was sold in the years ended<br />
December 31, 2010 and 2009. In those years, the Company<br />
received proceeds of $983 and $129, respectively.<br />
The proceeds were less than the book value of the assets<br />
and losses on disposal of equipment were $262 and<br />
$6,253 in 2010 and 2009, respectively.<br />
Impairment testing<br />
Impairment losses were recorded at certain locations<br />
in 2010 and 2009 due to the discontinued use of<br />
certain assets.<br />
In the year ended December 31, 2010, asset impairment<br />
charges in the amount of $602 were recorded due<br />
to impairment of equipment at a subsidiary in the<br />
United States. These charges were incremental to<br />
the impairment charges of $1,718 taken at the same<br />
subsidiary for a building and equipment in the year<br />
ended December 31, 2009. These impairment charges<br />
are included in the asset impairment expense line of the<br />
consolidated income statement.<br />
Security<br />
At December 31, 2010 properties with a carrying amount<br />
of $131,425 (2009: $116,357) are pledged as collateral to<br />
secure certain bank loans of subsidiaries.<br />
Depreciation of property, plant and equipment<br />
Depreciation expense for the year ended December 31,<br />
2010 was $23,507 (2009: $21,588). Depreciation expense<br />
is recorded in the following line items in the consolidated<br />
income statement:<br />
2010 2009<br />
Cost of sales 20,887 20,064<br />
Selling, general and<br />
administrative expenses 2,620 1,524<br />
Total 23,507 21,588<br />
102 Notes to Consolidated Financial Statements
14. Intangible assets<br />
Cost<br />
Goodwill<br />
Customer<br />
relationships<br />
Supply<br />
contracts<br />
Capitalized<br />
development<br />
costs<br />
Other<br />
intangible<br />
assets<br />
Balance at January 1, 2009 47,273 9,494 4,145 – 22,572 83,484<br />
Discontinued operations in opening (14,431) – – – (4,752) (19,183)<br />
Acquisitions 18 – – – – 18<br />
Additions – – – – 1,150 1,150<br />
Disposals, reversals and transfers – – – – – –<br />
Effect of movements in exchange rates 930 283 123 – 558 1,894<br />
Balance at December 31, 2009 33,790 9,777 4,268 – 19,528 67,363<br />
Balance at January 1, 2010 33,790 9,777 4,268 – 19,528 67,363<br />
Acquisitions – – – – 100 100<br />
Additions – – – 645 1,069 1,714<br />
Disposals, reversals and transfers – – – 1,369 (993) 376<br />
Effect of movements in exchange rates (2,406) (737) (322) (53) (1,353) (4,871)<br />
Balance at December 31, 2010 31,384 9,040 3,946 1,961 18,351 64,682<br />
Amortization and impairment<br />
Balance at January 1, 2009 (10,165) (9,494) (4,145) – (12,620) (36,424)<br />
Discontinued operations in opening – – – – 681 681<br />
Amortization – – – – (2,170) (2,170)<br />
Disposals and reversals – – – – (8) (8)<br />
Impairment – – – – – –<br />
Effect of movements in exchange rates (300) (283) (123) – (483) (1,189)<br />
Balance at December 31, 2009 (10,465) (9,777) (4,268) – (14,600) (39,110)<br />
Balance at January 1, 2010 (10,465) (9,777) (4,268) – (14,600) (39,110)<br />
Amortization – – – (464) (1,038) (1,502)<br />
Disposals and reversals – – – – (8) (8)<br />
Effect of movements in exchange rates 785 737 322 1 1,095 2,940<br />
Balance at December 31, 2010 (9,680) (9,040) (3,946) (463) (14,551) (37,680)<br />
Total<br />
Carrying amounts<br />
At January 1, 2009 37,108 – – – 9,952 47,060<br />
At December 31, 2009 23,325 – – – 4,928 28,253<br />
At January 1, 2010 23,325 – – – 4,928 28,253<br />
At December 31, 2010 21,704 – – 1,498 3,800 27,002<br />
Intangible assets are comprised of goodwill, customer<br />
relationships, supply contracts, capitalized development<br />
costs and other intangible assets. For goodwill, there is no<br />
amortization recorded and instead, impairment tests are<br />
performed. The Company performs goodwill impairment<br />
tests annually in accordance with IFRS guidelines.<br />
The other intangibles amount represents certain licenses,<br />
including software licenses. During 2009, there was an<br />
acquisition of a small trading company for $25 of which<br />
$18 was goodwill.<br />
Research costs<br />
Research costs are expensed as incurred. Development<br />
costs are expensed until they meet the following criteria:<br />
technical feasibility; both the intention and ability to<br />
complete for internal use or as an external sale; probable<br />
generation of future economic benefits; and marketability<br />
existence. Research and development expense are<br />
included in selling, general and administrative expenses<br />
and were $6,017 and $9,967 in the years ended<br />
December 31, 2010 and 2009, respectively.<br />
Amortization of intangible assets<br />
Amortization expense for year ended December 31,<br />
2010 was $1,502 (2009: $2,170). Amortization expense is<br />
recorded in the following line items in the consolidated<br />
income statement:<br />
2010 2009<br />
Costs of sales 871 964<br />
Selling, general and<br />
administrative expenses 631 1,206<br />
Total 1,502 2,170<br />
Notes to Consolidated Financial Statements 103
Impairment testing for cash-generating units<br />
containing goodwill<br />
For the purpose of impairment testing, goodwill and<br />
indefinite-lived intangible assets are allocated to the<br />
Company’s operating divisions that represent the<br />
lowest level within the Company at which the goodwill is<br />
monitored for internal management purposes. Sudamin<br />
and LSM are included in the Advanced Materials segment,<br />
while <strong>ALD</strong> is included in the Engineering Systems<br />
segment. GK is included in its similarly named segment.<br />
The aggregate carrying amounts of goodwill allocated to<br />
each unit are as follows:<br />
2010 2009<br />
Sudamin cash-generating unit (France) 10,484 11,339<br />
LSM cash-generating unit (UK) 1,510 1,510<br />
<strong>ALD</strong> cash-generating unit<br />
(including Furnaces Nuclear<br />
Applications Grenoble) 9,669 10,458<br />
GK cash-generating unit 41 18<br />
Goodwill at cash-generating units 21,704 23,325<br />
Key assumptions<br />
The calculations of value in use are most sensitive to the<br />
following assumptions:<br />
• Global metals pricing<br />
• Discount rate<br />
• Growth rate used to extrapolate cash flows beyond the<br />
business plan period<br />
Global metals pricing – Estimates are obtained from<br />
published indices. The estimates are evaluated and used<br />
to the extent that they meet management’s expectations of<br />
future pricing.<br />
Discount rates – Discount rates reflect management’s<br />
estimate of risks specific to each unit. The discount rate<br />
was estimated based on the average percentage of a<br />
weighted average cost of capital for the Company.<br />
Growth rate assumptions – Rates are based on<br />
management’s interpretation of published industry<br />
research. As most businesses follow economic trends, an<br />
inflationary factor was utilized.<br />
It is possible that the key assumptions related to metals<br />
pricing that were used in the business plan will differ from<br />
actual results. However, management does not believe<br />
that any possible change in pricing will cause the carrying<br />
amount to exceed the recoverable amount. The values<br />
assigned to the key assumptions represent management’s<br />
assessment of future trends in the metallurgical industry<br />
and are based on both external sources and internal<br />
sources (historical data).<br />
For the impairment tests for Sudamin, LSM and <strong>ALD</strong>’s<br />
cash-generating units, the recoverable amounts are<br />
the higher of the fair value less costs to sell and the<br />
value in use. The value in use was determined using<br />
the discounted cash flow method. In 2010 and 2009, the<br />
carrying amounts of the Sudamin, LSM and <strong>ALD</strong> units<br />
were determined to be lower than their recoverable<br />
amounts and impairment losses were not recognized.<br />
(1) Sudamin’s value in use was determined by discounting<br />
the future cash flows generated from the continuing use of<br />
the unit and was based on the following key assumptions:<br />
• Cash flows were projected based on actual operating<br />
results and the 3-year business plan, which covers<br />
the next three calendar years following the impairment<br />
test date.<br />
• The growth rate of 2% was used to extrapolate cash<br />
flow projections beyond the period covered by the most<br />
recent business plans. Management believes that this<br />
growth rate does not exceed the long-term average<br />
growth rate for the metallurgical industry in France.<br />
• Revenue projections are based on an internal 3-year<br />
business plan.<br />
• Discount rates of 10.29% and 9.18% were applied<br />
in determining the recoverable amount of the unit<br />
for the years ended December 31, 2010 and 2009,<br />
respectively. The discount rates were derived from<br />
a group of comparable companies (peer group) and<br />
have been compared to external advisor reports for<br />
reasonableness.<br />
• Sudamin’s value in use exceeds its carrying value at<br />
December 31, 2010 by $77,918.<br />
(2) LSM’s value in use was determined by discounting the<br />
future cash flows generated from the continuing use of<br />
the unit and was based on the following key assumptions:<br />
• Cash flows were projected based on actual operating<br />
results and the 3-year business plan, which covers<br />
the next three calendar years following the impairment<br />
test date.<br />
• The growth rate of 2% was used to extrapolate cash<br />
flow projections beyond the period covered by the most<br />
recent business plans. Management believes that this<br />
growth rate does not exceed the long-term average<br />
growth rate for the metallurgical industry in the UK.<br />
• Revenue projections are based on an internal 3-year<br />
business plan.<br />
• Discount rates of 8.40% and 9.60% were applied in<br />
determining the recoverable amount of the unit for the<br />
years ended December 31, 2010 and 2009, respectively.<br />
The discount rates were derived from a group of comparable<br />
companies (peer group) and have been compared<br />
to external advisor reports for reasonableness.<br />
• LSM’s value in use exceeds its carrying value at<br />
December 31, 2010 by $40,745.<br />
104 Notes to Consolidated Financial Statements
(3) <strong>ALD</strong>’s value in use was determined by discounting the<br />
future cash flows generated from the continuing use of<br />
the unit and was based on the following key assumptions:<br />
• Cash flows were projected based on actual operating<br />
results and the 3-year business plan, which covers the<br />
next three calendar years following the impairment<br />
test date.<br />
• The growth rate of 2% was used to extrapolate cash<br />
flow projections beyond the period covered by the most<br />
recent business plans. Management believes that this<br />
growth rate does not exceed the long-term average<br />
growth rate for the metallurgical and alternative<br />
energy industry.<br />
• Revenue projections are based on an internal 3-year<br />
business plan.<br />
• Discount rates of 8.00% and 8.98% were applied in<br />
determining the recoverable amount of the unit for the<br />
years ended December 31, 2010 and 2009, respectively.<br />
The discount rates were derived from a group of comparable<br />
companies (peer group) and have been compared<br />
to external advisor reports for reasonableness.<br />
• <strong>ALD</strong>’s value in use exceeds its carrying value at<br />
December 31, 2010 by $282,583.<br />
GK purchased a small subsidiary in the year ended<br />
December 31, 2009 and recognized goodwill of $18<br />
upon acquisition. This balance has only changed due<br />
to currency. AMG assessed the fair value of GK as<br />
at December 31, 2010 and 2009. The fair value of GK<br />
approximated the carrying value and therefore, no<br />
adjustment to goodwill value was made in 2010 or 2009.<br />
Impairment of equity investment in Timminco Ltd.<br />
(“Timminco”)<br />
Impairment tests for the Company’s 42.5% equity<br />
investment in Timminco were based on its fair value less<br />
costs to sell. The carrying amount of this individual asset<br />
as of December 31, 2010 was $17,706 (2009: $19,460). The<br />
carrying amounts were determined to be lower than the<br />
investment’s recoverable amounts and no impairment<br />
was necessary in 2010 nor 2009. Timminco’s fair value<br />
was determined by using quoted market prices for the<br />
shares of Timminco, as the shares are publicly traded on<br />
the Toronto Stock Exchange.<br />
Impairment of equity investment in Bostlan S.A.<br />
(“Bostlan”)<br />
Impairment tests for LSM’s 25% equity investment in<br />
Bostlan, an entity located in Spain, were based on its<br />
value in use. The carrying amount of this individual asset<br />
as of December 31, 2010 and 2009 was $2,439 and $2,155,<br />
respectively. The carrying amounts were determined to be<br />
lower than the investment’s recoverable amounts and no<br />
impairment was necessary in 2010 nor 2009.<br />
Bostlan’s value in use was determined by discounting the<br />
future cash flows generated from the continuing use of the<br />
asset and was based on the following key assumptions:<br />
• Cash flows were projected based on actual operating<br />
results and the 3-year business plan, covering the next<br />
three years following the impairment test date.<br />
• The growth rate of 2% was used to extrapolate cash<br />
flow projections beyond the period covered by the most<br />
recent business plans. Management believes that this<br />
growth rate does not exceed the long-term average<br />
growth rate for the metallurgical industry in Spain.<br />
• Revenue projections are based on an internal 3-year<br />
business plan.<br />
• Discount rates of 8.40% and 9.60% were applied in<br />
determining the recoverable amount of the asset for the<br />
years ended December 31, 2010 and 2009, respectively.<br />
The discount rates were derived from a group of comparable<br />
companies (peer group) and have been compared<br />
to external advisor reports for reasonableness.<br />
• Bostlan’s value in use exceeds its carrying value at<br />
December 31, 2010 by $3,234.<br />
15. Associates and joint ventures<br />
The Company’s share of loss in its associates and joint<br />
ventures for 2010 was $19,405 (2009: $31,958).<br />
Acquisition of Dynatech Furnaces Private Ltd.<br />
On June 24, 2010, <strong>ALD</strong> GmbH entered into a share<br />
purchase contract to make an investment of $443 to<br />
purchase 30% ownership in Dynatech Furnaces Private<br />
Ltd. (“Dynatech”) from its current ownership. Dynatech is<br />
the largest vacuum heat treatment furnace manufacturer<br />
in India. Dynatech has been in business since 1985 with a<br />
manufacturing and assembly facility in Ambernath, near<br />
Mumbai. The Company is accounting for this investment as<br />
an associate.<br />
Acquisition of Thermique Industrie Vide<br />
On March 31, 2010, the Company acquired a 30% interest<br />
in Thermique Industrie Vide (“TIV”), a French engineering<br />
company which specializes in the design, manufacturing<br />
and maintenance of vacuum furnaces for $617. TIV is being<br />
accounted for as an associate.<br />
During the year ended December 31, 2009, the owners<br />
of Heidenreich and Harbeck AG (“H&H”) exercised their<br />
call option to convert the Company’s shares of H&H into<br />
shares of ABS Apparaté und Behälterbrau Staßfurt GmbH<br />
(“ABS”). Prior to the conversion, the Company owned 19%<br />
of H&H and accounted for it at cost. The share for share<br />
exchange increased the Company’s share ownership in<br />
ABS from 24.9% to 49%. No additional consideration was<br />
Notes to Consolidated Financial Statements 105
included in this exchange. This transaction had no material<br />
impact on the net investment position of the Company.<br />
On December 18, 2008, a wholly owned subsidiary of the<br />
Company invested $10,432 (including $118 of acquisition<br />
costs) to acquire 50% of Silmag DA. Silmag DA is a joint<br />
venture with Norsk Hydro that was established to develop<br />
a unique process to produce silica and magnesium at a<br />
low cost from olivine, a raw material abundant in Norway.<br />
During 2010, the carrying amounts for this investment<br />
were determined to be greater than the investment’s<br />
recoverable amounts, which were determined to be nil<br />
and the asset was fully impaired. As the asset balance has<br />
been reduced to nil, there will be no additional impairment<br />
recorded in the future related to this investment.<br />
Investment in Timminco<br />
On September 28, 2009, the Company reduced its<br />
ownership percentage of Timminco from 50.8% to 47.9%.<br />
This loss of control resulted in a deemed disposal.<br />
Timminco is therefore, no longer consolidated and is<br />
recorded as an associate in the consolidated statement of<br />
financial position. Effective from the date of the deemed<br />
disposal, all losses of Timminco are recorded in the share<br />
of loss of associates line in the income statement.<br />
In the first quarter of 2010, Timminco issued 16.2 million<br />
shares to settle a customer contract termination as<br />
well as trade payables. These issuances lowered AMG’s<br />
ownership of Timminco to 38.6%. Between May 13, 2010<br />
and June 14, 2010, Timminco issued 20.2 million shares in<br />
a private placement. The Company acquired 15.4 million<br />
of these private placement shares at a cost of $9,705.<br />
After the private placement, AMG had 42.5% ownership<br />
in Timminco. The Company continues to account for this<br />
investment as an associate. Timminco has disclosed<br />
various risks to its ability to continue as a going concern<br />
in its 2010 and 2009 financial statements. Those risks<br />
include its ability to remain in compliance with its debt<br />
covenants. It is noted that the continued support of<br />
lenders is required or Timminco may not be able to realize<br />
its assets or discharge its liabilities.<br />
Summary financial information for associates, adjusted for the percentage ownership held by the Company:<br />
2010<br />
Country Ownership<br />
Total<br />
assets<br />
Total<br />
liabilities Net equity Revenues Expense<br />
Recognized<br />
profit<br />
or loss<br />
Carrying<br />
amount<br />
Bostlan S.A. Spain 25.0% 8,004 5,883 2,121 12,141 11,858 283 2,439<br />
<strong>ALD</strong> Holcroft<br />
V a c u u m<br />
<strong>Technologies</strong> Co. United States 50.0% 1,518 855 663 1,176 1,086 90 310<br />
ABS Apparaté und<br />
Behälterbrau<br />
Staßfurt GmbH Germany 49.0% 3,532 553 2,979 5,623 8,361 (2,738) 3,658<br />
Silmag DA Norway 50.0% 3,824 127 3,697 – 5,581 (5,581) –<br />
Timminco Ltd. Canada 42.5% 66,060 40,493 25,567 53,985 65,444 (11,459) 17,706<br />
Thermique Industrie<br />
V i d e France 30.0% 2,872 2,100 772 3,860 3,860 – 630<br />
Dynatech Furnaces<br />
Private Ltd. India 30.0% 469 495 (26) 822 822 – 443<br />
Total (19,405) 25,186<br />
2009<br />
Bostlan S.A. Spain 25.0% 5,662 3,224 2,438 6,988 6,995 (7) 2,155<br />
<strong>ALD</strong> Holcroft<br />
V a c u u m<br />
<strong>Technologies</strong> Co. United States 50.0% 1,373 1,131 242 2,557 2,617 (60) 238<br />
ABS Apparaté und<br />
Behälterbrau<br />
Staßfurt GmbH Germany 49.0% 3,638 401 3,237 3,196 3,006 190 6,913<br />
Silmag DA Norway 50.0% 8,317 1,337 6,980 – 4,583 (4,583) 6,028<br />
Timminco Ltd. Canada 42.5% 85,108 61,311 23,797 10,242 37,740 (27,498) 19,460<br />
Total (31,958) 34,794<br />
106 Notes to Consolidated Financial Statements
For the entities which are joint ventures, additional financial information is as follows:<br />
Current assets<br />
Non-current<br />
assets Total assets Current liabilities<br />
Non-current<br />
liabilities<br />
Total liabilities<br />
2010<br />
<strong>ALD</strong> Holcroft <strong>Vacuum</strong><br />
<strong>Technologies</strong> Co. 1,446 72 1,518 855 – 855<br />
Silmag DA 122 3,702 3,824 127 – 127<br />
2009<br />
<strong>ALD</strong> Holcroft <strong>Vacuum</strong><br />
<strong>Technologies</strong> Co. 1,334 39 1,373 1,131 – 1,131<br />
Silmag DA 2,142 6,175 8,317 1,337 – 1,337<br />
16. Inventories<br />
2010 2009<br />
Raw materials 84,867 79,471<br />
Work in process 36,270 38,231<br />
Finished goods 83,164 73,151<br />
Other 2,903 2,525<br />
Total 207,204 193,378<br />
Other inventory primarily includes spare parts that are<br />
maintained for operations.<br />
In 2010 raw materials, changes in finished goods and work<br />
in process contributed to cost of sales by $591,536 (2009:<br />
$498,312). In the year ended December 31, 2010, the net<br />
adjustment to net realizable value amounted to a write-up<br />
of $773 (2009: write-down $14,244) and was included in<br />
cost of sales.<br />
Inventory in the amount of $164,793 (2009: $134,531) is<br />
pledged as collateral to secure the bank loans of certain<br />
subsidiaries (see note 23).<br />
17. Trade and other receivables<br />
2010 2009<br />
Trade receivables, net of allowance<br />
for doubtful accounts 125,432 101,482<br />
Notes receivable 7,045 5,721<br />
Gross amount due from customers<br />
for contract work (POC) 140,582 224,162<br />
Less: progress payments received (97,638) (183,578)<br />
Net POC receivables 42,944 40,584<br />
Total 175,421 147,787<br />
At December 31, 2010, trade receivables include<br />
receivables from customers who have received direct<br />
shipments or services from the Company and receivables<br />
from customers who have utilized inventory on<br />
consignment. Amounts billed to percentage of completion<br />
customers are also included in the trade and other<br />
receivables line item in the statement of financial position.<br />
The carrying amount of trade receivables approximates<br />
their fair value due to their short term nature. Trade<br />
receivables are generally non-interest bearing and are<br />
generally on 30-90 day terms.<br />
At December 31, 2010, receivables in the amount of<br />
$169,048 (2009: $138,760) are pledged as collateral to<br />
secure the term loan and multicurrency credit facility<br />
of the Company and the credit facilities of certain<br />
subsidiaries (see note 23).<br />
Notes to Consolidated Financial Statements 107
As at December 31, the analysis of trade receivables that were past due but not impaired is as follows:<br />
Total<br />
Past due but not impaired<br />
Neither past due<br />
nor impaired ‹ 30 days 30–60 days 60–90 days 90–120 days › 120 days<br />
2010 175,421 141,643 19,666 6,062 1,025 447 6,578<br />
2009 147,787 119,287 20,237 1,917 735 3,023 2,588<br />
At December 31, 2010, trade receivables are shown net of an allowance for impairment of $3,130 (2009: $4,864) arising<br />
from customer unwillingness or inability to pay. During the year ended December 31, 2010 and 2009, impairment losses<br />
in the amount of $19 and $2,498, respectively, have been recorded.<br />
Movements in the provision for impairment of receivables were as follows:<br />
2010 2009<br />
At January 1 4,864 2,539<br />
Discontinued operations in opening – (39)<br />
Charge for the year 19 2,498<br />
Amounts written off (92) (154)<br />
Amounts recovered / collected (1,329) –<br />
Unused amounts reversed – (89)<br />
Foreign currency adjustments (332) 109<br />
At December 31 3,130 4,864<br />
18. Other assets<br />
Other assets are comprised of the following:<br />
2010 2009<br />
Prepaid taxes (income and indirect) 22,278 15,884<br />
Prepaid inventory 9,994 5,041<br />
Investments in equity securities 887 970<br />
Pension prepayments 5,279 4,553<br />
Supplier prepayments 1,340 1,860<br />
Insurance 3,775 1,531<br />
Deposits 2,425 2,614<br />
Prepaid tooling 1,926 527<br />
Other miscellaneous assets 8,548 9,359<br />
Total 56,452 42,339<br />
Thereof:<br />
Current 41,080 30,359<br />
Non-current 15,372 11,980<br />
The Company has a strategic investment in a growthbased<br />
company in Iceland. The equity investment cannot<br />
be reliably measured at fair value and is therefore<br />
accounted for using a cost basis. As of December 31, 2010<br />
and 2009, the investment amounted to $887 and $970<br />
respectively. During the year ended December 31, 2009,<br />
the owners of one of the equity investments, Heidenreich<br />
and Harbeck AG (“H&H”) exercised their call option to<br />
convert the Company’s shares of H&H into shares of ABS<br />
Apparaté und Behälterbrau Staßfurt GmbH. See note 15<br />
for more details.<br />
108 Notes to Consolidated Financial Statements
19. Restricted cash<br />
Restricted cash at December 31, 2010 is $12,528 and is<br />
comprised of $3,188 security deposits to secure leasing<br />
activities and $9,178 which provides security to financial<br />
institutions who issue letters of credit on behalf of the<br />
Company. These letters of credit serve two primary<br />
purposes: to provide financial backing for advance<br />
payments made by our customers of the Engineering<br />
Systems Division and to provide financial assurance to<br />
vendors and regulatory agencies to whom the Company is<br />
obligated. Additionally, there is restricted cash related to<br />
import and export allowances in the amount of $162.<br />
Restricted cash at December 31, 2009 is $13,263 and is<br />
comprised of $3,546 security deposits to secure leasing<br />
activities and $9,554 which provides security to financial<br />
institutions who issue letters of credit on behalf of the<br />
Company. These letters of credit serve two primary<br />
purposes: to provide financial backing for advance<br />
payments made by our customers of the Engineering<br />
Systems Division and to provide financial assurance to<br />
vendors and regulatory agencies to whom the Company is<br />
obligated. Additionally, there is restricted cash related to<br />
import and export allowances in the amount of $163.<br />
20. Cash and cash equivalents<br />
2010 2009<br />
Bank balances 72,192 84,876<br />
Call deposits 17,119 32,140<br />
Total 89,311 117,016<br />
Bank balances earn interest at floating rates based on<br />
daily bank deposit rates. Call deposits have maturities<br />
of approximately three months or less depending on the<br />
immediate cash needs of the Company, and earn interest<br />
at the respective short term rates.<br />
At December 31, 2010, the Company had $47,800 of<br />
available liquidity (2009: $79,906) on undrawn committed<br />
borrowing facilities.<br />
The above chart is also representative of the consolidated<br />
cash flow statement, cash and cash equivalents with no<br />
bank overdrafts as of December 31, 2010 (2009: nil) .<br />
21. Capital and reserves<br />
Share capital<br />
At December 31, 2010, the Company’s authorized share<br />
capital was comprised of 65,000,000 ordinary shares<br />
(2009: 100,000,000) with a nominal share value of 10.02<br />
(2009: 10.02) and 65,000,000 preference shares (2009: nil)<br />
with a nominal share value of 10.02.<br />
At December 31, 2010, the issued and outstanding share<br />
capital was comprised of 27,503,885 ordinary shares<br />
(2009: 26,899,548), with a nominal value of 10.02 (2009:<br />
10.02) which were fully paid. No preference shares were<br />
outstanding at December 31, 2010.<br />
A rollforward of the total shares outstanding is noted below:<br />
Balance at January 1, 2009 26,855,586<br />
Shares issued to Supervisory Board 43,962<br />
Balance at December 31, 2009 26,899,548<br />
Balance at January 1, 2010 26,899,548<br />
Shares issued to Supervisory Board 28,808<br />
Shares issued to purchase additional shares<br />
of GK 575,529<br />
Balance at December 31, 2010 27,503,885<br />
Supervisory Board remuneration<br />
During the years ended December 31, 2010 and 2009,<br />
28,808 and 43,962 shares were issued, respectively, as<br />
compensation to its Supervisory Board members as<br />
compensation for services provided in 2010 and 2009.<br />
These shares were awarded as part of the remuneration<br />
policy approved by the Annual General Meeting.<br />
Shares issued to purchase additional shares of<br />
Graphit Kropfmühl<br />
On December 22, 2010, the Company issued 575,529<br />
additional shares in order to acquire an additional 8.5% of<br />
Graphit Kropfmühl. This purchase raised the Company’s<br />
ownership in GK from 79.5% to 88.0%. The Company<br />
chose to measure the non-controlling interest (“NCI”) at<br />
its proportionate share of the recognized amount of the<br />
GK’s net identifiable assets at the acquisition date.<br />
The following is the calculation of the equity transaction:<br />
Non-controlling interest at December 22, 2010 4,502<br />
Transfer to AMG (8.5%) 1,861<br />
12% interest carried forward 2,641<br />
Adjustment to equity:<br />
Fair value of consideration 1 6,431<br />
Change to NCI (as per above) 1,861<br />
Dilution in AMG equity from purchase of NCI 4,570<br />
1<br />
calculated as 575,529 AMG shares issued * 18.50 per share<br />
The negative movement in AMG equity denoted above<br />
represents the discount to fair value at which the AMG<br />
shares were issued in the share for share exchange.<br />
Notes to Consolidated Financial Statements 109
Other reserves<br />
Net unrealized<br />
gains (losses)<br />
reserve<br />
Foreign currency<br />
translation<br />
reserve<br />
Share-based<br />
payment reserve<br />
Balance at January 1, 2009 (12,688) (10,115) 20,588 (2,215)<br />
Currency translation differences – 4,456 – 4,456<br />
Net movement on cash flow hedges 14,162 – – 14,162<br />
Tax effect on net movement<br />
on cash flow hedges (707) – – (707)<br />
Share-based payment activity at subsidiary – – 1,559 1,559<br />
Equity-settled share-based payments – – 14,029 14,029<br />
Balance at December 31, 2009 767 (5,659) 36,176 31,284<br />
Balance at January 1, 2010 767 (5,659) 36,176 31,284<br />
Currency translation differences – (2,556) – (2,556)<br />
Net movement on cash flow hedges 2,736 – – 2,736<br />
Tax effect on net movement<br />
on cash flow hedges (871) – – (871)<br />
Share-based payment activity at subsidiary – – – –<br />
Equity-settled share-based payments – – 5,565 5,565<br />
Balance at December 31, 2010 2,632 (8,215) 41,741 36,158<br />
Total<br />
Net unrealized gains (losses) reserve<br />
The net unrealized gains (losses) reserve comprises the<br />
effective portion of the cumulative net change in the fair<br />
value of cash flow hedging instruments related to hedged<br />
transactions that have not yet occurred. For further<br />
discussion of the cash flow hedges and the amounts that<br />
were realized in the income statement, see note 32.<br />
Foreign currency translation reserve<br />
The translation reserve comprises all foreign currency<br />
differences arising from the translation of the financial<br />
statements of foreign subsidiaries. There are two<br />
primary functional currencies used within the Company:<br />
the US Dollar and the Euro. There are additional<br />
functional currencies used at small companies within<br />
the organization with limited impact to the consolidated<br />
financial statements which are listed below:<br />
British Pound Sterling<br />
Chinese Renminbi<br />
Czech Koruna<br />
Hong Kong Dollar<br />
Japanese Yen<br />
Mexican Peso<br />
Mozambican Metical<br />
Polish Zloty<br />
Turkish Lira<br />
Singapore Dollar<br />
Sri Lankan Rupee<br />
Resulting translation adjustments were reported in a<br />
separate component of equity.<br />
The Company did not record any share of comprehensive<br />
income related to associates or joint ventures in the years<br />
ended December 31, 2010 and 2009.<br />
Share-based payment reserve<br />
The share-based payment reserve is comprised of the<br />
value of equity-settled share-based payments provided<br />
to employees (and outside consultants), including key<br />
management personnel, as part of their remuneration.<br />
Refer to note 26 for details regarding these plans.<br />
Dividends<br />
No dividends have been paid or proposed in the years<br />
ended December 31, 2010 and 2009.<br />
22. Earnings per share<br />
Basic earnings per share<br />
Basic earnings per share amounts are calculated by<br />
dividing net profits for the year attributable to ordinary<br />
equity holders of the parent by the weighted average<br />
of ordinary shares outstanding during the year. As of<br />
December 31, 2010 and 2009, the calculation of basic<br />
earnings per share is performed using the weighted<br />
average shares outstanding for 2010 and 2009, respectively.<br />
Diluted earnings per share<br />
Diluted earnings per share are calculated by dividing<br />
the net profit (loss) attributable to the ordinary equity<br />
holders of the parent by the weighted average number<br />
of ordinary shares outstanding during the year plus the<br />
weighted average number of ordinary shares that would<br />
be issued on the conversion of all the dilutive potential<br />
ordinary shares into ordinary shares. The only category<br />
of potentially dilutive shares at December 31, 2010 and<br />
2009 are AMG’s share options. The diluted earnings per<br />
share calculation includes the number of shares that<br />
could have been acquired at fair value given the exercise<br />
price attached to the outstanding options. The calculated<br />
110 Notes to Consolidated Financial Statements
number of shares is then compared with the number of<br />
shares that would have been issued assuming the exercise<br />
of the share options. In years when there is a net loss<br />
attributable to shareholders, the dilutive effect of potential<br />
shares is not taken into effect.<br />
Earnings 2010 2009<br />
Net profit (loss) attributable<br />
to equity holders for basic<br />
and diluted earnings per share 2,414 (75,642)<br />
Number of shares (in 000’s)<br />
Weighted average number of ordinary<br />
shares for basic earnings per share 26,918 26,861<br />
Dilutive effect of share-based payments – –<br />
Weighted average number of ordinary<br />
shares adjusted for effect of dilution 26,918 26,861<br />
As documented in note 6, the loss per share from<br />
discontinued operations for the year ended December 31,<br />
2009 was 1.05. This loss per share can be deducted from<br />
the total loss per share for 2009 in order to arrive at the<br />
loss per share from continuing operations.<br />
23. Loans and borrowings<br />
This note provides information about the contractual<br />
terms of the Company’s interest-bearing loans and<br />
borrowings. For more information about the Company’s<br />
exposure to interest rate and foreign currency risk,<br />
see notes 31.<br />
Non-current Effective interest rate Maturity 2010 2009<br />
171,003 Term Loan EURIBOR + 2.25% 08/2012 90,460 95,835<br />
$175,000 Term Loan Revolver EURIBOR + 2.25% 08/2012 69,000 39,000<br />
113,225 GK SPK Passau 3.75%–5.85% 03/2013-03/2018 6,151 8,551<br />
14,000 GK Unicredit 5.08%–6.58% 09/2013-12/2014 2,863 4,473<br />
11,400 GK Landesbank 4.65% 03/2017 1,275 1,630<br />
12,200 GFE bank loan 4.95% 12/2023 2,071 2,374<br />
13,466 GfE subsidiary debt 4.05–6.30% 03/2013-03/2023 1,722 2,346<br />
19,825 <strong>ALD</strong> subordinated loan 8.04% 08/2012 13,105 14,082<br />
Capital lease obligations 4.60%–11.90% 07/2014-06/2015 1,166 28<br />
Total 187,813 168,319<br />
Current Effective interest rate Maturity 2010 2009<br />
113,225 GK SPK Passau 3.75–5.85% 03/2013-03/2018 1,761 1,377<br />
14,000 GK Unicredit 5.08%–6.58% 09/2013-12/2014 1,313 1,141<br />
11,400 GK Landesbank 4.65% 03/2017 232 251<br />
12,200 GFE bank loan 4.95% 12/2023 123 126<br />
13,466 GfE subsidiary debt 4.05–6.30% 03/2013-03/2023 465 500<br />
Capital lease obligations 4.60%–11.90% 07/2014-06/2015 360 69<br />
Total 4,254 3,464<br />
Term loan and revolving credit facility<br />
On August 30, 2007, the Company entered into a $275,000<br />
term loan and revolving credit facility (“Credit Facility”). This<br />
facility provides the Company with a $100,000 term loan and<br />
up to $175,000 in revolver borrowings, which are subject<br />
to certain affirmative and negative covenants. Borrowings<br />
under the revolving credit facility may be used for general<br />
corporate purposes of the Company. As of December 31,<br />
2010, $69,000 was outstanding under the revolving credit<br />
facility (2009: $39,000). At December 31, 2010, there was<br />
unused availability of $47,800 (December 31, 2009: $79,906).<br />
The facility terminates in August 2012.<br />
Interest on the Credit Facility is based on current LIBOR<br />
(or in the case of any loans denominated in Euros,<br />
EURIBOR) plus a margin. The margin is dependent on the<br />
leverage ratio. At December 31, 2010, the margin was 2.25<br />
(2009: 1.50). To mitigate risk, the Company entered into an<br />
interest rate swap to fix the interest rate on the term loan<br />
at 3.67%.<br />
The Credit Facility is subject to several affirmative and<br />
negative covenants including, but not limited to, the<br />
following:<br />
• EBITDA to Net Finance Charges: Not to be less than<br />
3.00:1<br />
• Net Debt to EBITDA: Not to exceed 3.75:1<br />
• Senior Net Debt to EBITDA: Not to exceed 3.00:1<br />
EBITDA, Net Finance Charges, Net Debt and Senior Net<br />
Debt are defined in the Credit Facility agreement.<br />
Notes to Consolidated Financial Statements 111
On May 27, 2010, the Company amended and restated<br />
the Credit Facility in order to adjust certain provisions<br />
for the strategic plans of the Company. Included in the<br />
amendments was a change to the Senior Net Debt to<br />
EBITDA covenant. Previously, the maximum ratio for<br />
this covenant was 2.00:1. The amendment increased the<br />
maximum ratio to 3.00:1. Fees related to this amendment<br />
were $1,675 and are included in finance expense.<br />
Mandatory repayment of the credit facility is required<br />
upon the occurrence of (i) a change of control or (ii) the<br />
sale of all or substantially all of the business and/or<br />
assets of the Company whether in a single transaction or<br />
a series of related transactions.<br />
Debt issuance costs<br />
In connection with the term loan which commenced in<br />
2007, the Company incurred issuance costs of $9,405<br />
which were deducted from the proceeds of the debt from<br />
the term loan. These amounts are shown net against the<br />
outstanding term loan balance and are amortized using<br />
the effective interest method using a rate of 8.50%.<br />
The Company also has a Subordinated Loan Agreement<br />
with HSBC Trinkhaus & Burkhardt KGaA. The principal<br />
amount of the subordinated loan is $13,105 (2009:<br />
$14,082).The subordinated loan bears interest at 7.27%.<br />
A disagio of 4.0% was applied on the subordinated loan;<br />
therefore the effective rate of interest is 8.04%. The term<br />
of the subordinated loan is unlimited. The Agreement can<br />
be terminated no earlier than August 10, 2012.<br />
A German subsidiary maintains a loan agreement with<br />
Sparkasse Nuremberg which was originated on December 1,<br />
2003 and requires annual payments of approximately<br />
$123. This loan is secured by land and buildings.<br />
Graphit Kropfmühl (“GK”) debt<br />
A subsidiary of GK maintains a government subsidized<br />
loan agreement with Bayrische Landesbank and various<br />
other loan agreements with HypoVereinsbank, Unicredit<br />
and Sparkasse Passau. The loans carry various interest<br />
rates and were recognized by the Company upon the<br />
acquisition of GK. Those with floating interest rates have<br />
been fixed through interest rate swaps. See note 32. These<br />
loans are secured by GK’s property, plant and equipment.<br />
Capital leases<br />
As of December 31, 2010, AMG subsidiaries had three<br />
capital leases outstanding to finance machinery. Monthly<br />
payments under these three leases are $40. The leases<br />
mature in 2014 and 2015.<br />
On May 1, 2005, <strong>ALD</strong> entered into a 60 month capital lease<br />
for a software program. Annual payments under this<br />
lease are approximately $1. The lease expired during 2009.<br />
There are no outstanding balances as of December 31,<br />
2010.<br />
Debt repayments<br />
The Company made capital lease and debt repayments of<br />
$3,432 during 2010. Payments included GK paying $2,703<br />
and GfE paying $579 to various banks and the remaining<br />
$150 relates to capital lease and other debt repayments.<br />
The Company made various capital lease and debt<br />
repayments of $15,785 during 2009. Of this amount,<br />
AMG repaid $12,000 on its Term Loan revolver, which it<br />
had previously borrowed in 2009, and GK made $2,639<br />
payments to various banks offset by additional borrowings<br />
in the amount of $6,013. The remaining $1,146 relates to<br />
various capital lease and other debt repayments.<br />
24. Short term bank debt<br />
The Company’s Brazilian subsidiary maintains short term<br />
secured and unsecured borrowing arrangements with<br />
various banks. Borrowings under these arrangements<br />
are included in short term debt on the consolidated<br />
statement of financial position and aggregated $30,565 at<br />
December 31, 2010 (2009: $20,981) at a weighted-average<br />
interest rate of 5.70%.<br />
GK maintains short term secured and unsecured credit<br />
facilities with various banks to fund short term operating<br />
activities and capital projects. This short term debt<br />
carries both floating and fixed interest rates. The balance<br />
of these facilities at December 31, 2010 was $14,421 (2009:<br />
$11,032) at a weighted-average interest rate of 3.75%.<br />
The Company’s French subsidiary had additional short<br />
term borrowings of $36 as of December 31, 2010.<br />
25. Employee benefits<br />
Defined contribution plans<br />
Certain of the Company’s subsidiaries maintain US tax<br />
qualified defined contribution plans covering substantially<br />
all of the Company’s salaried and hourly employees at<br />
US subsidiaries. All contributions, including a portion<br />
that represents a company match, are made in cash into<br />
mutual fund accounts in accordance with the participants’<br />
investment elections. The assets of the plans are held<br />
separately from the assets of the subsidiaries under the<br />
control of trustees. Where employees leave the plans<br />
prior to vesting fully in the Company contributions, the<br />
contributions or fees payable by the Company are reduced<br />
by the forfeited contributions.<br />
In Europe, the employees are members of state-managed<br />
retirement benefit plans operated by the government.<br />
The subsidiaries are required to contribute a specified<br />
percentage of payroll costs to the retirement benefit<br />
scheme to fund the benefits. The only obligation of the<br />
112 Notes to Consolidated Financial Statements
subsidiaries with respect to the retirement benefit plan is<br />
to make the specified contributions.<br />
The total expense as of December 31, 2010 recognized<br />
in the consolidated income statement of $2,210 (2009:<br />
$2,320) represents contributions paid and payable to<br />
these plans.<br />
Defined benefit plans<br />
North American plans<br />
US plans (Metallurg)<br />
Certain of the Company’s US subsidiaries have taxqualified,<br />
noncontributory defined benefit pension plans<br />
covering substantially all salaried and certain hourly paid<br />
employees. The plans generally provide benefit payments<br />
using a formula based on an employee’s compensation<br />
and length of service. These plans are funded in amounts<br />
equal to the minimum funding requirements of the US<br />
Employee Retirement Income Security Act. Substantially<br />
all plan assets are invested in cash and short term<br />
investments or listed stocks and bonds.<br />
On May 20, 2010, the Company entered into an additional<br />
Supplemental Executive Retirement Plan (“2010 SERP”)<br />
with William Levy, its Chief Financial Officer. Pursuant to<br />
the terms of the 2010 SERP, Mr. Levy will earn additional<br />
retirement benefits for continued service with the<br />
Company. The maximum retirement benefit payment<br />
under the 2010 SERP is equal to 50% of the final three year<br />
average compensation reduced by retirement benefits<br />
as determined in accordance with the Company’s defined<br />
contribution plan and payable from age 65 until age 88.<br />
The maximum retirement benefit payment will also be<br />
reduced in the case of the commencement of benefit<br />
payments prior to age 65 as a result of early termination<br />
and/or early retirement. Under the terms of the 2010<br />
SERP, the Company has no obligation to set aside,<br />
earmark or entrust any fund or money with which to pay<br />
the obligations thereto.<br />
On June 1, 2005, Metallurg entered into a Supplemental<br />
Executive Retirement Plan (“SERP”) with Eric E. Jackson,<br />
its President and Chief Operating Officer. This SERP<br />
was amended in May 2010. Pursuant to the terms<br />
of the SERP and its amendments, Mr. Jackson will<br />
earn additional retirement benefits for continued<br />
service with the Company. The maximum retirement<br />
benefit payment under the SERP is equal to 50% of<br />
the final three year average compensation reduced by<br />
Mr. Jackson’s retirement benefits under the Company’s<br />
defined contribution plan as well as reduced by benefits<br />
determined in accordance with Metallurg’s US defined<br />
benefit plan and payable from age 65 until age 88. The<br />
maximum retirement benefit payment will also be<br />
reduced in the case of the commencement of benefit<br />
payments prior to age 65 as a result of Mr. Jackson’s early<br />
termination and/or early retirement. Under the terms<br />
of the SERP, Metallurg has no obligation to set aside,<br />
earmark or entrust any fund or money with which to pay<br />
the obligations thereto.<br />
On April 1, 2007, Metallurg entered into an additional<br />
Supplemental Executive Retirement Plan (“Executive<br />
SERP”) with Heinz Schimmelbusch and Arthur Spector,<br />
its Chief Executive Officer and former Deputy Chairman,<br />
respectively. Pursuant to the terms of the agreements,<br />
these officers earn additional retirement benefits for<br />
continued service with the Company. The maximum<br />
retirement benefit under these Executive SERP<br />
agreements is 50% of their final average compensation<br />
with a maximum per annum of $600 and $500 for<br />
Dr. Schimmelbusch and Mr. Spector, respectively. Onethird<br />
of the benefit was recorded as of April 7, 2007 and<br />
the remaining two-thirds were accrued ratably on the first<br />
day of each of the following twenty-four months. Pension<br />
expense related to the Executive SERP in 2010 totaled<br />
$575 (2009: $1,118). Under the terms of the Executive<br />
SERP, Metallurg has no obligation to set aside, earmark<br />
or entrust any fund or money with which to pay the<br />
obligations thereto. However, the amounts are guaranteed<br />
by AMG. Mr. Spector left the employ of AMG effective<br />
September 30, 2009 and initiated payments from his<br />
Executive SERP on November 1, 2010.<br />
Actuarial assumptions<br />
Principal actuarial assumptions at the reporting date<br />
(expressed as weighted averages) are presented below.<br />
2010 2009<br />
% per annum % per annum<br />
Expected return on plan assets<br />
at January 1 8.00 8.25<br />
Inflation N/A N/A<br />
Salary increases N/A N/A<br />
Rate of discount at December 31 5.63 6.13<br />
Taxable wage base increases N/A N/A<br />
IRC Section 401(a)(17) and<br />
415 limits increases N/A N/A<br />
The actual return on plan assets for the year ending<br />
December 31, 2010 was 14.8% and the actual return on<br />
plan assets for the year ending December 31, 2009 was<br />
22.46%. The investment strategy of the subsidiaries<br />
is to achieve long-term capital appreciation, while<br />
reducing risk through diversification in order to meet<br />
the obligations of the plans. The expected return on<br />
plan assets assumption, reviewed annually, reflects<br />
the average rate of earnings expected on the funds<br />
invested using weighted average historical returns of<br />
approximately 9.0% for equities, 5.0% for debt, 7.4% for<br />
other and 4.0% for cash. The overall expected rate of<br />
return on assets is determined based on the market<br />
expectations prevailing on that date, applicable to the<br />
Notes to Consolidated Financial Statements 113
period over which the obligation is to be settled. The<br />
expectation used for 2010 was 8.0% (2009: 8.25%) for the<br />
US plans.<br />
Assumptions regarding future mortality are based on<br />
published statistics and the RP-2000 Combined Healthy<br />
Mortality table. The valuation was prepared on a goingplan<br />
basis. The valuation was based on members in<br />
the Plan as of the valuation date and did not take future<br />
members into account. No provision has been made<br />
for contingent liabilities with respect to non-vested<br />
terminated members who may be reemployed. No<br />
provisions for future expenses were made.<br />
Medical cost trend rates are not applicable to these plans.<br />
The best estimate of contributions to be paid to the plans<br />
for the year ending December 31, 2011 is $1,446.<br />
European plans<br />
LSM plans<br />
The Company sponsors the LSM 2006 Pension Plan and<br />
the LSM Additional Pension Plan, which are defined<br />
benefit arrangements. LSM’s defined benefit pension<br />
plans cover all eligible employees in the UK.<br />
Benefits under these plans are based on years of service<br />
and the employee’s compensation. Benefits are paid either<br />
from plan assets or, in certain instances, directly by LSM.<br />
Substantially all plan assets are invested in listed stocks<br />
and bonds. The expected return on bonds is determined<br />
by reference to UK long dated gilt and bond yields at the<br />
reporting date. The expected rate of return on equities<br />
have been determined by setting an appropriate risk<br />
premium above gilt/bond yields having regard to market<br />
conditions at the reporting date. The expected long-term<br />
return on cash is equal to bank base rates at the<br />
reporting date.<br />
The expected long-term rates of return on plan assets are<br />
as follows:<br />
2010 2009<br />
% per annum % per annum<br />
Equities 8.50 9.60<br />
Bonds 4.15–5.50 3.90–6.70<br />
Cash 2.00 2.00<br />
Other 3.90 3.90<br />
Overall for LSM plans 6.30 7.41<br />
The actual return on plan assets for the year ending<br />
December 31, 2010 was 21.5% (2009: 13.3%) for the<br />
primary and 4.1% (2009: 11.7%) for the additional defined<br />
benefit plan.<br />
Actuarial assumptions<br />
2010 2009<br />
% per annum % per annum<br />
Inflation 3.50 3.60<br />
Salary increases N/A N/A<br />
Rate of discount at December 31 5.40 5.65<br />
Allowance for pension in payment<br />
increases of the Retail Prices<br />
Index (“RPI”) or 5% p.a. if less 3.40 3.50<br />
Allowance for revaluation of<br />
deferred pensions of RPI or<br />
5% p.a. if less 3.50 3.60<br />
Allowance for commutation of<br />
pension for cash at retirement nil nil<br />
Assumptions regarding future mortality are based on<br />
published statistics and mortality tables.<br />
The best estimate of contributions to be paid to the<br />
primary plan for the year ending December 31, 2011 is<br />
$1,127. In the additional pension plan, only payments for<br />
expenses to run the plan, together with the levy for the<br />
Pension Protection Fund, are expected to be made in 2011.<br />
<strong>ALD</strong> plans<br />
<strong>ALD</strong> has defined benefit plans that cover employees in<br />
Germany. The benefits are based on years of service and<br />
average compensation.<br />
On March 30, 2010, the Company entered into an additional<br />
Supplemental Executive Retirement Plan (“German<br />
SERP”) with Dr. Reinhard Walter, President of Engineering<br />
Systems. Pursuant to the terms of the German SERP,<br />
Dr. Walter will earn additional retirement benefits for<br />
continued service with the Company. The maximum<br />
retirement benefit payment under the German SERP<br />
is $315 per annum reduced by retirement benefits as<br />
determined in accordance with the Company’s <strong>ALD</strong> plans<br />
and payable from age 65 until age 88. The maximum<br />
retirement benefit payment will also be reduced in the case<br />
of the commencement of benefit payments prior to age 65<br />
as a result of early termination and/or early retirement.<br />
Under the terms of the German SERP, the Company has<br />
no obligation to set aside, earmark or entrust any fund or<br />
money with which to pay the obligations thereto.<br />
Actuarial assumptions<br />
Principal actuarial assumptions at the reporting date are<br />
presented below.<br />
2010 2009<br />
% per annum % per annum<br />
Expected return on plan assets<br />
at January 1 3.75 3.75<br />
Inflation N/A N/A<br />
Salary increases 2.00 2.00<br />
Rate of discount at December 31 5.28 5.41<br />
Pension payments increases 1.75 1.75<br />
114 Notes to Consolidated Financial Statements
Assumptions regarding future mortality are based<br />
on published statistics and mortality tables<br />
(“Richttafeln 2005G”).<br />
The best estimate of contributions to be paid to the<br />
plans for the year ending December 31, 2011 is<br />
approximately $1,111.<br />
GfE plans<br />
GfE has two defined benefit plans that cover all of the<br />
employees who were considered plan participants prior<br />
to 2005. Each plan has been closed to new participants –<br />
one was closed in 1992 and the other was closed in 2005.<br />
The plan benefits are funded by insurance contracts which<br />
are managed by Swiss Life Group. Benefits are paid by the<br />
insurance contracts and are based on years of service and<br />
average compensation.<br />
An additional defined benefit plan covers two former<br />
managing directors from a previous acquisition. The plan<br />
benefits are funded by insurance contracts. Benefits<br />
are paid by the insurance contracts and are based on<br />
individual agreements with the managing directors.<br />
Actuarial assumptions<br />
Principal actuarial assumptions at the reporting date are<br />
presented below.<br />
2010 2009<br />
% per annum % per annum<br />
Inflation 2.25 2.25<br />
Salary increases 3.00 3.00<br />
Rate of discount at December 31 4.86 5.20<br />
Pension payments increases 2.25 2.25<br />
Assumptions regarding future mortality are based on<br />
published statistics and mortality tables (“Richttafeln<br />
2005G” and “Heuback 2005G”).<br />
GfE plan assets consist of insurance contracts, and the<br />
expected long term rates of return are 4.5%(2009: 5.0%).<br />
The best estimate of contributions to be paid to<br />
GfE’s plans for the year ending December 31, 2011 is<br />
approximately $2,285.<br />
Sudamin Plans<br />
The French office and operations of Sudamin have defined<br />
benefit pension plans which cover all employees. Sudamin<br />
funds the pension plans through an external insurance<br />
company but there are no plan assets. Benefits under<br />
the plans are based on the beginning of service for all<br />
employees; however, employees must be employed by<br />
Sudamin at retirement in order to obtain any benefits as<br />
vesting is only upon retirement. Benefits are paid by the<br />
external insurance company.<br />
Actuarial assumptions<br />
Principal actuarial assumptions at the reporting date are<br />
presented below.<br />
2010 2009<br />
% per annum % per annum<br />
Inflation N/A N/A<br />
Salary increases 2.50 2.50<br />
Rate of discount at December 31 3.59 3.90<br />
The discount rate used is based on the yields of AA rated<br />
euro zone corporate bonds plus 10 years.<br />
Assumptions regarding future mortality are based on<br />
published statistics and mortality tables (“2006-2008<br />
INSEE”).<br />
The best estimate of contributions to be paid to<br />
Sudamin’s plans for the year ending December 31, 2011<br />
is approximately $46.<br />
Graphit Kropfmühl (“GK”) plans<br />
Graphit Kropfmühl has two defined benefit plans<br />
that cover all of the employees in Germany. The plan<br />
benefits are not funded. Benefits are paid by insurance<br />
contracts and are based on years of service and<br />
average compensation.<br />
Actuarial assumptions<br />
Principal actuarial assumptions at the reporting date are<br />
presented below.<br />
2010 2009<br />
% per annum % per annum<br />
Inflation 2.00 1.50<br />
Salary increases 2.50 1.80<br />
Rate of discount at December 31 4.95 5.25<br />
Pension payment increases 2.00 1.50<br />
Assumptions regarding future mortality are based on<br />
published statistics and mortality tables (“Heuback<br />
2005G”).<br />
The best estimate of contributions to be paid to GK’s plans<br />
for the year ending December 31, 2011 is approximately<br />
$1,296.<br />
Presented below are employee benefits disclosures for<br />
plans aggregated by geographical location into the North<br />
American and European groups.<br />
Notes to Consolidated Financial Statements 115
North American plans<br />
European plans<br />
2010 2009 2010 2009<br />
Present value of unfunded obligations 12,699 9,794 1,306 1,032<br />
Present value of funded obligations 25,920 24,266 176,594 179,099<br />
Total present value of obligations 38,619 34,060 177,900 180,131<br />
Fair value of plan assets (19,160) (17,127) (95,812) (93,076)<br />
Unrecognized actuarial losses (6,799) (5,727) (10,934) (10,872)<br />
Net liability for defined benefit obligations 12,660 11,206 71,154 76,183<br />
Movement in employee benefits<br />
North American plans<br />
European plans<br />
2010 2009 2010 2009<br />
Recognized liability for defined benefit obligations at January 1 11,206 27,432 76,183 73,157<br />
Discontinued operations in opening – (18,245) – –<br />
Expense recognized in profit and loss (see below) 2,635 2,191 6,142 5,973<br />
Benefits paid directly by the employer (65) – (3,711) (3,926)<br />
Employer contributions (1,116) (172) (1,430) (1,328)<br />
Effect of movements in foreign exchange rates – – (6,030) 2,307<br />
Net liability for defined benefit obligations at December 31 12,660 11,206 71,154 76,183<br />
Asset for defined benefit obligations at December 31 – – 4,558 3,969<br />
Liability for defined benefit obligations at December 31 12,660 11,206 75,712 80,152<br />
Plan assets consist of the following<br />
North American plans<br />
European plans<br />
2010 2009 2010 2009<br />
Equity securities 10,312 9,209 23,830 22,065<br />
Debt securities 8,082 7,233 65,245 64,374<br />
Cash 383 343 3,633 77<br />
Other 383 342 3,104 6,560<br />
Total 19,160 17,127 95,812 93,076<br />
Movement in present value of defined benefit obligations<br />
North American plans<br />
European plans<br />
2010 2009 2010 2009<br />
Present value of defined benefit obligations at January 1 34,060 88,865 180,131 146,640<br />
Discontinued operations in opening – (57,376) – –<br />
Benefits paid directly by the employer or from the plan assets (1,528) (1,422) (8,840) (10,733)<br />
Contributions from plan participants – – – –<br />
Past service cost 1,250 – – 607<br />
Current service costs and interest (see below) 2,385 2,832 11,669 11,135<br />
Unrecognized actuarial losses 2,452 1,161 4,089 19,734<br />
Effect of movements in foreign exchange rates – – (9,149) 12,748<br />
Present value of defined benefit obligations at December 31 38,619 34,060 177,900 180,131<br />
116 Notes to Consolidated Financial Statements
Movement in fair value of plan assets<br />
North American plans<br />
European plans<br />
2010 2009 2010 2009<br />
Fair value of plan assets at January 1 17,127 47,245 93,076 77,433<br />
Discontinued operations in opening – (32,254) – –<br />
Employer contributions 1,115 172 1,430 1,328<br />
Contributions from plan participants – – – –<br />
Benefits paid from the plan assets (1,462) (1,422) (5,051) (6,807)<br />
Expected return on plan assets 1,364 1,196 5,511 5,669<br />
Unrecognized actuarial gains 1,016 2,190 5,284 4,359<br />
Effect of movements in foreign exchange rates – – (4,438) 11,094<br />
Fair value of plan assets at December 31 19,160 17,127 95,812 93,076<br />
Expense recognized in profit or loss<br />
North American plans<br />
European plans<br />
2010 2009 2010 2009<br />
Current service costs 328 913 2,352 2,052<br />
Past service costs 1,250 – – 607<br />
Interest on obligation 2,057 1,919 9,317 9,083<br />
Expected return on plan assets (1,364) (1,196) (5,511) (5,669)<br />
Recognized actuarial losses (gains) 364 555 (16) (100)<br />
Amortization of vested past service cost – – – –<br />
Expense recognized in profit and loss 2,635 2,191 6,142 5,973<br />
Net expense recognized in profit and loss<br />
The expense is recognized in the following line items in the income statement:<br />
North American plans<br />
European plans<br />
2010 2009 2010 2009<br />
Cost of sales 166 229 2,195 2,939<br />
Selling, general and administrative expenses 2,469 1,962 3,947 3,034<br />
Total 2,635 2,191 6,142 5,973<br />
Amounts for the current and previous four periods are as follows:<br />
North American Plans<br />
2010 2009 2008 2007 2006<br />
Defined benefit obligation 38,619 34,060 88,865 101,922 88,319<br />
Plan assets 19,160 17,127 47,245 67,347 59,460<br />
Deficit (19,459) (16,933) (41,620) (34,575) (28,859)<br />
Experience adjustments on plan liabilities 116 59 6,713 1,167 (762)<br />
Experience adjustments on plan assets 1,017 2,190 (1,420) (3,541) 1,251<br />
European Plans<br />
2010 2009 2008 2007 2006<br />
Defined benefit obligation 177,900 180,131 146,640 178,989 186,267<br />
Plan assets 95,812 93,076 77,433 126,497 120,123<br />
Deficit (82,088) (87,055) (69,207) (52,492) (66,144)<br />
Experience adjustments on plan liabilities 10,988 (6,567) (26,073) (246) (8,250)<br />
Experience adjustments on plan assets 1,149 15,360 (50,411) 1,660 5,541<br />
Notes to Consolidated Financial Statements 117
26. Share-based payments<br />
Equity-settled share-based payments<br />
On May 13, 2009, the Annual General Meeting approved<br />
a new option plan for the Management Board, the 2009<br />
AMG Option Plan (“2009 Plan”). Each option issued under<br />
the 2009 Plan entitles the holder to acquire shares at a<br />
future date at a price equal to the fair market value of the<br />
share at the date on which the option was granted. One<br />
half of the options granted to each option holder on any<br />
date will vest on each of the third and fourth anniversaries<br />
of the grant date. The vesting is subject to performance<br />
conditions related to return on capital employed and<br />
share price appreciation. The options expire on the tenth<br />
anniversary of their grant date.<br />
On June 26, 2007, the Management Board established<br />
the AMG Option Plan (“2007 Plan”), which is eligible to<br />
members of the Management Board, Supervisory Board,<br />
employees, and consultants of the Company. Each option<br />
issued under the plan entitles the holder to acquire shares<br />
at a future date at a price equal to the fair market value of<br />
the share at the date on which the option was granted. One<br />
quarter of the options granted to each option holder on any<br />
date will vest on each of the first four anniversaries of the<br />
grant date. This vesting is not subject to any performance<br />
conditions. The options expire on the tenth anniversary of<br />
their grant date.<br />
Total grants under the 2009 Plan during 2010 were 112,640<br />
(2009: 182,927). During the years ended December 31,<br />
2010 and 2009, there were no grants exercised, expired<br />
or forfeited. All options under the 2009 Plan are equitysettled,<br />
in accordance with IFRS 2, by award of options<br />
to acquire ordinary shares or award of ordinary shares.<br />
The fair value of these awards has been calculated at the<br />
date of grant of the award. The fair value, adjusted for<br />
an estimate of the number of awards that will eventually<br />
vest, is expensed using a graded vesting methodology.<br />
The fair value of the options granted was calculated using<br />
a binomial expected life model. The assumptions used in<br />
the calculation are set out below.<br />
As detailed below during 2009, total grants under the<br />
2007 Plan were 439,833. The options granted in 2009 had<br />
special provisions, due to the fact that they were issued in<br />
lieu of salary. These options vested on December 31, 2009<br />
as that was the end of the salary replacement period.<br />
During the year ended December 31, 2010, there were no<br />
grants exercised (2009: nil) and grants expired or forfeited<br />
were 143,750 (2009: 338,333). All options under the 2007<br />
Plan are equity-settled, in accordance with IFRS 2, by<br />
award of options to acquire ordinary shares or award of<br />
ordinary shares. The fair value of these awards has been<br />
calculated at the date of grant of the award. The fair value,<br />
adjusted for an estimate of the number of awards that<br />
will eventually vest, is expensed using a graded vesting<br />
methodology. The fair value of the options granted was<br />
calculated using a binomial expected life model. The<br />
assumptions used in the calculation are set out below.<br />
During the year ended December 31, 2010, AMG,<br />
in conjunction with the AMG Option Plan, recorded<br />
compensation from equity-settled share-based payment<br />
transactions amounted to $6,362 (2009: $13,729) which is<br />
included in selling and administrative expenses and cost<br />
of goods sold in the income statement.<br />
Movements<br />
2010 2009<br />
In thousands of options<br />
Number of options<br />
(in 000s)<br />
Weighted average<br />
exercise price (in 1)<br />
Number of options<br />
(in 000s)<br />
Weighted average<br />
exercise price (in 1)<br />
Outstanding at January 1 2,573 23.24 2,288 27.65<br />
Granted during the year 113 7.99 623 8.54<br />
Forfeited or expired during the year (144) 28.75 (338) 26.03<br />
Exercised during the year – – – –<br />
Outstanding at December 31 2,542 22.25 2,573 23.24<br />
Exercisable at December 31 1,607 21.87 1,275 20.30<br />
1,607,333 options were exercisable as of December 31, 2010. 1,274,833 options were exercisable as of December 31, 2009.<br />
At December 31, 2010, the number of common shares subject to options outstanding and exercisable was as follows:<br />
Outstanding Weighted average Weighted average Exercisable Weighted average<br />
Price Range<br />
options exercise price remaining life<br />
options exercisable price<br />
17.99 to 19.84 735,400 8.46 8.64 439,833 8.00<br />
112.70 to 124.00 1,242,500 21.82 6.76 866,250 22.43<br />
129.45 to 140.50 503,750 38.85 3.18 271,250 38.25<br />
144.00 to 164.31 60,000 61.06 7.41 30,000 61.06<br />
118 Notes to Consolidated Financial Statements
At December 31, 2009, the number of common shares subject to options outstanding and exercisable was as follows:<br />
Price Range<br />
Outstanding<br />
options<br />
Weighted average<br />
exercise price<br />
Weighted average<br />
remaining life<br />
Exercisable<br />
options<br />
Weighted average<br />
exercisable price<br />
18.00 to 19.84 622,760 8.54 9.51 439,833 8.00<br />
112.70 to 124.00 1,347,500 21.99 7.77 650,000 22.96<br />
129.45 to 140.50 530,000 38.93 8.42 157,500 37.95<br />
144.00 to 164.31 72,500 58.12 7.07 27,500 53.30<br />
The maximum number of options that can be granted<br />
under the Plan is 10% of total shares outstanding up to a<br />
maximum of 50,000,000.<br />
Assumptions<br />
The following table lists the inputs into the binomial<br />
model used to calculate the fair value of the share-based<br />
payment options that were granted in 2010 and 2009 under<br />
the 2009 Plan:<br />
2010 2009<br />
Exercise price 17.99 19.84<br />
Share price at date of grant 17.99 19.84<br />
Contractual life (years) 10 10<br />
Dividend yield nil nil<br />
Expected volatility 79.78% 79.12%<br />
Risk-free interest rate 1.27% 1.71%<br />
Expected life of option (years) 3–4 3–4<br />
Weighted average<br />
share price 17.57 16.96<br />
Expected departures 10% 4%<br />
The following table lists the inputs into the binomial model<br />
used to calculate the fair value of the share- based payment<br />
options that were granted in 2009 under the 2007 Plan.<br />
No options were granted under the 2007 Plan in 2010.<br />
2009<br />
Exercise price 18.00<br />
Share price at date of grant 14.24<br />
Contractual life (years) 10<br />
Dividend yield<br />
nil<br />
Expected volatility 79.12%<br />
Risk-free interest rate 1.33%<br />
Expected life of option (years) 1<br />
Weighted average share price 16.96<br />
Expected departures 4%<br />
The expected volatility was calculated using the average<br />
historical share volatility of the Company’s peers (over<br />
a period equal to the expected term of the options).<br />
The expected volatility reflects the assumption that the<br />
calculated volatility of the Company’s peers would be<br />
indicative of future trends, which may not be the actual<br />
outcome. The expected life is the time at which options are<br />
expected to vest, however this also may not be indicative<br />
of exercise patterns that may occur. The 2007 Plan options<br />
vest in four equal tranches on the first, second, third<br />
and fourth anniversaries of the grant date, and therefore<br />
continued employment is a non-market condition for<br />
options to vest. The 2009 Plan options vest 50% each<br />
on the third and fourth anniversary of the grant date.<br />
There are performance requirements for vesting of these<br />
options. The risk free rate of return is the yield on zero<br />
coupon three and five-year Dutch government bonds.<br />
AMG’s option expense is recorded in the share-based<br />
payment reserve (refer to note 21). The cumulative<br />
amount recorded in the share-based payment reserve in<br />
shareholders equity was $41,741 as of December 31, 2010<br />
(2009: $36,176).<br />
Cash-settled share-based payments<br />
In May 2009, the Annual General Meeting approved a<br />
remuneration policy that utilizes cash-settled sharebased<br />
payments as a part of compensation. In the year<br />
ended December 31, 2010, the Company issued 269,977<br />
performance share units (“PSUs”) to certain employees<br />
which are cash-settled. 505,574 PSUs were issued in the<br />
year ended December 31, 2009. Fair value is determined<br />
using the binomial method using the following assumptions:<br />
2010 2009<br />
Contractual life (years) 2-3 1-3<br />
Dividend yield (%) nil nil<br />
Expected volatility (%) 36.10–88.41% 79.12%<br />
Risk-free interest rate (%) 0.29–0.85% 0.85 –1.65%<br />
Expected life of option (years) 2–3 1–3<br />
Expected departures (%) 10% 10%<br />
The rollforward of the PSU<br />
liability is noted below:<br />
Balance as at December 31,<br />
2009 3,639<br />
Expense recorded in year<br />
ended December 31, 2010 1,964<br />
Vesting and payments on first<br />
tranche 2009 grant (1,810)<br />
Currency / other (112)<br />
Balance as at December 31,<br />
2010 3,681<br />
As of December 31, 2010, the fair value of the PSUs issued<br />
in 2009 was 18.0–18.81, depending on the vesting term.<br />
The fair value of PSUs issued in 2010 was 17.28–18.01,<br />
depending on the vesting term.<br />
Notes to Consolidated Financial Statements 119
27. Provisions<br />
Environmental<br />
remediation Restructuring Warranty<br />
Project<br />
costs<br />
Partial<br />
retirement Other Total<br />
Balance at January 1, 2009 13,860 3,589 9,291 4,307 1,211 2,928 35,186<br />
Discontinued operations in opening (a) (4,805) (1,673) – – – – (6,478)<br />
Provisions made during the period 3,998 7,782 6,462 2,256 397 440 21,335<br />
Provisions used during the period (1,352) (2,971) (567) (1,458) (585) (1,420) (8,353)<br />
Increase due to discounting 1,923 – – – – – 1,923<br />
Currency and reversals 284 (1,611) (1,529) (1,541) 29 (1,297) (5,665)<br />
Balance at December 31, 2009 13,908 5,116 13,657 3,564 1,052 651 37,948<br />
Balance at January 1, 2010 13,908 5,116 13,657 3,564 1,052 651 37,948<br />
Provisions made during the period 6,421 423 5,869 4,022 1,421 283 18,439<br />
Provisions used during the period (664) (3,950) (1,421) (1,238) (1,745) (337) (9,355)<br />
Decrease due to discounting (671) – – – – – (671)<br />
Currency, transfers and reversals 1,088 (283) (5,902) (1,425) 1,537 (65) (5,050)<br />
Balance at December 31, 2010 20,082 1,306 12,203 4,923 2,265 532 41,311<br />
Non-current 13,641 401 – – 522 298 14,862<br />
Current 267 4,715 13,657 3,564 530 353 23,086<br />
Balance at December 31, 2009 13,908 5,116 13,657 3,564 1,052 651 37,948<br />
Non-current 18,415 693 – – 1,288 211 20,607<br />
Current 1,667 613 12,203 4,923 977 321 20,704<br />
Balance at December 31, 2010 20,082 1,306 12,203 4,923 2,265 532 41,311<br />
(a) See Note 6 for detail of discontinued operations.<br />
Environmental remediation<br />
The Company makes provisions for environmental cleanup<br />
requirements, largely resulting from historical solid and<br />
hazardous waste handling and disposal practices at its<br />
facilities. Environmental remediation provisions exist at<br />
the following sites and are discounted according to the<br />
timeline of expected payments:<br />
Cambridge, OH USA<br />
The largest issues at the Cambridge, Ohio site relate<br />
to a 1997 permanent injunction consent order (“PICO”)<br />
entered into with the State of Ohio and Cyprus Foote<br />
Mineral Company, the former owner of the site. While<br />
AMG’s US subsidiary and Cyprus Foote are jointly liable,<br />
the Company has agreed to perform and be liable for the<br />
remedial obligations. The site contains two on-site slag<br />
piles that are the result of many years of production.<br />
Under the PICO, these slag piles were required to be<br />
capped, thereby lowering the radioactive emissions from<br />
the piles.<br />
Remediation plans were finalized with the State of Ohio<br />
during 2003 and the Company completed all work for this<br />
remediation in 2009. In addition to the capital spending<br />
required for the actual cap on the slag piles, the Company<br />
has reserved for ongoing operations and maintenance<br />
expenses (“O&M”) at the site. This O&M is required<br />
to be provided for 1,000 years and is expected to cost<br />
$44,700 on an undiscounted basis. Other environmental<br />
items requiring provision include: wetlands remediation,<br />
stormwater remediation and maintenance. These projects<br />
are expected to create cash outflows of $695, on an<br />
undiscounted basis, and are expected to be completed<br />
within the next 15 years.<br />
Newfield, NJ USA<br />
Another one of the Company’s US subsidiaries has entered<br />
into administrative consent orders with the New Jersey<br />
Department of Environmental Protection (“NJDEP”)<br />
under which the US subsidiary must conduct remediation<br />
activities at the Newfield facility. Since the initial<br />
administrative consent order was signed in 1997, many<br />
of the obligations have been completed.<br />
In January 2006, the US subsidiary entered into a fixed<br />
price remediation contract with TRC Companies Inc.<br />
(“TRC”), whereby TRC assumes primary responsibility<br />
for all non-radiological groundwater environmental<br />
remediation obligations at the Newfield facility, with<br />
certain exceptions for one contaminant, perchlorate. The<br />
initiation of this remediation contract also led to a new<br />
Administrative Consent Order (“ACO”) that was signed in<br />
February 2006. This ACO specifically designated TRC as<br />
the entity primarily responsible for the non-radiological<br />
contamination and also specifically cited the US subsidiary<br />
120 Notes to Consolidated Financial Statements
as responsible for the clean-up associated with any<br />
perchlorate contamination. This agreement was approved<br />
by the NJDEP and received final approval by the US<br />
Environmental Protection Agency in March 2006. Under<br />
the terms of this agreement, payments totaling $16,900<br />
were made between 2006 and 2008 in order to complete<br />
the risk transfer to TRC.<br />
Similar to the Cambridge, Ohio facility, Newfield also<br />
conducted operations that created a substantial slag pile<br />
with low-level radioactive materials. After the production<br />
that created this slag ceased, the Nuclear Regulatory<br />
Commission (“NRC”) was notified and preparation<br />
of the decommissioning plan commenced. This plan<br />
has been through technical review with the NRC. The<br />
decommissioning plan is currently being re-worked to<br />
meet the NRC’s expectations. Based on this plan, the<br />
costs to cap the slag pile are estimated to be $7,263 and<br />
are expected to be paid over the next 3 to 5 years. In<br />
addition, operations and maintenance for the site will be<br />
required for 1000 years, estimated to cost $49,700 on an<br />
undiscounted basis. During the year ended December 31,<br />
2009, a revised decommissioning plan was submitted to<br />
address the review comments of the NRC. This revised<br />
decommissioning plan included revised estimates for both<br />
capping and O&M requirements. An additional provision<br />
of $3,824 was recorded in the year ending December 31,<br />
2009 to adjust for the latest decommissioning plan. Until<br />
the capping is completed, the US subsidiary is required<br />
to pay the NRC for its oversight costs. It is expected that<br />
the capping will take longer than previously anticipated<br />
and that the NRC will require changes to the currently<br />
submitted decommissioning plan. Since the NRC is paid<br />
on a time and materials basis, the expectation of these<br />
costs was increased and an additional provision of $2,630<br />
was recorded in the year ended December 31, 2010.<br />
Remediation trust funds<br />
The Company’s US subsidiaries have established trust<br />
funds to accumulate funds for future environmental<br />
remediation payments. Amounts are paid out from<br />
the trust fund following completion and approval of<br />
rehabilitation work. The contributions to the trust funds<br />
were placed with investment banks which are responsible<br />
for making investments in equity and money market<br />
instruments. The trust funds are to be used according to<br />
the terms of the trust deed which require that these funds<br />
be used for the 1,000-year O&M at the sites. The assets<br />
are not available for general use. The trust funds are<br />
discounted and are shown within other non-current assets<br />
in the consolidated statement of financial position. The<br />
discounted values of the trust funds at December 31, 2010<br />
are $2,402 (2009: $2,231). The undiscounted amounts<br />
in the trust funds as of December 31, 2010 are $5,055<br />
(2009: $4,931).<br />
Sao Joao del Rei, Brazil<br />
In the year ended December 31, 2010, our Brazilian<br />
subsidiary recorded an expense of $54 (2009: $42) related<br />
to a decommissioning liability at its mine. The total<br />
provision amount of $308 has been recorded after taking<br />
into effect the Brazilian laws that are in place related to<br />
decommissioning. The provision is based on the amount of<br />
ore removed from the mine and the expected cost to bring<br />
the mine back to government regulations in the case of a<br />
decommisioning.<br />
In addition to the decommissioning liability at the mine,<br />
the aluminum plant facility has waste from its operations<br />
that have accumulated over time. Management is in<br />
negotiations with the Brazilian government on the best<br />
way to dispose of the waste material, During the year<br />
ended December 31, 2010, a provision of $90 was recorded<br />
related to the waste disposal. The liability for removal of<br />
material as at December 31, 2010 was $526.<br />
Hauzenberg, Germany<br />
A recultivation provision was recorded on GK’s books<br />
as it relates to its graphite mine in Germany and was<br />
recorded at fair value as part of the purchase accounting<br />
performed for this acquisition in 2008. In 2010, German<br />
mining authorities met with management and developed a<br />
timeline for completion of the recultivation. Based on the<br />
meetings held, management’s best estimate of the cost<br />
to complete the recultivation increased and an additional<br />
provision of $3,146 was recorded. The value of this<br />
provision as of December 31, 2010 and 2009 was $4,278<br />
and $2,267, respectively. Payments are not expected to<br />
occur on this provision until 2015.<br />
Nuremburg, Germany<br />
A provision for sewer rehabilitation in Germany has been<br />
recorded. Over time, damage to the sewer lines from<br />
the plant in Nuremburg has occurred. Management is<br />
working with German authorities in order to clean up<br />
the leakage from the sewer and repair the line to cease<br />
any future leakage. Expense in the amount of $265 was<br />
recorded in the year ended December 31, 2010 related to<br />
this provision and the expected liability for continued work<br />
on the sewer rehabilitation project is $896. Payments<br />
for this project are expected to be $298 in 2011, $338 in<br />
2012, $196 in 2013 and are expected to end in 2014 with<br />
payments of $130.<br />
Notes to Consolidated Financial Statements 121
Restructuring<br />
As a result of the global economic downturn, AMG and<br />
its subsidiaries recorded restructuring costs of $423 and<br />
$7,782 in the years ended December 31, 2010 and 2009,<br />
respectively. Amounts paid related to current and previous<br />
years’ restructurings were $3,857. During 2009, $6,634 of<br />
the costs related to severance due to the reduction of<br />
155 people within the group. Additional amounts related to<br />
the termination of certain contracts.<br />
Warranty<br />
Engineering Systems offers certain warranties related<br />
to their furnace operations. These warranties are only<br />
provided on certain contracts and the provisions are<br />
made on a contract by contract basis. Each contractual<br />
warranty is expected to be utilized or derecognized within<br />
12 months. The provisions for these warranties are based<br />
on the historical return percentages. There were $5,723<br />
of additional provisions during 2010 (2009: $5,684) and<br />
payments of $1,087 (2009: $531).<br />
Another German subsidiary provides for warranties<br />
for certain products. The provision is based on actual<br />
claims made by customers. There were $146 of additional<br />
provisions during 2010 (2009: $778) and payments of $334<br />
(2009: $36).<br />
Project costs<br />
Engineering Systems builds a project cost provision on<br />
its percentage of completion contracts. The provision is<br />
developed on a contract by contract basis. The amounts<br />
recorded as a provision are the result of the expected total<br />
project costs and are based on historical percentages.<br />
Over the life of the percentage of completion contracts,<br />
the provision for project cost is utilized or derecognized<br />
depending on actual performance of the contracts.<br />
Provision of $4,022 were recorded in 2010 related to<br />
projects that are currently in process while $1,238 of<br />
provisions were used.<br />
Partial retirement<br />
In an effort to reduce unemployment and create jobs<br />
for younger job-seekers, Germany implemented certain<br />
regulations in 1996 to enable employees to take early<br />
retirement. Although the law is no longer in effect, our<br />
German subsidiaries have made provisions for those<br />
employees who are eligible per their employment<br />
contracts. During 2010, there were additional provisions of<br />
$1,421 (2009: $397) and payments of $1,745 (2009: $585).<br />
Other<br />
Other is comprised of additional accruals including<br />
certain guarantees made to various customers.<br />
28. Government grants<br />
Government<br />
grants<br />
Balance at January 1, 2009 8,651<br />
Provisions made during the period 619<br />
Provisions used during the period (8,402)<br />
Currency and reversals 35<br />
Balance at December 31, 2009 903<br />
Balance at January 1, 2010 903<br />
Provisions made during the period 199<br />
Provisions used during the period (216)<br />
Currency and reversals (69)<br />
Balance at December 31, 2010 817<br />
Non-current 669<br />
Current 234<br />
Balance at December 31, 2009 903<br />
Non-current 642<br />
Current 175<br />
Balance at December 31, 2010 817<br />
The Engineering Systems entered into a grant in 2007<br />
related to its site in Berlin. The State of Berlin obligated<br />
that at least 70 permanent jobs be maintained at the site<br />
by the end of 2007 and an additional 80 by the end of 2008<br />
maintaining these 150 permanent jobs until the end of<br />
2009. There were 157 employees at the Berlin site as of<br />
December 31, 2009 which successfully completed the<br />
terms of the grant. Under government grant accounting,<br />
<strong>ALD</strong> established a provision for the personnel expenses<br />
which was reduced by the income from the government<br />
grant over the expected term that these expenses were<br />
incurred. The initial estimate of personnel expenses and<br />
revisions to those estimates led to income recognition<br />
of $3,820 in the year ended December 31, 2009. As of<br />
December 31, 2009, the entire Berlin grant was utilized.<br />
GK has government grant obligations related to retention of<br />
personnel and its capital investment in the state of Bavaria,<br />
Germany. According to the grants received, GK is expected<br />
to create or maintain a certain number of employees over<br />
the course of the grant. The liability for the grant is being<br />
reduced as money is spent on capital expansion. As of<br />
December 31, 2010, the current and non-current portions<br />
of the grants were $175 and $642, respectively. As of<br />
December 31, 2009, the current and non-current portions<br />
of the grants were $234 and $669, respectively.<br />
122 Notes to Consolidated Financial Statements
29. Other liabilities<br />
Other liabilities are comprised of the following:<br />
2010 2009<br />
Accrued bonus 7,230 5,555<br />
Accrued interest 3,617 3,361<br />
Accrued professional fees 5,099 5,913<br />
Accrued employee<br />
payroll expenses 3,604 4,690<br />
Accrual for performance<br />
share units 3,681 3,639<br />
Accruals for operational costs 2,511 2,632<br />
Claims 1,540 3,261<br />
Fiscal contingency 188 1,686<br />
Other benefits<br />
and compensation 6,318 10,663<br />
Taxes, other than income 6,543 2,780<br />
Other miscellaneous liabilities 8,473 9,983<br />
Total 48,804 54,163<br />
Thereof:<br />
Current 43,287 46,179<br />
Non-current 5,517 7,984<br />
30. Trade and other payables<br />
2010 2009<br />
Trade payables 92,520 58,468<br />
Trade payables –<br />
percentage of completion 9,733 11,323<br />
Total 102,253 69,791<br />
The Company has limited exposure to payables<br />
denominated in currencies other than the functional<br />
currency, and where significant exposure exists enters<br />
into appropriate foreign exchange contracts.<br />
• Trade payables are generally non-interest bearing<br />
and are normally settled on 30 or 60 day terms with<br />
the exception of payables related to percentage of<br />
completion contracts that settle between one month<br />
and twelve months.<br />
• Other payables are non-interest bearing and have an<br />
average term of six months<br />
• Interest payable is normally settled quarterly or<br />
semi-annually throughout the financial year<br />
• For terms and conditions relating to related parties,<br />
refer to note 36<br />
31. Financial risk management objectives<br />
and policies<br />
The Company’s principal financial liabilities, other than<br />
derivatives, are comprised of loans and borrowings, short<br />
term bank debt and trade payables. The main purpose<br />
of these financial instruments is to provide capital for<br />
the Company’s operations, including funding working<br />
capital, capital maintenance and expansion. The Company<br />
has various financial assets such as trade and other<br />
receivables and (restricted) cash, which arise directly<br />
from its operations.<br />
The Company enters into derivative financial instruments,<br />
primarily interest rate swaps, foreign exchange forward<br />
contracts and commodity forward contracts. The purpose<br />
of these instruments is to manage interest rate, currency<br />
and commodity price risks. The Company does not enter<br />
into any contracts for speculative purposes.<br />
The Supervisory Board has overall responsibility for<br />
the establishment of the Company’s risk management<br />
framework while the Management Board is responsible<br />
for oversight and compliance within this framework. The<br />
Company’s risk management policies are established to<br />
identify and analyze the risks faced by the Company, to<br />
set appropriate risk limits and controls, and to monitor<br />
risks and adherence to limits. Risk management policies<br />
and systems are reviewed regularly to reflect changes in<br />
market conditions and the Company’s activities.<br />
The main risks arising from the Company’s financial<br />
instruments are: credit, liquidity and market.<br />
Credit risk<br />
Credit risk is the risk of financial loss to the Company if a<br />
customer or counterparty to a financial instrument fails<br />
to meet its contractual obligations, and arises principally<br />
from the Company’s receivables from customers.<br />
The Company’s exposure to credit risk with respect<br />
to trade and other receivables is influenced mainly by<br />
the individual characteristics of each customer. The<br />
demographics of the Company’s customer base, including<br />
the default risk of the industry and country in which<br />
customers operate, has less of an influence on credit<br />
risk. No single customer accounts for more than 10%<br />
of the Company’s revenue and geographically, there are<br />
no concentrations of credit risk. The Company trades<br />
only with creditworthy third parties. It is the Company’s<br />
policy that all customers who wish to trade on credit<br />
terms are subject to credit verification procedures which<br />
ensure their creditworthiness. In addition, receivable<br />
balances are monitored on an ongoing basis to ensure<br />
that the Company’s exposure to impairment losses is<br />
not significant. Collateral is generally not required for<br />
trade receivables, although the Company’s percentage of<br />
completion contracts do often require advance payments.<br />
Notes to Consolidated Financial Statements 123
The Company’s maximum exposure is the carrying<br />
amount as discussed in note 17.<br />
With respect to credit risk arising from the other financial<br />
assets of the Company, which comprise cash and cash<br />
equivalents and certain derivative instruments, the<br />
Company’s exposure to credit risk arises from the default<br />
of the counterparty, with a maximum exposure equal to<br />
the carrying amount of the instruments. The Company’s<br />
Treasury function monitors the location of cash and<br />
cash equivalents and the counterparties to hedges and<br />
monitors the strength of those banks. Bank strength is<br />
presented to the Supervisory Board at least annually.<br />
This review is set to minimize the concentration of risks<br />
and therefore mitigate potential financial loss through<br />
counterparty failure.<br />
Liquidity risk<br />
Liquidity risk is the risk that the Company will not be able<br />
to meet its financial obligations as they fall due.<br />
The Company’s approach to managing liquidity is to<br />
ensure, as far as possible, that it will always have sufficient<br />
liquidity to meet its liabilities when due, under both normal<br />
and stressed conditions, without incurring unacceptable<br />
losses or risking damage to the Company’s reputation.<br />
The Company monitors cash flows at varying levels. At the<br />
Company level, this monitoring is done on a weekly basis.<br />
However, at certain subsidiaries, this type of monitoring<br />
is done daily. Typically the Company ensures that it has<br />
sufficient cash on demand to meet expected operational<br />
expenses for a period of eight weeks, including the<br />
servicing of financial obligations. In addition, the Company<br />
maintains the following lines of credit:<br />
• $175,000 revolving credit facility with a syndicate of<br />
banks that is secured by the assets of the material<br />
subsidiaries of the Company. Interest is payable at a<br />
base rate plus a spread based on a coverage ratio.<br />
The table below summarizes the maturity profile of the Company’s financial liabilities at December 31, 2010 based on<br />
contractual undiscounted payments. The financial derivatives obligations are presented on a net basis for balances in a<br />
net obligation position for the respective period.<br />
Contractual<br />
3–12<br />
2010<br />
cash flows ‹ 3 months months 2012 2013 2014 2015 › 2016<br />
Term loan/revolver 163,100 – – 163,100 – – – –<br />
Cash interest on term loan 13,160 470 7,427 5,263 – – – –<br />
Fixed rate loans and borrowings 31,229 477 3,404 17,140 3,239 1,761 1,085 4,123<br />
Floating rate loans and<br />
borrowings 2,997 – – 2,997 – – – –<br />
Cash interest on loans<br />
and borrowings 4,537 443 1,415 1,195 409 301 227 547<br />
Financial derivatives 1,945 – – 847 639 249 150 60<br />
Financial lease liabilities 1,815 114 365 466 438 357 75 –<br />
Trade and other payables 102,253 87,234 15,019 – – – – –<br />
Short term bank debt 42,025 20,620 21,405 – – – – –<br />
Other 36,560 16,553 12,347 3,067 1,742 1,415 1,429 7<br />
Total 399,621 125,911 61,382 194,075 6,467 4,083 2,966 4,737<br />
The table below summarizes the maturity profile of the Company’s financial liabilities at December 31, 2009 based on<br />
contractual undiscounted payments.<br />
Contractual<br />
3–12<br />
2009<br />
cash flows ‹ 3 months months 2011 2012 2013 2014 › 2014<br />
Term loan/revolver 140,769 – – – 140,769 – – –<br />
Cash interest on term loan 8,697 305 915 4,401 3,076 – – –<br />
Fixed rate loans and borrowings 37,137 638 2,740 4,184 18,527 3,493 1,894 5,661<br />
Cash interest on loans<br />
and borrowings 10,248 861 2,459 3,093 2,188 456 326 865<br />
Financial derivatives 8,812 (92) 5,820 1,144 952 636 166 186<br />
Financial lease liabilities 104 65 24 15 – – – –<br />
Trade and other payables 69,791 56,521 13,270 – – – – –<br />
Short term bank debt 32,013 20,373 11,640 – – – – –<br />
Other 46,161 22,534 11,487 3,375 2,805 2,302 2,041 1,617<br />
Total 353,732 101,205 48,355 16,212 168,317 6,887 4,427 8,329<br />
124 Notes to Consolidated Financial Statements
Interest on financial instruments classified as floating rate<br />
is generally repriced at intervals of less than one year.<br />
Interest on financial instruments classified as fixed rate<br />
is fixed until the maturity of the instrument. The financial<br />
instruments of the Company that are not included in the<br />
above tables are non-interest bearing and are therefore<br />
not subject to interest rate risk.<br />
The difference between the contractual cash flows and<br />
the carrying amount of the term loan noted above is<br />
attributable to issuance costs in the amount of $3,640 and<br />
$5,934 as of December 31, 2010 and 2009, respectively,<br />
which are offset against the carrying amount of the debt.<br />
Market risk<br />
Market risk is the risk that the fair value of future cash<br />
flows of a financial instrument will fluctuate because<br />
of changes in market prices. Market prices comprise<br />
three types of risk: interest rate, foreign currency, and<br />
commodity price risk. Financial instruments affected by<br />
market risk include loans and borrowings and derivative<br />
financial instruments.<br />
The sensitivity analyses in the following sections relate to<br />
the position as at December 31, 2010 and 2009.<br />
The sensitivity analyses have been prepared on the<br />
basis that the amount of net debt, the ratio of fixed to<br />
floating interest rates of the debt and derivatives and the<br />
proportion of financial instruments in foreign currencies<br />
are all constant and on the basis of the hedge designations<br />
in place at December 31, 2010.<br />
The analyses exclude the impact of movements in market<br />
variables on the carrying value of pension and other postretirement<br />
obligations, provisions and on the non-financial<br />
assets and liabilities of foreign operations.<br />
The following assumptions have been made in calculating<br />
the sensitivity analyses:<br />
• The statement of financial position sensitivity relates<br />
to derivatives<br />
• The sensitivity of the relevant income statement item is<br />
the effect of the assumed changes in respective market<br />
risks. This is based on the financial assets and financial<br />
liabilities held at December 31, 2010 and 2009 including<br />
the effect of hedge accounting<br />
Interest rate risk<br />
Interest rate risk is the risk that changes in interest rates will<br />
affect the Company’s income or the value of its holdings of<br />
financial instruments. The Company’s fixed rate borrowings<br />
are exposed to a risk of change in their fair value due to<br />
changes in interest rates. The Company’s floating rate<br />
borrowings are exposed to a risk of change in cash flows<br />
due to changes in interest rates. Short term receivables and<br />
payables are not exposed to interest rate risk.<br />
The Company’s current policy is to maintain approximately<br />
60% of its borrowings as fixed rate borrowings. The<br />
Company either enters into fixed rate debt or strives to<br />
limit the variability of certain floating rate instruments<br />
through the use of interest rate caps or interest rate<br />
swaps. These are designed to hedge underlying debt<br />
obligations. At December 31, 2010, after taking into<br />
account the effect of interest rate swaps, approximately<br />
57% of the Company’s borrowings are at a fixed rate of<br />
interest (2009: 71%).<br />
The following table demonstrates the sensitivity to a<br />
reasonably possible change in interest rates adjusting for<br />
multiple interest rate swaps effective as at December 31,<br />
2010 and 2009, with all other variables held constant, of<br />
the Company’s profit before tax (through the impact on<br />
floating rate borrowings). Changes in sensitivity rates<br />
reflect various changes in the economy year-over-year.<br />
There is no impact on the Company’s equity.<br />
Increase/<br />
decrease in<br />
basis points<br />
Effect on profit<br />
before tax<br />
2010<br />
USD *** (137)<br />
Euro +10 (11)<br />
USD *** 85<br />
Euro -10 11<br />
Increase/<br />
decrease in<br />
basis points<br />
Effect on profit<br />
before tax<br />
2009<br />
USD *** (87)<br />
Euro +10 (8)<br />
USD *** 50<br />
Euro -10 8<br />
*** Historic volatility on certain USD short term debt varies across<br />
a wide range from +100 basis points to - 25 basis points.<br />
Sensitivities are calculated on the actual volatility for each debt<br />
instrument.<br />
See note 23 for loans and borrowings explanations.<br />
At December 31, 2010, the Company’s interest rate<br />
swaps had a fair value of ($1,092) (2009: ($4,780)). Per the<br />
agreements, the Company pays a fixed rate and receives<br />
a floating rate based on the six month, three month or one<br />
month USD EURIBOR. The following table demonstrates<br />
the sensitivity to a reasonably possible change in interest<br />
rates using the EURIBOR swap curve with all other<br />
variables held constant, of the Company’s equity and profit<br />
before tax. There is an impact in the income statement<br />
for one ineffective interest rate swap in the years ended<br />
December 31, 2010 and 2009. Changes in sensitivity rates<br />
reflect various changes in the economy year-over-year.<br />
Notes to Consolidated Financial Statements 125
Increase/<br />
decrease in<br />
basis points<br />
Effect on equity<br />
Effect on profit<br />
before tax<br />
2010<br />
USD +5 112 6<br />
USD -10 (158) (9)<br />
Increase/<br />
decrease in<br />
basis points<br />
Effect on profit<br />
before tax<br />
Effect on equity<br />
2009<br />
USD +5 (79) 9<br />
USD -10 (312) (17)<br />
Foreign currency risk<br />
Foreign currency risk is the risk that changes in foreign<br />
exchange rates will affect the Company’s income or the<br />
value of its holdings of financial instruments. Many of<br />
the Company’s subsidiaries are located outside the US.<br />
Individual subsidiaries execute their operating activities in<br />
their respective functional currencies which are primarily<br />
comprised of the US Dollar and Euro. Since the financial<br />
reporting currency of the Company is US Dollar, the<br />
financial statements of those non US Dollar operating<br />
subsidiaries are translated so that the financial results<br />
can be presented in the Company’s consolidated financial<br />
statements.<br />
Each subsidiary conducting business with third parties<br />
that leads to future cash flows denominated in a currency<br />
other than its functional currency is exposed to the<br />
risk from changes in foreign exchange rates. It is the<br />
Company’s policy to use forward currency contracts to<br />
minimize the currency exposures on net cash flows. For<br />
certain subsidiaries, this includes managing balance<br />
sheet positions in addition to forecast and committed<br />
transactions. For these contracts, maturity dates are<br />
established at the end of each month matching the net<br />
cash flows expected for that month. Another subsidiary<br />
hedges all sales transactions in excess of a certain<br />
threshold. For this subsidiary, the contracts mature at<br />
the anticipated cash requirement date. Most forward<br />
exchange contracts mature within twelve months and are<br />
predominantly denominated in US Dollars, British Pound<br />
Sterling, Brazilian Reais and Euros. When established,<br />
the forward currency contract must be in the same<br />
currency as the hedged item. It is the Company’s policy<br />
to negotiate the terms of the hedge derivatives to closely<br />
match the terms of the hedged item to maximise hedge<br />
effectiveness. The Company seeks to mitigate this risk<br />
by hedging at least 70% of transactions that occur in a<br />
currency other than the functional currency.<br />
In respect of monetary assets and liabilities denominated<br />
in foreign currencies, the Company ensures that its<br />
net exposure is kept to an acceptable level by buying or<br />
selling foreign currencies at spot rates when necessary to<br />
address short term imbalances.<br />
The Company deems its primary currency exposures<br />
to be in US Dollars and Euros. The following table<br />
demonstrates the sensitivity to a reasonably possible<br />
change in the two functional currencies of the Company:<br />
US Dollar and Euro exchange rates with all other variables<br />
held constant, of the Company’s profit before tax (due<br />
to changes in the fair value of monetary assets and<br />
liabilities) and the Company’s equity (due to changes in<br />
the fair value of forward exchange contracts). Changes in<br />
sensitivity rates reflect various changes in the economy<br />
year-over-year.<br />
Strengthening/<br />
weakening<br />
in functional rate<br />
Effect on<br />
profit<br />
before tax<br />
Effect on<br />
equity<br />
before tax<br />
2010<br />
US Dollar +5% (825) 93<br />
Euro +5% (296) (214)<br />
US Dollar -5% 825 (93)<br />
Euro -5% 296 214<br />
Strengthening/<br />
weakening<br />
in functional rate<br />
Effect on<br />
profit<br />
before tax<br />
Effect on<br />
equity<br />
before tax<br />
2009<br />
US Dollar +5% (227) 515<br />
Euro +5% (182) (80)<br />
US Dollar -5% 227 (515)<br />
Euro -5% 182 80<br />
Commodity price risk<br />
Commodity price risk is the risk that certain raw<br />
materials prices will increase and negatively impact the<br />
gross margins and operating results of the Company.<br />
The Company is exposed to volatility in the prices of<br />
raw materials used in some products and uses forward<br />
contracts to manage these exposures. For certain metals,<br />
the Company aims to maintain a greater than 50% hedged<br />
position in order to avoid undue volatility in the sales<br />
prices and purchase costs attained in the normal course<br />
of business. Commodity forward contracts are generally<br />
settled within twelve months of the reporting date.<br />
Changes in sensitivity rates reflect various changes in the<br />
economy year-over-year.<br />
126 Notes to Consolidated Financial Statements
Change<br />
in price<br />
Effect on<br />
profit<br />
before tax<br />
Effect on<br />
equity<br />
before tax<br />
2010<br />
Aluminum +5% 424 68<br />
Nickel +5% 12 –<br />
Copper +5% 7 –<br />
Aluminum -10% (849) (136)<br />
Nickel -10% (25) –<br />
Copper -10% (14) –<br />
Change<br />
in price<br />
Effect on<br />
profit<br />
before tax<br />
Effect on<br />
equity<br />
before tax<br />
2009<br />
Aluminum +5% 218 60<br />
Nickel +5% (19) –<br />
Copper +5% (5) 22<br />
Aluminum -10% (436) (121)<br />
Nickel -10% 38 –<br />
Copper -10% 11 (45)<br />
Capital Management<br />
The primary objective of the Company is to maintain<br />
strong capital ratios in order to support its business and<br />
maximize shareholder value.<br />
The Company manages its capital structure and makes<br />
adjustments to it, in light of economic conditions. Its<br />
policy is to ensure that the debt levels are manageable to<br />
the Company and that they are not increasing at a level<br />
that is in excess of the increases that occur within equity.<br />
During the planning process, the expected cash flows<br />
of the Company are evaluated and the debt to equity and<br />
debt to total capital ratios are evaluated in order to ensure<br />
that levels are improving year-over-year. Debt to total<br />
capital is a more appropriate measure for the Company<br />
due to its initial equity values of the subsidiaries from the<br />
combination in 2007. Management deems total capital to<br />
include all debt (including short term and long term) as<br />
well as the total of the equity of the Company, including<br />
non-controlling interests.<br />
The Company’s policy is to try to maintain this ratio below<br />
50%. The ratio is slightly above the policy level for the<br />
year-ended December 31, 2010 however, management is<br />
focused on cash management and intends to bring the<br />
ratio back into policy compliance.<br />
2010 2009<br />
Loans and borrowings 192,067 171,783<br />
Short term bank debt 45,022 32,013<br />
Trade and other payables 102,253 69,791<br />
Less cash and cash equivalents 89,311 117,016<br />
Net debt 250,031 156,571<br />
Net debt 250,031 156,571<br />
Total equity 233,965 228,423<br />
Total capital 483,996 384,994<br />
Debt to total capital ratio 0.52 0.41<br />
Notes to Consolidated Financial Statements 127
32. Financial instruments<br />
Fair values<br />
Set out below is a comparison by category of the carrying amounts and fair values of all of the Company’s financial<br />
instruments that are presented in the financial statements:<br />
2010 2009<br />
Note Carrying amount Fair value Carrying amount Fair value<br />
Current financial assets<br />
Derivatives in effective hedges 32 5,390 5,390 4,403 4,403<br />
Financial assets at fair value through profit or loss 32 341 341 551 551<br />
Investments in equity securities 15 887 887 970 970<br />
Trade and other receivables 17 175,421 175,421 147,787 147,787<br />
Cash and cash equivalents 20 89,311 89,311 117,016 117,016<br />
Total 271,350 271,350 270,727 270,727<br />
Non-current financial assets<br />
Embedded derivative 32 5,113 5,113 1,718 1,718<br />
Derivatives in effective hedges 32 86 86 – –<br />
Notes receivable 32 322 322 5,542 5,542<br />
Restricted cash 19 12,528 12,528 13,263 13,263<br />
Total 18,049 18,049 20,523 20,523<br />
Current financial liabilities<br />
Derivatives in effective hedges 32 839 839 4,683 4,683<br />
Financial current liabilities at fair value through<br />
profit or loss 32 915 915 1,365 1,365<br />
Fixed rate loans and borrowings 23 4,254 4,254 3,464 3,464<br />
Short term bank debt 24 45,022 45,022 32,013 32,013<br />
Trade and other payables 30 102,253 102,253 69,791 69,791<br />
Total 153,283 153,283 111,316 111,316<br />
Non-current financial liabilities<br />
Derivatives in effective hedges 32 698 698 965 965<br />
Financial non-current liabilities at fair value through<br />
profit or loss 32 – – 374 374<br />
Fixed rate loans and borrowings 23 122,240 118,681 129,496 127,632<br />
Floating rate loans and borrowings 23 65,573 65,573 38,823 38,823<br />
Total 188,511 184,952 169,658 167,794<br />
The fair value of the financial assets and liabilities are<br />
included at the amount at which the instrument could<br />
be exchanged in a current transaction between willing<br />
parties. The following methods and assumptions were<br />
used to estimate the fair values.<br />
• Short term assets and liabilities approximate their<br />
carrying amounts largely due to the short term maturities<br />
of these instruments.<br />
• The calculation of fair value for derivative financial<br />
instruments depends on the type of instruments:<br />
Derivative interest rate contracts are estimated by<br />
discounting expected future cash flows using current<br />
market interest rates and yield curves over the remaining<br />
term of the instrument; Derivative currency and<br />
commodity contracts are based on quoted forward<br />
exchange rates and commodity prices respectively.<br />
• Floating rate loans and borrowings and notes<br />
receivable maintain a floating interest rate and therefore<br />
approximate fair value.<br />
• The fair value of fixed rate loans and borrowings are<br />
estimated by discounting future cash flows using rates<br />
currently available for debt.<br />
• The fair value of embedded derivatives is estimated<br />
using an option pricing model. The embedded<br />
derivative represents a conversion feature in a note<br />
from an associate. See note 36 for details.<br />
The Company made a strategic investment in a growthbased<br />
company in Iceland in 2008. This investment cannot<br />
be reliably measured at fair value and are therefore<br />
accounted for using a cost basis. At December 31, 2010,<br />
this investment was $887 (2009: $970) and is included in<br />
other non-current assets in the statement of<br />
financial position.<br />
128 Notes to Consolidated Financial Statements
Fair value hierarchy<br />
The Company uses the following hierarchy for determining<br />
and disclosing the fair value of financial instruments by<br />
valuation technique:<br />
Level 1: quoted (unadjusted) prices in active markets for<br />
identical assets or liabilities<br />
Level 2: other techniques for which all inputs which<br />
have a significant effect on the recorded fair value are<br />
observable, either directly or indirectly<br />
Level 3: techniques which use inputs which have a<br />
significant effect on the recorded fair value that are not<br />
based on observable market data<br />
As of December 31, 2010, the Company held the following<br />
financial instruments measured at fair value:<br />
Assets measured at fair value<br />
December 31, 2010 Level 1 Level 2 Level 3<br />
Financial assets<br />
Forward contracts – hedged 5,642 – 5,642 –<br />
Forward contracts – non-hedged 175 – 175 –<br />
Embedded derivative 5,113 – 5,113 –<br />
Liabilities measured at fair value<br />
December 31, 2010 Level 1 Level 2 Level 3<br />
Financial liabilities<br />
Forward contracts – hedged 941 – 941 –<br />
Forward contracts – non-hedged 419 – 419 –<br />
Interest rate swaps 1,092 – 1,092 –<br />
As of December 31, 2009, the Company held the following financial instruments measured at fair value:<br />
Assets measured at fair value<br />
December 31, 2009 Level 1 Level 2 Level 3<br />
Financial assets<br />
Forward contracts – hedged 4,403 – 4,403 –<br />
Forward contracts – non-hedged 551 – 551 –<br />
Embedded derivative 1,718 – 1,718 –<br />
Liabilities measured at fair value<br />
December 31, 2009 Level 1 Level 2 Level 3<br />
Financial assets<br />
Forward contracts – hedged 1,242 – 1,242 –<br />
Forward contracts – non-hedged 1,365 – 1,365 –<br />
Embedded derivative 4,780 – 4,780 –<br />
During the years ended December 31, 2010 and 2009, there were no transfers between Level 1 and Level 2 fair value<br />
measurements, and no transfers into or out of Level 3 fair value measurements.<br />
Notes to Consolidated Financial Statements 129
Hedging activities<br />
Interest rate hedges<br />
In October 2010, the Company entered into an interest<br />
rate hedge agreement for the entire drawdown of the<br />
term loan which was 171,003 (see note 23). This interest<br />
rate swap was executed as a replacement to the expiring<br />
contract so that the Company could continue to hedge<br />
its exposure to changes in the benchmark interest rate<br />
on the term loan. This swap agreement provides for<br />
a fixed annual interest rate of 1.416% (exclusive of the<br />
margin) paid semi-annually by AMG and a semi-annual<br />
payment by the counterparty of EURIBOR expiring in 2010.<br />
Management has designated the interest rate swap as<br />
a cash flow hedge of the forecasted interest payments<br />
on the debt. At December 31, 2010, the fair value of the<br />
interest rate swap was ($74). This compares to the fair<br />
value of the interest rate swap which expired in 2010<br />
which had a fair value at December 31, 2009 of ($3,441).<br />
The interest rate swap expires upon maturity of the term<br />
loan which is in August 2012.<br />
GK entered into five interest rate hedges for a variety of<br />
floating rate debt instruments to minimize interest rate<br />
risk. The swap agreements provide for fixed interest rates<br />
paid either monthly or quarterly by the Company and<br />
a payment made by the counterparty of EURIBOR. The<br />
contracts expire between 2011 and 2017 depending on<br />
each contract’s underlying debt maturity. Management<br />
has designated the interest rate swaps as cash flow<br />
hedges of the forecasted interest payments on each<br />
respective debt. At December 31, 2010, the fair value of the<br />
various interest rate swaps was ($1,018) (2009: ($1,339)).<br />
There is one ineffective interest rate swap contract as<br />
at December 31, 2010 and 2009. Therefore, all amounts<br />
related to this contract are directly recognized in the<br />
income statement. The amount from effective interest<br />
rate swap cash flow hedges included in equity is ($566)<br />
and ($3,083) in the years ended December 31, 2010 and<br />
2009, respectively. During the years ended December 31,<br />
2010 and 2009, $1,365 and $1,672, respectively, were<br />
transferred from equity to the income statement as<br />
increases to interest expense.<br />
Commodity forward contracts<br />
The Company is exposed to volatility in the prices of raw<br />
materials used in some products and uses commodity<br />
forward contracts to manage these exposures. Such<br />
contracts generally mature within twelve months.<br />
Commodity forward contracts have been designated as<br />
cash flow hedges.<br />
The open commodity forward contracts as at<br />
December 31, 2010 are as follows:<br />
US Dollar denominated<br />
contracts to purchase<br />
commodities:<br />
Metric<br />
tons<br />
Average<br />
price<br />
Fair<br />
value<br />
Aluminum forwards 4,625 2,325 634<br />
US Dollar denominated<br />
contracts to sell<br />
commodities:<br />
Metric<br />
tons<br />
Average<br />
price<br />
Fair<br />
value<br />
Aluminum forwards 1,075 2,351 (121)<br />
The open commodity forward contracts as at<br />
December 31, 2009 are as follows:<br />
US Dollar denominated<br />
contracts to purchase<br />
commodities:<br />
Metric<br />
tons<br />
Average<br />
price<br />
Fair<br />
value<br />
Aluminum forwards 4,050 1,904 1,327<br />
Copper forwards 125 6,106 160<br />
US Dollar denominated<br />
contracts to sell<br />
commodities:<br />
Metric<br />
tons<br />
Average<br />
price<br />
Fair<br />
value<br />
Aluminum forwards 925 2,108 43<br />
Copper 25 6,982 12<br />
Due to the economic recession, there were less purchases<br />
and sales of commodities at the beginning of 2009 than<br />
originally planned. Therefore, some contracts no longer<br />
received hedge accounting treatment. The amount of<br />
ineffectiveness recognized in profit or loss that arose<br />
from the commodity cash flow hedges in the year ended<br />
December 31, 2009 was an increase of $453 to cost of<br />
sales. There was no ineffectiveness during the year ended<br />
December 31, 2010. The amount from the commodity cash<br />
flow hedges included in equity was $519 and $1,432 in the<br />
years ended December 31, 2010 and 2009, respectively.<br />
During the years ended December 31, 2010 and 2009,<br />
($612) and $2,072, respectively, were transferred from<br />
equity to the income statement as (decreases) increases<br />
to cost of sales.<br />
Foreign currency forward contracts<br />
At any point in time, the Company also uses foreign<br />
exchange forward contracts to hedge a portion of its<br />
estimated foreign currency exposure in respect of<br />
forecasted sales and purchases, and intergroup loans<br />
that will be repaid in different functional currencies.<br />
These contracts are negotiated to match the terms<br />
of the commitments and generally mature within one<br />
year. When necessary, these contracts are rolled over<br />
at maturity. Some foreign exchange forward contracts<br />
have been designated as cash flow hedges, while other<br />
contracts, although part of the risk management strategy,<br />
have not met the documentation requirements for hedge<br />
accounting and are therefore treated as economic hedges.<br />
130 Notes to Consolidated Financial Statements
The open foreign exchange forward sales contracts as at December 31, 2010 are as follows:<br />
Exposure Notional amount Contract rate Fair value assets<br />
Fair value<br />
liabilities<br />
Cash Flow Hedges<br />
Euro (versus USD) 120.3 million 1.365 573 (206)<br />
USD (versus Euro) $45.2 million 1.324 653 (143)<br />
PLZ (versus USD) Zł 9.0 million 4.042 7 (1)<br />
MXN (versus USD) MXN123.2 million 16.961 121 (155)<br />
Economic Hedges<br />
USD (versus Euro) $0.8 million 1.331 8 –<br />
CAD (versus USD) CAD3.6 million 0.981 – (57)<br />
Euro (versus USD) 121.0 million 1.344 164 (361)<br />
The open foreign exchange forward sales contracts as at December 31, 2009 are as follows:<br />
Exposure Notional amount Contract rate Fair value assets<br />
Fair value<br />
liabilities<br />
Cash Flow Hedges<br />
Euro (versus USD) 117.9 million 1.438 272 (162)<br />
USD (versus Euro) $22.0 million 1.445 515 (179)<br />
GBP (versus USD) £1.5 million 1.663 102 –<br />
Economic Hedges<br />
USD (versus Euro) $3.4 million 1.447 – (27)<br />
CAD (versus USD) CAD 3.6 million 0.928 – (93)<br />
Euro (versus USD) 119.1 million 1.420 527 (829)<br />
The open foreign exchange forward purchase contracts as at December 31, 2010 are as follows:<br />
Exposure Notional amount Contract rate Fair value assets<br />
Fair value<br />
liabilities<br />
Cash Flow Hedges<br />
USD (versus Euro) $4.9 million 1.366 155 (12)<br />
GBP (versus USD) £13.3 million 1.499 862 (303)<br />
BRL (versus USD) R$57.0 million 1.905 2,637 –<br />
Economic Hedges<br />
USD (versus Euro) $0.6 million 1.314 3 (1)<br />
The open foreign exchange forward purchase contracts as at December 31, 2009 are as follows:<br />
Exposure Notional amount Contract rate Fair value assets<br />
Fair value<br />
liabilities<br />
Cash Flow Hedges<br />
USD (versus Euro) $4.1 million 1.502 165 –<br />
GBP (versus USD) £16.8 million 1.646 – (845)<br />
BRL (versus USD) R$39.4 million 1.965 1,863 –<br />
Euro (versus USD) 1110.6 million 1.471 18 (408)<br />
Economic Hedges<br />
USD (versus Euro) $1.9 million 1.447 6 (9)<br />
Due to the economic recession, some contracts were<br />
ineffective and no longer received hedge accounting<br />
treatment. The amount of ineffectiveness recognized<br />
in profit or loss that arose from the foreign currency<br />
cash flow hedges in the year ended December 31, 2009<br />
was an increase of $410 to cost of sales. There was<br />
no ineffectiveness recognized in profit or loss as of<br />
December 31, 2010. The amounts from the foreign currency<br />
cash flow hedges included in equity were $2,608 and<br />
$2,375 in the years ended December 31, 2010 and 2009,<br />
respectively. During the years ended December 31, 2010<br />
and 2009, $2,143 and $6,211, respectively, were transferred<br />
from equity to the income statement as increases to cost<br />
of sales.<br />
Notes to Consolidated Financial Statements 131
Notes receivable<br />
On December 11, 2009, the Company loaned $5,000<br />
to Timminco’s wholly-owned subsidiary, Bécancour<br />
Silicon Inc. (“Bécancour”), in exchange for a convertible<br />
promissory note (“Initial Convertible Note”). On<br />
December 15, 2010, the Company amended the terms of<br />
the loan, through an amended convertible promissory<br />
note (“Amended Convertible Note”). As the amendments<br />
to the debt agreement were considered substantial, the<br />
transaction was accounted for as an extinguishment of<br />
the Initial Convertible Note and issuance of new debt<br />
in accordance with IAS 39. The Initial Convertible Note<br />
had an annual interest rate of 12%, payable quarterly<br />
in arrears starting December 31, 2009 and maturing on<br />
January 3, 2011. The Amended Convertible Note bears<br />
interest at 14%, payable quarterly in arrears starting<br />
December 31, 2010 and matures on January 3, 2014. The<br />
full principal amount is convertible into common shares<br />
of Timminco at the conversion price, at AMG’s option at<br />
any time, subject to customary anti-dilution adjustments.<br />
The conversion price was amended from C$1.58 per share<br />
under the Initial Convertible Note to a conversion price of<br />
C$0.26 per share under the Amended Convertible Note.<br />
Both the Initial and Amended Convertible notes were<br />
accounted for as hybrid instruments with the note and<br />
the equity option being valued separately. The value of the<br />
Amended Convertible Note was $71 as of December 31,<br />
2010. The value of the Initial Convertible Note was $3,095<br />
as of December 31, 2009. The value of the equity option<br />
on the Amended Convertible Note was $5,113 as of<br />
December 31, 2010. The value of the equity option on the<br />
Initial Convertible Note was $1,718 as of December 31,<br />
2009. The Company recorded finance income of $371<br />
during the year ended December 31, 2010 as a result of<br />
a gain recognized on the amendment. The Company also<br />
recorded finance income of $100 for an amendment fee<br />
charged in conjunction with the amendment. Interest<br />
income from the convertible notes was $600 the year<br />
ended December 31, 2010. Interest income from the Initial<br />
Convertible Note was $32 the year ended December 31,<br />
2009. All interest for 2010 was paid as of December 31,<br />
2010. Interest receivable related to the Initial Convertible<br />
Note was $34 as of December 31, 2009.<br />
On July 22, 2008, the Company loaned $5,000 to Millinet<br />
Solar Co., Ltd., a Korean manufacturer of solar silicon.<br />
The note was issued with a maturity date of July 22,<br />
2010 and carried interest at a rate of 5% if Millinet went<br />
public and 10% if Millinet did not go public. The principal<br />
balance was not repaid on July 22, 2010 and the Company<br />
entered into default negotiations. The final amendment<br />
agreement was signed on March 10, 2011. According to the<br />
agreement, Millinet agrees to repay all amounts, including<br />
default interest and penalties, by February 21, 2012.<br />
As of December 31, 2010, the Company shows interest<br />
receivable $1,000 and the note receivable of $5,000.<br />
In addition to the amendment agreement, a guarantee<br />
agreement was signed by Millinet Co, Ltd. (Millinet Solar’s<br />
parent company) and its managing director. The Company<br />
believes book value approximates fair value due to the<br />
short duration and recent negotiations.<br />
33. Leases<br />
Operating leases as lessee<br />
The Company has entered into leases for office space,<br />
facilities and equipment. The leases generally provide that<br />
the Company pays the tax, insurance and maintenance<br />
expenses related to the leased assets. These leases have<br />
an average life of 5-7 years with renewal terms at the<br />
option of the lessee and lease payments based on market<br />
prices at the time of renewal. There are no restrictions<br />
placed upon the lessee by entering into these leases.<br />
The Company also holds a hereditary land building right<br />
at its Berlin location. This building right requires lease<br />
payments to be made annually and does not expire<br />
until 2038.<br />
Future minimum lease payments under non-cancelable<br />
operating leases as at December 31 are as follows:<br />
2010 2009<br />
Less than one year 7,121 8,133<br />
Between one and five years 19,739 24,389<br />
More than five years 8,606 9,742<br />
Total 35,466 42,264<br />
During the year ended December 31, 2010 $7,942 was<br />
recognized as an expense in the income statement in<br />
respect of operating leases (2009: $9,069).<br />
Finance leases as lessee<br />
Certain subsidiaries of the Company have finance leases<br />
for equipment and software. These non-cancelable leases<br />
have remaining terms between one and five years. Future<br />
minimum lease payments under finance leases are as<br />
follows:<br />
2010 2009<br />
Less than one year 479 88<br />
Between one and five years 1,336 16<br />
Total minimum lease<br />
payments 1,815 104<br />
Less amounts representing<br />
finance charges (289) (6)<br />
Present value of minimum<br />
lease payments 1,526 98<br />
132 Notes to Consolidated Financial Statements
34. Capital commitments<br />
The Company’s capital expenditures include projects<br />
to improve the Company’s operations and productivity,<br />
replacement projects and ongoing environmental<br />
requirements (which are in addition to expenditures<br />
discussed in note 27). As of December 31, 2010, the<br />
Company had committed to capital requirements in the<br />
amount of $6,269 (2009: $17,769).<br />
35. Contingencies<br />
Guarantees<br />
The following table outlines the Company’s off-balance sheet credit-related guarantees and business-related<br />
guarantees for the benefit of third parties as of December 31, 2010 and 2009:<br />
Business-related<br />
guarantees<br />
Credit-related<br />
guarantees Letters of credit Total<br />
2010<br />
Total amounts committed: 63,563 254 5,080 68,897<br />
Less than 1 year 41,209 254 303 41,766<br />
2–5 years 5,170 – – 5,170<br />
After 5 years 17,184 – 4,777 21,961<br />
2009<br />
Total amounts committed: 49,735 552 5,215 55,502<br />
Less than 1 year 19,966 552 438 20,956<br />
2–5 years 15,377 – – 15,377<br />
After 5 years 14,392 – 4,777 19,169<br />
In the normal course of business, the Company has<br />
provided indemnifications in various commercial<br />
agreements which may require payment by the Company<br />
for breach of contractual terms of the agreement.<br />
Counterparties to these agreements provide the Company<br />
with comparable indemnifications. The indemnification<br />
period generally covers, at maximum, the period of the<br />
applicable agreement plus the applicable limitations<br />
period under law. The maximum potential amount of<br />
future payments that the Company would be required<br />
to make under these indemnification agreements is<br />
not reasonably quantifiable as certain indemnifications<br />
are not subject to limitation. However, the Company<br />
enters into indemnification agreements only when an<br />
assessment of the business circumstances would indicate<br />
that the risk of loss is remote.<br />
As discussed in note 28, the Engineering Systems Division<br />
had an obligation for personnel expenses relating to its<br />
investment site in Berlin. The State of Berlin required<br />
that at least 70 permanent jobs be maintained at the site<br />
by the end of 2007 and an additional 80 by the end of 2008<br />
with 150 of these permanent jobs being maintained until<br />
the end of 2009. In the event of a breach of this contract,<br />
the Company would be required to pay a penalty of<br />
150,000 multiplied by the number of jobs less than 150<br />
at the site at that time. There were 157 employees at the<br />
Berlin site as of December 31, 2009 and therefore, the<br />
obligation has been fulfilled and the contingency has been<br />
effectively eliminated.<br />
The Company has agreed to indemnify its current and<br />
former directors and officers to the extent permitted by<br />
law against any and all charges, costs, expenses, amounts<br />
paid in settlement and damages incurred by the directors<br />
and officers as a result of any lawsuit or any other judicial<br />
administrative or investigative proceeding in which the<br />
directors and officers are sued as a result of their service.<br />
These indemnification claims will be subject to any<br />
statutory or other legal limitation period. The nature of<br />
such indemnification prevents the Company from making<br />
a reasonable estimate of the maximum potential amount it<br />
could be required to pay to counter parties. The Company<br />
has $75,000 in directors’ and officers’ liability insurance<br />
coverage.<br />
Environmental<br />
As discussed in note 27, a US subsidiary of the Company<br />
entered into a fixed price remediation contract with<br />
an environmental consultant, whereby that consultant<br />
became primarily responsible for certain aspects of<br />
the environmental remediation. This subsidiary of the<br />
Company is still a secondary obligor for this remediation,<br />
in the event that the consultant does not perform.<br />
The Company has other contingent liabilities related to<br />
certain environmental regulations at certain locations.<br />
A UK subsidiary may be subject to certain regulations<br />
on accidents and hazardous substances with which the<br />
site does not currently comply. These regulations could<br />
impose compliance costs over a five-year period in the<br />
range of $500–$2,000. Environmental regulations in France<br />
Notes to Consolidated Financial Statements 133
equire monitoring of wastewater and potential clean-up<br />
to be performed at one of the French subsidiary’s plant<br />
sites in Chauny. Although the extent of these issues is not<br />
yet known, there is a possibility that the Company could<br />
incur remediation costs approximating $1,000. At a US<br />
subsidiary, a provision has been recorded for the lowlevel<br />
radioactive slag pile (see note 27) which assumes<br />
that the Company will be able to remediate the pile using<br />
a long-term control license. In 2009, the governing party<br />
responsible for this site changed and the new governing<br />
party determined that this remediation is not satisfactory<br />
and is requesting the Company to remediate using a second<br />
alternative. The second alternative is an offsite disposal<br />
alternative which could potentially cost up to $70,000. The<br />
Company challenged this decision and the court agreed<br />
with the Company that the new governing party did not have<br />
the ability to change the plan which has previous approval.<br />
Although the second alternative is still possible, it is a more<br />
remote possibility given the ruling by the court. In 2010,<br />
a US subsidiary was named as a potentially responsible<br />
party in the Macalloy Superfund site in South Carolina. The<br />
total claim for the site is $1,200 but it is unclear how many<br />
potentially responsible parties (“PRPs”) will be identified.<br />
Currently, the Company is aware of three PRPs but<br />
additional PRPs are expected to be identified. Based on the<br />
claim and the known number of viable PRPs, the maximum<br />
exposure for this case is $400. The Company has not<br />
recorded a liability at December 31, 2010 due to the limited<br />
information provided by the environmental authorities and<br />
several mitigating factors identified in the case.<br />
Litigation<br />
In addition to the environmental matters, which are<br />
discussed above and in note 27, the Company and its<br />
subsidiaries defend, from time to time, various claims and<br />
legal actions arising in the normal course of business.<br />
Management believes, based on the advice of counsel,<br />
that the outcome of such matters will not have a material<br />
adverse effect on the Company’s consolidated financial<br />
position, results of operations or cash flows. There can be<br />
no assurance, however, that existing or future litigation<br />
will not result in an adverse judgment against the<br />
Company that could have a material adverse effect on the<br />
future results of operations or cash flows.<br />
Contingencies of associates and joint ventures<br />
Timminco and certain of its directors and officers, as well<br />
as certain third parties, have been named as defendants<br />
in a potential class action lawsuit filed in the Ontario<br />
Superior Court of Justice on May 14, 2009. This lawsuit<br />
was commenced by the plaintiff Ravinder Kumar Sharma<br />
on behalf of shareholders who acquired Timminco’s<br />
common shares between March 17, 2008 and November 11,<br />
2008 and claims damages exceeding $540 million. The<br />
plaintiff alleges that Timminco and others made certain<br />
misrepresentations about the Company’s solar grade<br />
silicon production process.<br />
There has been no provision made for these matters in<br />
Timminco’s accounts as of December 31, 2010. AMG<br />
and Timminco each have insurance policies which<br />
will provide for reimbursement of costs and expenses<br />
incurred in connection with the lawsuit, including legal<br />
and professional fees, as well as damages awarded,<br />
if any, subject to certain policy limits and deductibles.<br />
Timminco intends to vigorously defend these allegations<br />
and the plaintiff’s attempt to get court approval to<br />
proceed. However, no assurance can be given with respect<br />
to the ultimate outcome of the proceedings, and the<br />
amount of any damages awarded in such lawsuits could<br />
be substantial.<br />
Silmag DA is currently in the process of determining<br />
whether it will owe any value added tax in Norway. The<br />
Company received a start-up company exemption, but the<br />
exemption may expire if the venture fails. This is currently<br />
still under investigation, but the Company’s share of this<br />
potential liability could approximate $2,016.<br />
36. Related parties<br />
Transactions with key management personnel<br />
Key management personnel compensation<br />
As at December 31, 2010 and 2009, Dr. Schimmelbusch<br />
is the Chief Executive Officer for the Company, and in his<br />
position receives salary, benefits and perquisites from<br />
the Company.<br />
Mr. Spector left the employ of the Company on<br />
September 30, 2009.<br />
In addition to their salaries, the Company also provides<br />
non-cash benefits to directors and executive officers, and<br />
contributes to a post-employment defined benefit plan on<br />
their behalf.<br />
134 Notes to Consolidated Financial Statements
The compensation of the management board of the Company comprised:<br />
Postemployment<br />
benefits<br />
including<br />
contributions<br />
to defined<br />
contribution<br />
plans<br />
Other<br />
remuneration<br />
(b)<br />
For the year ended<br />
December 31, 2010<br />
Salaries<br />
and bonus<br />
Option<br />
compensation<br />
Performance<br />
share units<br />
Total<br />
Dr. Heinz Schimmelbusch (a) 2,461 1,081 854 314 87 4,797<br />
Eric Jackson 1,250 398 256 973 49 2,926<br />
Dr. Reinhard Walter 1,222 398 256 358 17 2,251<br />
William J. Levy 973 340 171 644 23 2,151<br />
Total 5,906 2,217 1,537 2,289 176 12,125<br />
For the year ended<br />
December 31, 2009<br />
Salaries and<br />
bonus<br />
Option<br />
compensation<br />
Performance<br />
share units<br />
Postemployment<br />
benefits<br />
including<br />
contributions<br />
to defined<br />
contribution<br />
plans<br />
Other<br />
remuneration<br />
(b)<br />
Total<br />
Dr. Heinz Schimmelbusch (a) 1,293 2,004 1,056 561 44 4,958<br />
Arthur Spector 730 259 – 611 – 1,600<br />
Eric Jackson 676 862 317 178 31 2,064<br />
Dr. Reinhard Walter 699 880 317 43 23 1,962<br />
William J. Levy 527 755 211 33 33 1,559<br />
Total 3,925 4,760 1,901 1,426 131 12,143<br />
(a) Dr. Schimmelbusch also received compensation in 2010 and 2009 from Graphit Kropfmühl in his capacity as Supervisory Board member in<br />
the amount of $40 and $50, respectively.<br />
(b) Other remuneration also includes car expenses, country club dues and additional insurance paid for by the Company.<br />
Each member of the management board has an<br />
employment contract with the Company which provides<br />
for severance in the event of termination without cause.<br />
The maximum severance payout is limited to two years<br />
base salary and two years of target annual bonus.<br />
During the year ended December 31, 2009, the Deputy<br />
Chairman of the Company, Mr. Spector left the employ of<br />
the Company. As compensation, Mr. Spector’s separation<br />
agreement requires the following payments:<br />
• From the US subsidiary, payments totaling $1,400 in the<br />
year ended December 31, 2010<br />
• From the Dutch company, payments totaling<br />
10.6 million starting in 2010 and ending in 2011<br />
• Initiation of supplemental executive retirement plan<br />
from the US subsidiary in the amount of $500 per<br />
annum beginning in November 2010<br />
Notes to Consolidated Financial Statements 135
The compensation of the Supervisory Board of the Company comprised:<br />
For the year ended December 31, 2010<br />
Cash<br />
remuneration<br />
Share-based<br />
remuneration<br />
Total<br />
compensation<br />
Pedro Pablo Kuczynski 95 66 161<br />
Jack Messman 90 45 135<br />
General Wesley Clark 60 40 100<br />
Norbert Quinkert 80 40 120<br />
Guy de Selliers 80 40 120<br />
Dr. Martin Hoyos 60 40 100<br />
Total 465 271 736<br />
For the year ended December 31, 2009<br />
Cash<br />
remuneration<br />
Share-based<br />
remuneration<br />
Total<br />
compensation<br />
Pedro Pablo Kuczynski 95 69 164<br />
Jack Messman 90 47 137<br />
General Wesley Clark 60 42 102<br />
Norbert Quinkert 80 42 122<br />
Guy de Selliers 80 42 122<br />
Dr. Martin Hoyos 34 23 57<br />
Total 439 265 704<br />
Total compensation for key management, including both the<br />
Management Board and the Supervisory Board was $12,861<br />
in the year ended December 31, 2010 (2009: $12,847).<br />
Entities with significant influence over the Company<br />
Safeguard International Fund (“SIF” or “Safeguard”)<br />
previously owned approximately 26.6% of the voting shares<br />
of the Company. During the year ended December 31, 2010,<br />
all shares were distributed by Safeguard to its members<br />
and therefore SIF’s ownership percentage is now nil.<br />
One current and one former member of the management<br />
board of the Company are also managing directors of<br />
Safeguard and receive compensation for their role as<br />
managing directors. The relatives of Directors hold only a<br />
de minimus portion of the voting shares.<br />
A number of key management personnel, or their related<br />
parties, hold positions in other group entities that result<br />
in them having control or significant influence over the<br />
financial or operating policies of these entities.<br />
A number of these entities transacted with the Company<br />
in the reporting period. The terms and conditions of the<br />
transactions with key management personnel and their<br />
related parties were no more favourable than those<br />
available, or which might reasonably be expected to be<br />
available, on similar transactions to non-key management<br />
personnel and their related parties on an arm’s<br />
length basis.<br />
Foundation<br />
In July 2010, the foundation “Stichting Continuiteit AMG”<br />
(“Foundation”) was established following the resolution<br />
adopted at its Annual Meeting on May 12, 2010. The board<br />
of the Foundation consists of three members, all of whom<br />
are independent of AMG. The purpose of the Foundation<br />
is to safeguard the interests of the parent company, the<br />
enterprise connected therewith and all the parties having<br />
an interest therein and to exclude as much as possible<br />
influences which could threaten, amongst other things,<br />
the continuity, independence and identity of the parent<br />
company contrary to such interests.<br />
By agreement on December 22, 2010 between the parent<br />
company and the Foundation, the Foundation has been<br />
granted a call option pursuant to which it may purchase<br />
a number of preference shares up to a maximum of the<br />
number of ordinary shares issued and outstanding with<br />
third parties at the time of exercise of the option. The<br />
agreement cannot be terminated by the Company as<br />
long as the Company has not canceled or repurchased<br />
preferences shares acquired by the Foundation.<br />
The Company entered into a cost compensation agreement<br />
with the Foundation dated December 22, 2010. As per the<br />
agreement, the Company is required to provide funds to<br />
the Foundation for the costs incurred in connection with<br />
the fulfilment of the objectives of the Foundation. These<br />
costs include costs for establishing the Foundation,<br />
remuneration and out of pocket expenses for the members<br />
of the board of the Foundation, commitment fees, advisory<br />
fees and certain other costs. Through December 31,<br />
2010, the amounts paid by the Company on behalf of the<br />
Foundation were $29.<br />
136 Notes to Consolidated Financial Statements
Loans and Receivables<br />
On December 11, 2009, the Company loaned $5,000<br />
to Timminco’s wholly-owned subsidiary, Bécancour<br />
Silicon Inc. (“Bécancour”), in exchange for a convertible<br />
promissory note (“Initial Convertible Note”). On<br />
December 15, 2010, the Company amended the terms of<br />
the loan, through an amended convertible promissory<br />
note (“Amended Convertible Note”). As the amendments<br />
to the debt agreement were considered substantial, the<br />
transaction was accounted for as an extinguishment of<br />
the Initial Convertible Note and issuance of new debt in<br />
accordance with IAS 39. The Initial Convertible Note had an<br />
annual interest rate of 12%, payable quarterly in arrears<br />
starting December 31, 2009 and maturing on January 3,<br />
2011. The Amended Convertible Note bears interest at<br />
14%, payable quarterly in arrears starting December 31,<br />
2010 and matures on January 3, 2014. The full principal<br />
amount is convertible into common shares of Timminco at<br />
the conversion price, at AMG’s option at any time, subject<br />
to customary anti-dilution adjustments. The conversion<br />
price was amended from C$1.58 per share under the Initial<br />
Convertible Note to a conversion price of C$0.26 per share<br />
under the Amended Convertible Note.<br />
Both the Initial and Amended Convertible notes were<br />
accounted for as hybrid instruments with the note and<br />
the equity option being valued separately. The value of the<br />
Amended Convertible Note was $71 as of December 31,<br />
2010. The value of the Initial Convertible Note was $3,095<br />
as of December 31, 2009. The value of the equity option<br />
on the Amended Convertible Note was $5,113 as of<br />
December 31, 2010. The value of the equity option on the<br />
Initial Convertible Note was $1,718 as of December 31,<br />
2009. The Company recorded finance income of $371<br />
during the year ended December 31, 2010 as a result of<br />
a gain recognized on the amendment. The Company also<br />
recorded finance income of $100 for an amendment fee<br />
charged in conjunction with the amendment. Interest<br />
income from the convertible notes was $600 the year<br />
ended December 31, 2010. Interest income from the Initial<br />
Convertible Note was $32 the year ended December 31,<br />
2009. All interest for 2010 was paid as of December 31,<br />
2010. Interest receivable related to the Initial Convertible<br />
Note was $34 as of December 31, 2009.<br />
Between January 2004 and May 2007, <strong>ALD</strong> entered into a<br />
series of loan agreements with Intellifast GmbH (formerly<br />
known as PFW <strong>Technologies</strong> GmbH), a subsidiary of<br />
Safeguard and PFW LLC, in an aggregate principal<br />
amount of $1,706. At December 31, 2010, approximately<br />
$2,045 (2009: $2,212) was outstanding under these<br />
loans including interest and an additional amount of<br />
approximately $875 (2009: $783) was due for normal<br />
course of business transactions. The loans were made<br />
for growth capital and expansion purposes. The highest<br />
interest rate on the outstanding loans is 11%.<br />
The Company has been performing services for and has<br />
loaned money to GfE Medical which is a subsidiary of<br />
Safeguard. During the year ended December 31, 2008,<br />
one loan from GfE Medical was transferred to Safeguard.<br />
This loan, in the amount of $698 was repaid by Safeguard<br />
in 2009, although an amount of $29 was still owed for<br />
interest as of December 31, 2009. No amounts are<br />
outstanding as of December 31, 2010.<br />
Transactions with associates<br />
The Company completed the following purchases of<br />
Timminco shares during 2010 and 2009:<br />
Date<br />
Shares<br />
purchased Share price<br />
Total equity<br />
purchase<br />
2010<br />
June 14, 2010 1 15.4 million C$0.65 $9,705<br />
2009<br />
November 20, 2009 3.84 million C$1.38 $5,041<br />
April 30, 2009 7.43 million C$2.02 12,313<br />
February 3, 2009 3.94 million C$3.55 11,519<br />
Total 15.21 million $28,873<br />
1<br />
Timminco 2010 private placement completed in three tranches<br />
with third tranche closing on June 14, 2010.<br />
As of December 31, 2010, the Company owned 83,146,007<br />
or 42.5% of the outstanding shares of Timminco. As of<br />
December 31, 2009, the Company owned 67,761,392 or<br />
42.5% of the outstanding shares of Timminco.<br />
During the first quarter of 2010, one of the Company’s<br />
subsidiaries agreed to prepay $4,765 to Timminco for<br />
2,000 metric tons of silicon metal to be delivered in the<br />
third and fourth quarters of 2010. Timminco delivered<br />
silicon metal to an agreed-upon customer who then repaid<br />
the Company. As of December 31, 2010, no inventory<br />
remained to be delivered to the customer. The Company<br />
recognized $353 in commission income from Timminco<br />
related to these sales.<br />
During the second quarter 2009, 5,000 metric tons of<br />
silicon metal finished goods inventory was purchased from<br />
Timminco for a purchase price of $8,515. This inventory<br />
was sold to a European silicon metal customer in 2009 and<br />
2010. No inventory remains to be sold to the customer as<br />
at December 31, 2010. During the fourth quarter of 2009,<br />
an additional purchase of $6,449 was made for sale to a<br />
different European silicon metal customer. This inventory<br />
was fully delivered in 2009. The Company recognized $538 in<br />
commission income from Timminco related to these sales.<br />
On March 31, 2009, fixed assets were purchased from<br />
Timminco for $7,546. A portion of this was paid in cash<br />
Notes to Consolidated Financial Statements 137
and a portion was related to furnaces manufactured<br />
by another AMG subsidiary. This purchase was made<br />
concurrent with the signing of a Memorandum of<br />
Understanding and Joint Development Agreement<br />
between Timminco and one of the Company’s Canadian<br />
subsidiaries, AMG Conversion Ltd. (“AMGC”). AMGC was<br />
established as a producer of solar grade ingots and bricks<br />
to be sold to the solar wafer market. AMGC utilizes the<br />
equipment purchased from Timminco to manufacture<br />
ingots and bricks both for Timminco’s and its own use.<br />
Timminco’s employees are used in the production<br />
process. Each party receives a tolling fee based on the<br />
cost of contributions to the process, plus an agreed upon<br />
fixed margin on such costs. During 2010, $1,113 (2009:<br />
$1,169) was invoiced to Timminco with respect to these<br />
services. AMGC has a net receivable of $341 due from<br />
Timminco as of December 31, 2010 (2009: $442).<br />
On September 15, 2009 and October 12, 2009, AMGC<br />
purchased inventory from Timminco in the amount of<br />
$5,927 for use in its crystallization facility. A lower of cost<br />
or net realizable value reserve in the amount of $3,420<br />
was established against this inventory during the year<br />
ended December 31, 2010.<br />
Timminco purchased spare parts from on of the Company’s<br />
subsidiaries during the year ended December 31, 2009.<br />
These sales amounted to $624. Additional silicon inventory<br />
transfers were made between Timminco and various<br />
subsidiaries of the Company. The net amount of these<br />
transfers was $111. These transfers were not booked as<br />
sales since the inventory has been or will be shipped back<br />
to the originating party at cost. Finally, the Company billed<br />
Timminco for government regulatory fees in Germany in<br />
the amount of $102.<br />
In the year ended December 31, 2010, Dr. Schimmelbusch<br />
received cash compensation from Timminco in his role as<br />
Chief Executive Officer in the amount of $437 (2009: $117).<br />
Dr. Schimmelbusch also received directors compensation<br />
in 2010 from Timminco in the form of deferred share units<br />
in the amount of $206 (2009: $197).<br />
During the first four months of 2009, the Company and<br />
Timminco shared the remuneration cost of John Fenger,<br />
who was appointed Chief Operating Officer of Timminco<br />
on April 20, 2009. AMG paid $17 of his compensation costs<br />
during 2009. There were several other small transactions<br />
between the Company and Timminco, mainly recharging<br />
Timminco for costs incurred on their behalf. A receivable<br />
of $11 was recorded as of December 31, 2009 related to<br />
these transactions.<br />
Other Transactions<br />
The Company shares office space in the United States<br />
with Safeguard. In 2009, an allocation of Safeguard’s costs<br />
related to the office and the utilities was paid. Certain<br />
amounts related to travel and entertainment and the<br />
salaries of certain employees were cross-charged to<br />
the Company by Safeguard. During the years ended<br />
December 31, 2010 and 2009, the Company was billed $29<br />
and $330 by Safeguard for travel and entertainment of its<br />
Chief Executive Officer and its portion of costs related to<br />
the building. Amounts due to Safeguard at December 31,<br />
2010 and 2009 were $1 and $18, respectively.<br />
In October, 2009, the Company made a payment of<br />
$31 to Allied Carbon Credit for research performed on<br />
the emission reduction potential of a magnesium plant<br />
in Norway. Allied Carbon Credit is 80% owned by Allied<br />
Resource Corporation, whose Chairman is the Chief<br />
Executive Officer of the Company.<br />
Over the course of the year ended December 31, 2010,<br />
the Company paid $173 to Safeguard International<br />
Management GmbH (“SIM GmbH”) for management<br />
services. The service agreement with SIM GmbH requires<br />
the Company to pay for the use of SIM GmbH’s office<br />
and administrative services in its Frankfurt location.<br />
SIM GmbH is a wholly owned subsidiary of Safeguard<br />
International Fund whose managing director is also the<br />
Company’s Chief Executive Officer. In December 2009,<br />
the Company made a payment of $191 to SIM GmbH for<br />
similar services received in 2009.<br />
The Company also leases space in Frankfurt, Germany<br />
from a partnership, in which the Company’s Chief<br />
Executive Officer has an interest. Rent paid for this office<br />
space was $89 during the year ended December 31, 2010.<br />
All outstanding balances with these related parties<br />
are priced on an arm’s length basis. None of the balances<br />
are secured.<br />
37. Subsequent events<br />
On February 18, 2011, the Company acquired 100% of the<br />
LLC interests of KB Alloys, LLC (“KB”) from CHS Capital<br />
LLC for $24,305 in cash, $23,500 related to purchase<br />
price and $805 in additional costs and escrow. KB is<br />
the North American market leader in the production<br />
of aluminum master alloys and grain refiners. The<br />
combination of KB with AMG’s aluminum master alloys<br />
businesses establishes AMG as the world’s largest<br />
producer of master alloys for the aluminum industry. This<br />
acquisition expands AMG’s cost-effective product offering<br />
while assuring security of supply for customers.<br />
138 Notes to Consolidated Financial Statements
AMG Advanced Metallurgical Group, N.V.<br />
Parent Company Statement of Financial Position<br />
(After profit appropriation)<br />
As at December 31 Note 2010 2009<br />
In thousands of US Dollars<br />
Assets<br />
Property, plant and equipment, net 2 677 735<br />
Intangible assets, net 3 207 294<br />
Investments in subsidiaries 4 153,328 147,417<br />
Investment in associates 4 17,706 19,460<br />
Loans due from subsidiaries 4 108,589 117,638<br />
Investment in equity securities 5 887 970<br />
Deposit 6 84 66<br />
Notes receivable 7 2,321 3,094<br />
Derivative financial instrument 14 5,113 1,718<br />
Total non-current assets 288,912 291,392<br />
Trade and related party receivables 7 19,273 11,626<br />
Notes receivable 7 2,750 5,362<br />
Loans due from subsidiaries 4 96,116 93,397<br />
Derivative financial instruments 14 67 527<br />
Prepayments 8 510 495<br />
Cash and cash equivalents 9 3,320 4,243<br />
Total current assets 122,036 115,650<br />
Total assets 410,948 407,042<br />
Equity<br />
Issued capital 10 741 725<br />
Share premium 10 381,636 379,518<br />
Foreign currency translation reserve 10 (8,215) (5,659)<br />
Other reserves 10 44,373 36,943<br />
Retained earnings (deficit) 10 (196,481) (198,897)<br />
Total equity attributable to shareholders of the Company 222,054 212,630<br />
Provisions<br />
Provision for negative participation 4 113,851 143,794<br />
Liabilities<br />
Long-term debt 11 69,000 39,000<br />
Total non-current liabilities 69,000 39,000<br />
Taxes and premium 135 71<br />
Trade and other payables 12 5,882 6,534<br />
Amounts due to subsidiaries 13 26 4,707<br />
Derivative financial instruments 14 – 306<br />
Current taxes payable – –<br />
Total current liabilities 6,043 11,618<br />
Total liabilities 75,043 50,618<br />
Total equity, provisions and liabilities 410,948 407,042<br />
The notes are an integral part of these financial statements.<br />
AMG Advanced Metallurgical Group, N.V.<br />
Parent Company Income Statement<br />
For the year ended December 31 2010 2009<br />
In thousands of US Dollars<br />
Income (loss) from subsidiaries, after taxes 22,205 (29,715)<br />
Other income and expenses, net (19,791) (45,927)<br />
Net income (loss) 2,414 (75,642)<br />
The notes are an integral part of these financial statements.<br />
Parent Company Financial Statements 139
1. Summary of significant accounting policies<br />
The parent company financial statements have been<br />
prepared in accordance with Section 362.8 of Title 9, Book 2<br />
of the Netherlands Civil Code, as generally accepted in the<br />
Netherlands. The accounting policies used in the financial<br />
statements are similar to the accounting policies used in<br />
the Consolidated Financial Statements, with the exception<br />
of financial fixed assets. Subsidiaries are valued at their<br />
net equity value, including allocated goodwill.<br />
For a listing of all subsidiaries included in the<br />
consolidated financial statements of the Company, please<br />
refer to note 1 in the consolidated financial statements.<br />
As of December 31, 2010, the statement of financial<br />
position has been converted to USD from Euros using a<br />
conversion rate of EUR:USD of 1.3253. (2009: 1.4333)<br />
2. Property, plant and equipment<br />
Cost<br />
Leasehold<br />
improvements<br />
Machinery and<br />
equipment Office furniture Total<br />
Balance at January 1, 2009 599 91 – 690<br />
Additions – – 251 251<br />
Balance at December 31, 2009 599 91 251 941<br />
Balance January 1, 2010 599 91 251 941<br />
Additions – – 155 155<br />
Balance at December 31, 2010 599 91 406 1,096<br />
Depreciation<br />
Balance at January 1, 2009 (54) (20) – (74)<br />
Depreciation (116) – (16) (132)<br />
Balance at December 31, 2009 (170) (20) (16) (206)<br />
Balance at January 1, 2010 (170) (20) (16) (206)<br />
Depreciation (119) (62) (32) (213)<br />
Balance at December 31, 2010 (289) (82) (48) (419)<br />
Carrying amounts<br />
At January 1, 2009 545 71 – 616<br />
At December 31, 2009 429 71 235 735<br />
At January 1, 2010 429 71 235 735<br />
At December 31, 2010 310 9 358 677<br />
140 Parent Company Financial Statements
3. Intangible assets<br />
Intangible assets include computer equipment and software licenses. They are carried at amortized cost and are<br />
amortized over their anticipated useful life.<br />
Cost<br />
Balance January 1, 2009 –<br />
Additions 406<br />
Balance at December 31, 2009 406<br />
Balance January 1, 2010 406<br />
Additions 13<br />
Balance at December 31, 2010 419<br />
Amortization<br />
Balance at January 1, 2009 –<br />
Amortization (112)<br />
Balance at December 31, 2009 (112)<br />
Balance January 1, 2010 (112)<br />
Amortization (100)<br />
Balance at December 31, 2010 (212)<br />
At January 1, 2009 –<br />
At December 31, 2009 294<br />
At January 1, 2010 294<br />
At December 31, 2010 207<br />
4. Financial Fixed Assets<br />
Investments in Subsidiaries<br />
The movement in subsidiaries was as follows:<br />
Investment in<br />
subsidiaries<br />
Provision for negative<br />
participation<br />
Total<br />
Balance at January 1, 2009 181,854 (111,984) 69,870<br />
Investment in companies 35,444 – 35,444<br />
Recapitalization of companies (57,912) – (57,912)<br />
Subsidiary options 10,020 – 10,020<br />
Loss for the period (29,715) – (29,715)<br />
Deferred gains on derivatives 13,455 – 13,455<br />
Other (323) – (323)<br />
Currency translation adjustment 5,660 – 5,660<br />
Reclass to associate (42,876) – (42,876)<br />
Balance at December 31, 2009 115,607 (111,984) 3,623<br />
Reclassification for provision for negative participation:<br />
Provision for negative participation 31,810 (31,810) –<br />
Balance at December 31, 2009 147,417 (143,794) 3,623<br />
Balance at January 1, 2010 147,417 (143,794) 3,623<br />
Investment in companies 2,659 – 2,659<br />
Subsidiary options 2,836 – 2,836<br />
Profit for the period 22,205 – 22,205<br />
Deferred gains on derivatives 1,865 – 1,865<br />
Other (8) – (8)<br />
Currency translation adjustment 6,297 – 6,297<br />
Balance at December 31, 2010 183,271 (143,794) 39,477<br />
Reclassification for provision for negative participation:<br />
Provision for negative participation (29,943) 29,943 –<br />
Balance at December 31, 2010 153,328 (113,851) 39,477<br />
Parent Company Financial Statements 141
Deferred gains / losses on derivatives<br />
This represents the effect of the Company’s subsidiaries<br />
recording the changes in their equity from the effective<br />
portion of the cumulative net change in the fair value<br />
of cash flow hedging instruments related to hedged<br />
transactions that have not yet occurred.<br />
Subsidiary options<br />
Subsidiaries are locally recording the effect of sharebased<br />
payments for their employees in their equity. The<br />
equity balance of the subsidiaries is comprised of the<br />
value of equity-settled share-based payments provided<br />
to employees (and outside consultants), including key<br />
management personnel, as part of their remuneration.<br />
The change in the Company’s investment in subsidiary<br />
balance is equal to the change recognized in the sharebased<br />
payment reserves at the subsidiaries.<br />
Recapitalization of companies<br />
AMG NV periodically reviews the capital structure of its<br />
subsidiaries. When a subsidiary receives additional capital<br />
from the Company, it is recorded through the investment<br />
in subsidiaries balance.<br />
Investment in associates<br />
On September 28, 2009, the Company reduced its<br />
ownership percentage of Timminco from 50.8% to 47.9%.<br />
This loss of control resulted in a loss on deemed disposal<br />
of $1,131. Timminco is therefore, no longer consolidated<br />
and is recorded as an associate in the consolidated<br />
statement of financial position. During its period of equity<br />
ownership in 2009, the Company’s share of Timminco’s<br />
loss was $27,498. During the year ended December 31,<br />
2010, the Company’s share of Timminco’s loss was $11,459.<br />
Loans due from subsidiaries<br />
Non-current<br />
loans due from<br />
subsidiaries<br />
Current loans due<br />
from subsidiaries<br />
Total<br />
Balance at January 1, 2009 58,291 127,351 185,642<br />
Loans 57,912 – 57,912<br />
Repayments – (30,435) (30,435)<br />
Offset against loans due to subsidiaries – (3,698) (3,698)<br />
Currency translation adjustment 1,435 179 1,614<br />
Balance at December 31, 2009 117,638 93,397 211,035<br />
Balance at January 1, 2010 117,638 93,397 211,035<br />
Loans 140 7,000 7,140<br />
Repayments (340) (3,747) (4,087)<br />
Currency translation adjustment (8,849) (534) (9,383)<br />
Balance at December 31, 2010 108,589 96,116 204,705<br />
The loan offsets in 2009 were formally documented and<br />
recorded between the Company and one of its German<br />
subsidiaries as of March 31, 2009. Amounts are loaned<br />
to subsidiaries primarily to finance operations and<br />
working capital.<br />
The non-current loans are due from a German subsidiary.<br />
The first loan which was initiated in 2008 has a variable<br />
interest rate and a term through December 31, 2018.<br />
At December 31, 2010, the rate on this loan was 2.938%<br />
(2009: 5.33%). The second loan was initiated in 2009, has a<br />
term through 2017 and a fixed interest rate of 8%. Current<br />
loans are due from several subsidiaries in Europe and<br />
the United States. Loans in the amount of $96,116 (2009:<br />
$93,197) are due in 2010 and loans with a balance of nil<br />
(2009: $200) are due upon request. All current loans<br />
have an interest rate in the range of 3.50 – 4.01% at<br />
December 31, 2010 (4.28 – 7.00% at December 31, 2009).<br />
5. Investment in equity instruments<br />
The Company has a strategic investment in a growthbased<br />
company in Iceland. This equity investment cannot<br />
be reliably measured at fair value and is therefore<br />
accounted for using the cost basis. As December 31, 2010,<br />
this investment amounted to $887 (2009: $970).<br />
6. Deposits<br />
The deposit account includes security deposits for the<br />
Amsterdam and Frankfurt office locations of the Company.<br />
142 Parent Company Financial Statements
7. Receivables from associates and related parties<br />
On December 11, 2009, the Company loaned $5,000 to<br />
Timminco’s wholly-owned subsidiary, Bécancour Silicon<br />
Inc. (“Bécancour”), in exchange for a convertible senior<br />
subordinated promissory note (“Convertible Note”).<br />
The Convertible Note accrued interest at 12%, payable<br />
quarterly in arrears. On December 15, 2010, the Company<br />
amended the terms of the Convertible Note through an<br />
amended convertible senior subordinated promissory<br />
note (“Amended Convertible Note”). The Amended<br />
Convertible Note bears interest at 14%, payable quarterly<br />
in arrears starting December 31, 2010 and matures on<br />
January 3, 2014. The full principal amount is convertible<br />
into common shares of Timminco, at AMG’s option at any<br />
time, at a conversion price of C$0.26 per share, subject<br />
to customary anti-dilution adjustments. Both the original<br />
and the Amended Convertible notes were accounted for<br />
as hybrid instruments with the note and the equity option<br />
being valued separately. See note 14 for valuation of the<br />
option. The value of the note was $71 as at December 31,<br />
2010 (December 31, 2009:$3,094).<br />
All interest owed related to the Amended Convertible Note<br />
was paid as of December 31, 2010. At December 31, 2009,<br />
interest receivable related to the original note was $34.<br />
Trade and related party receivables of $19,273 (2009:<br />
$11,626) primarily represents interest owed to the<br />
Company on loans due from subsidiaries ($8,935) and<br />
management fees owed ($6,760). The remainder of the<br />
balance is comprised of amounts owed by subsidiaries<br />
that represent expenses paid for by AMG and billed back<br />
to the subsidiaries.<br />
8. Prepayments<br />
At December 31, 2010 and 2009, prepayments<br />
primarily represent prepaid insurance and prepaid rent<br />
for the Company.<br />
9. Cash and cash equivalents<br />
Bank balances earn interest at floating rates based on<br />
daily bank deposit rates.<br />
Parent Company Financial Statements 143
10. Capital and reserves<br />
Issued<br />
capital<br />
Equity attributable to shareholders of the parent<br />
Share<br />
premium<br />
Foreign<br />
currency<br />
translation<br />
reserve<br />
Other<br />
reserves<br />
Retained<br />
deficit<br />
Balance at January 1, 2009 724 379,297 (10,115) 7,900 (123,110) 254,696<br />
Foreign currency translation – – 4,456 – – 4,456<br />
Gain on cash flow hedges, net of tax – – – 13,455 – 13,455<br />
Net income recognized directly in equity – – 4,456 13,455 – 17,911<br />
Loss for the year – – – – (75,642) (75,642)<br />
Total recognized income and expense for the year – – 4,456 13,455 (75,642) (57,731)<br />
Issuance of shares to Supervisory Board 1 400 – – – 401<br />
Equity-settled share-based payment expense at subsidiary – – – 1,559 – 1,559<br />
Equity-settled share-based payment expense – – – 14,029 – 14,029<br />
Other – (179) – – (145) (324)<br />
Balance at December 31, 2009 725 379,518 (5,659) 36,943 (198,897) 212,630<br />
Balance at January 1, 2010 725 379,518 (5,659) 36,943 (198,897) 212,630<br />
Foreign currency translation – – (2,556) – – (2,556)<br />
Gain on cash flow hedges, net of tax – – – 1,865 – 1,865<br />
Net (loss) income recognized directly in equity – – (2,556) 1,865 – (691)<br />
Profit for the year – – – – 2,414 2,414<br />
Total recognized income and expense for the year – – (2,556) 1,865 2,414 1,723<br />
Issuance of shares to Supervisory Board 1 272 – – – 273<br />
Issuance of shares to acquire minority interest 15 1,846 – – – 1,861<br />
Equity-settled share-based payment expense – – – 5,565 – 5,565<br />
Other – – – – 2 2<br />
Balance at December 31, 2010 741 381,636 (8,215) 44,373 (196,481) 222,054<br />
Total<br />
Share capital<br />
At December 31, 2010, the Company’s authorized share<br />
capital was comprised of 65,000,000 ordinary shares<br />
(2009: 100,000,000) with a nominal share value of 10.02<br />
(2009: 10.02) and 65,000,000 preference shares (2009: nil)<br />
with a nominal share value of 10.02.<br />
At December 31, 2010, the issued and outstanding share<br />
capital was comprised of 27,503,885 ordinary shares<br />
(2009: 26,899,548), with a nominal value of 10.02 (2009:<br />
10.02) which were fully paid. No preference shares were<br />
outstanding at December 31, 2010.<br />
A rollforward of the total shares outstanding is<br />
noted below:<br />
Balance at January 1, 2009 26,855,586<br />
Shares issued to Supervisory Board directors 43,962<br />
Balance at December 31, 2009 26,899,548<br />
Balance at January 1, 2010 26,899,548<br />
Shares issued to Supervisory Board directors 28,808<br />
Shares issued to purchase additional shares<br />
of GK 575,529<br />
Balance at December 31, 2010 27,503,885<br />
Supervisory Board remuneration<br />
During the years ended December 31, 2010 and 2009,<br />
28,808 and 43,962 shares were issued, respectively, as<br />
compensation to its Supervisory Board members as<br />
compensation for services provided in 2010 and 2009.<br />
These shares were awarded as part of the remuneration<br />
policy approved by the Annual General Meeting.<br />
Shares issued to purchase additional shares of<br />
Graphit Kropfmühl<br />
On December 22, 2010, the Company issued 575,529<br />
additional shares in order to acquire an additional 8.5% of<br />
Graphit Kropfmühl. This purchase raised the Company’s<br />
ownership in GK from 79.5% to 88.0%. The Company<br />
chose to measure the non-controlling interest (“NCI”) at<br />
its proportionate share of the recognized amount of the<br />
GK’s net identifiable assets at the acquisition date.<br />
144 Parent Company Financial Statements
The following is the calculation of the equity transaction:<br />
Non-controlling interest at December 22, 2010 4,502<br />
Transfer to AMG (8.5%) 1,861<br />
12% interest carried forward 2,641<br />
Adjustment to equity:<br />
Fair value of consideration 6,431<br />
Change to NCI (see above) 1,861<br />
Dilution in AMG equity from purchase of NCI 4,570<br />
In anticipation of the Company’s Annual General Meeting’s<br />
adoption of the annual accounts, it is proposed that the net<br />
income for 2010 of $2,414 (2009: ($75,642)) be allocated<br />
to the retained earnings. Other reserves and the foreign<br />
currency translation reserve are not distributable. There<br />
are no expected tax consequences on retained earnings<br />
as no distributions are anticipated.<br />
Preference shares<br />
In July 2010, the foundation “Stichting Continuiteit AMG”<br />
(“Foundation”) was established following the resolution<br />
adopted at its Annual Meeting on May 12, 2010. The board<br />
of the Foundation consists of three members, all of whom<br />
are independent of AMG. The purpose of the Foundation<br />
is to safeguard the interests of the parent company, the<br />
enterprise connected therewith and all the parties having<br />
an interest therein and to exclude as much as possible<br />
influences which could threaten, amongst other things,<br />
the continuity, independence and identity of the parent<br />
company contrary to such interests.<br />
By agreement on December 22, 2010 between the parent<br />
company and the Foundation, the Foundation has been<br />
granted a call option pursuant to which it may purchase<br />
a number of preference shares up to a maximum of the<br />
number of ordinary shares issued and outstanding with<br />
third parties at the time of exercise of the option. The<br />
agreement cannot be terminated by the Company as<br />
long as the Company has not canceled or repurchased<br />
preferences shares acquired by the Foundation.<br />
11. Long term debt<br />
The Company and its subsidiaries are parties to a<br />
long term debt agreement that is comprised of two<br />
facilities, a $100,000 term loan facility (“Term Loan”)<br />
and a $175,000 multicurrency revolving credit facility<br />
agreement (“Revolving Credit Facility”). The Term Loan<br />
and the Revolving Credit Facility mature on August 30,<br />
2012 (together the “Credit Facility”). The Credit Facility is<br />
secured by substantially all of the assets of the material<br />
subsidiaries, excluding Timminco and GK, and a 100%<br />
pledge on all of the Timminco and GK shares which are<br />
owned by the Company.<br />
During the year ended December 31, 2010, the Company<br />
borrowed in order to fund working capital. The balance<br />
of the borrowings as at December 31, 2010 was $69,000.<br />
(2009:$39,000).<br />
Interest on the borrowings is based on current LIBOR plus<br />
margin. The margin is based on the current leverage ratio.<br />
As of December 31, 2010, the margin was 2.25 (2009: 1.50).<br />
The Credit Facility is subject to several affirmative<br />
and negative covenants including, but not limited to,<br />
the following:<br />
• EBITDA to Net Finance Charges: Not to be less<br />
than 3.00: 1<br />
• Net Debt to EBITDA: Not to exceed 3.75: 1<br />
• Senior Net Debt to EBITDA: Not to exceed 3:00:1<br />
EBITDA, Net Finance Charges, Net Debt and Senior Net<br />
Debt are defined in the Credit Facility agreement.<br />
On May 27, 2010, the Company amended and restated<br />
the Credit Facility in order to adjust certain provisions<br />
for the strategic plans of the Company. Included in the<br />
amendements was a change to the Senior Net Debt to<br />
EBITDA covenant. Previously, the maximum ratio for<br />
this covenant was 2.00:1. The amendment increased the<br />
maximum ratio to 3.00:1. Fees related to this amendment<br />
were $1,675 and are included in finance expense.<br />
Mandatory prepayment of the Credit Facility is required<br />
upon the occurrence of (i) a change of control or (ii) the<br />
sale of all or substantially all of the business and/or<br />
assets of the Company whether in a single transaction or<br />
a series of related transactions.<br />
12. Trade and other payables<br />
Trade and other payables represent amounts owed to<br />
related parties as well as amounts owed to professional<br />
service firms. See note 16.<br />
13. Amounts due to subsidiaries<br />
Certain payroll, travel and entertainment and other<br />
expenses are paid directly by a subsidiary and billed to the<br />
Company at cost. As of December 31, 2010 and 2009, these<br />
amounted to $26 and $4,707, respectively.<br />
14. Derivative financial instruments<br />
Please refer to notes 31 and 32 in the consolidated<br />
financial statements for more information on financial<br />
instruments and risk management policies.<br />
Foreign currency forward contracts<br />
At any point in time, the Company uses foreign exchange<br />
forward contracts to hedge intergroup loans that will be<br />
repaid in different functional currencies. These contracts<br />
are negotiated to match the expected terms of the<br />
commitments and generally mature within one year. When<br />
necessary, these contracts are rolled over at maturity.<br />
The Company’s foreign exchange forward contracts,<br />
although part of the risk management strategy are treated<br />
Parent Company Financial Statements 145
as economic hedges. The fair value of these contracts<br />
is recorded in the statement of financial position. As of<br />
December 31, 2010, the Company had a derivative financial<br />
instrument asset of $67. As of December 31, 2009, the<br />
Company had a derivative financial instrument asset of<br />
$527 and a derivative financial liability of $306.<br />
Embedded derivative<br />
As part of its convertible note receivable from Bécancour<br />
Silicon (see note 7), AMG concluded that the conversion<br />
feature was an embedded derivative. The conversion<br />
feature was revalued upon the amendment of the note<br />
receivable, but is still being treated as a derivative. This<br />
derivative had a fair value of $5,113 as at December 31,<br />
2010 (2009: $1,718).<br />
15. Commitments and contingencies<br />
The Company has entered into leases for office space in<br />
Amsterdam and Frankfurt. The Amsterdam lease term<br />
is through March 31, 2013 while the Frankfurt lease term<br />
is through December 31, 2011. There is also a lease for<br />
copier equipment in Frankfurt through December 31, 2011.<br />
Future minimum lease payments under these leases as at<br />
December 31 are payable as follows:<br />
2010 2009<br />
Less than one year 362 201<br />
Between one and five years 311 452<br />
More than five years – –<br />
Total 673 653<br />
16. Related parties<br />
Key management compensation data is disclosed in<br />
note 36 of the consolidated financial statements.<br />
Safeguard International Fund (“SIF” or “Safeguard”)<br />
previously owned approximately 26.6% of the voting<br />
shares of the Company. During the year ended<br />
December 31, 2010, all shares were distributed by<br />
Safeguard to its members and therefore SIF’s ownership<br />
percentage is now nil. One current and one former<br />
member of the management board of the Company are<br />
also managing directors of Safeguard and have received<br />
compensation for their roles as managing directors. The<br />
relatives of Directors hold only a de minimus portion of<br />
the voting shares.<br />
The Company entered into a cost compensation<br />
agreement with the Foundation dated December 22,<br />
2010. As per the agreement, the Company is required to<br />
provide funds to the Foundation for the costs incurred<br />
in connection with the fulfilment of the objectives of the<br />
Foundation. These costs include costs for establishing the<br />
Foundation, remuneration and out of pocket expenses for<br />
the members of the board of the Foundation, commitment<br />
fees, advisory fees and certain other costs. Through<br />
December 31, 2010, the amounts paid by the Company on<br />
behalf of the Foundation were $29.<br />
Other Transactions<br />
During 2007, the Company incurred legal and accounting<br />
fees in association with the initial public offering. SIF<br />
offered a portion of their own shares for sale in the initial<br />
public offering and therefore a proportionate amount<br />
of the costs approximating $4,526 were billed to SIF.<br />
Of this amount, nil and $142 remains outstanding at<br />
December 31, 2010 and 2009, respectively.<br />
17. Employees<br />
At December 31, 2010 the Company had 14 employees<br />
(2009: 9).<br />
18. Audit Fees<br />
Ernst and Young Accountants LLP has served as the<br />
Company’s independent auditors for each of the two years<br />
in the periods ended December 31, 2010 and December 31,<br />
2009. The following table sets forth the total fees in<br />
accordance with Part 9 of Book 2, article 382a of the<br />
Netherlands Civil Code.<br />
2010 2009<br />
Audit fees 455 467<br />
Audit related fees 46 72<br />
Other 122 183<br />
Total 623 722<br />
146 Parent Company Financial Statements
Other Information<br />
Article 25 and 26 of the Articles of Association<br />
25. Adoption of Annual Accounts<br />
25.1 The annual accounts shall be adopted by the<br />
general meeting.<br />
25.2 Without prejudice to the provisions of article<br />
23.2, the Company shall ensure that the annual<br />
accounts, the annual report and the additional<br />
information that should be made generally<br />
available together with the annual accounts<br />
pursuant to or in accordance with the law, are<br />
made generally available from the day of the<br />
convocation of the general meeting at which they<br />
are to be dealt with.<br />
25.3 The annual accounts cannot be adopted if the<br />
general meeting has not been able to take notice<br />
of the auditor’s report, unless a valid ground for<br />
the absence of the auditor’s report is given under<br />
the other additional information referred to in<br />
article 25.2<br />
26.1 The management board shall, subject to the<br />
approval of the supervisory board, be authorized<br />
to reserve the profits wholly or partly.<br />
Events after the balance sheet date<br />
On February 18, 2011, the Company acquired 100% of the<br />
LLC interests of KB Alloys, LLC (“KB”) from CHS Capital<br />
LLC for $24,305 in cash, $23,500 related to purchase price<br />
and $805 in additional costs and escrow. KB is the<br />
North American market leader in the production<br />
of aluminum master alloys and grain refiners. The<br />
combination of KB with AMG’s aluminum master alloys<br />
businesses establishes AMG as the world’s largest<br />
producer of master alloys for the aluminum industry. This<br />
acquisition expands AMG’s cost-effective product offering<br />
while assuring security of supply for customers.<br />
Appropriation of net profit<br />
Pursuant to section 26 of the Articles of Association, the<br />
Management Board shall, subject to the approval of the<br />
Supervisory Board, be authorized to reserve the profits<br />
in whole or in part. The General Meeting is authorized to<br />
distribute and/or reserve any remaining part of the profits.<br />
AMG’s dividend policy is to retain future earnings to<br />
finance the growth and development of its business. As a<br />
result, the Management Board, with the approval of the<br />
Supervisory Board, has resolved that no dividend will be<br />
paid in respect of 2010 and that the 2010 net profit will be<br />
added to the retained earnings.<br />
Amsterdam, March 31, 2011<br />
Other Information 147
Independent Auditor’s Report<br />
To: the Shareholders meeting and Supervisory Board of AMG<br />
Advanced Metallurgical Group N.V.<br />
Report on the financial statements<br />
We have audited the accompanying financial statements<br />
2010 of AMG Advanced Metallurgical Group N.V.,<br />
Amsterdam, the Netherlands. The financial statements<br />
include the consolidated financial statements and the<br />
parent company financial statements. The consolidated<br />
financial statements comprise the consolidated statement<br />
of financial position as at December 31, 2010, the<br />
consolidated income statement, consolidated statement<br />
of comprehensive income, changes in equity and cash<br />
flows for the year then ended, and notes, comprising<br />
a summary of the significant accounting policies and<br />
other explanatory information. The Company financial<br />
statements comprise the parent company statement of<br />
financial position as at December 31, 2010, the parent<br />
company income statement for the year then ended and<br />
the notes, comprising a summary of the accounting<br />
policies and other explanatory information.<br />
Management’s responsibility<br />
Management is responsible for the preparation and fair<br />
presentation of these financial statements in accordance<br />
with International Financial Reporting Standards as<br />
adopted by the European Union and with Part 9 of<br />
Book 2 of the Dutch Civil Code, and for the preparation<br />
of the management board report in accordance with<br />
Part 9 of Book 2 of the Dutch Civil Code . Furthermore<br />
management is responsible for such internal control<br />
as it determines is necessary to enable the preparation<br />
of the financial statements that are free from material<br />
misstatement, whether due to fraud or error.<br />
Auditor’s responsibility<br />
Our responsibility is to express an opinion on these<br />
financial statements based on our audit. We conducted our<br />
audit in accordance with Dutch law, including the Dutch<br />
Standards on Auditing. This requires that we comply with<br />
ethical requirements and plan and perform the audit to<br />
obtain reasonable assurance about whether the financial<br />
statements are free from material misstatement.<br />
An audit involves performing procedures to obtain audit<br />
evidence about the amounts and disclosures in the<br />
financial statements. The procedures selected depend<br />
on the auditor’s judgment, including the assessment<br />
of the risks of material misstatement of the financial<br />
statements, whether due to fraud or error.<br />
In making those risk assessments, the auditor considers<br />
internal control relevant to the entity’s preparation and fair<br />
presentation of the financial statements in order to design<br />
audit procedures that are appropriate in the circumstances,<br />
but not for the purpose of expressing an opinion on the<br />
effectiveness of the entity’s internal control. An audit also<br />
includes evaluating the appropriateness of accounting<br />
policies used and the reasonableness of accounting<br />
estimates made by management, as well as evaluating the<br />
overall presentation of the financial statements.<br />
We believe that the audit evidence we have obtained<br />
is sufficient and appropriate to provide a basis for our<br />
audit opinion.<br />
Opinion with respect to the consolidated<br />
financial statements<br />
In our opinion, the consolidated financial statements<br />
give a true and fair view of the financial position of AMG<br />
Advanced Metallurgical Group N.V. as at December 31,<br />
2010, its result and its cash flows for the year then ended<br />
in accordance with International Financial Reporting<br />
Standards as adopted by the European Union and with<br />
Part 9 of Book 2 of the Dutch Civil Code.<br />
Opinion with respect to the Company financial statements<br />
In our opinion, the Company financial statements give<br />
a true and fair view of the financial position of AMG<br />
Advanced Metallurgical Group N.V. as at December 31,<br />
2010 and of its result for the year then ended in<br />
accordance with Part 9 of Book 2 of the Dutch Civil Code.<br />
Report on other legal and regulatory requirements<br />
Pursuant to the legal requirement under Section 2:393<br />
sub 5 at e and f of the Dutch Civil Code, we have no<br />
deficiencies to report as a result of our examination<br />
whether the management board report , to the extent<br />
we can assess, has been prepared in accordance with<br />
Part 9 of Book 2 of this Code, and whether the information<br />
as required under Section 2:392 sub 1 at b-h has been<br />
annexed. Further we report that the management board<br />
report, to the extent we can assess, is consistent with<br />
the financial statements as required by Section 2:391<br />
sub 4 of the Dutch Civil Code.<br />
Eindhoven, March 31, 2011<br />
Ernst & Young Accountants LLP<br />
/s/ A.J.M. van der Sanden<br />
148 Independent Auditor’s Report
Shareholder Information<br />
Supervisory Board<br />
Pedro Pablo Kuczynski, Chairman<br />
Remuneration Committee<br />
Wesley Clark<br />
Selection and Appointment Committee<br />
Martin Hoyos<br />
Audit Committee<br />
Jack Messman<br />
Audit Committee<br />
Remuneration Committee (Chairman)<br />
Norbert Quinkert<br />
Selection and Appointment Committee (Chairman)<br />
Guy de Selliers<br />
Audit Committee (Chairman)<br />
Management Board<br />
Heinz Schimmelbusch<br />
Chairman and Chief Executive Officer<br />
William Levy<br />
Chief Financial Officer<br />
Eric Jackson<br />
President, Advanced Materials Division<br />
Reinhard Walter<br />
President, Engineering Systems Division<br />
Copies of the Annual Report and further information<br />
are obtainable from the Investor Relations Department<br />
of the Company<br />
ir@amg-nv.com<br />
or by accessing the Company’s website<br />
www.amg-nv.com<br />
Listing Agent<br />
ING Bank N.V.<br />
Paying Agent<br />
ING Bank N.V.<br />
Euronext: AMG<br />
Trade Register<br />
Trade Register<br />
AMG Advanced Metallurgical Group N.V. is registered with<br />
the trade register in the Netherlands under no. 34261128<br />
Design and production by TMX Equicom<br />
Shareholder Information 149
AMG Advanced Metallurgical Group N.V.<br />
Head Office—Netherlands<br />
WTC Amsterdam<br />
Toren C<br />
Strawinskylaan 1343<br />
1077 XX Amsterdam<br />
Netherlands<br />
T: +31 20 7147 140<br />
United States Office<br />
Building 200<br />
435 Devon Park Drive<br />
Wayne, PA 19087<br />
United States<br />
T: +1 610 293 2501<br />
www.amg-nv.com
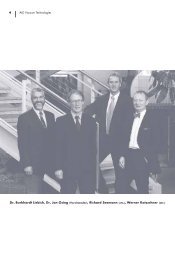


![TITANIUM brochure [PDF] - ALD Vacuum Technologies](https://img.yumpu.com/30889132/1/184x260/titanium-brochure-pdf-ald-vacuum-technologies.jpg?quality=85)

![(VID) Technology brochure [PDF] - ALD Vacuum Technologies](https://img.yumpu.com/30095121/1/184x260/vid-technology-brochure-pdf-ald-vacuum-technologies.jpg?quality=85)