NIR remission spectroscopy of turbid media
NIR remission spectroscopy of turbid media
NIR remission spectroscopy of turbid media

Create successful ePaper yourself
Turn your PDF publications into a flip-book with our unique Google optimized e-Paper software.
<strong>NIR</strong> <strong>remission</strong> <strong>spectroscopy</strong> <strong>of</strong> <strong>turbid</strong> <strong>media</strong><br />
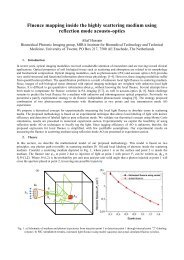
Philipp Krauter<br />
Institut für Lasertechnologien in der Medizin und Meßtechnik, Helmholtzstr. 12, D-89081 Ulm, Germany<br />
Tel.: 0049 731 1429886; E-mail: philipp.krauter@uni-ulm.de<br />
1. Introduction<br />
In process control the knowledge <strong>of</strong> the quantitative concentration <strong>of</strong> the ingredients is important. This can<br />
be achieved by measuring the <strong>remission</strong> spectrum and by comparison with calibration spectra. However, this<br />
method cannot separate the reduced scattering coefficient µ ′ s from the absorption coefficient µ a , e.g. an unnoticed<br />
change <strong>of</strong> µ ′ s is interpreted as a change in µ a . In contrast, a combination <strong>of</strong> the spatially resolved<br />
reflectance and the total reflectance enables the determination <strong>of</strong> µ a undisturbed by scattering. At the same<br />
time, it delivers a high wavelength resolution. 1<br />
In the following, µ ′ s was determined using the spatially resolved reflectance 2 in the VIS. An empirical description<br />
<strong>of</strong> the wavelength dependence <strong>of</strong> µ ′ s is given by the power law µ ′ s(λ) = k 0 λ k1 . In the <strong>NIR</strong> µ ′ s is obtained by<br />
extrapolating this law. Compared to our recent work 1 the focus <strong>of</strong> this work is the enhancement <strong>of</strong> the spectral<br />
range <strong>of</strong> the total reflectance to 450 nm ≤ λ ≤ 1700 nm. An optimized data analysis allows fast interpretation<br />
<strong>of</strong> the measured <strong>remission</strong> spectrum by use <strong>of</strong> a lookup table. The distribution <strong>of</strong> light is calculated numerically<br />
with the radiative transfer equation. For these calculations, the detection geometry is taken into account. Verification<br />
<strong>of</strong> the method is done by determination <strong>of</strong> the absorption coefficient <strong>of</strong> an optical phantom, consisting<br />
<strong>of</strong> a known concentration <strong>of</strong> polystyrene spheres in water. Finally, the absorption spectrum <strong>of</strong> butter is shown,<br />
representing a possible application <strong>of</strong> the method. Even though only the total reflectance is regarded here, it<br />
is important to remember, that the knowledge <strong>of</strong> µ ′ s(λ) is needed for proper evaluation <strong>of</strong> µ a . (Since there is<br />
already a publication for the VIS, 1 spectra are only shown in the <strong>NIR</strong>.)<br />
2. Total reflectance<br />
shutter<br />
aperture<br />
0.07<br />
0.06<br />
0.05<br />
f lens<br />
θ light<br />
source<br />
ρ<br />
d spot sample /<br />
reflectance<br />
standard<br />
<strong>NIR</strong><br />
VIS<br />
<strong>remission</strong> / a.u.<br />
0.04<br />
0.03<br />
0.02<br />
a)<br />
PC<br />
scattering disks<br />
h<br />
0<br />
b)<br />
0.01<br />
0<br />
10<br />
2,5<br />
1<br />
0,4<br />
µ s<br />
/ mm −1<br />
0,1<br />
10 −1 10 1 10 3 10 5<br />
µ s<br />
/ µ a<br />
Figure 1. a) The setup to measure the total reflectance with two spectrometers. b) Remission values R for<br />
the grid <strong>of</strong> reduced scattering coefficients µ ′ s and different fractions <strong>of</strong> µ ′ s/µ a are stored in the lookup table.<br />
In order to measure the total reflectance <strong>of</strong> a sample (see Figure 1a), the end <strong>of</strong> a liquid light guide (Ø= 5 mm),<br />
transferring the broadband light <strong>of</strong> a halogen bulb, is imaged by a lens onto the surface <strong>of</strong> the sample. Because<br />
<strong>of</strong> the magnification, the diameter <strong>of</strong> the spot is d = 16 mm. One part <strong>of</strong> the light is remitted by the sample<br />
and falls on one <strong>of</strong> the scattering disks and is then transferred to a spectrometer. Since the ratio <strong>of</strong> remitted
light to incident light is needed, also a reflectance standard is measured.<br />
There is no explicit function µ a = µ a (R, µ ′ s), so the implicit one R = R(µ a , µ ′ s) has to be inverted. This so-called<br />
inverse problem is solved by means <strong>of</strong> the following procedure: In the first step one has to calculate R(µ a , µ ′ s)<br />
for pairs <strong>of</strong> (µ ′ s, µ a ). The distance in the optical parameter space should be small, so linear interpolation can<br />
be applied (see Figure 1b). The second step is the interpolation <strong>of</strong> R(µ a , µ ′ s) for the given reduced scattering<br />
coefficient µ ′ s. The result is a monotonically increasing curve R µ ′ s<br />
(µ a ), therefore, it can be inverted numerically.<br />
In the last step, the absorption coefficient µ a is given by interpolation <strong>of</strong> the inverted curve µ a (R µ ′ s<br />
) at the<br />
measured <strong>remission</strong> R.<br />
The calculation <strong>of</strong> R(µ a , µ ′ s) for the pairs <strong>of</strong> (µ ′ s, µ a ) is done by means <strong>of</strong> the radiative transfer equation, which is<br />
solved numerically by Monte Carlo simulations taking into account the geometry <strong>of</strong> the detection. The Henyey-<br />
Greenstein phase function with the anisotropy factor g = 0.7 was assumed. Since some <strong>of</strong> the parameters are<br />
not known exactly, the influence <strong>of</strong> their deviation was evaluated for the phase function p(θ), the anisotropy<br />
factor g, the refractive index n and the z-position <strong>of</strong> the surface <strong>of</strong> the sample. The error in the determination<br />
<strong>of</strong> µ a caused by a deviation in the assumption <strong>of</strong> the optical parameters can be limited to 10% for relevant cases<br />
except for the z-position. For small absorption (e.g. µ a = 10 −3 mm −1 ) the error in µ a is higher than 50% for<br />
the sample being 1 mm away from the assumed value z = 0. Thus, one has to adjust the sample with great<br />
care to minimize this error.<br />
3. Results<br />
polystyrene phantom<br />
water [Kou]<br />
butter (Landliebe)<br />
fitted curve<br />
water [Kou]<br />
fat<br />
µ a<br />
/ mm −1<br />
10 0 wavelength / nm<br />
10 −1<br />
µ a<br />
/ mm −1<br />
10 0 wavelength / nm<br />
10 −1<br />
10 −2<br />
10 −2<br />
a)<br />
900 1000 1100 1200 1300 1400 1500 1600 1700<br />
b)<br />
10 −3<br />
900 1000 1100 1200 1300 1400 1500 1600 1700<br />
Figure 2. a) Measured absorption spectrum <strong>of</strong> the optical phantom compared to the absorption <strong>of</strong> water. b)<br />
Measured absorption spectrum <strong>of</strong> butter and fitted absorption curve <strong>of</strong> water and fat (see text).<br />
a) Polystyrene<br />
For verification <strong>of</strong> the method, a phantom <strong>of</strong> polystyrene microspheres (c W = 1.93%) in water was prepared<br />
having 1.65 mm −1 ≤ µ ′ s ≤ 1.95 mm −1 in the shown range <strong>of</strong> wavelengths. The measured absorption spectrum<br />
as well as the absorption <strong>of</strong> water measured by Kou et al. 3 using collimated transmission can be found in Figure<br />
2a. Both curves show good agreement. However, systematic deviations seem to occur at wavelengths around<br />
λ = 1080 nm and above λ = 1450 nm. A small sample container (compared to the penetration depth at the<br />
considered wavelengths) could be the reason for the former. The reason for the latter could not be clarified.<br />
The absorption <strong>of</strong> polystyrene is not relevant in this wavelength range.<br />
b) Butter<br />
With respect to practical applications, it is desirable to determine the concentration <strong>of</strong> water and fat in butter<br />
without calibration measurements. To do so, the absorption spectra <strong>of</strong> water and fat are needed. While the first<br />
can be found in literature, 4,3 the latter had to be determined on our own by using total and spatially resolved<br />
reflectance. Fat absorption was assumed to be the mean <strong>of</strong> the measurements <strong>of</strong> three different commercial sorts
<strong>of</strong> fat. Assuming the measured absorption <strong>of</strong> butter to be the sum <strong>of</strong> the weighted absorption by the volume<br />
concentration c fat and c water , both parameters can be obtained by a fit.<br />
The sample was prepared as follows: The package <strong>of</strong> a commercial butter (”mildgesäuerte Butter”, Landliebe)<br />
was unwrapped. In order to clear the influence <strong>of</strong> longterm contact with air, the upper layer was removed.<br />
After that, the new surface was flatted, so it meets the requirements for measurements <strong>of</strong> the total and spatially<br />
resolved reflectance.<br />
The measurement <strong>of</strong> butter is presented in Figure 2b together with the fitted curve for c fat = 89% and c water =<br />
11%. For comparison, the applied absorption spectra <strong>of</strong> water and fat can be found in grey.<br />
Both the measured and the fitted curve show good agreement with a systematic deviation above λ = 1450 nm<br />
which is comparable to the systematic deviation <strong>of</strong> the phantom (see above). Furthermore, the approach <strong>of</strong><br />
equalizing different sorts <strong>of</strong> fat is a first step and not very accurate.<br />
The manufacturer lists the mass concentration <strong>of</strong> fat as 82%, which is a relative deviation <strong>of</strong> about 7% compared<br />
to the determined value <strong>of</strong> 88%.<br />
4. Conclusion<br />
We presented a method for determination <strong>of</strong> the absorption spectra, using the reduced scattering coefficient,<br />
which was obtained by spatially resolved reflectance. Light propagation is described by the radiative transfer<br />
equation, taking into account the illumination and detection geometry. Comparing measured absorption spectra<br />
<strong>of</strong> an optical phantom based on water with literature values, we found good agreement. Furthermore we<br />
presented a measurement <strong>of</strong> butter to determine the concentration <strong>of</strong> fat and water without calibration. Not<br />
shown are measurements in the VIS where less absorption can be found in most cases. Absorption in the<br />
range <strong>of</strong> 10 −3 mm −1 ≤ µ a ≤ 10 mm −1 can be measured, while this range is valid for µ ′ s = 1 mm −1 and scales<br />
approximately proportional to µ ′ s.<br />
REFERENCES<br />
1. F. Foschum and A. Kienle, “Broadband absorption <strong>spectroscopy</strong> <strong>of</strong> <strong>turbid</strong> <strong>media</strong> using a dual step steadystate<br />
method,” Journal <strong>of</strong> Biomedical Optics 17(3), pp. 037009–1, 2012.<br />
2. F. Foschum, M. Jäger, and A. Kienle, “Fully automated spatially resolved reflectance spectrometer for the<br />
determination <strong>of</strong> the absorption and scattering in <strong>turbid</strong> <strong>media</strong>,” Review <strong>of</strong> Scientific Instruments 82(10),<br />
pp. 103104–103104, 2011.<br />
3. L. Kou, D. Labrie, and P. Chylek, “Refractive indices <strong>of</strong> water and ice in the 0.65-to 2.5-µm spectral range,”<br />
Applied Optics 32(19), pp. 3531–3540, 1993.<br />
4. R. Pope, E. Fry, et al., “Absorption spectrum (380-700 nm) <strong>of</strong> pure water. II. Integrating cavity measurements,”<br />
Applied Optics 36(33), pp. 8710–8723, 1997.