Detection of Extra Virgin Olive Oil Adulteration with - Department of ...
Detection of Extra Virgin Olive Oil Adulteration with - Department of ...
Detection of Extra Virgin Olive Oil Adulteration with - Department of ...

You also want an ePaper? Increase the reach of your titles
YUMPU automatically turns print PDFs into web optimized ePapers that Google loves.
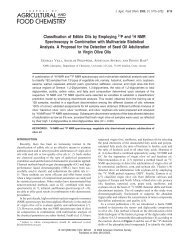
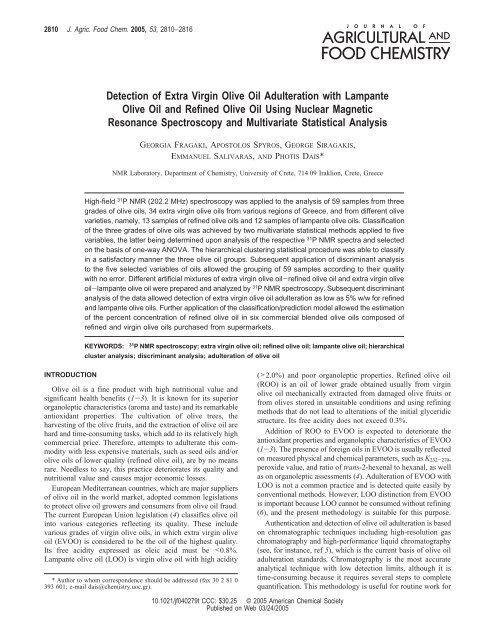
2810 J. Agric. Food Chem. 2005, 53, 2810−2816<br />
<strong>Detection</strong> <strong>of</strong> <strong>Extra</strong> <strong>Virgin</strong> <strong>Olive</strong> <strong>Oil</strong> <strong>Adulteration</strong> <strong>with</strong> Lampante<br />
<strong>Olive</strong> <strong>Oil</strong> and Refined <strong>Olive</strong> <strong>Oil</strong> Using Nuclear Magnetic<br />
Resonance Spectroscopy and Multivariate Statistical Analysis<br />
GEORGIA FRAGAKI, APOSTOLOS SPYROS, GEORGE SIRAGAKIS,<br />
EMMANUEL SALIVARAS, AND PHOTIS DAIS*<br />
NMR Laboratory, <strong>Department</strong> <strong>of</strong> Chemistry, University <strong>of</strong> Crete, 714 09 Iraklion, Crete, Greece<br />
High-field 31 P NMR (202.2 MHz) spectroscopy was applied to the analysis <strong>of</strong> 59 samples from three<br />
grades <strong>of</strong> olive oils, 34 extra virgin olive oils from various regions <strong>of</strong> Greece, and from different olive<br />
varieties, namely, 13 samples <strong>of</strong> refined olive oils and 12 samples <strong>of</strong> lampante olive oils. Classification<br />
<strong>of</strong> the three grades <strong>of</strong> olive oils was achieved by two multivariate statistical methods applied to five<br />
variables, the latter being determined upon analysis <strong>of</strong> the respective 31 P NMR spectra and selected<br />
on the basis <strong>of</strong> one-way ANOVA. The hierarchical clustering statistical procedure was able to classify<br />
in a satisfactory manner the three olive oil groups. Subsequent application <strong>of</strong> discriminant analysis<br />
to the five selected variables <strong>of</strong> oils allowed the grouping <strong>of</strong> 59 samples according to their quality<br />
<strong>with</strong> no error. Different artificial mixtures <strong>of</strong> extra virgin olive oil-refined olive oil and extra virgin olive<br />
oil-lampante olive oil were prepared and analyzed by 31 P NMR spectroscopy. Subsequent discriminant<br />
analysis <strong>of</strong> the data allowed detection <strong>of</strong> extra virgin olive oil adulteration as low as 5% w/w for refined<br />
and lampante olive oils. Further application <strong>of</strong> the classification/prediction model allowed the estimation<br />
<strong>of</strong> the percent concentration <strong>of</strong> refined olive oil in six commercial blended olive oils composed <strong>of</strong><br />
refined and virgin olive oils purchased from supermarkets.<br />
KEYWORDS:<br />
31 P NMR spectroscopy; extra virgin olive oil; refined olive oil; lampante olive oil; hierarchical<br />
cluster analysis; discriminant analysis; adulteration <strong>of</strong> olive oil<br />
INTRODUCTION<br />
<strong>Olive</strong> oil is a fine product <strong>with</strong> high nutritional value and<br />
significant health benefits (1-3). It is known for its superior<br />
organoleptic characteristics (aroma and taste) and its remarkable<br />
antioxidant properties. The cultivation <strong>of</strong> olive trees, the<br />
harvesting <strong>of</strong> the olive fruits, and the extraction <strong>of</strong> olive oil are<br />
hard and time-consuming tasks, which add to its relatively high<br />
commercial price. Therefore, attempts to adulterate this commodity<br />
<strong>with</strong> less expensive materials, such as seed oils and/or<br />
olive oils <strong>of</strong> lower quality (refined olive oil), are by no means<br />
rare. Needless to say, this practice deteriorates its quality and<br />
nutritional value and causes major economic losses.<br />
European Mediterranean countries, which are major suppliers<br />
<strong>of</strong> olive oil in the world market, adopted common legislations<br />
to protect olive oil growers and consumers from olive oil fraud.<br />
The current European Union legislation (4) classifies olive oil<br />
into various categories reflecting its quality. These include<br />
various grades <strong>of</strong> virgin olive oils, in which extra virgin olive<br />
oil (EVOO) is considered to be the oil <strong>of</strong> the highest quality.<br />
Its free acidity expressed as oleic acid must be 2.0%) and poor organoleptic properties. Refined olive oil<br />
(ROO) is an oil <strong>of</strong> lower grade obtained usually from virgin<br />
olive oil mechanically extracted from damaged olive fruits or<br />
from olives stored in unsuitable conditions and using refining<br />
methods that do not lead to alterations <strong>of</strong> the initial glyceridic<br />
structure. Its free acidity does not exceed 0.3%.<br />
Addition <strong>of</strong> ROO to EVOO is expected to deteriorate the<br />
antioxidant properties and organoleptic characteristics <strong>of</strong> EVOO<br />
(1-3). The presence <strong>of</strong> foreign oils in EVOO is usually reflected<br />
on measured physical and chemical parameters, such as K 232-270 ,<br />
peroxide value, and ratio <strong>of</strong> trans-2-hexenal to hexanal, as well<br />
as on organoleptic assessments (4). <strong>Adulteration</strong> <strong>of</strong> EVOO <strong>with</strong><br />
LOO is not a common practice and is detected quite easily by<br />
conventional methods. However, LOO distinction from EVOO<br />
is important because LOO cannot be consumed <strong>with</strong>out refining<br />
(6), and the present methodology is suitable for this purpose.<br />
Authentication and detection <strong>of</strong> olive oil adulteration is based<br />
on chromatographic techniques including high-resolution gas<br />
chromatography and high-performance liquid chromatography<br />
(see, for instance, ref 5), which is the current basis <strong>of</strong> olive oil<br />
adulteration standards. Chromatography is the most accurate<br />
analytical technique <strong>with</strong> low detection limits, although it is<br />
time-consuming because it requires several steps to complete<br />
quantification. This methodology is useful for routine work for<br />
10.1021/jf040279t CCC: $30.25 © 2005 American Chemical Society<br />
Published on Web 03/24/2005
<strong>Detection</strong> <strong>of</strong> <strong>Extra</strong> <strong>Virgin</strong> <strong>Olive</strong> <strong>Oil</strong> <strong>Adulteration</strong> J. Agric. Food Chem., Vol. 53, No. 8, 2005 2811<br />
an assessment <strong>of</strong> the olive oil quality according to EU<br />
regulations (ECN 42, spectroscopic constants K 232-270 , triglycerides,<br />
peroxide value, etc.).<br />
In the past decade, there has been an increasing interest in<br />
the classification <strong>of</strong> edible oils including olive oil as an<br />
alternative means to examine authentication and to detect<br />
possible adulteration <strong>of</strong> extra virgin olive oils <strong>with</strong> seed oils<br />
and/or olive oils <strong>of</strong> lower grade. Classification <strong>of</strong> various grades<br />
<strong>of</strong> olive oil has been carried out in several instances by using<br />
a variety <strong>of</strong> analytical techniques and chemometric procedures.<br />
Among these are classical methods based on gas chromatography<br />
and high-performance liquid chromatography (7, 8), mass<br />
spectrometry (9), isotope mass ratio analysis (10), metal oxide<br />
sensors (6), vibrational spectroscopy (11-16), and nuclear<br />
magnetic resonance (NMR) spectroscopy (17-20).<br />
In a recent publication (21) we proposed a methodology based<br />
on NMR spectroscopy in combination <strong>with</strong> multivariate statistical<br />
analysis to classify 13 types <strong>of</strong> edible oils and to detect virgin<br />
olive oil adulteration <strong>with</strong> corn, soybean, sunflower, and<br />
hazelnut oils. In particular, 31 P NMR spectroscopy was used to<br />
determine in a single experiment 1,2-diacylglycerols (1,2-DGs),<br />
1,3-diacylglycerols (1,3-DGs), total diacylglycerols (TDGs), the<br />
ratio D <strong>of</strong> 1,2-DGs over TDGs, total free sterols, and free acidity.<br />
This method (21) is based on the derivatization <strong>of</strong> the labile<br />
hydrogens <strong>of</strong> hydroxyl and carboxyl groups <strong>with</strong> 2-chloro-<br />
4,4,5,5-tetramethyl dioxaphospholane (1) and the use <strong>of</strong> the 31 P<br />
chemical shifts <strong>of</strong> the phosphitylated compounds to identify the<br />
labile centers. The phosphorus reagent reacts rapidly and<br />
quantitatively under mild conditions <strong>with</strong> the hydroxyl and<br />
carboxyl groups (21). The same procedure will be used in the<br />
present study to discriminate among three different grades <strong>of</strong><br />
olive oil, namely, EVOO, ROO, and LOO, and to detect EVOO<br />
adulteration <strong>with</strong> these oils.<br />
MATERIALS AND METHODS<br />
Samples and Reagents. Thirty-four EVOO harvested between<br />
2001and 2003 were provided by local cooperatives. Twenty-one olive<br />
oils were sampled in Crete (Peza, Kolymbari, Heraklion, Sitia), 3 oils<br />
in Messinia, and 1 in Ilia. They were extracted from the olive variety<br />
Koroneiki, whereas the oils from Lakonia (6 oils), Lesvos (1 oil), and<br />
Pilion (2 oils) were extracted from the varieties Athinolia, Kolovi, and<br />
a local variety, respectively. The samples were extracted by centrifugation<br />
<strong>with</strong>in 48 h after harvesting and stored immediately in brown<br />
screw-capped bottles at -20 °C prior to spectrum acquisition and were<br />
coded as extra virgin olive oils according to the <strong>of</strong>ficial limits (4). A<br />
total <strong>of</strong> 25 samples <strong>of</strong> olive oil <strong>of</strong> lower quality were kindly supplied<br />
by the olive oil company Minerva (Athens, Greece): 12 samples <strong>of</strong><br />
LOO and 13 samples <strong>of</strong> ROO. Refined olive oils were deodorized in<br />
the final step <strong>of</strong> the refining process. Finally, six commercial samples<br />
<strong>of</strong> blended olive oil composed <strong>of</strong> refined olive oil and virgin olive oil<br />
(BOO) were purchased from local supermarkets.<br />
The 31 P NMR method was applied to detect olive oil adulteration.<br />
Fresh EVOO samples were mixed <strong>with</strong> LOO and ROO samples. Two<br />
set <strong>of</strong> mixtures <strong>of</strong> 1, 3, 5, 10, 15, 20, 35, 50, 65, and 80% (w/w) and<br />
1, 3, 5, 10, 15, 20, 35, and 50% for ROO adulterant in EVOO and one<br />
set <strong>of</strong> 1, 3, 5, 10, 15, and 20% (w/w) <strong>of</strong> LOO in EVOO were prepared.<br />
EVOO samples <strong>of</strong> different geographical and botanical origins and<br />
different ROO samples were used for the preparation <strong>of</strong> the various<br />
mixtures. Finally, three EVOO samples <strong>of</strong> different geographical and<br />
botanical origins (1 from Pilion, 1 from Sitia, and 1 from Lesvos), not<br />
included in the 34 EVOO samples used for the present analysis, were<br />
adulterated <strong>with</strong> different ROO samples at concentrations <strong>of</strong> 60, 65,<br />
70, 75, and 80% (w/w). These mixtures were analyzed by 31 P NMR<br />
spectroscopy and used as blank tests to estimate the composition <strong>of</strong><br />
BOO samples. All olive oil samples and their mixtures were analyzed<br />
twice.<br />
Pinacol, triethylamine, phosphorus trichloride, protonated solvents<br />
(reagent or analytical grade), and deuterated solvents used in the present<br />
study were purchased from Sigma-Aldrich (Athens, Greece). The<br />
derivatizing phosphorus reagent 2-chloro-4,4,5,5-tetramethyldioxaphospholane<br />
(1) was synthesized from pinacol and phosphorus trichloride<br />
following the method described in the literature (23). However, to<br />
increase the yield <strong>of</strong> the reaction, we utilized hexane solvent instead<br />
<strong>of</strong> benzene and pyridine instead <strong>of</strong> triethylamine as suggested in the<br />
original method. This modification resulted in ∼45% yield <strong>of</strong> the<br />
product against 19% obtained <strong>with</strong> the original method.<br />
Sample Preparation for 31 P NMR Spectral Analysis. A stock<br />
solution was prepared by dissolving 0.6 mg <strong>of</strong> chromium acetylacetonate,<br />
Cr(acac) 3 (0.165 µM), and 13.5 mg <strong>of</strong> cyclohexanol (13.47 mM)<br />
in 10 mL <strong>of</strong> a mixture <strong>of</strong> pyridine and CDCl 3 solvents (1.6:1.0 volume<br />
ratio) and protected from moisture <strong>with</strong> 5A molecular sieves. Cyclohexanol<br />
was used as an internal standard for quantification purposes.<br />
<strong>Olive</strong> oil (100-150 mg) was placed ina5mmNMRtube. The required<br />
volumes <strong>of</strong> the stock solution (0.4 mL) and the reagent 1 (15 µL) were<br />
added. The reaction mixture was left to react for ∼15 min at room<br />
temperature. Upon completion <strong>of</strong> the reaction, the solution was used<br />
to obtain the 31 P NMR spectra.<br />
13<br />
P NMR Experiments. 13 P NMR experiments were conducted on<br />
a Bruker AMX500 spectrometer operating at 202.2 MHz for the<br />
phosphorus-31 nucleus at 30 ( 1 °C. The spectra were recorded by<br />
employing the inverse gated decoupling technique in order to suppress<br />
NOE. Typical spectral parameters for quantitative studies were as<br />
follows: 90° pulse width ) 12.5 µs, sweep width ) 10 kHz, relaxation<br />
delay ) 30 s, memory size ) 16K (zero-filled to 32K). Line broadening<br />
<strong>of</strong> 1 Hz was applied, and drift correction was performed prior to Fourier<br />
transform. Polynomial fourth-order baseline correction was performed<br />
before integration. For each spectrum 32 transients were accumulated.<br />
All 31 P chemical shifts are relative to the product <strong>of</strong> the reaction <strong>of</strong> 1<br />
<strong>with</strong> water (moisture contained in all samples), which gives a sharp<br />
signal in pyridine/CDCl 3 at δ 132.20. It should be noted that the<br />
presence <strong>of</strong> the paramagnetic metal center <strong>of</strong> Cr(acac) 3 in the samples<br />
lowers the relaxation times <strong>of</strong> the phosphorus nuclei, shortening thus<br />
the duration <strong>of</strong> the measurements significantly. The relaxation delay<br />
in the 90° pulse sequence is based on the 31 P spin-lattice relaxation<br />
time <strong>of</strong> 4.9 s measured for the internal standard. Lower values were<br />
measured for other model compounds (3.5 s for stearic acid and 2.3 s<br />
for 1,2-diolein). Therefore, the relaxation delay (5 times the longest<br />
relaxation time) is suitable for quantitative analysis. The applicability<br />
<strong>of</strong> this method to quantitative analysis, as well as its reproducibility<br />
and repeatability, has been tested thoroughly in previous studies (20,<br />
21).<br />
Statistical Analysis. One-way ANOVA was used to find the<br />
variables <strong>with</strong> the highest discriminatory power. The results <strong>of</strong> this<br />
analysis are reported as the Fisher F ratios and p level. The F ratio<br />
<strong>with</strong> the degrees <strong>of</strong> freedom tests whether the between and <strong>with</strong>in<br />
variances are significantly different. The p level represents a decreasing<br />
index <strong>of</strong> reliability <strong>of</strong> a result and gives the probability <strong>of</strong> error involved<br />
in accepting a result as valid. The results reported below show that the<br />
selected variables were significantly different for the three grades <strong>of</strong><br />
olive oil. The unsupervised statistical method <strong>of</strong> hierarchical cluster<br />
analysis (HCA) was applied to explore similarity (or dissimilarity)<br />
among the various olive oil samples, whereas the supervised method<br />
discriminant analysis (DA) classified olive oils according to different<br />
grades and detected adulteration. Discriminant function analysis is used<br />
to determine which variables (e.g., compositional parameters <strong>of</strong> olive<br />
oil samples) discriminate between two or more naturally occurring<br />
groups (e.g., olive oil grades). The DA method applied to a matrix <strong>of</strong><br />
5 independent variables and 59 olive oil samples provided good results<br />
(see below) while being very straightforward in calculation and<br />
interpretation. Visualization <strong>of</strong> the oil classification is achieved by<br />
plotting the individual scores for two principal discriminant functions,<br />
whereas for the detection <strong>of</strong> EVOO adulteration the discriminant<br />
functions obtained from the DA model and the Mahalanobis distances<br />
were used. The statistical package Statistica for Windows 5.1B (StatS<strong>of</strong>t<br />
Inc.) was used.<br />
RESULTS AND DISCUSSION<br />
Data Analysis. Results are summarized in Tables 1-3. Table<br />
1 contains the percentage content <strong>of</strong> five chemical components
2812 J. Agric. Food Chem., Vol. 53, No. 8, 2005 Fragaki et al.<br />
Table 1. Compositional Parameters, Means, and Standard Deviations<br />
<strong>of</strong> <strong>Extra</strong> <strong>Virgin</strong> <strong>Olive</strong> <strong>Oil</strong>s from Various Regions <strong>of</strong> Greece and <strong>of</strong><br />
Commercial Blended <strong>Olive</strong> <strong>Oil</strong>s Determined by 31 P NMR Spectroscopy<br />
sample area 1,2-DGs 1,3-DGs TDGs D sterols acidity<br />
EVOO a<br />
1 Sitia 2.15 0.17 2.32 0.93 0.140 0.33<br />
2 Sitia 1.58 0.09 1.67 0.95 0.148 0.21<br />
3 Sitia 1.88 0.15 2.03 0.93 0.093 0.24<br />
4 Sitia 2.05 0.17 2.22 0.92 0.115 0.35<br />
5 Sitia 2.04 0.13 2.17 0.94 0.126 0.33<br />
6 Sitia 1.74 0.15 1.89 0.92 0.089 0.20<br />
7 Sitia 1.86 0.12 1.98 0.94 0.121 0.25<br />
8 Heraklion 2.49 0.16 2.65 0.94 0.155 0.40<br />
9 Heraklion 1.57 0.15 1.72 0.92 0.091 0.23<br />
10 Heraklion 2.08 0.16 2.24 0.93 0.143 0.24<br />
11 Heraklion 1.70 0.13 1.83 0.93 0.128 0.21<br />
12 Heraklion 1.90 0.14 2.04 0.93 0.149 0.24<br />
13 Heraklion 1.58 0.12 1.70 0.93 0.118 0.38<br />
14 Kolymbari 1.76 0.18 1.94 0.91 0.093 0.39<br />
15 Kolymbari 2.30 0.23 2.53 0.91 0.141 0.30<br />
16 Kolymbari 1.69 0.14 1.83 0.92 0.106 0.26<br />
17 Peza 1.72 0.14 1.86 0.93 0.112 0.32<br />
18 Peza 2.22 0.19 2.41 0.92 0.167 0.41<br />
19 Peza 1.39 0.11 1.50 0.93 0.103 0.18<br />
20 Peza 1.49 0.11 1.60 0.93 0.124 0.18<br />
21 Peza 1.90 0.12 2.02 0.94 0.160 0.22<br />
22 Lakonia 1.94 0.20 2.14 0.91 0.098 0.21<br />
23 Lakonia 2.05 0.13 2.18 0.94 0.071 0.24<br />
24 Lakonia 1.79 0.12 1.91 0.94 0.081 0.16<br />
25 Lakonia 2.08 0.17 2.25 0.93 0.113 0.20<br />
26 Lakonia 2.06 0.16 2.22 0.93 0.077 0.22<br />
27 Lakonia 2.15 0.14 2.29 0.94 0.101 0.21<br />
28 Messinia 1.74 0.12 1.86 0.94 0.094 0.22<br />
29 Messinia 1.77 0.18 1.95 0.91 0.080 0.20<br />
30 Messinia 1.56 0.18 1.74 0.90 0.099 0.24<br />
31 Pilion 2.29 0.17 2.46 0.93 0.099 0.63<br />
32 Pilion 2.10 0.15 2.25 0.93 0.076 0.46<br />
33 Lesvos 1.77 0.16 1.93 0.92 0.104 0.42<br />
34 Ilia 2.37 0.08 2.45 0.97 0.154 0.20<br />
av 1.90 0.15 2.05 0.93 0.114 0.28<br />
SD 0.27 0.03 0.28 0.01 0.027 0.10<br />
35 b Pilion 2.02 0.14 2.16 0.94 0.08 0.46<br />
36 b Lesvos 1.97 0.23 2.20 0.90 0.10 0.77<br />
37 b Sitia 2.15 0.17 2.32 0.93 0.14 0.32<br />
BOO c<br />
1 1.71 1.72 3.43 0.50 0.07 0.53<br />
2 1.41 3.28 4.69 0.30 0.07 0.68<br />
3 1.20 1.88 3.08 0.39 0.06 0.56<br />
4 1.63 3.08 4.71 0.35 0.05 0.22<br />
5 0.92 0.84 1.76 0.52 0.07 0.19<br />
6 1.43 2.24 3.67 0.39 0.06 0.30<br />
a EVOO, extra virgin olive oils. b EVOO samples 35−37 were used for the<br />
preparation <strong>of</strong> blank tests (see text). c BOO, blended olive oils composed <strong>of</strong> refined<br />
olive oils and virgin olive oils.<br />
Table 2. Compositional Parameters, Means, and Standard Deviations<br />
<strong>of</strong> Lampante and Refined <strong>Olive</strong> <strong>Oil</strong>s Determined by 31 P NMR<br />
Spectroscopy<br />
sample 1,2-DGs 1,3-DGs TDGs D sterols acidity<br />
LOO a<br />
1 1.35 2.85 4.20 0.32 0.104 2.81<br />
2 1.85 3.08 4.93 0.38 0.099 6.45<br />
3 1.67 4.14 5.81 0.29 0.080 7.33<br />
4 2.08 2.55 4.63 0.45 0.107 5.10<br />
5 2.10 3.19 5.29 0.40 0.107 8.73<br />
6 1.29 1.92 3.21 0.40 0.168 2.96<br />
7 2.23 5.38 7.61 0.29 0.090 7.55<br />
8 2.38 4.64 7.02 0.34 0.08 10.17<br />
9 1.77 4.31 6.08 0.29 0.07 7.78<br />
10 1.00 2.23 3.23 0.31 0.100 1.88<br />
11 0.73 1.84 2.56 0.28 0.08 2.29<br />
12 2.41 5.80 8.21 0.29 0.07 10.86<br />
av 1.74 3.49 5.18 0.34 0.096 6.16<br />
SD 0.55 1.34 1.79 0.05 0.027 3.11<br />
ROO b<br />
1 1.47 2.95 4.42 0.33 0.066 0.03<br />
2 1.68 3.16 4.84 0.35 0.047 0.00<br />
3 1.55 3.33 4.88 0.32 0.099 0.07<br />
4 1.61 2.83 4.44 0.36 0.063 0.04<br />
5 1.85 3.52 5.37 0.35 0.048 0.02<br />
6 2.14 3.71 5.85 0.37 0.108 0.02<br />
7 2.10 3.71 5.81 0.36 0.086 0.00<br />
8 1.39 2.63 4.02 0.35 0.096 0.00<br />
9 1.60 3.89 5.49 0.29 0.077 0.03<br />
10 1.53 3.50 5.03 0.31 0.067 0.06<br />
11 0.97 2.31 3.28 0.30 0.00 0.015<br />
12 1.49 3.58 5.07 0.29 0.066 0.03<br />
13 0.99 2.23 3.22 0.31 0.066 0.04<br />
av 1.57 3.18 4.75 0.33 0.068 0.03<br />
SD 0.35 0.55 0.85 0.03 0.028 0.02<br />
a LOO, lampante virgin olive oils. a ROO, refined virgin olive oils.<br />
and the ratio D (1,2-DGs/TDG) for the various samples <strong>of</strong><br />
EVOO and BOO, whereas Tables 2 and 3 depict the same<br />
parameters for LOO, ROO, and their mixtures <strong>with</strong> EVOO,<br />
respectively. Spectral assignments and methods <strong>of</strong> quantification<br />
<strong>of</strong> the NMR data have been reported in detail in previous<br />
publications (20, 21). The mean values in Tables 1 and 2 show<br />
that there are discernible differences in 1,3-DGs, TDGs, the ratio<br />
D (1,2-DGs/TDGs), and free acidity. These parameters appear<br />
to differentiate the olive oil samples. In particular, EVOO are<br />
characterized by high values <strong>of</strong> the ratio D and low values <strong>of</strong><br />
TDGs and free acidity relative to the same parameters <strong>of</strong> the<br />
other oils. It is known that the natural content <strong>of</strong> TDGs in EVOO<br />
does not exceed 1-3% depending on the olive fruit ripeness<br />
and olive fruit variety (20, 24-26), whereas the level <strong>of</strong> TDGs<br />
(mainly 1,3-DGs) is higher (4-5%) in ROO (27). Moreover,<br />
in EVOO samples, 1,3-DGs are much lower than the corresponding<br />
values in the ROO samples. This is due to the fact<br />
that the isomerization <strong>of</strong> 1,2-DGs to 1,3-DGs that usually occurs<br />
during prolonged olive oil storage is very rapid upon olive oil<br />
refinement (24, 28). The LOO samples have characteristics<br />
similar to those <strong>of</strong> ROO except free acidity. The discrimination<br />
<strong>of</strong> EVOO <strong>with</strong> respect to the other oils can be seen graphically<br />
in Figure 1, where the ratio D is plotted against the difference<br />
<strong>of</strong> TDGs minus free acidity (TDG-FFA, where FFA stands<br />
for free fatty acids). It is seen clearly that the EVOO samples<br />
are clustered in the upper part <strong>of</strong> the graph, whereas LOO and<br />
ROO are dispersed in the lower part <strong>of</strong> the graph. What is most<br />
interesting in this graph is the observation that adulterated<br />
EVOO samples (solid symbols) <strong>with</strong> LOO and ROO lie between<br />
the group <strong>of</strong> EVOO and the respective group <strong>of</strong> the lower quality<br />
olive oils, depending on the amount <strong>of</strong> the latter oils in the<br />
mixtures. This finding may suggest an alternative method to<br />
detect EVOO adulteration <strong>with</strong> LOO and ROO, although this<br />
observation needs further exploration on an experimental and<br />
theoretical basis. At any rate, it appears that the parameter<br />
TDG-FFA is able to discriminate EVOO from the other oils.<br />
When free acidity was plotted against 1,3-DGs for all oil<br />
samples, a good linear correlation (r ) 0.95) was obtained,<br />
indicating that the concentration <strong>of</strong> free fatty acids increases<br />
<strong>with</strong> increasing concentration <strong>of</strong> 1,3-DGs. This pattern, which<br />
has been observed previously (26), can be explained as<br />
follows: hydrolysis <strong>of</strong> triglycerides results in 1,2- (and/or 2,3-)<br />
DGs and 1,3-DGs in a concentration ratio <strong>of</strong> 2:1 and free fatty<br />
acids, followed by isomerization <strong>of</strong> 1,2-DGs to 1,3-DGs. The<br />
isomerization reaction proceeds more rapidly than hydrolysis<br />
(28), and the consumption <strong>of</strong> 1,2-DGs shifts the equilibrium <strong>of</strong>
<strong>Detection</strong> <strong>of</strong> <strong>Extra</strong> <strong>Virgin</strong> <strong>Olive</strong> <strong>Oil</strong> <strong>Adulteration</strong> J. Agric. Food Chem., Vol. 53, No. 8, 2005 2813<br />
Figure 1. Plot <strong>of</strong> the D ratio against the difference TDGs−FFA for 59 samples <strong>of</strong> extra virgin olive oils (EVOO), refined olive oils (ROO), and lampante<br />
olive oils (LOO) (open symbols) and for the EVOO mixtures <strong>with</strong> the lower quality olive oils (solid symbols). Ellipses were drawn as an aid to the eye.<br />
Table 3. Compositional Parameters <strong>of</strong> Mixtures <strong>of</strong> <strong>Extra</strong> <strong>Virgin</strong> <strong>Olive</strong><br />
<strong>Oil</strong>s <strong>with</strong> Refined and Lampante <strong>Olive</strong> <strong>Oil</strong>s Determined by 31 P NMR<br />
Spectroscopy<br />
mixture<br />
concn<br />
(%, w/w) 1,2-DGs 1,3-DGs TDGs D sterols acidity<br />
EVOO−ROO (1) a 1 1.85 0.16 2.01 0.92 0.100 0.21<br />
3 1.81 0.23 2.04 0.89 0.100 0.18<br />
5 1.76 0.31 2.07 0.85 0.095 0.16<br />
10 1.61 0.54 2.15 0.75 0.090 0.15<br />
15 1.57 0.68 2.25 0.70 0.095 0.15<br />
20 1.54 0.75 2.29 0.67 0.090 0.14<br />
35 1.52 1.36 2.88 0.53 0.078 0.11<br />
50 1.49 1.67 3.16 0.47 0.075 0.10<br />
EVOO−ROO (2) b 1 1.79 0.17 1.96 0.91 0.057 0.15<br />
3 1.72 0.19 1.91 0.90 0.078 0.14<br />
5 1.79 0.28 2.07 0.86 0.072 0.13<br />
10 1.77 0.43 2.20 0.80 0.082 0.13<br />
15 1.73 0.54 2.27 0.76 0.081 0.12<br />
20 1.69 0.67 2.36 0.72 0.073 0.11<br />
35 1.65 1.07 2.72 0.61 0.075 0.10<br />
50 1.62 1.51 3.13 0.52 0.083 0.07<br />
65 1.37 1.75 3.12 0.44 0.060 0.04<br />
80 1.49 2.41 3.90 0.38 0.070 0.06<br />
EVOO-LOO c 1 1.47 0.15 1.62 0.91 0.118 0.37<br />
3 1.41 0.20 1.61 0.88 0.145 0.42<br />
5 1.40 0.23 1.63 0.86 0.109 0.52<br />
10 1.35 0.34 1.69 0.80 0.111 0.60<br />
15 1.33 0.47 1.80 0.74 0.090 0.73<br />
20 1.29 0.60 1.89 0.68 0.121 0.90<br />
EVOO−ROO(3) d<br />
1 60 1.79 1.2.07 3.86 0.46 0.12 0.17<br />
2 65 1.76 2.22 3.98 0.44 0.114 0.16<br />
3 70 1.75 2.55 4.30 0.40 0.074 0.15<br />
4 75 1.70 2.90 4.60 0.37 0.080 0.20<br />
5 80 1.60 3.15 4.75 0.34 0.108 0.13<br />
a First set <strong>of</strong> mixtures obtained from EVOO sample 27 (Table 1) and ROO<br />
sample 2 (Table 2). b Second set <strong>of</strong> mixtures obtained from EVOO sample 24<br />
(Table 1) and ROO sample 4 (Table 2). c Mixtures obtained from EVOO sample<br />
13 (Table 1) and LOO sample 6 (Table 2). d Samples for blank tests were prepared<br />
as follows: 1 and 2 from EVOO sample 37 (Table 1) and ROO 3 (Table 2); 3<br />
from EVOO sample 35 (Table 1) and ROO 10 (Table 2); 4 and 5 from EVOO<br />
sample 36 (Table 1) and ROO 9 (Table 2).<br />
hydrolysis toward the products and, hence, increases the<br />
concentration <strong>of</strong> free fatty acids.<br />
Classification <strong>of</strong> <strong>Olive</strong> <strong>Oil</strong>s <strong>with</strong> Multivariate Statistical<br />
Analysis. A study <strong>of</strong> skewness and kurtosis on each variable<br />
demonstrated that all had an almost normal distribution, except<br />
perhaps free acidity, which showed positive skewness (2.25)<br />
and kurtosis (3.91). Logarithmic transformation was applied to<br />
this variable before further analysis was performed. Multivariate<br />
outliers among samples were detected by applying principle<br />
component analysis (PCA). No outliers were identified in the<br />
present data. The variables <strong>with</strong> the highest discriminating power<br />
were selected by employing one-way ANOVA. On the basis<br />
<strong>of</strong> the Fisher F ratio, we selected the following variables (in<br />
parentheses the F values <strong>with</strong> degrees <strong>of</strong> freedom 2 and 56):<br />
1,3-DGs, (176.2), TDGs (74.0), D (3017.9), sterols (13.4), log<br />
<strong>of</strong> acidity (434.7), TDG-FFA (135.2) <strong>with</strong> the probability p <<br />
0.000017 for sterols and p < 0.000001 for the remaining<br />
variables. The F ratios are higher than the critical values<br />
obtained from standard statistical tables at p ) 0.005, F critical<br />
(2, 56) ) 5.80, or upon comparison <strong>with</strong> F critical (2, 11) ) 7.20<br />
at p ) 0.01, 12 being the number <strong>of</strong> oil samples minus 1 for<br />
the group <strong>of</strong> olive oils <strong>with</strong> the least number <strong>of</strong> samples (LOO<br />
<strong>with</strong> 12 samples). The strict criteria for the chosen probability<br />
(usually p ) 0.05) was justified by the fact that the groups <strong>of</strong><br />
olive oils contain different numbers <strong>of</strong> samples. The relatively<br />
low Fisher F ratio observed for sterols is indicative <strong>of</strong> its limited<br />
discriminatory power, and thus it is excluded from further<br />
statistical analysis.<br />
The selected variables were used next to examine the<br />
similarity (or dissimilarity) <strong>of</strong> the oils by means <strong>of</strong> HCA. This<br />
statistical method organizes the clustering <strong>of</strong> different objects<br />
<strong>with</strong>out any a priori knowledge <strong>of</strong> the <strong>of</strong> class membership on<br />
the basis <strong>of</strong> a similarity indicator (distance) and an amalgamation<br />
algorithm that joins similar objects into clusters. The results <strong>of</strong><br />
HCA for the present olive oil are presented in the form <strong>of</strong> a<br />
dendrogram in Figure 2 obtained <strong>with</strong> Euclidean distances and<br />
single linkage. Apart from one lampante oil sample, a clear<br />
grouping <strong>of</strong> the three olive oil grades is achieved.<br />
For further statistical analysis using DA, the type <strong>of</strong> oil was<br />
chosen as a grouping variable or code. Also, this supervised<br />
statistical method allows detection <strong>of</strong> adulteration (see below).<br />
Figure 3 shows the graph <strong>of</strong> the two canonical functions (roots)<br />
obtained, which succeeded in classifying the 59 oil samples into
2814 J. Agric. Food Chem., Vol. 53, No. 8, 2005 Fragaki et al.<br />
Figure 2. Dendrogram showing the clustering <strong>of</strong> the 59 samples <strong>of</strong> olive oils based on the NMR data set. Samples labeled <strong>with</strong> the same letter originate<br />
from the same olive oil grade: extra virgin olive oil (V), refined olive oil (R), lampante olive oil (L).<br />
Figure 3. Plot <strong>of</strong> the discriminant functions roots 1 and 2 for three grades <strong>of</strong> olive oils, extra virgin olive oils (EVOO), refined olive oils (ROO), and<br />
lampante olive oils (LOO) (open symbols) and two sets <strong>of</strong> mixtures, EVOO−ROO (1) and EVOO−ROO (2), containing 1−50 and 1−80% w/w ROO in<br />
EVOO, respectively, and one set <strong>of</strong> mixtures 1−20% <strong>of</strong> EVOO <strong>with</strong> LOO (solid symbols). Crosses denote the blank tests, EVOO−ROO (3), and solid<br />
triangles denote the commercial blended olive oils (BOO). Arrows indicate mixtures <strong>of</strong> EVOO containing ROO at concentrations >50%.<br />
three groups. The ellipses denote the 95% probability that a<br />
certain sample belongs to its own group <strong>of</strong> oils <strong>with</strong>in the region<br />
defined by the ellipse. The raw coefficients, the tolerance values,<br />
and the Wilk’s λ criterion assigned to the selected variables are<br />
shown in Table 4. Variables 1,3-DGs, TDGs, D, and log acidity<br />
have the largest raw coefficients <strong>of</strong> the canonical functions,<br />
reflecting their significant contribution to the discrimination<br />
between groups. The values <strong>of</strong> Wilk’s λ are very small,<br />
indicating that the five selected variables are characterized by<br />
an effective discriminatory power. Also, the high tolerance<br />
values show no indication <strong>of</strong> redundancy among the selected<br />
variables.<br />
The reliability <strong>of</strong> the system used to classify the oils has been<br />
validated by its ability to correctly classify unknown samples.<br />
In this respect, the data set <strong>of</strong> all oils was split into the training<br />
set (around two-thirds <strong>of</strong> the samples) and the test set (around<br />
one-third <strong>of</strong> the samples) considered as unknowns. The samples<br />
<strong>of</strong> the training and test sets were selected three times at random<br />
from 59 oil samples. Each time, different training and test sets<br />
were used. Application <strong>of</strong> the DA classification functions<br />
obtained for the training set <strong>of</strong> oil samples in all three runs<br />
produced 100% correct assignments for the test set <strong>of</strong> EVOO,<br />
LOO, and ROO.<br />
<strong>Adulteration</strong> <strong>of</strong> <strong>Extra</strong> <strong>Virgin</strong> <strong>Olive</strong> <strong>Oil</strong>s. DA was applied<br />
to the analysis <strong>of</strong> the oil mixtures (adulterated EVOO) analyzed<br />
by 31 P NMR spectroscopy and considered as unknown samples.<br />
Results were calculated using the model obtained by the training<br />
set and depicted in Figure 3. The adulterated EVOO samples<br />
<strong>with</strong> ROO and LOO (solid symbols) (see also Table 3 for the<br />
origin <strong>of</strong> mixtures) lie between the group <strong>of</strong> EVOO and the
<strong>Detection</strong> <strong>of</strong> <strong>Extra</strong> <strong>Virgin</strong> <strong>Olive</strong> <strong>Oil</strong> <strong>Adulteration</strong> J. Agric. Food Chem., Vol. 53, No. 8, 2005 2815<br />
Table 4. Discriminant Analysis: Raw Coefficients, Wilk’s λ Values,<br />
and Tolerance Levels for Each Variable Used for the Classification <strong>of</strong><br />
Four Grades <strong>of</strong> <strong>Olive</strong> <strong>Oil</strong>s<br />
variable root 1 root 2 Wilk’s λ<br />
tolerance<br />
level<br />
1,3-DGs 3.727 −0.026 0.000446 0.0474<br />
TDGs −2.605 −0.511 0.000459 0.0506<br />
D 48.509 −2.765 0.000638 0.4588<br />
log <strong>of</strong> acidity 1.907 5.638 0.001134 0.5598<br />
TDGs−FFA −0.335 −0.069 0.000344 0.6429<br />
constants −29.471 6.70<br />
eigenvalues 152.923 19.01<br />
Table 5. Squared Mahalanobis Distances <strong>of</strong> Adulterated EVOO<br />
Samples from <strong>Olive</strong> <strong>Oil</strong> Centroid<br />
adulterant<br />
1% 3% 5% 10% 15% 20% 35% 50% 65% 80%<br />
ROO a 0.6 3.7 12.3 61.3 102.2 128.0 304.8 394.5<br />
ROO b 3.7 5.2 14.2 38.6 64.24 99.5 217.1 349.9 452.0 576.6<br />
LOO c 3.6 5.5 9.7 26.2 57.61 99.4<br />
a First set <strong>of</strong> mixtures (1−50%) <strong>of</strong> EVOO <strong>with</strong> ROO. b Second set <strong>of</strong> mixtures<br />
(1−80%) <strong>of</strong> EVOO <strong>with</strong> ROO. c Set <strong>of</strong> mixtures (1−20%) <strong>of</strong> EVOO <strong>with</strong> LOO.<br />
respective group <strong>of</strong> ROO and LOO depending on the amount<br />
<strong>of</strong> the latter oils in the mixtures. The first set <strong>of</strong> mixtures<br />
containing the lowest amount <strong>of</strong> adulterant ROO in EVOO (1%)<br />
falls inside the 95% ellipse <strong>of</strong> EVOO, whereas the second set<br />
<strong>of</strong> mixtures <strong>with</strong> the same concentration <strong>of</strong> adulterant lies in<br />
the border <strong>of</strong> the ellipse <strong>of</strong> EVOO (Figure 3). The adulterated<br />
EVOO <strong>with</strong> LOO show higher detection limits, because only<br />
the 5% mixture is outside the 95% ellipse <strong>of</strong> EVOO group,<br />
A more accurate means to detect adulteration is the Mahalanobis<br />
distance, which measures the distances between each<br />
point and the group centroid. The calculated Mahalanobis<br />
distances for mixtures (Table 5) are to be compared <strong>with</strong> the<br />
Mahalanobis distance <strong>of</strong> EVOO samples from the centroid <strong>of</strong><br />
their own group. Apart from 2 EVOO samples <strong>of</strong> 34 <strong>with</strong><br />
Mahalanobis distances 6.7 and 5.3, all other EVOO samples<br />
are characterized by distances lower than those calculated for<br />
the EVOO <strong>with</strong> 5% <strong>of</strong> ROO and EVOO adulterated <strong>with</strong> 5%<br />
LOO. These data clearly show that the minimum amounts <strong>of</strong><br />
ROO and LOO that can be detected by using the present<br />
methodology are 5%.<br />
Although application <strong>of</strong> DA to adulteration studies does not<br />
lead to precise quantitative conclusions, the almost linear array<br />
<strong>of</strong> the adulterated EVOO samples in the plot <strong>of</strong> Figure 3 may<br />
allow a semiquantitative estimation <strong>of</strong> the proportion <strong>of</strong> added<br />
foreign oil. First, we prepared mixtures <strong>of</strong> EVOO <strong>with</strong> ROO<br />
<strong>of</strong> known composition (60, 65, 70, 75, and 80%) using different<br />
EVOO samples not included in the previous statistical treatment<br />
(see Table 3 and footnote). These samples, used as blank tests,<br />
were treated as unknowns using the model obtained by the<br />
training set <strong>of</strong> 59 oils. As shown in Figure 3, these mixtures<br />
indicated by arrows are lying close to the array <strong>of</strong> the adulterated<br />
EVOO <strong>with</strong> ROO used in the statistical analysis at positions<br />
depending on the amount <strong>of</strong> the added ROO. The Mahalanobis<br />
distances for 65% (436.4) and 80% (586.4) adulteration agree<br />
closely <strong>with</strong> those reported for the corresponding values <strong>of</strong> the<br />
mixtures in the array <strong>with</strong> the same composition (Table 5). Next,<br />
we consider real oils represented by six blended olive oils (BOO)<br />
consisting <strong>of</strong> refined olive oil and virgin olive oil and purchased<br />
from supermarkets in an attempt to estimate the percent<br />
concentration <strong>of</strong> ROO in these commercial products. These<br />
samples were treated again as unknowns using the model<br />
obtained by the training set <strong>of</strong> the 59 oil samples (Figure 3).<br />
The observed deviations <strong>of</strong> the commercial oils from the arrays<br />
is justified by the fact that the EVOO and ROO samples used<br />
to prepare these oils are characterized by different compositions<br />
<strong>of</strong> diglycerides and acidity. However, their compositions can<br />
be estimated on the basis <strong>of</strong> the calculated Mahalanobis distances<br />
from the centroid <strong>of</strong> the group <strong>of</strong> EVOO samples, which are to<br />
be compared <strong>with</strong> the corresponding distances <strong>of</strong> all the artificial<br />
mixtures in Figure 3. Two <strong>of</strong> the six BOO samples (1 and 5)<br />
show Mahalanobis distances <strong>of</strong> 286.03 and 323.45, respectively,<br />
which are <strong>with</strong>in the respective distances <strong>of</strong> the adulterated<br />
EVOO samples <strong>with</strong> 35 and 50% ROO (Table 5) and lower<br />
than the Mahalanobis distance <strong>of</strong> 405.5 for the 60% blank<br />
sample. The Mahalanobis distances <strong>of</strong> BOO samples 3 (477.8)<br />
and 6 (488.0) are close to the corresponding value (501.1) <strong>of</strong><br />
the blank mixture <strong>with</strong> 70% ROO, whereas the final commercial<br />
products 2 and 4 contain ∼80% ROO as indicated by their<br />
Mahalanobis distances <strong>of</strong> 606.4 and 560.0, respectively, which<br />
agrees closely <strong>with</strong> those <strong>of</strong> the oils in the array (Table 5) and<br />
the blank sample (586.4) <strong>of</strong> the same concentration.<br />
LITERATURE CITED<br />
(1) Owen, R. W.; Giacosa, A.; Hull, W. E.; Haubner, R.; Wurtele,<br />
G.; Spiegelhalder, B.; Bartsch, H. <strong>Olive</strong>-oil consumption and<br />
health: the possible role <strong>of</strong> antioxidants. Lancet Oncol. 2000,<br />
1, 107-112.<br />
(2) Owen, R. W.; Mier, W.; Giacosa, A.; Hull, W. E.; Spiegelhalder,<br />
B.; Bartsch, H. Identification <strong>of</strong> lignans as major components<br />
in phenolic fraction <strong>of</strong> olive oil. Clin. Chem. 2000, 976-988.<br />
(3) Owen, R. W.; Mier, W.; Giacosa, A.; Hull, W. E.; Spiegelhalder,<br />
B.; Bartsch, H. Phenolic compounds and squalene in olive oils:<br />
the concentration and antioxidant potential <strong>of</strong> total phenols,<br />
simple phenols, secoiridoids, lignans and squalene. Food Chem.<br />
Toxicol. 2000, 38, 647-659.<br />
(4) EC. Off. J. Eur. Communities 2003, Nov 6, Regulation 1989/<br />
2003.<br />
(5) Aparicio, R.; Aparicio-Ruiz, R. Authentication <strong>of</strong> vegetable oils<br />
by chromatographic techniques. J. Chromatogr. A 2000, 881,<br />
93-104.<br />
(6) Garcia-Gonzalez, D. L.; Aparicio, R. <strong>Virgin</strong> olive oil quality<br />
classification combining neural networks and MOS sensors. J.<br />
Agric. Food Chem. 2003, 51, 3515-3519.<br />
(7) Dourtoglou, V. G.; Gourtoglou, Th.; Antonopoulos, A.; Stefanou,<br />
E.; Lalas, S.; Poulos, C. <strong>Detection</strong> <strong>of</strong> olive oil adulteration using<br />
principle component analysis applied on total regio FA composition.<br />
J. Am. <strong>Oil</strong> Chem. Soc. 2003, 80, 203-208.<br />
(8) Cercaci, L.; Rodriguez-Estrada, M. T.; Lerker, G. Solid-phase<br />
extraction-thin-layer-gas chromatography method for the detection<br />
<strong>of</strong> hazelnut oil in olive oils by determination <strong>of</strong> esterified<br />
sterols. J. Chromatogr. A 2003, 985, 211-220.<br />
(9) Marcos Lorenzo, I.; Luis Perez Pavon, J.; Fernandez Laespada,<br />
E.; Garcia Pinto, C.; Moreno Cordero, B. <strong>Detection</strong> <strong>of</strong> adulterants<br />
in olive by headspace-mass spectrometry. J. Chromatogr. A 2002,<br />
945, 221-230.<br />
(10) Angerosa, F.; Camera, L.; Cumitini, S.; Gleixner, G.; Reniero,<br />
F. Carbon stable isotopes and olive oil adulteration <strong>with</strong> pomace<br />
oil. J. Agric. Food Chem. 1997, 45, 3044-3048.<br />
(11) Downey, G.; McIntyre, P.; Davies, A. N. Detecting sunflower<br />
oil adulteration in extra virgin olive oils from the eastern<br />
Mediterranean by visible and near-infrared spectroscopy. J.<br />
Agric. Food Chem. 2002, 50, 5520-5525.<br />
(12) Baeten, V.; Meurens, M.; Morales, M. T.; Aparicio, R. <strong>Detection</strong><br />
<strong>of</strong> virgin olive oil adulteration by Fourier transform Raman<br />
spectroscopy. J. Agric. Food Chem. 1996, 44, 2225-2230.<br />
(13) Lai, Y. W.; Kemsley, E.; Wilson, R. H. Potential <strong>of</strong> Fourier<br />
transform infrared spectroscopy for the authentication <strong>of</strong> vegetable<br />
oils. J. Agric. Food Chem. 1994, 42, 1154-1159.
2816 J. Agric. Food Chem., Vol. 53, No. 8, 2005 Fragaki et al.<br />
(14) Lai, Y. W.; Kemsley, E.; Wilson, R. H. Quantitative analysis <strong>of</strong><br />
potential adulteration <strong>of</strong> extra virgin olive oil using infrared<br />
spectroscopy. Food Chem. 1995, 53, 95-98.<br />
(15) Baeten, V.; Dardenne, P.; Aparicio, R. Interpretation <strong>of</strong> Fourier<br />
transform spectra <strong>of</strong> the unsaponifiable matter in a selection <strong>of</strong><br />
edible oils. J. Agric. Food Chem. 2001, 49, 5096-5107.<br />
(16) Marigheto, N. A.; Kemsley, E. K.; Defernez, M.; Wilson, R. H.<br />
A comparison <strong>of</strong> mid-Infrared and Raman spectroscopies for the<br />
authentication <strong>of</strong> edible oils. J. Am. <strong>Oil</strong> Chem. Soc. 1998, 75,<br />
987-992.<br />
(17) Zamora, R.; Gomez, G.; Hidalgo, F. J. Classification <strong>of</strong> vegetable<br />
oils by high-resolution 13 C NMR spectroscopy using chromatographically<br />
obtained oil fractions. J. Am. <strong>Oil</strong> Chem. Soc. 2002,<br />
79, 267-272.<br />
(18) Fauhl, C.; Reniero, F.; Guillou. 13 C NMR as a tool for the<br />
analysis <strong>of</strong> mixtures <strong>of</strong> virgin olive oils <strong>of</strong> different botanical<br />
origin. Magn. Reson. Chem. 2000, 38, 436-443.<br />
(19) Mannina, L.; Patumi, M.; Fiordiponti, P.; Emanuele, M. C.;<br />
Segre, A. L. <strong>Olive</strong> and hazelnut oils: A study by high-field 1 H<br />
NMR and gas chromatography. Ital. J. Food Sci. 1999, 11, 139-<br />
149.<br />
(20) Vigli, G.; Philippidis, A.; Spyros, A.; Dais, P. Classification <strong>of</strong><br />
edible oils by employing 31 P and 1 H NMR spectroscopy in<br />
combination <strong>with</strong> multivariate statistical analysis. A proposal for<br />
detection <strong>of</strong> seed oil adulteration in virgin olive oils. J. Agric.<br />
Food Chem. 2003, 51, 5715-5722.<br />
(21) Spyros, A.; Dais, P. Application <strong>of</strong> 31 P NMR spectroscopy in<br />
food analysis. Quantitative determination <strong>of</strong> the mono- and<br />
diglyceride composition <strong>of</strong> olive oils. J. Agric. Food Chem. 2000,<br />
48, 802-805.<br />
(22) Sacchi, R.; Addeo, F.; Paolillo, L. 1 H and 13 C NMR <strong>of</strong> virgin<br />
oil. An overview. Magn. Reson. Chem. 1997, 35, 5133-5145.<br />
(23) Zwierzak, A. Cyclic organophosphorus compounds. I. Synthesis<br />
and infrared spectral studies <strong>of</strong> cyclic hydrogen phosphites and<br />
thiophosphites. Can. J. Chem. 1967, 45, 2501-2512.<br />
(24) Perez-Camino, M. C.; Modera, W.; Cert, A. Effects <strong>of</strong> olive oil<br />
fruit quality and oil storage practices on the diacylglycerols<br />
content <strong>of</strong> virgin olive oils. J. Agric. Food Chem. 2001, 49, 699-<br />
704.<br />
(25) Sacchi, R.; Paolillo, L.; Giudicianni, I.; Addeo, F. Rapid 1 H-<br />
NMR determination <strong>of</strong> 1,2 and 1,3 diglycerides in virgin olive<br />
oils. Ital. J. Food Sci. 1991, 3, 253-262.<br />
(26) Fronimaki, P.; Spyros, A.; Christophoridou, S.; Dais, P. Determination<br />
<strong>of</strong> the diglyceride content in Greek virgin olive oils<br />
and some commercial olive oils by employing 31 P NMR<br />
spectroscopy. J. Agric. Food Chem. 2002, 50, 2207-2213.<br />
(27) Vlahov, G. Improved quantitative 13 C nuclear magnetic resonance<br />
criteria for determination <strong>of</strong> grades <strong>of</strong> virgin olive oils. The<br />
normal ranges for diglycerides in olive oil. J. Am. <strong>Oil</strong> Chem.<br />
Soc. 1996, 73, 1201-1203.<br />
(28) Spyros, A.; Philippidis, A.; Dais, P. Kinetics <strong>of</strong> diglyceride<br />
formation and isomerization in virgin olive oils by employing<br />
31<br />
P NMR spectroscopy. Formulation <strong>of</strong> a quantitative measure<br />
to assess olive oil storage history. J. Agric. Food Chem. 2004,<br />
52, 157-164.<br />
Received for review June 9, 2004. Revised manuscript received January<br />
31, 2005. Accepted February 2, 2005. We thank the Greek Ministry <strong>of</strong><br />
Education for financial support through the B′ EPEAEK Graduate<br />
Program and the Program Hrakleitos. Also, we are indebted to Project<br />
4.3.6.2B EPAN funded by the Greek General Secretariat <strong>of</strong> Research<br />
and Technology and the European Union.<br />
JF040279T