Staff Reports - East Bay Municipal Utility District
Staff Reports - East Bay Municipal Utility District
Staff Reports - East Bay Municipal Utility District

You also want an ePaper? Increase the reach of your titles
YUMPU automatically turns print PDFs into web optimized ePapers that Google loves.
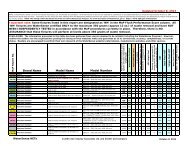
<strong>District</strong> Affirmative Action 2012 Placement Goal Monitoring Report<br />
July 1, 2011 – June 30, 2012<br />
This table reflects only regular, full-time hires. “Female” includes women of all races.<br />
Job Group<br />
Total<br />
Employees<br />
Total #<br />
of Hires<br />
Directors/Managers 65 3<br />
Programmers 95 6<br />
Analysts 46 2<br />
Table V.5<br />
Placement Goal %<br />
Female 34%<br />
Asian 20%<br />
Hispanic 6%<br />
African American 7%<br />
Hispanic 6%<br />
Female 68%<br />
African American 16%<br />
Hispanic 9%<br />
Actual<br />
Placement<br />
Rate %<br />
67%<br />
0%<br />
0%<br />
17%<br />
0%<br />
50%<br />
0%<br />
0%<br />
Other Professionals 54 1 Hispanic 7% 0% No Progress<br />
Female 47% 50%<br />
Science Professionals 42 2<br />
Hispanic 5% 0%<br />
Administrative<br />
Assistants<br />
63 1 Hispanic 11% 0% No Progress<br />
General Clerical 113 0 Hispanic 13% 0% No Progress<br />
Status of Goal Achievement<br />
Hiring Exceeds Expectations<br />
No Progress<br />
No Progress<br />
Hiring Exceeds Expectations<br />
No Progress<br />
Hiring Below Expectations<br />
No Progress<br />
No Progress<br />
Hiring Exceeds Expectations<br />
No Progress<br />
Customer Services 101 6<br />
Female 58% 17% Hiring Below Expectations<br />
Asian 18% 33% Hiring Exceeds Expectations<br />
Technicians 24 2<br />
Female 42% 50% Hiring Exceeds Expectations<br />
Asian 31% 0% No Progress<br />
Plant Operators 133 4<br />
Female 13% 0% No Progress<br />
African American 11% 0% No Progress<br />
Female 21% 0% No Progress<br />
Plant Operators<br />
38 1 Asian 13% 0% No Progress<br />
Lead/Supervision<br />
Hispanic 20% 0% No Progress<br />
Female 58% 0% No Progress<br />
Lab & Quality Control<br />
56 0 African American 10% 0% No Progress<br />
Technicians<br />
Asian 30% 0% No Progress<br />
Rangers 37 4<br />
African American 24% 0% No Progress<br />
Hispanic 35% 0% No Progress<br />
Engineers 148 14 N/A N/A N/A<br />
Female 22% 0% No Progress<br />
Supervising Engineers 43 1 Asian 33% 100% Hiring Exceeds Expectations<br />
Hispanic 7% 0% No Progress<br />
Engineering<br />
Technicians<br />
89 2<br />
Pipeline Maintenance 173 18<br />
Heavy Equipment/<br />
Truck Operators<br />
Pipeline Maintenance<br />
Lead/Supervision<br />
Electrical/Structural<br />
Maintenance<br />
Mechanical<br />
Maintenance<br />
82 7<br />
65 8<br />
99 2<br />
131 4<br />
Service Maintenance 71 1<br />
Female 18%<br />
African American 6%<br />
Hispanic 12%<br />
Female 3%<br />
Asian 9%<br />
Hispanic 32%<br />
African American 15%<br />
Asian 10%<br />
Hispanic 31%<br />
Female 5%<br />
Asian 7%<br />
Hispanic 23%<br />
Female 16%<br />
African American 6%<br />
Asian 15%<br />
Hispanic 18%<br />
Female 6%<br />
African American 7%<br />
Asian 13%<br />
Female 28%<br />
Hispanic 35%<br />
0%<br />
0%<br />
0%<br />
6%<br />
0%<br />
22%<br />
29%<br />
0%<br />
0%<br />
0%<br />
0%<br />
63%<br />
0%<br />
0%<br />
0%<br />
0%<br />
0%<br />
0%<br />
0%<br />
0%<br />
0%<br />
No Progress<br />
No Progress<br />
No Progress<br />
Hiring Exceeds Expectations<br />
No Progress<br />
Hiring Below Expectations<br />
Hiring Exceeds Expectations<br />
No Progress<br />
No Progress<br />
No Progress<br />
No Progress<br />
Hiring Exceeds Expectations<br />
No Progress<br />
No Progress<br />
No Progress<br />
No Progress<br />
No Progress<br />
No Progress<br />
No Progress<br />
No Progress<br />
No Progress<br />
Affirmative Action & Equal Employment Opportunity<br />
46