

The Ecology of Tampa Bay, Florida - USGS National Wetlands ...
The Ecology of Tampa Bay, Florida - USGS National Wetlands ...
The Ecology of Tampa Bay, Florida - USGS National Wetlands ...

Create successful ePaper yourself
Turn your PDF publications into a flip-book with our unique Google optimized e-Paper software.
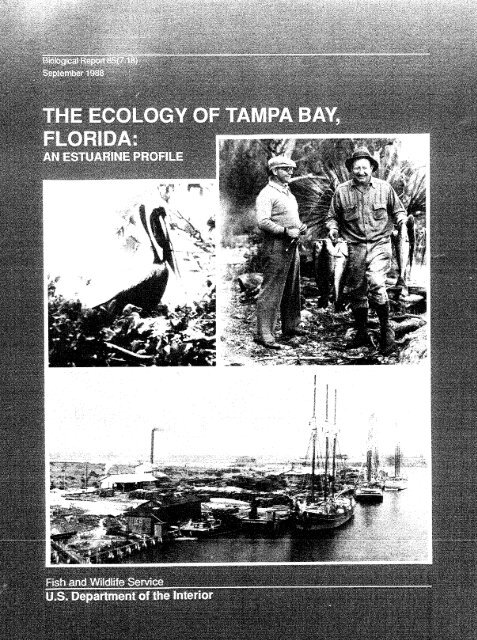
Cover photographs:<br />
Upper left: Browri pelican (Pelecanus occidenfaiis) on a nest in mangroves in Terra Ceia <strong>Bay</strong><br />
Upper right: <strong>Tampa</strong> baseball player Dazzy Vance (left) and local guide Ed Alexander (right) with redfish<br />
(Sciaenops oceiiaitisj, December 193:.<br />
Lower: View <strong>of</strong> ships at the docks <strong>of</strong> the old Lee Terminal on <strong>Tampa</strong> <strong>Bay</strong>, October 33, 1919
Biological Report 85(7.18)<br />
Septeiiber 1988<br />
THE ECOLOGY OF: TAMPA BAY, FLORIDA:<br />
AM ESTUARINE PROFILE<br />
Roy K. l.cwis 111<br />
Mangrove Sys terns, Irlc<br />
P. 0. Oux 290197<br />
<strong>Tampa</strong>, FL 33687<br />
and<br />
Ernest D. Estevez<br />
Mote Mdrinc laboratory<br />
1600 City Island Park<br />
Sarasota, F 1 33577<br />
Project Officer<br />
Edward C. Pc~ndlc ton<br />
U.S. Fish and Wildlife Service<br />
FIa tional Pletldnds Re~;parch Center<br />
1010 Gau5e kitlevard<br />
Sl idel 1, t4 704%<br />
Performed for<br />
U.S. Department <strong>of</strong> the lriterior<br />
Fish and Wildlife Service<br />
Research and Developiwnt<br />
t4a tional <strong>Wetlands</strong> Research Center<br />
Washington, DC 20240
<strong>The</strong> mention <strong>of</strong> commercial product trade names in this report does not<br />
constitute endorsement or recommendation for use by the Fish and Wi 1 dl i fe<br />
Servf ce, U.S. Department <strong>of</strong> the Interior.<br />
Lewi s , Roy R. , 1944-<br />
<strong>The</strong> ecology <strong>of</strong> lampa <strong>Bay</strong>, <strong>Florida</strong>.<br />
(8ioloyical report RS(7.18) (May 1988))<br />
"Performed for Nationa l <strong>Wetlands</strong> Research Center,<br />
Research and Development, Fish and Wildlife Service,<br />
U.S. Department <strong>of</strong> the Itrteriur, Washington, DC."<br />
Bib1 iagraphy: p.<br />
1. EsCuar+ine ecology--F-lurida--<strong>Tampa</strong> <strong>Bay</strong>.<br />
1. Estevet, Cr-nest 0. 11. Title. 111. <strong>National</strong><br />
<strong>Wetlands</strong> Research Center (U.5.) IV, Series: 8iological<br />
repart (Washington, 0.C.) ; 85-7.18.<br />
This repart should be clted as:<br />
Lewis, R.R., Il[I,and E.D. Estevez. 1988. <strong>The</strong> ecology <strong>of</strong> <strong>Tampa</strong> <strong>Bay</strong>, <strong>Florida</strong>: an<br />
estuarine pr<strong>of</strong>ile, U-5, F4sh Wildl. Serv. Bid. Rep. 85(7.18). 132 pp.
PREFACE<br />
<strong>The</strong> width, depth, and perimeter <strong>of</strong> <strong>The</strong> fourth era arose about 25 years<br />
<strong>Tampa</strong> <strong>Bay</strong> have changed over the past ago when the overall condition <strong>of</strong> the bay<br />
century due to natural and human causes, was considered to be failing or in very<br />
and so have the numbers, kinds, and dis- poor condition. This era was significant<br />
tributions <strong>of</strong> plants and animals in the for signalling the treatment <strong>of</strong> the bay<br />
bay. Society's uses <strong>of</strong> the bay and atti- as a conceptual unit and ecological entity:<br />
tudes toward it also have been changiny, a single, albeit immense, landscape<br />
and these changes can be read in the bay s element. This era was also marked by<br />
past and present condition.<br />
scientific studies <strong>of</strong> things and events in<br />
the bay, and by the advent <strong>of</strong> rildimentary<br />
health and environmental regulations.<br />
We are entering a new era in a series Unfortunately, the fourth era has been a<br />
<strong>of</strong> bay-management eras. At first, the bay period <strong>of</strong> extensive resource decline, and<br />
was a completely natural ecosystem, recent events seem even less acceptable<br />
affected little by the small, prehistoric given heightened awareness <strong>of</strong> the bay's<br />
human populations that lived along the working and importance and the numerous<br />
shore. In the second era--beginning with laws and regulations which are popularly<br />
Spanish fishing camps and ending with the believed to prevent such damage.<br />
demise <strong>of</strong> sturqeon late in the 19th<br />
century--the bay s natural fertility was <strong>The</strong> new era in bay management is<br />
exploited without harm to the underlying perhaps the most critical in the history<br />
ecosystem. <strong>The</strong> bay enabled and richly <strong>of</strong> human settlement in the region because<br />
subsidized the region's settlement and events <strong>of</strong> the new era may be irreversible,<br />
made fortunes for many poor settlers. at least compared with those <strong>of</strong> the past.<br />
Exploitation <strong>of</strong> the bay's resources con- On the one hand, assaults to the bay from<br />
tinued into the third era, which was a physical changes, chemical wastes, or<br />
period when projects for public and stock depletion may occur with heret<strong>of</strong>ore<br />
private gain began to affect the system. unheard-<strong>of</strong> magnitudes. On the other hand,<br />
Local areas or resources <strong>of</strong> the bay were there is widespread support for preserving<br />
declining in area <strong>of</strong> productivity, but the the bay and for restoring parts <strong>of</strong> it to<br />
losses were imperceptible against the cause a net improvement in its existing<br />
relatively 1 irnilless exparrse <strong>of</strong> adjacent condition. Within l iberal 1 imi ts it is<br />
bay and coastal reaches.<br />
entirely within our ability to make <strong>Tampa</strong><br />
<strong>Bay</strong> whatever we choose. Hopefully the<br />
information in this Estuarine Pr<strong>of</strong>ile will<br />
<strong>The</strong> third era began a period <strong>of</strong> help as society makes that choice. We<br />
resource erosion that continues to the concur fully with a conclusion <strong>of</strong> the<br />
present, but was different from modern <strong>Tampa</strong> <strong>Bay</strong> Area Scientific Infomia tion<br />
times because there was no basis in Symposium (BASIS) that "with proper<br />
science or law for understanding or con- management and restoration, the <strong>Bay</strong><br />
trol I i ng impacts. <strong>The</strong> science <strong>of</strong> ecology would become perceptibly more productive<br />
would not develop for decades and there and valuable to its users."<br />
was no bay attitude comparable to a farm<br />
land ethic which could foresee the long- We are grateful to the resource<br />
term, cumulative consequences <strong>of</strong> super- managers, environmental specialists,<br />
ficially beneficial projects.<br />
regu't atory agency staff, scienli sts, and<br />
iii
students who have helped to generate<br />
information about <strong>Tampa</strong> <strong>Bay</strong> during the<br />
past 30 years. <strong>The</strong> job <strong>of</strong> writing this<br />
pr<strong>of</strong>ile was simplified greatly by the<br />
authors <strong>of</strong> BASIS reports, and by subsequent<br />
information produced by the <strong>Tampa</strong><br />
<strong>Bay</strong> Regional Plann~ ng Counci 1 , Agency on<br />
<strong>Bay</strong> Management, and other <strong>of</strong>fices <strong>of</strong><br />
government. For their roles in fostering<br />
the wise stewardship <strong>of</strong> <strong>Tampa</strong> <strong>Bay</strong> we also<br />
wish to dedicate this volume to Melvin<br />
Anderson, John V. Betz, Sally Casper,<br />
Betty Castor, Don Castor, Wi 11 iam 0.<br />
Courser Lamar Cox, Mary Grizzle, Robert<br />
King, Plant Norton, Jan Platt, Bernard E.<br />
Ross, Joseph L. Simon, Roger Stewart,<br />
Sally Thompson, and William H. Taft.<br />
In the time that has passed between<br />
the preparation and publication <strong>of</strong> this<br />
estuarine pr<strong>of</strong> il e, progress has been<br />
made on several fronts in <strong>Tampa</strong> <strong>Bay</strong>.<br />
A1 though bay management has improved,<br />
our original conclusions regarding the<br />
shortfal Is <strong>of</strong> existing programs are<br />
still basical ly correct. Progress has<br />
also been made in some areas <strong>of</strong> bay<br />
science. For example, new and useful<br />
studies <strong>of</strong> sediments have recently ended<br />
(and others have begun) in Hi1 lsborough<br />
<strong>Bay</strong>, and a major basin-wide study <strong>of</strong> the<br />
Little Manatee River is underway. In<br />
addition, a major new program to assist<br />
<strong>Tampa</strong> <strong>Bay</strong> and other <strong>Florida</strong> surfacewater<br />
management (the Surface Water<br />
Improvement and Flanagement or SWIM Ri 11)<br />
passed and received funding during the<br />
1987 legislative session. A NOAA<br />
"Estuary <strong>of</strong> the Mnth Seminartt was held<br />
in Washington, D.C., in December 1987 on<br />
<strong>Tampa</strong> and Sarasota <strong>Bay</strong>s, and many recent<br />
bay projects will be summarized in the<br />
proceedings <strong>of</strong> the seminar, scheduled<br />
for release in 1988.<br />
Lastly, this pr<strong>of</strong>ile was one <strong>of</strong><br />
several products produced as a result <strong>of</strong><br />
a 3-year cooperative study by the U.S.<br />
Fish and Wildlife Service and the <strong>Tampa</strong><br />
Port Authority. Other products include:<br />
Auble, G.T. , A. K. Andrews , D.B. Hamil ton,<br />
and J.E. Roelle. 1985. Fish and<br />
wildlife mi tigation options for port<br />
development in <strong>Tampa</strong> <strong>Bay</strong>: results <strong>of</strong> a<br />
workshop. U.S. Fish Wildl. Serv.<br />
NCET Open File Rep. 85-2. 36 pp.<br />
~ia'l , R.S., and D.R. Deis. 1986. Pitigation<br />
options for fish and wildlife<br />
resources affected by port and other<br />
water-dependent devel opments in <strong>Tampa</strong><br />
<strong>Bay</strong>, <strong>Florida</strong>. U.S. Fish Wildl. Serv.<br />
Rep. 86(6). 150 pp.<br />
~ibi.<br />
Fehring, W.K. 1986. Data bases for use<br />
in fish and wildlife mitigation planning<br />
in <strong>Tampa</strong> Ray <strong>Florida</strong>: project summary.<br />
U.S. Fish Wildl. Serv. NWRC Open File<br />
Rep. 86-6. 38 pp.<br />
Kunneke, J.T., and T.F. Pali k. 1984.<br />
<strong>Tampa</strong> <strong>Bay</strong> environmental atlas. U.S.<br />
Fish Wildl. Serv, Biol, Rep. 85(15).<br />
78 pp + 38 maps (A1 through B21).<br />
U.S. Fish and Wildlife Service. 1986.<br />
<strong>Tampa</strong> <strong>Bay</strong> habitat (wetland and upland)<br />
maps and data--1950ts, 1972, and 1982.<br />
<strong>National</strong> <strong>Wetlands</strong> Research Center,<br />
Slidell, LA.<br />
Comments concerning or requests for<br />
this publication should be addressed to:<br />
Informa tion Transfer Special i st<br />
<strong>National</strong> <strong>Wetlands</strong> Research Center<br />
U.S. Fish and Wildlife Service<br />
1010 Gause Boulevard<br />
Sl idel 1, LA 70458<br />
(504) 646-7287, FTS 680-7287.
PREFACE ...... ........................................ ........... jil<br />
Page<br />
CONTENTS ............................................................. v<br />
FIGURES ............................................................. vii<br />
TABLES .............................................................. xji<br />
CONVERSION TABLE .................................................... X ~ Q<br />
ACKNOWLEDGMENTS ................................................... xv<br />
1 . INTRODUCTION . ...........................................%...... 1<br />
1.1 <strong>Tampa</strong> <strong>Bay</strong> as a Natural Unit ................................ 1<br />
1.2 Pel itical Subunits <strong>of</strong> the <strong>Bay</strong> .............................. 1<br />
1.3 Biological Subunits <strong>of</strong> the <strong>Bay</strong> ............................. 1<br />
1. 4 Potential Conflicts and Impacts ............................ 5<br />
2 . DESCRXPTION OF THE ENVf RONWENT ................................. 7<br />
2.1 Geolog4cal Origin and Evolution ............................ 7<br />
2.1.1 Geslogical Formations Ref evant to <strong>Tampa</strong> <strong>Bay</strong> .......... 8<br />
2.1.2 Th~EFFecta<strong>of</strong>:GlaciatJcn ............................ 10<br />
2 . X . 3 Oevelapment <strong>of</strong> the Modern <strong>Bay</strong> ........................ 11<br />
2.2 <strong>The</strong> Hydrolagic Cycle ....................................... 13<br />
2.2.1 Insolation and Cloudiness ............................ 14<br />
2.2.2 Atmospheric Pressure and WJnd ........................ 15<br />
2.2.3 Temperature ...................................... &.. 15<br />
2.2.4 Evapotranspiration and Relative Humidity ............. 36<br />
2.2.5FogandRaSn ......................................... 36<br />
2.2.6 Thunderstarms and Hurricanes ......................... 16<br />
2.3 Surface and GrourrQ Waters .................................. 18<br />
2.3.1 Overview <strong>of</strong> Tributaries to <strong>Tampa</strong> <strong>Bay</strong> ................. 18<br />
2.3.2Flows ................................. . . . 18<br />
2.3.3 Constituent Concsntratlans and Loads ................. 20<br />
2.3.4 Strttcturt <strong>of</strong> Craund - wixtar Systems Under the <strong>Bay</strong> ..... 22<br />
2.3.5 Ground-water Discharges tolampa <strong>Bay</strong> .................. 2.3<br />
2.4 Hydrographic Characterfrtics <strong>of</strong> <strong>Tampa</strong> <strong>Bay</strong> .................. 25<br />
2.4.1 Shape and Share1 ines ................................. 25<br />
2.4.2 Ocpth ................................................ 26<br />
2.4.3 Bottom Features ...................................... 26<br />
2.4.4 Sea Level and Tides .................................. 28<br />
2.4.5 Cfrculstion and Flushing ............................. 36<br />
2-5 Chemistry <strong>of</strong> the <strong>Bay</strong> ....................................... 34<br />
2.5.1 General Water Qua1 i ty sf Tanga <strong>Bay</strong> ................... 35<br />
2.5.2 Hydrographic Parameters .............................. 39<br />
2.5.3 Nutrients ............................................ 47<br />
2.5.4 Sedia~ents ............................................ 5(9<br />
2.6 Area Sumnries ............................................. 52<br />
2.6.lMiZfsborough<strong>Bay</strong> ..................................... 52<br />
2.6.2OIdTasnpa<strong>Bay</strong> ........................................ 52
2.6.3 Middle <strong>Tampa</strong> <strong>Bay</strong> .....................................<br />
2.6.4 Lower <strong>Tampa</strong> <strong>Bay</strong> ......................................<br />
2.6.5 Boca Ciega <strong>Bay</strong> .......................................<br />
2.6.6 Terra Ceia <strong>Bay</strong> and the Manatee River ................<br />
2.7 Comparison <strong>of</strong> <strong>Tampa</strong> <strong>Bay</strong> to Charlotte Harbor ................<br />
.....................................<br />
3.1 Phytoplankton .............................................<br />
3.2 Benthic Microalgae ........................................<br />
3.3 Epiphytic Microalgae ......................................<br />
3.4 Attached and Drift Macroalgae .............................<br />
3.5 Seagrass Meadows ..........................................<br />
3.6 Tidal Marshes ......+...............+..................... .<br />
3.7 Mangrove Forests ..........................................<br />
3.8 Riverine Forests and Adjacent Wet1 ands ....................<br />
3.9 Total Primary Production and Organic Material Input .......<br />
3.10 Secondary Producers .......................................<br />
3.11 Zooplankton ...............................................<br />
3.12 Benthos ...................................................<br />
3.13 Fish ......................................................<br />
3.14 Reptiles ..................................................<br />
3.15 Biiqds .....................................................<br />
............................................<br />
3 . BIOLOGICAL CHARACTERISTICS<br />
3.16 Marine Mammal s<br />
4 . ECOLOGICAL INTERRELATIONSHIPS<br />
4.1 Introduction<br />
4.2 Energy Sources<br />
4.3 Abiotic Controls in Communities<br />
4.4 Plant and Animal Interactions<br />
4.5 Fisheries Habitats<br />
5 . MANAGEMENT<br />
5.1 Introduction<br />
5.2 Important Management Issues<br />
REFERENCES<br />
...............................................<br />
.............................................<br />
............................<br />
..............................<br />
.........................................<br />
...............................................<br />
................................<br />
5.2.1 Dredge and Fill ......................................<br />
5.2,2 Fisheries ............................................<br />
5.2.3 Freshwater Flow to the <strong>Bay</strong> ...........................<br />
5.2.4 Eutrophication .......................................<br />
5.2.5 Other Management Considerations ......................<br />
.................................................<br />
..........................................................<br />
5.3 Conclusion<br />
Page
Number<br />
1 Map <strong>of</strong> <strong>Florida</strong> showing the location <strong>of</strong> <strong>Tampa</strong> <strong>Bay</strong> on the<br />
peni nsul ar west coast ....................................<br />
<strong>The</strong> <strong>Tampa</strong> <strong>Bay</strong> area watershed extends into six counties ...<br />
Geographic subdi vi sons <strong>of</strong> <strong>Tampa</strong> <strong>Bay</strong> .......................<br />
Vertical aerial photograph <strong>of</strong> the estuarine shelf<br />
surrounding <strong>Tampa</strong> <strong>Bay</strong><br />
....................................<br />
Major structural features <strong>of</strong> <strong>Florida</strong> .....................<br />
Hydrogeology <strong>of</strong> the <strong>Tampa</strong> <strong>Bay</strong> area .......................<br />
Geologic formations <strong>of</strong> the <strong>Tampa</strong> <strong>Bay</strong> area ................<br />
Approximate stands <strong>of</strong> Wisconsin sea level ................<br />
Terraces <strong>of</strong> the <strong>Tampa</strong> <strong>Bay</strong> area ...........................<br />
Sea level on the southwest <strong>Florida</strong> coast ................. 13<br />
Generalized hydrologic cycle for the <strong>Tampa</strong> <strong>Bay</strong> area ...... 14<br />
Mean monthly pan evaporation and solar insolation near<br />
<strong>Tampa</strong> .................................................... 14<br />
Mean monthly temperature and extremes for <strong>Tampa</strong> <strong>Bay</strong> ...... 15<br />
Mean monthly rainfall and extremes for <strong>Tampa</strong> <strong>Bay</strong> ......... 16<br />
Mean annual rainfall in inches across the <strong>Tampa</strong> <strong>Bay</strong><br />
region ................................................... 17<br />
Mean monthly flow in major tributaries to <strong>Tampa</strong> <strong>Bay</strong> ...... 19<br />
Mean monthly flows in major and minor tributaries. and<br />
mean annual volume del i vered to <strong>Tampa</strong> <strong>Bay</strong> ................ 20<br />
Mean annual constituent loads to <strong>Tampa</strong> <strong>Bay</strong> ............... 22<br />
Relation <strong>of</strong> sttrfr'cial and <strong>Florida</strong>n aquifers ttl <strong>Tampa</strong> <strong>Bay</strong><br />
along three axes .......................*...*......... 23<br />
General ized flow in the surf icial aquifer. September<br />
f 980 .................................. ....,............ 24<br />
vii
Number<br />
2 1 General ized flow in the <strong>Florida</strong>n Aquifer, September<br />
1980 .................................................... 24<br />
22 Area <strong>of</strong> potential discharge from the <strong>Florida</strong>n aquifer,<br />
September 1980 ........................................... 25<br />
2 3 Areas <strong>of</strong> physical change in <strong>Tampa</strong> <strong>Bay</strong> since 1880 A:<br />
1880-1972; B: 1972-1985 .................................. 26<br />
2 4 Seasonal changes in tidal duration curves at Cockroach<br />
<strong>Bay</strong> .................................................... 29<br />
2 5 Typical and extreme tides in <strong>Tampa</strong> <strong>Bay</strong> . . . . . . . . . . . . . . . . . . . 30<br />
2 6 Total tide height above MSL versus return period . . . . . . . . . 31<br />
27 Water movement during a typical flood tide in 1985 . . . . . . . 32<br />
28 Residual water movement after a complete tide cycle in<br />
1985 . . . . . . . . . . . . . . . . . . . . . . . . . . . . . . . . . . . . . . . . . . . . . , . . . . . . . 33<br />
2 9 Major circulation zones in <strong>Tampa</strong> <strong>Bay</strong> . . . . . . . . . . . . . . . . . . . . . 34<br />
3 0 Average tributary streamfl ow and tide-induced circul ation<br />
along longitudinal summary lines for 1880, 1972, and 1985<br />
1 eve1 s <strong>of</strong> development . . . . . . . . . . . . . . . . . . . . . . . . . . . . . . . . . , . . 35<br />
3 1 Tide-induced and streamflow flushing <strong>of</strong> example<br />
constituent along longitudinal summary line, from lower<br />
<strong>Tampa</strong> <strong>Bay</strong> to Hillsborough <strong>Bay</strong>, for 1880, 1972, and 1985<br />
levels <strong>of</strong> development ..................................... 35<br />
3 2 Trends in general water quality for body contact in <strong>Tampa</strong><br />
<strong>Bay</strong> since 1977 ........................................... 36<br />
3 3 Mid depth water temperature in areas <strong>of</strong> <strong>Tampa</strong> <strong>Bay</strong> since<br />
1975 ..................................................... 37<br />
3 4 Typical (A), high (B), and low (C) specific-conductance<br />
distributions in <strong>Tampa</strong> <strong>Bay</strong> . . . . . . . . . . . . . . . . . . . . . . . , , . . . . . . 39<br />
3 5 Stratification <strong>of</strong> dissolved oxygen (surface - bottom<br />
values) in Hillsborough <strong>Bay</strong> in relation to depth, 1981<br />
through 1983 ........................................ 40<br />
36 Mean annual dissolved oxygen near the bottom in <strong>Tampa</strong><br />
<strong>Bay</strong> ...................................................... 40<br />
3 7 Mean monthly dissolved oxygen near the bottom in <strong>Tampa</strong><br />
<strong>Bay</strong> ...................................................... 41<br />
38 Mean annual effective (Secchi) 1 ight penetration in <strong>Tampa</strong><br />
<strong>Bay</strong> ...................................................... 41<br />
39 Mean annual effective light penetration in 1982 ...,......<br />
viii
Number<br />
Changes in mean seasonal light penetration in 1983 .-.....<br />
<strong>Bay</strong>-wide distributions <strong>of</strong> 1 ight-related parameters in<br />
1982 .....................................................<br />
Relation <strong>of</strong> organic sol ids to transparency in <strong>Tampa</strong> <strong>Bay</strong> . .<br />
Average monthly turbidity and month1 y dredge-spoil<br />
praditction rate in (A) Millsborough <strong>Bay</strong>, and (B) South<br />
<strong>Tampa</strong> <strong>Bay</strong> ................................................<br />
Trend in phosphate concentrations in <strong>Tampa</strong> <strong>Bay</strong>, 1972<br />
through 1981<br />
.............................................<br />
Nutrient distribut,ians in <strong>Tampa</strong> <strong>Bay</strong> ......................<br />
Regional trend in (A)<br />
mean sediment grain size (phi) and<br />
(8) weight percent <strong>of</strong> carbonates in <strong>Tampa</strong> <strong>Bay</strong> ............<br />
Orthophosphate uptake by bay sediments ...................<br />
Anintonia uptake by bay sediments ........................<br />
Dissolved oxygen uptake by bay sediments ................<br />
Typical <strong>Tampa</strong> <strong>Bay</strong> phytopl ankton ..........................<br />
Estimated total drift algae standing crops in Hillsborough<br />
<strong>Bay</strong> during February 1983-April 1984 ......................<br />
Underwater photograph <strong>of</strong> flowering turtle grass (&a_I&sL%<br />
<strong>of</strong>f Snake Key in Lower <strong>Tampa</strong> <strong>Bay</strong> ............<br />
Seagrass meadow coverage in <strong>Tampa</strong> <strong>Bay</strong>, 1985 .............<br />
Estimated historical seagrass meadow coverage in Panipa<br />
<strong>Bay</strong>, ca. 1879 ............................................<br />
Seagrass meadow types in <strong>Tampa</strong> <strong>Bay</strong> .....................<br />
Typical seagrass meadow zonation in <strong>Tampa</strong> <strong>Bay</strong> ............<br />
Aerial photograpt <strong>of</strong> a perenni a1 heal thy fringe seagrass<br />
meadow <strong>of</strong>fshore <strong>of</strong> Bishops Harbor, Lower <strong>Tampa</strong> <strong>Bay</strong> .......<br />
Aerial photograph <strong>of</strong> a perennial mid-bay shoal seagrass<br />
meadow, Lower <strong>Tampa</strong> <strong>Bay</strong> ..................................<br />
Aerial photograph <strong>of</strong> a perenni a1 col oniting seagrass<br />
meadow, south side <strong>of</strong> Colrrrtney Campbell Causeway, Old<br />
fampa <strong>Bay</strong> .................................................<br />
Comparison <strong>of</strong> the numbers af species <strong>of</strong> fish and<br />
invertebrates cal iected from dense seagrass, sparse<br />
seagrass, and bare sand stat ions in tower <strong>Tampa</strong> <strong>Bay</strong> . , . . , .
Number<br />
Page<br />
61<br />
62<br />
<strong>The</strong> generalized distribution <strong>of</strong> mangrove forests and tidal<br />
....................................<br />
marshes in <strong>Tampa</strong> <strong>Bay</strong>..<br />
Typical form <strong>of</strong> the five dominant plant species found -in<br />
intertidal wetlands <strong>of</strong> <strong>Tampa</strong> <strong>Bay</strong> .........................<br />
Typical tidal marsh along the shores <strong>of</strong> <strong>Tampa</strong> <strong>Bay</strong> with<br />
dominant cover <strong>of</strong> black needlerush and a lower elevation<br />
fringe <strong>of</strong> smooth cordgrass ................................<br />
Di stri bution <strong>of</strong> mangroves on an undisturbed shore1 ine near<br />
Wo1 f Creek ...............................................<br />
Typical view <strong>of</strong> fringing red mangroves, Lower <strong>Tampa</strong> <strong>Bay</strong> . .<br />
Aerial photograph <strong>of</strong> view across a mangrove forest<br />
bordering Middle <strong>Tampa</strong> <strong>Bay</strong> ...............................<br />
Dead mangroves at Fish Creek in Old <strong>Tampa</strong> <strong>Bay</strong> ............<br />
Simple <strong>Tampa</strong> <strong>Bay</strong> food chain ..............................<br />
A general ized <strong>Tampa</strong> <strong>Bay</strong> food web .........................<br />
Life cycle <strong>of</strong> the pink shrimp ............................<br />
Mean densities <strong>of</strong> Anchoa spp. and sciaenid drum eggs and<br />
larvae reported in three studies <strong>of</strong> <strong>Tampa</strong> <strong>Bay</strong><br />
ichthyopl ankton ..........................................<br />
Trends in environmental parameters and benthic<br />
invertebrates, Hi 11 sborough <strong>Bay</strong> 1975-78 ..................<br />
Underwater photograph <strong>of</strong> a natural rock reef in Lower<br />
<strong>Tampa</strong> <strong>Bay</strong> .................................................<br />
Stomach content analysis <strong>of</strong> juvenile <strong>Tampa</strong> <strong>Bay</strong> red drum ..<br />
Life cycle <strong>of</strong> the red drum along <strong>Florida</strong>'s Gulf coast ....<br />
Stations and subareas <strong>of</strong> <strong>Tampa</strong> <strong>Bay</strong> sampled by the Bureau<br />
<strong>of</strong> Commercial Fisheries (<strong>National</strong> Marine Fisheries<br />
Service), August 1961 through June 1984.. .................<br />
Occurrence <strong>of</strong> immature commercially important fish and<br />
shellfish in <strong>Tampa</strong> <strong>Bay</strong>, by season and area ...............<br />
Brown pelican with young in nest in mangroves, Lower <strong>Tampa</strong><br />
<strong>Bay</strong><br />
......................................................<br />
Shore birds and wading birds feeding in McKay <strong>Bay</strong> ........<br />
Anoxic conditions in Hi1 1 sborough <strong>Bay</strong> ....................<br />
Commercial landings <strong>of</strong> spotted seatrout and red drum .....
Number<br />
82 If a1 1 the submerged lands dredged and filled in <strong>Tampa</strong> <strong>Bay</strong><br />
since 1880 were callected in one place, the area would<br />
equal all <strong>of</strong> the Interbay Peninsula south <strong>of</strong> Ballast<br />
Point, and surrounding shallow waters above a depth <strong>of</strong> 2<br />
meters .................................................. 107<br />
83 Tidal marsh creation on <strong>Tampa</strong> <strong>Bay</strong> ........................ 108<br />
84 <strong>Tampa</strong> <strong>Bay</strong> commercial shellfish and finfish landings .. . . . . . 109<br />
8 5 <strong>Florida</strong> House <strong>of</strong> Representatives Resolution 1170<br />
recognizing the importance <strong>of</strong> <strong>Tampa</strong> <strong>Bay</strong> . . . . . . . . . . . . . . . . . . 116
TABLES<br />
Number<br />
Page<br />
1 Surface-water discharge to <strong>Tampa</strong> <strong>Bay</strong> .....................<br />
2 Summary <strong>of</strong> areal measurements for subdivisions <strong>of</strong> <strong>Tampa</strong><br />
<strong>Bay</strong> .......................................................<br />
3 Relation <strong>of</strong> glacial periods to terraces near <strong>Tampa</strong> <strong>Bay</strong> . . .<br />
4 Tropical cyclones for past 50 years near <strong>Tampa</strong> <strong>Bay</strong> . . . . , . .<br />
5 Land use characteristics (Area, % Total Watershed) <strong>of</strong> four<br />
authentic rivers flowing to <strong>Tampa</strong> <strong>Bay</strong> ....................<br />
6 Rank <strong>of</strong> <strong>Tampa</strong> <strong>Bay</strong> tributaries by flow and load ...........<br />
7 Physical characteristics <strong>of</strong> major subareas <strong>of</strong> <strong>Tampa</strong> <strong>Bay</strong><br />
for 1880, 1972, and projected 1985 levels <strong>of</strong> development<br />
...................................................+.<br />
8 Tide relations in <strong>Tampa</strong> <strong>Bay</strong> ..............................<br />
9 Dissolved oxygen concentrations for bay areas ............<br />
10 Estimated annual phytopl ankton production rates in <strong>Tampa</strong><br />
<strong>Bay</strong> .....................................................<br />
11 Mangrove tree size by species and forest type in <strong>Tampa</strong><br />
<strong>Bay</strong> ......................................................<br />
12 Elevation ranges and mean elevations <strong>of</strong> 10 plant species<br />
occurring in the control area <strong>of</strong> an undisturbed mangrove<br />
community near Wolf Creek ................................<br />
13 Estimated annual production <strong>of</strong> primary producers based on<br />
areal coverage in the <strong>Tampa</strong> <strong>Bay</strong> system ...................<br />
14 Organic inputs to <strong>Tampa</strong> <strong>Bay</strong> from allochthonous sources ...<br />
15 Holoplankton commonly found in <strong>Tampa</strong> <strong>Bay</strong>, grouped by<br />
............................<br />
16 by Hopkins (1977) . . . . . . . . .<br />
17 Dominant meroplankton species collected by Blanchet et al.<br />
1977 and Phi 11 ips and Blanchet 1980 . . . . . . . . . . . . . . . . . . . . . .<br />
xii
Number<br />
Dominant fish egg and larval taxa as percent <strong>of</strong> all eggs<br />
or 1 arvae collected from three ichthyopl ankton surveys in<br />
<strong>Tampa</strong> <strong>Bay</strong> ................................................<br />
Major and minor species components for the invertebrate<br />
assemblages identified by Bloom et a1 . (1972) along three<br />
transects ................................................<br />
Summary <strong>of</strong> benthic infaunal data from three sites alo~ig a<br />
north to south gradient in <strong>Tampa</strong> <strong>Bay</strong> .....................<br />
<strong>The</strong> ten dominant fish species in <strong>Tampa</strong> <strong>Bay</strong> ...............<br />
Fish species reported as utilizing <strong>Tampa</strong> <strong>Bay</strong> as a nursery<br />
area .....................................................<br />
Birds associated with the marine environments <strong>of</strong> <strong>Tampa</strong><br />
<strong>Bay</strong> ......................................................<br />
Resource management issues in <strong>Tampa</strong> <strong>Bay</strong> ..................<br />
Estimated short term pollutant loadings to Hillsborough<br />
<strong>Bay</strong> by source ............................................<br />
Concentrations (pM) <strong>of</strong> nutrient nitrogen in <strong>Tampa</strong> <strong>Bay</strong> and<br />
other estuaries ..........................................<br />
Known economic benefits for selected aspects <strong>of</strong> <strong>Tampa</strong><br />
<strong>Bay</strong> ......................................................<br />
xiii
COWVERSlON TABLE<br />
Metric to U.S.<br />
Customary<br />
Mu1 tiply<br />
millimeters (mm)<br />
centimeters (cm)<br />
meters (m)<br />
meters (m)<br />
kilometers (km)<br />
kilometers (km)<br />
square meters (m2) 10.76<br />
square kilometers (km2) 0.3861<br />
hectares (ha) 2.471<br />
1 iters (1)<br />
cubic meters (m3)<br />
cubic meters (m3)<br />
milligrams (mg)<br />
grams (g)<br />
ki 1 ograms (kg)<br />
metric tons (t)<br />
metric tons (t)<br />
kilocalories (kcal)<br />
Celsius degrees (OC)<br />
To Obtain<br />
inches<br />
inches<br />
feet<br />
fathoms<br />
statute miles<br />
nautical mi les<br />
square feet<br />
square miles<br />
acres<br />
gal 1 ons<br />
cubic feet<br />
acre-feet<br />
ounces<br />
ounces<br />
pounds<br />
pounds<br />
shart tons<br />
British thermal units<br />
Fahrenheit degrees<br />
inches<br />
inches<br />
feet (ft)<br />
fathoms<br />
statute miles (mi)<br />
nautical miles (nmi)<br />
square feet (ft2)<br />
square miles (mi2)<br />
acres<br />
gallons (gal )<br />
cubic feet (ft3)<br />
acre-feet<br />
U. S. Customary to Metric<br />
25.40<br />
2.54<br />
0.3048<br />
1.829<br />
1.609<br />
1.852<br />
mi 11 imeters<br />
centimeters<br />
meters<br />
meters<br />
ki lometers<br />
kilometers<br />
square meters<br />
square ki 1 ometers<br />
hectares<br />
1 i ters<br />
cubic meters<br />
cubic meters<br />
ounces (02) 28350.0<br />
ounces (02) 28.35<br />
pounds (lb) 0.4536<br />
pounds (lb) 0.00045<br />
short tons (ton) 0.9072<br />
British thermal units (Btu) 0.2520<br />
Fahrenheit degrees (OF) 0.5556 (OF - 32)<br />
mi 11 igrams<br />
grams<br />
ki 1 ograms<br />
metric tons<br />
metric tons<br />
ki localories<br />
Celsius degrees<br />
xiv
Mary Parks and Anne Twi tchell provided va1 uabl e 1 i brary<br />
assistance at Mote Marine Laboratory. Laurie Fraser processed several<br />
drafts <strong>of</strong> text, and Denise Latulippe, Bob Whitman and Robert Dixon<br />
produced the figures. Data and reports were provided by Carl Goodwin,<br />
U.S. Geological Survey, <strong>Tampa</strong>; Rick Mi1 kins, Hillsborough County<br />
Environmental Protection Commission, <strong>Tampa</strong>; and the Southwest Fl crida<br />
Water Management District. Authors <strong>of</strong> review papers presented at the 1982<br />
<strong>Tampa</strong> <strong>Bay</strong> Area Scientific Information Symposium deserve special thanks for<br />
distilling the enormous body <strong>of</strong> original literature upon which this<br />
pr<strong>of</strong>ile is based. Nil li am Fehring, Ronjami n McPherson, Joseph L. Simon,<br />
Michael Hey1 , Joseph Carroll , Jr., Lorna Sicarel lo, Mil licent Quammen, and<br />
Edward Pendleton provided constructive criticism <strong>of</strong> early drafts. Kate<br />
Lyster and Beth Vairin edited the draft. Sue Lauritzen was responsible<br />
for layout design and graphics assistance.
CHAPTER 1. INTRODUCTlON<br />
1.1 TAMPA BAY AS A NATURAL UNIT<br />
<strong>Tampa</strong> <strong>Bay</strong>, <strong>Florida</strong>'s largest (1,030.8<br />
km2) open-water estuary, is a y-shaped<br />
embayment located on the west coast <strong>of</strong> the<br />
peninsula between latitude 27O30' and<br />
28°007N (Figure 1). <strong>The</strong> bay receives<br />
drainage from nine named rivers or streams<br />
(Table 1) in a watershed that covers<br />
approximately 5,700 km (Figure 2).<br />
<strong>Tampa</strong> <strong>Bay</strong> is subdivided into seven<br />
named subunits: Old <strong>Tampa</strong> <strong>Bay</strong>,<br />
Hi 11 sborough <strong>Bay</strong>, Middle <strong>Tampa</strong> <strong>Bay</strong>, Lower<br />
<strong>Tampa</strong> <strong>Bay</strong>, Boca Ciega <strong>Bay</strong>, Terra Ceia <strong>Bay</strong>,<br />
and the Manatee River (Figure 3, Table 2;<br />
Lewis and Whitman 1985). Other common<br />
place names used in this report - are<br />
indicated in Figure 3.<br />
<strong>The</strong> origins <strong>of</strong> the bay, structural or<br />
erosional, have not been clearly defined.<br />
White (1958) hypothesized that<br />
Hillsborough <strong>Bay</strong> and Lower <strong>Tampa</strong> <strong>Bay</strong> may<br />
have been formed by erosion in the valley<br />
<strong>of</strong> the Hillsborough River at a lower stand<br />
<strong>of</strong> sea level. Old <strong>Tampa</strong> <strong>Bay</strong> has no<br />
apparent relationship to any large stream<br />
and may have been connected to the Gwlf <strong>of</strong><br />
Mexico by the Lake Tarpon Trough<br />
(Hutchinson 1983).<br />
1.2 POLITICAL SUBUNITS OF THE BAY<br />
<strong>The</strong> pol i tical subdivi sions bordering<br />
the bay are shown in Figures 2 and 3;<br />
included are three major counties<br />
(Hi1 lsborough, Pine1 las, Ehnatee), three<br />
additional counties (Pasco, Polk, and<br />
Sarasota) that lie partly in the watershed,<br />
and three major cities (St.<br />
et2rsburg, Tarnpa, and Bradenton).<br />
Total population in the watershed is<br />
approximately 1.7 million, located in<br />
the three mjor cities and more than 45<br />
smaller cities and towns.<br />
<strong>The</strong> portion <strong>of</strong> the bay lying within<br />
Hillsborough County is owned by the <strong>Tampa</strong><br />
Port Authority, the remainder by the State<br />
<strong>of</strong> <strong>Florida</strong>. Various private 1 andowners<br />
have titles to submerged lands scattered<br />
along the edges <strong>of</strong> the bay.<br />
1.3 BIOLOGICAL SUBUNITS OF THE BAY<br />
<strong>Tampa</strong> <strong>Bay</strong> is classified as a<br />
subtropical estuary, a1 though the northern<br />
ha1 f, in particular, experiences 1 ow<br />
temperatures sufficient to ki 11 mangroves<br />
every 10 to 20 years (Wooten 1985). McCoy<br />
and Be1 1 (1985) discussed this controversy<br />
further but drew no definite conclusions.<br />
Each <strong>of</strong> seven named subunits <strong>of</strong> the<br />
bay consists <strong>of</strong> open water and vegetated<br />
intertidal zones, as listed in Table 2.<br />
Ninety-three per ent <strong>of</strong> the bay is open<br />
water (967.2 km 2 ), and 7% is vegetated<br />
intertidal area with mixtures <strong>of</strong> mangrove<br />
and tidal marsh vegetation.<br />
Around the periphery <strong>of</strong> the bay there<br />
is a shallow shelf varying in width from<br />
500 to 1,200 rn (Figure 4), with a maximum<br />
depth <strong>of</strong> approximately 1.5 m at its outer<br />
edge. Upon this submerged estuarine she1 f<br />
grow the majority <strong>of</strong> the algae and<br />
seagrasses in the bay. Outside <strong>of</strong> the<br />
shelf, the bay drops <strong>of</strong>f to natural depths<br />
<strong>of</strong> 7 m, with dredged channels as deep as<br />
13 m. Olson (1953) determined that the<br />
modal depth (the depth at 50% <strong>of</strong> the total<br />
bay area on a hypsographic curve) <strong>of</strong> the<br />
bay was 3 m and the mean depth 3.5 m. At<br />
the time <strong>of</strong> his measurements, the<br />
estuarine shelf made up 33% <strong>of</strong> the<br />
open-water area <strong>of</strong> the bay. This nas<br />
since been reduced substantially by<br />
dredging and filling <strong>of</strong> the bay's shallows<br />
and shore1 i nes (Lewi s 1977) .
Table 1. Surface water discharge to <strong>Tampa</strong> <strong>Bay</strong> (Hutchinson 1983).<br />
Average<br />
Period discharge Average<br />
<strong>of</strong> Drainage during annual<br />
Drainage record ~ ab<br />
y di chargeC<br />
Basin (years) a are$ (mi ) (lo6 gal/day) (108 gal/day)<br />
<strong>Tampa</strong> <strong>Bay</strong> and<br />
coastal areas<br />
Rocky Creek<br />
Sweetwater Creek<br />
Lake Tarpon Canal<br />
<strong>Tampa</strong> Bypass Canal<br />
Ungaged aread<br />
Hillsborough:<br />
Hi 11 sborough River<br />
Sulphur Springs<br />
Alafia:<br />
Alafia River<br />
Little Manatee:<br />
Little Manatee<br />
River<br />
Manatee :<br />
Manatee River<br />
Total<br />
a~eriod <strong>of</strong> record includes all measurements through 1977.<br />
b~ata from Conover and Leach (1975). Discharge is linearly<br />
adjusted to include ungaged drainage area in each basin.<br />
C<br />
Discharge in ungaged basins is assumed to be directly prodportional<br />
to discharge in gaged basins.<br />
Adjusted for diversions by City <strong>of</strong> <strong>Tampa</strong>.
..- . .- . . -<br />
-..-.-<br />
.***no-**<br />
<strong>Tampa</strong> <strong>Bay</strong> watershed<br />
L Major river drainage basins<br />
Other drainage<br />
Figure 2. <strong>The</strong> <strong>Tampa</strong> <strong>Bay</strong> area watershed extends into six counties.
Figure 3. Geographic subdivisions <strong>of</strong> <strong>Tampa</strong> <strong>Bay</strong> (from Lewis and Whitman 1985).<br />
1.4 POTENTIAL CONFLICTS AND IMPACTS<br />
<strong>Tampa</strong> <strong>Bay</strong> is an urbanized estuary in<br />
which development activities have<br />
substantially a1 tered natural processes<br />
(Taylor 1973; Simon 1974; Lewis 1977;<br />
<strong>Tampa</strong> <strong>Bay</strong> Regional Planning Council 1983,<br />
1985). It is estimated that 44% <strong>of</strong> the<br />
original intertidal wetlands and 81% <strong>of</strong><br />
the original seagrass meadow cover in the<br />
<strong>Bay</strong> have been destroyed either by dredging<br />
and filling or pollution (Lewis 1977;<br />
Lewis et a1 . 1985a). Water qua1 i ty has<br />
been degraded in much <strong>of</strong> the bay becau<br />
<strong>of</strong> the curren discharge <strong>of</strong> 7.2 x 10<br />
l/hr (190 x 105<br />
gal/yr) <strong>of</strong> treated sewage<br />
and industrial wastes, and historical<br />
discharges <strong>of</strong> untreated or poorly treated<br />
wastes (<strong>Tampa</strong> <strong>Bay</strong> Regional Pl anning<br />
Council, 1978). This figure does not<br />
include urban stormwater discharges.<br />
Continued expansion <strong>of</strong> the nation's 7th<br />
largest port at <strong>Tampa</strong> is expected, and the<br />
population is increasing by 50% per decade<br />
(<strong>Tampa</strong> <strong>Bay</strong> Regional Pl anni ng Counci l ,<br />
1985).<br />
f f
Table 2. Summary <strong>of</strong> areal measurements for subdivisions <strong>of</strong> <strong>Tampa</strong> <strong>Bay</strong> (Lewis and Whitman 1985).<br />
Total area Ooen water Emerqent wet1 and Length <strong>of</strong> Shore1 ine<br />
Subdivision namea mi2 km2 mi2 km2 mi2 km2 mi km2<br />
1. Old <strong>Tampa</strong> <strong>Bay</strong> 80.5 208.7 73.3 190.0 7.21 18.7<br />
2. Hillsborough <strong>Bay</strong> 40.2 105.3 38.4 100.8 1.76 4.6<br />
3. Middle <strong>Tampa</strong> <strong>Bay</strong> 119.7 309.9 113.1 292.9 6.55 17.0<br />
4. Lower<strong>Tampa</strong><strong>Bay</strong> 95.2 246.6 92.2 238.9 2.96 7.7<br />
5. Boca Ciega <strong>Bay</strong> 35.9 93.1 34.5 89.5 1.38 3.6<br />
6. Terra Ceia <strong>Bay</strong> 8.0 20.6 6.1 15.8 1.86 4.8<br />
7. Manatee River 18.6 54.6 12.7 39.3 5.92 15.3<br />
Total 398.1 1,038.8 370.3 967.2 27.64 71.7<br />
a Numbers correspond to subdivisions shown in Figure 3.<br />
With these confl icts becoming more<br />
apparent, an attempt to define bay-wide<br />
interests and management options for the<br />
bay was initiated with the formation <strong>of</strong> a<br />
<strong>Tampa</strong> <strong>Bay</strong> Study Committee. <strong>The</strong>ir final<br />
report was completed in 1983 (<strong>Tampa</strong> <strong>Bay</strong><br />
Regional Planning Council, 1983). <strong>The</strong><br />
legislatively supported committee<br />
submitted an extensive list <strong>of</strong> management<br />
recommendations to the <strong>Florida</strong> Legi sl ature<br />
in spring 1985 (<strong>Tampa</strong> <strong>Bay</strong> Regional<br />
Planning Council, 1985) and a regional<br />
Agency OR <strong>Bay</strong> Management currently is<br />
grappl i ng with these complex management<br />
issues.<br />
Figure 4. Vertical aerial photograph <strong>of</strong> the estuarine<br />
shelf surrounding <strong>Tampa</strong> <strong>Bay</strong>.
Figure 5. Major structural features <strong>of</strong> <strong>Florida</strong> (Chen 1965).<br />
<strong>The</strong> many thousands <strong>of</strong> feet <strong>of</strong><br />
sediments resting upon the basement <strong>of</strong> the<br />
<strong>Florida</strong> Plateau are organized into<br />
distinctive beds or formations. <strong>The</strong><br />
formations, which contain fossils,<br />
minerals, or sediments <strong>of</strong> particular<br />
characteristic sizes, have been assigned<br />
ages and are thereby sequenced from very<br />
old to recent. In southwest <strong>Florida</strong>,<br />
formations vary in thickness and in the<br />
manner <strong>of</strong> their contact with higher and<br />
lower formations. In places, erosion or<br />
the absence <strong>of</strong> a depositional environment<br />
has resulted in the absence <strong>of</strong> one or more<br />
formations.<br />
2.1.1. Geol osi cal Formations Relevant<br />
to <strong>Tampa</strong> Bav<br />
None <strong>of</strong> the geological formations<br />
bearing water or phosphate, exposed in or<br />
near the bay, or contributing to terrace<br />
soils are older than about 50 million<br />
years (Eocene epoch) . As mentioned,<br />
Eocene and 01 igocene formations contain<br />
little quartz or clay minerals, but<br />
following the Miocene closure <strong>of</strong> the<br />
Suwanee Channel (Miocene age, 25 myBP)<br />
quartz sand, mud, cherts, kaol in,<br />
dolomite, phosphate, and sif iceous fossils<br />
(Ball ast Point geodes) became increasingly
abundant, and it was during the Miocene<br />
that drainage and erosion began to create<br />
"modern" <strong>Tampa</strong> <strong>Bay</strong> (Stahl 1970).<br />
<strong>The</strong> oldest and deepest relevant<br />
formation is the Lake City Limestone, a<br />
150-m-thick fossilized bed at a depth <strong>of</strong><br />
600-800 m (Figure 6). This formation is<br />
the lower confining bed <strong>of</strong> the major<br />
artesian ground-water body, the <strong>Florida</strong>n<br />
Aquifer (Brown 1983), and is <strong>of</strong> an early<br />
Eocene age (ca. 50 myBP). A mid-Eocene<br />
bed some 200 m thick, the Avon Park<br />
Limestone, overlies the Lake City<br />
Formation and is the lower water-bearing<br />
element <strong>of</strong> the <strong>Florida</strong>n, although it is<br />
tapped by very few wells because <strong>of</strong> its<br />
depth (400-650 m). <strong>The</strong> Ocala Limestone is<br />
a later Eocene bed 100 m thick and a<br />
central aquifer formation. Only one<br />
01 igocene Epoch (25-35 myBP) formation<br />
occurs, the Suwanee Limestone. Like the<br />
SERIES<br />
FORMATION<br />
HYDROGEOLOGIC<br />
UNIT<br />
UNCONSOLIDATED<br />
FORMATION<br />
OLIGOCENE<br />
SUWANNEE<br />
FLORIDAN<br />
LIMESTONE<br />
OCALA GROUP<br />
FORMATION<br />
Figure 6. Hydrogeology <strong>of</strong> the <strong>Tampa</strong> <strong>Bay</strong> area (after Wehle 1978).
Ocala bed below it, the Suwanee may<br />
contain highly mineral ized water.<br />
<strong>The</strong> upper confining beds <strong>of</strong> the<br />
<strong>Florida</strong>n Aquifer are <strong>of</strong> Miocene age. <strong>The</strong><br />
deeper <strong>Tampa</strong> Limestone Formation (a1 so<br />
called the St. Marks) contains phosphatic<br />
and silicified beds, <strong>of</strong>ten with fossils.<br />
Solution cavities are common and water<br />
yield can be good because <strong>of</strong> proximity to<br />
the underlying <strong>Florida</strong>n Aquifer. <strong>The</strong> top<br />
<strong>of</strong> the <strong>Tampa</strong> Limestone Formation, and the<br />
late Miocene Hawthorn Formation, contain<br />
quartz and clay minerals which may carry a<br />
minor artesian aquifer containing low<br />
mineral 1 oads .<br />
A youthful (late Miocene or Pliocene<br />
epoch) Bone Valley Formation <strong>of</strong> quartz and<br />
phosphate sand and gravel overlies the<br />
Hawthorn. Mostly east <strong>of</strong> <strong>Tampa</strong> <strong>Bay</strong> the<br />
Bone Valley Formation varies in thickness<br />
up to 20 m and may be found near the<br />
surface to a epth <strong>of</strong> 30 m. Covering<br />
about 5,200 km 4 <strong>of</strong> the <strong>Florida</strong> Coastal<br />
Plain, this formation is a major source <strong>of</strong><br />
comrnerci a1 phosphate. <strong>The</strong> Bone Val 1 ey<br />
Formation, or different formations near<br />
the surface at other places, may be<br />
covered by as much as 40 m <strong>of</strong><br />
undifferentiated sand, clay, or marl <strong>of</strong><br />
Pleistocene (1-3 myBP) or recent age.<br />
Along with older sediments <strong>of</strong> the<br />
interior, the more recent coastal sands<br />
have been extensively modified by past<br />
stands <strong>of</strong> sea level, weathering, and<br />
development <strong>of</strong> a karst topography and can<br />
sustain a freshwater aquifer. <strong>The</strong> location<br />
<strong>of</strong> formations around the bay is shown in<br />
Figure 7. <strong>The</strong> formations generally dip<br />
toward the south and thicken toward the<br />
south and east following the configuration<br />
<strong>of</strong> the ancient South <strong>Florida</strong> Basin,<br />
because <strong>of</strong> erosion during periods <strong>of</strong><br />
higher sea level. <strong>The</strong> Hawthorn Formation<br />
is a thin veneer under much <strong>of</strong><br />
Hillsborough County and is missing<br />
completely from the bed <strong>of</strong> the<br />
Hi1 lsborough River.<br />
2.1.2. <strong>The</strong> Effects <strong>of</strong> Glaciation<br />
While no glaciers ever formed on the<br />
<strong>Florida</strong> Peninsula, their effect on the<br />
west central coast was pr<strong>of</strong>ound, <strong>The</strong><br />
great glaciations (Tab1 e 3) occurred<br />
during the Pleistocene Epoch, beginning<br />
about 3 mill ion years ago.<br />
LEQEND: SERIES STAGE FORMATION<br />
kTa MIOCENE ALUMBLUFF HAWTHORN<br />
hvg MIOCENE TAMPA ST. MARKS<br />
1 * L<br />
[TI 111l] MIOCENE CHOCTAWACHEE BONE VALLEY<br />
Figure 7. Geologic formations <strong>of</strong> the <strong>Tampa</strong> <strong>Bay</strong> area<br />
(Roush 19851.<br />
Sea level dropped during glaciations<br />
and rose during interglaci a1 periods--so<br />
much so that the peninsula was greatly<br />
exposed or inundated. <strong>The</strong> severity <strong>of</strong><br />
inundation was moderated with each<br />
successive period, so that the peninsula<br />
was cut into terraces by erosion during<br />
the maximum stand <strong>of</strong> each corresponding<br />
sea level (Figure 8). <strong>The</strong> terraces<br />
resulting from the Sangamon i ntergl aci a1<br />
period shaped the land surface around the<br />
bay. <strong>The</strong> terraces are most conspicuous<br />
between the Alafia and Little Manatee<br />
Rivers, but die out on the south valley<br />
wall <strong>of</strong> the Alafia (White 1970); they are<br />
still evident on the east side <strong>of</strong> Pinellas
Table 3. Relation <strong>of</strong> glacial periods to terraces near <strong>Tampa</strong> <strong>Bay</strong> (adapted from Wilhelm and Ewing<br />
1972).<br />
Gl aci a1 Maxi mum Interglacial<br />
(erosional ) advance deposition<br />
period (years BP) period Terrace Elevation (fta)<br />
Late Wisconsin 40,000<br />
Si 1 ver<br />
Bl uff + 6<br />
Peor i an Pam1 i co + 25<br />
Early Wisconsin 110,000 Sang amon Tal bot + 42<br />
Fenholl oway + 70<br />
Wicomico +lo0<br />
Illinoian 300,000<br />
Kansas 660,000<br />
aAbove sea 1 eve1 .<br />
Okeefenokee<br />
Yarmouth Sunder1 and<br />
Coharie<br />
+I70<br />
t215<br />
Aftoni an Brandywi ne +270<br />
County (Roush 1985). By the late sand, with less than 5% silt or clay.<br />
Wisconsin, transgressing and receding seas Analyses have shown that the finest<br />
had etched and filled rivers, mixed particles have quartz, montmorillonite, and<br />
carbonate and quartz sediments across the kaol ini te as their principal minerals<br />
coastal plain <strong>of</strong> west <strong>Florida</strong>, and cut the (Roush 1985).<br />
<strong>Tampa</strong> Valley, which was filled in during<br />
the Holocene (Recent) rise <strong>of</strong> the sea <strong>The</strong> absence <strong>of</strong> fine - grained<br />
(Figure 9). terrestri a1 sediment and soils accounts<br />
for the low sediment loads in tributaries<br />
In general, surface sands in terraces to the bay and for the relatively small<br />
above the Pamlico Terrace are regarded as amount <strong>of</strong> silt-clay in bay sediment.<br />
pre-Pleistocene (Brooks 1974) and terrace, Sediments were delivered to the bay when<br />
coastal, and bay sediments are Plei stocene rivers were competent during 1 ower stands<br />
or later. Soils surrounding the bay are <strong>of</strong> sea level. Now, tributaries to the bay<br />
derived from carbonate-rich siliceous are at grade and neither transport much<br />
sands <strong>of</strong> marine origin rather than sediment nor downcut their beds (Goodell<br />
phosphatic or organic mixtures with and Gorsline 1961). Of five original<br />
silica. Phosphatic soils are most rivers, only the Hillsborough built a<br />
prevalent in Hillsborough County, delta at its entry to the bay (a marsh<br />
representing about 5% <strong>of</strong> the total county displaced by Davis Island), perhaps<br />
area. About one-fourth <strong>of</strong> a11 soils in because <strong>of</strong> the river's relative recency<br />
Hi1 1 sborough County and nearly one-ha1 f in (White 1958).<br />
Manatee County are <strong>of</strong> the Leon fine sand<br />
type. In Pinellas County, Myakka fine 2.1.3. Development <strong>of</strong> the Modern Bav<br />
sand is most abundant, making up about<br />
one-fifth <strong>of</strong> the soils. Both these soils <strong>The</strong> shape <strong>of</strong> <strong>Tampa</strong> <strong>Bay</strong> is the result<br />
are dominated by primarily 0.10- to 0.25-mm <strong>of</strong> movements in the course <strong>of</strong> rivers and a
-x-.-.--.--.<br />
, -<br />
) 1 10 .I .i,O"lll"I<br />
Silver Bluff<br />
- < m -I_: -<br />
I /O ,, %,.c>Ms
River it1 earlier days (Stahl 1970), or by<br />
discharges <strong>of</strong> Lake Tarpon (Hutchinson<br />
1983), which until recently was a brackish<br />
tidal body connected underground to the<br />
gulf (Hunn 1975). Equally problematic is<br />
the re1 ationship between the Wi thl acoochee<br />
and Hillsborough Rivers (and perhaps the<br />
Palm River). Even today, waters <strong>of</strong> the<br />
Wi thl acoochee overf l ow into the<br />
Hillsborough River drainage, and both<br />
rivers are regarded as youthful geological<br />
features (White 1958, 1970). Boca Ciega<br />
<strong>Bay</strong> is only about 5,000 years old and<br />
resulted primarily from longshore sediment<br />
transport and barrier island formation<br />
(Stahl 1970).<br />
Sediments in <strong>Tampa</strong> <strong>Bay</strong> are quartzitic<br />
with carbonate mixtures. <strong>Bay</strong> sediments<br />
derive from reworking <strong>of</strong> terrace deposits,<br />
in situ production and weathering <strong>of</strong><br />
shell, and inshore movement <strong>of</strong> gulf<br />
sediment. Immense deposits <strong>of</strong> oyster<br />
shell under1 ie Hillsborough <strong>Bay</strong> and have<br />
been mined for many years for fi 11 .<br />
Sea level has risen during the past<br />
10,000 years at a diminishing, slow rate<br />
(Figure 10). In the past 4,500 years the<br />
sea has risen about 3 m with some<br />
fluctuations (Brooks 1974), about 30 cm <strong>of</strong><br />
the rise occurring from 1550-1850, and<br />
20-25 cm <strong>of</strong> it since 1870 (Swanson 1974).<br />
<strong>The</strong> rising sea has etched the estuarine<br />
shorelines <strong>of</strong> the bay, confused zonation<br />
patterns in mangrove forests (Estevez and<br />
Mosura 1985), structured the direction and<br />
rate <strong>of</strong> longshore sediment movement on the<br />
gulf beaches, and trapped sediments in the<br />
bay. According to Brooks (1974),<br />
"backfilling <strong>of</strong> the estuary from sediments<br />
derived from <strong>of</strong>fshore began about 8,000<br />
years ago. Considering the fact that the<br />
average depth <strong>of</strong> the bay is now less than<br />
Figure 10. Sea level on the southwest <strong>Florida</strong> coast<br />
(Scholl and Stuvier 19671.<br />
Zmo<br />
tow<br />
ten feet, the thickness and volume <strong>of</strong><br />
recent sediments are astounding." Meads<br />
suggested that weak estuaries such as<br />
<strong>Tampa</strong> <strong>Bay</strong> export little fine sediment, a<br />
point supported by mathematical models<br />
(Ross et al. 1984).<br />
2.2 THE HYDROLOGIC CYCLE<br />
<strong>The</strong> amount <strong>of</strong> freshwater in <strong>Tampa</strong> <strong>Bay</strong><br />
and hence the salinity <strong>of</strong> the bay depend<br />
at any given time on positive effects <strong>of</strong><br />
ra i nfal 1 , run<strong>of</strong>f , and ground water effl ux ,<br />
and negative effects <strong>of</strong> evapotranspi ration,<br />
consumptive uses, and ground water<br />
influx (Figure 11).<br />
<strong>The</strong> <strong>Tampa</strong> <strong>Bay</strong> Region is located in a<br />
zone <strong>of</strong> transition between a temperate,<br />
continental cl imate and a tropical,<br />
Caribbean one. Centrally located on the<br />
west peninsular coast, the bay area is<br />
protected from oceanic influences by the<br />
Peninsular Arch to the east and the broad<br />
Continental Shelf to the west. Although<br />
the bay area is a well-documented<br />
biogeographic divide (Long and Lake1 a<br />
1971; McCoy and Bell 1585), latitudinal<br />
gradients <strong>of</strong> weather are gradual.<br />
According to Jordon (1972), the only<br />
abrupt weather changes along the entire<br />
eastern gulf occur at the coastline where<br />
oceanic and 1 and-dominated forces clash.<br />
<strong>The</strong> bay is affected by warm,<br />
re1 atively humid summers resulting from<br />
the Bermuda high pressure cell and by<br />
mild, relatively dry winters when<br />
continental air masses prevail. Because<br />
moderate amounts <strong>of</strong> rain fall in the<br />
spring, it is useful to distinguish three<br />
categories <strong>of</strong> weather from an ecological<br />
point <strong>of</strong> view. <strong>The</strong> warm, dry period<br />
occurs from late April to mid-June. <strong>The</strong><br />
warm, wet period coincides with summer and<br />
early fa1 1 . <strong>The</strong> cold period spans<br />
November to April and becomes<br />
progressively drier, a1 though cold fronts<br />
may cause short periods <strong>of</strong> heavy rain in<br />
January or February.<br />
Little is known <strong>of</strong> micrometeorological<br />
conditions around <strong>Tampa</strong> <strong>Bay</strong><br />
proper, which is protected from frontal<br />
passages by gradual terraces around more<br />
than 300° <strong>of</strong> its perimeter (being open to<br />
the gulf on the southwest). <strong>The</strong> upper
PRECIPfTATION . <<br />
I<br />
CONBENBATION<br />
. 1-"<br />
\ **IT ---<br />
TAMPA BAY<br />
Flgurs 11. Generallred hydrologlc cycle for the <strong>Tampa</strong> <strong>Bay</strong> area (from Culbreath et al. 1985).<br />
bays are divided by a low peninsula and low-level formations, result from winter<br />
have their longest fetches perpendicular sea-air temperature differences and summer<br />
to one another; the whole bay is separated land-sea temperature gradients (Leipper<br />
from the gulf by the Pinellas Peninsula, 1954, Jordan 1972).<br />
which has a maximum elevation <strong>of</strong> 30 m and<br />
falls rapidly across Pleistocene terraces<br />
into Old <strong>Tampa</strong> <strong>Bay</strong>. Land north <strong>of</strong> the bay<br />
is mostly open and very wet. Land to the<br />
east and south is also open but better<br />
drained,<br />
2.2.1<br />
<strong>Tampa</strong> <strong>Bay</strong> is subject to an average af<br />
66% <strong>of</strong> the sunshine possible in a year.<br />
Average gaily solar radiation is 444 ::<br />
gm-cal/cm (Lan leys), with a January low q! '.'<br />
(311 cjm-cal Jcm 9 ) and May high (599 :"<br />
gm-cal/cm2). Insolation is closely '.*<br />
related to evapotranspiration (Figure 12).<br />
Mean annual cloud cover varies r'rotil<br />
40% to 60% because <strong>of</strong> convective showers<br />
in summer and extratropical fronts in FkWre 12. Mean monthly pan evaporation and solar<br />
winter. Cumul us cl ouds, the most common gnsalatian near <strong>Tampa</strong> (after Drew et al., unpubl.).<br />
14
2.2.2 Atmos~heric Pressure and Wind 2.2.3. Tem~erature<br />
Pressure varies diurnally and<br />
seasonally. A daily minimum pressure in<br />
the early morning is followed by a late<br />
morning maximum and evening minimum, then<br />
by a lesser nocturnal maximum. This<br />
atmospheric pressure cycle resembles the<br />
mixture <strong>of</strong> diurnal and semidi urnal oceanic<br />
tides in the bay. Superimposed over the<br />
daily variations is a seasonal pattern,<br />
albeit a modest one even in winter because<br />
<strong>of</strong> the effects <strong>of</strong> the Bermuda cell. Mean<br />
monthly pressure rises steadily from<br />
September to January then declines through<br />
spring. Mean annual pressure at sea level<br />
is 1017.7 millibars.<br />
Low pressure centers are <strong>of</strong> local,<br />
tropical or continental origin and range<br />
in magnitude from evanescent fronts to<br />
tropical storms and hurricanes. Jordan<br />
(1973) reported the occurrence <strong>of</strong> about<br />
one low pressure center moving ashore on<br />
the <strong>Florida</strong> gulf coast per year over a<br />
15-year period (excluding tropical<br />
cycl ones and hurricanes) . No seasonal<br />
variation in frequency <strong>of</strong> the centers was<br />
evident.<br />
Rapid pressure changes accompany<br />
"northers," periods <strong>of</strong> 1 to 3 or 4 days<br />
when windspeeds exceed 20 knots. Between<br />
15 and 20 northers pass <strong>Tampa</strong> <strong>Bay</strong> each<br />
year, mostly between November and March<br />
(Lei pper 1954) .<br />
Wooten (1985) summarized temperature<br />
data for the <strong>Tampa</strong> <strong>Bay</strong> area. Mean annual<br />
temperature based on four decades <strong>of</strong><br />
records at <strong>Tampa</strong> is 22.3OC. Mean monthly<br />
low and high temperatures are 16.0°C and<br />
27.8OC in January and August,<br />
respectively. Warming is most rapid in<br />
March-April and cooling most rapid in<br />
October - November (Figure 13). Extreme<br />
low and high temperatures are -7.8OC<br />
(1962) and 36.7OC.<br />
Temperature trends vary wound the<br />
bay area. Air temperatures in St.<br />
Petersburg are moderated by proximity to<br />
the Gulf <strong>of</strong> Mexico, whereas temperatures<br />
become more extreme inland along the<br />
floodplains <strong>of</strong> major rivers.<br />
1 MONTH 1<br />
1-1 t < 1<br />
-6.0 10.1 21.4 28.4<br />
[FEBj<br />
--<br />
- --<br />
- -<br />
V l<br />
Vl<br />
<strong>The</strong> intrusion <strong>of</strong> cold winter air into 1 7 1<br />
-5.8 11.0 25.8 31.1<br />
-0.8 13.6 24.4 33.3<br />
f<br />
-<br />
--<br />
9.4 19.4 30.8 35.8<br />
-<br />
15.0 22.2 32.1 36.7<br />
the bay area is accompanied by<br />
northwesterly winds, a1 though north and JuLI ,-<br />
northeasterly winds prevail between 17.2 23.1 32.2 36.7<br />
frontal passages from October to February +<br />
(NOAA 1982). Winter wind speeds do not 18.9 23.3 , 32.3 I 36.1<br />
vary significantly from summer speeds.<br />
<strong>The</strong> range <strong>of</strong> mean monthly windspeed varies I<br />
I<br />
--<br />
-<br />
12.2 22.5 31.7 35.8<br />
by only 2.2 knots; the annual mean wind<br />
velocity (resultant vector) is 7.5 knots, 1 7 1 -<br />
28.9 35.0<br />
from the east. Periods <strong>of</strong> higher wind 4.4 18.8<br />
occur during summer squall s, hurricanes, v] I<br />
9 -<br />
i 4<br />
and tornadoes. <strong>The</strong> highest <strong>of</strong>ficial<br />
-5.0 13.4 25.0 32.2<br />
windspeed, SE 65.2 knots, was recorded for 17 - --*---<br />
--- - --<br />
a 5-minute period at <strong>Tampa</strong> during the -7.8 10.7 222 30.0<br />
Labor Day hurricane <strong>of</strong> 1935. Although ,<br />
-1;<br />
tornadoes are more common in the bay area -4 6 lb lb 20 25 30 35 40<br />
than elsewhere in <strong>Florida</strong> (mean occurrence TEMPERATURE 'C<br />
<strong>of</strong> 27 tornado-days/year), no data on the<br />
speeds <strong>of</strong> winds associated with tornadoes Figure 13. Mean monthly temperature and extremes<br />
are avai 1 abl e. for <strong>Tampa</strong> <strong>Bay</strong> (Wooten 1985).<br />
15<br />
--
2.2.4. Eva~otrans~i ration and Re1 ative<br />
Humidity<br />
Evaporative and transpi rative flux<br />
data for the actual bay are lacking, but<br />
Simon (1974) reported 162.6 cm <strong>of</strong> Class A<br />
pan evaporation, and Vishner and Hughes<br />
(1969) gave lake evaporation rates <strong>of</strong><br />
127-132 cm/yr for the area surrounding<br />
<strong>Tampa</strong> <strong>Bay</strong> and described a "surplus water"<br />
gradient from 0 on the coast to about 15<br />
cm in the upper Hillsborough River Basin.<br />
Seasonal variations in evaporation are<br />
given by Figure 12. Quantitative data on<br />
evapotranspiration rates in major biotic<br />
communities in and around the bay are<br />
needed.<br />
u ---<br />
JAM 20.4<br />
5.7<br />
MAR 32.1<br />
7.4<br />
APR 16.7<br />
6.3<br />
MAY I<br />
-<br />
I 44.8<br />
JUN<br />
JUL<br />
7.0<br />
4.7 17.6<br />
5.0 10.8<br />
-- 35.0<br />
- 52.0<br />
Relative humidity computed as monthly [ AUG<br />
1 i<br />
means at <strong>Tampa</strong> range from 53% to 80%. 8.0 20.3 1<br />
Lowest mean relative humidity occurs in<br />
November, and the highest monthly average I SEP 1 ,<br />
is in August. In a typical day, mornings 3.3 16.8<br />
are more humid than afternoons, and dew [ oc T 18.7<br />
will form in a typical evening (Wooten 6.6<br />
1985).<br />
16.6<br />
2.2.5. Fos and Rain<br />
Heavy fog occurs on 23 to 25 dayslyr,<br />
mostly from November to March. Ground<br />
fogs are more common in basins and river<br />
corridors, and all fogs are more common at<br />
night than in the daytime.<br />
Monthly rainfall patterns and the<br />
existence <strong>of</strong> a slight peak <strong>of</strong> rainfall in<br />
March are illustrated in Figure 14. About<br />
60% <strong>of</strong> all rainfall occurs in the wet<br />
season <strong>of</strong> June through September, a period<br />
when some rain fell even in the driest <strong>of</strong><br />
years. Wooten (1985) noted that rainfall<br />
was above average from the 1930's to the<br />
1950's and has been below average since<br />
the 1960's. Henry and Dicks (1984)<br />
verified long-term drought patterns in the<br />
southeastern United States but pointed out<br />
that weather in central and south <strong>Florida</strong><br />
(beginning in the area <strong>of</strong> <strong>Tampa</strong> <strong>Bay</strong>) has<br />
not correlated we1 1 with the southeast<br />
region with respect to rainfall,<br />
especially in the 1960-1980 period.<br />
Light showers are more common than<br />
heavy rains. Rainfall at <strong>Tampa</strong> averaged<br />
123.7 cm for the period 1943-82. <strong>The</strong><br />
wettest and driest years were 1959 and<br />
1956, with 194.5 cm and 73.4 cm,<br />
--<br />
DEC 16.0<br />
6.2<br />
4 36.6<br />
RAINFALL<br />
(CENTIMETERS)<br />
- 47.2<br />
Figure 14. Mean monthly rainfall and extremes for<br />
<strong>Tampa</strong> <strong>Bay</strong> (Wooten 1985).<br />
respectively. <strong>The</strong> lowest monthly mean<br />
rainfall (trace amounts) occurred in<br />
January (1950), April (1967 and 1981), and<br />
November (1960). <strong>The</strong> highest monthly mean<br />
rainfall was in July 1960, when 52.3 cm <strong>of</strong><br />
rain was recorded at <strong>Tampa</strong>. Palmer (1978)<br />
determined that mean annual rainfall<br />
increases concentrically from <strong>Tampa</strong><br />
(Figure 15).<br />
2.2.6. Thunderstorms and Hurricanes<br />
Thunderstorms are a common el ement <strong>of</strong><br />
bay-area weather. About 60-100 occur in<br />
an average year, over 85-90 days, with the<br />
largest number from June through<br />
September. Offshore storms are more<br />
common at night, whereas inland<br />
thunderstorms occur more <strong>of</strong>ten during the
day due to convective patterns in the<br />
lower atmosphere.<br />
Tropical cyclones (tropical storms<br />
and hurricanes) are much less frequent<br />
(Table 4). Most <strong>of</strong> these storms enter the<br />
bay area from the southeast to southwest.<br />
From 1901 to 1971, 93 tropical cyclones<br />
crossed the <strong>Florida</strong> west coast from<br />
Apalachicola south to Venice; 70 struck<br />
from August through October. <strong>Tampa</strong> <strong>Bay</strong><br />
has not been directly hit by a tropical<br />
cyclone since 1848, when the pioneer city<br />
<strong>of</strong> <strong>Tampa</strong> was nearly destroyed. However,<br />
near hits have caused storm surges <strong>of</strong> more<br />
than 3 m; the highest storm surge was<br />
recorded in 1921 when a 3.2-m surge above<br />
mean low water flooded coastal areas.<br />
Today, flood zoning recognizes elevations<br />
<strong>of</strong> 2.5-4.0 m as the 1 imit to storm surges<br />
with a recurrence probabi 1 i ty <strong>of</strong> 100<br />
years.<br />
Ecological effects <strong>of</strong> large storms on<br />
<strong>Tampa</strong> <strong>Bay</strong> and adjacent areas are not well<br />
studied but are 1 i kely to include raising<br />
<strong>of</strong> water tables, replenishing <strong>of</strong> soil<br />
moisture, flushing <strong>of</strong> tributaries and<br />
Figure 15. Mean annual rainfall in inches across the redistribution <strong>of</strong> sediments, dispersal <strong>of</strong><br />
<strong>Tampa</strong> <strong>Bay</strong> region (Palmer 1978). propagul es, export <strong>of</strong> organic matter from<br />
Table 4. Tropical cyclones for past 50 years near <strong>Tampa</strong> <strong>Bay</strong> (H = hurricane: TS = tropical<br />
storm) (Wooten 1985).<br />
Type storm Month-year<br />
Path with respect to <strong>Tampa</strong> <strong>Bay</strong><br />
Sept. 1930<br />
Aug. 1933<br />
Sept. 1933<br />
Sept. 1935<br />
July 1937<br />
Sept. 1941<br />
Oct. 1941<br />
Oct. 1944<br />
Sept. 1945<br />
Oct. 1947<br />
Sept. 1950<br />
Sept. 1960<br />
Oct. 1968<br />
Sept. 1985<br />
Moved over northern shores <strong>of</strong> <strong>Bay</strong>.<br />
Moved westward 45 km south <strong>of</strong> <strong>Bay</strong>.<br />
Moved northwestward 75 km NE <strong>of</strong> <strong>Bay</strong><br />
Moved northward 75 km west <strong>of</strong> <strong>Bay</strong>.<br />
Moved northeastward across <strong>Bay</strong>.<br />
Moved northwestward 48 km NE <strong>of</strong> <strong>Bay</strong>.<br />
Moved northwestward 65 km SE <strong>of</strong> <strong>Bay</strong>.<br />
Moved northward through eastern Hi1 1 sborough<br />
County.<br />
Moved northward 75 km E <strong>of</strong> <strong>Bay</strong>.<br />
Moved northward 10 km inland <strong>of</strong> Pinell as<br />
coast.<br />
Moved eastward 50 km N <strong>of</strong> <strong>Bay</strong>.<br />
Moved northward 55 km E <strong>of</strong> <strong>Bay</strong>.<br />
Moved northeastward 60 km N <strong>of</strong> <strong>Bay</strong>.<br />
Moved northward 90 km W <strong>of</strong> <strong>Bay</strong>.
tidal marshes and forests, and the<br />
temporary extirpation <strong>of</strong> estuarine biota.<br />
2.3 SURFACE AND GROUND WATERS<br />
2.3.1. Overview <strong>of</strong> Tributaries to Tam~a<br />
Bav<br />
Four natural rivers--the Hill sborough,<br />
A1 afia, Little Manatee and Manatee--<br />
flow to <strong>Tampa</strong> <strong>Bay</strong>. Another, the Palm<br />
River, once drained lands between the<br />
Hi 11 sborough and A1 afi a Rivers, but has<br />
been completely channelized and controlled<br />
since 1970 and now is called the <strong>Tampa</strong><br />
Bypass Canal. <strong>The</strong> Lake Tarpon outlet to<br />
Old <strong>Tampa</strong> <strong>Bay</strong> is a significant human-made<br />
tributary completed in 1971. <strong>The</strong><br />
Hillsborough and Manatee (and its<br />
tributary, the Braden River) are impounded<br />
as municipal reservoirs. Some <strong>of</strong> the flow<br />
<strong>of</strong> the Little Manatee is withdrawn for<br />
power plant cooling water, but it is<br />
otherwise regarded to be the least<br />
disturbed river flowing to <strong>Tampa</strong> <strong>Bay</strong>. <strong>The</strong><br />
A1 afi a has been affected by phosphate<br />
mining and processing and is impounded at<br />
p aces.<br />
Manatee (570 km2) (Turner 1979). From<br />
north to south, their respective<br />
floodplains are progressively wider and<br />
tidally affected over longer distances.<br />
Thus, tidal action may be detected in the<br />
Hi1 1 sborough River at kilometer 17.7 where<br />
the river is dammed and at kilometer 16.0<br />
in the Alafia River (Menke et al. 1961).<br />
<strong>The</strong> Little Manatee River is tidal to<br />
kilometer 24.0, and the Manatee is tidal<br />
at least to Rye Bridge (kilometer 30.0)<br />
(Manatee Co. Utilities and Camp, Dresser &<br />
McKee, Inc. 1984). Intertidal habitats<br />
(e.g., oyster bars, marsh shore1 ines,<br />
islands) are correspondingly more abundant<br />
in the rivers farther south.<br />
<strong>The</strong> northern rivers (Hillsborough,<br />
Alafia) are more urbanized than the<br />
southern ones, which still contain more<br />
than 90% <strong>of</strong> their respective watersheds in<br />
wet1 ands, forest, range or farmland (Table<br />
5). <strong>The</strong> Little Manatee Watershed has been<br />
urbanized or laid barren less than the<br />
others.<br />
2.3.2. Flows<br />
<strong>The</strong> four rivers all rise to the east <strong>Tampa</strong> <strong>Bay</strong> as a whole has a 4, 623-km2<br />
<strong>of</strong> <strong>Tampa</strong> <strong>Bay</strong> and flow 65-80 km southwest basin and receives about 3.8 billion<br />
or west, falling an average <strong>of</strong> about 10-40 liters <strong>of</strong> run<strong>of</strong>f daily, with most (77%)<br />
cm/km. <strong>The</strong> Hillsborough watershed is flowing into Hi1 1 sborough <strong>Bay</strong>.<br />
largest, b684 km2, followed y the Alafia Approximately 85% <strong>of</strong> all flow to the bay<br />
(1,088 km ); Manatee (907 km 4 ) and Little consist <strong>of</strong> the discharges <strong>of</strong> the four<br />
Table 5. Land use characteristics (% total watershed area) <strong>of</strong> four authentic rivers flowing<br />
to <strong>Tampa</strong> <strong>Bay</strong> (from FDER 1982).<br />
Hi 11 sborouqh<br />
Little<br />
Land use Upper Lower A1 af i a Manatee Manatee<br />
Agriculture 52.3 40.0 35.9 45.9 38.3<br />
Range 16.1 17.1 17.1 34.9 41.3<br />
Forest 2.8 1.0 13.5 7.4 3.6<br />
Wet1 and 13.9 17.2 9.2 7.5 3.6<br />
Urban 12 -6 21.5 10.4 2.7 5.4<br />
Barren 1.3 1.1 11.5 0.4 0.6<br />
18
ivers (Figure 16). <strong>The</strong> mean annua Little Manatee: 225 x lo9 l/year) (Dooris<br />
discharge <strong>of</strong> the Hillsborough (580 x lo4 and Dooris 1985). If discharge and<br />
1/ ear) exceeds the others (Alafia: 425 x watershed are compared, the Alafia and<br />
104<br />
l/year; Manatee: 260 x lo9 l/year; Little Manatee Rivers yield more water<br />
Figure 16. Mean monthly flow in major tributaries to <strong>Tampa</strong> <strong>Bay</strong> (adapted from Drew et at., unpubl.).<br />
19
(1.9 and 1.1 ratio <strong>of</strong> mean annual flow to MEAN MONTt1LY FLOW (CFS)<br />
area, respectively) than the Hi 11 sborough<br />
(0.9) or Manatee Rivers (0.7).<br />
Numerous lesser tributaries and three<br />
major flood control channels also drain<br />
into <strong>Tampa</strong> <strong>Bay</strong> (Figure 17). Many unrated<br />
creeks and streams drain 2,279 km2 <strong>of</strong><br />
coastal watershed between river basins;<br />
several <strong>of</strong> these have been canal ized,<br />
filled, or modified beyond rehabilitation.<br />
Three restorable streams are Double Branch<br />
Creek in upper Old <strong>Tampa</strong> <strong>Bay</strong>, Bullfrog<br />
Creek south <strong>of</strong> the Alafia River, and Piney<br />
Point Creek near Port Manatee. Other<br />
tidal streams entering into rivers have<br />
not been modified as much as the urban<br />
streams.<br />
Of the 15% <strong>of</strong> total annual flow<br />
attributable to other tributaries, about<br />
two-thirds is contributed by flood-control<br />
channels; the <strong>Tampa</strong> Bypass Canal (former<br />
Palm River) is the largest <strong>of</strong> these<br />
streams (about 105 x lo9 l/yr). This<br />
canal flows southwesterly from the upper<br />
Hi 11 sborough River Basin through Harney,<br />
where it is connected by a control<br />
structure to the river and continues to<br />
McKay <strong>Bay</strong>. Part <strong>of</strong> its base flow is<br />
ground water, since it intercepts the<br />
<strong>Florida</strong>n Aquifer (Motz 1975). <strong>The</strong><br />
flood-control channels are tidal only up<br />
to their saltwater barriers; the lesser<br />
streams are more tidal, but urbanized.<br />
2.3.3. Consti tilent Concentrations and<br />
Loads<br />
It does not automatically follow that<br />
rivers with the greatest flows are the<br />
greatest sources <strong>of</strong> material to <strong>Tampa</strong> <strong>Bay</strong>.<br />
Table 6 illustrates the ranking <strong>of</strong> major<br />
streams by flow, selected concentrations<br />
<strong>of</strong> nutrients and other constituents, and<br />
their corresponding 1 oads (Doori s and<br />
Dooris 1985). Flow and conductivity ranks<br />
are correlated for most rivers except the<br />
Lake Tarpon Outfall and Hi 11 sborough<br />
River, and flows are inversely related to<br />
overall dissolved oxygen content.<br />
Total phosphorus concentrations are<br />
highest in the Alafia River, and that<br />
river delivers more phosphorus to <strong>Tampa</strong><br />
<strong>Bay</strong> than any other (Figure 18). It is<br />
followed in rank for both concentration<br />
TBC<br />
s S<br />
I I -7- r r r - r ,--7- r--r---I-<br />
JAN FEf3 MAR APR MAY JUN JUL AUG SFP OCT NOV UkC<br />
MONTti<br />
LEGI-NO<br />
TOC TAMPA BYPASS CANAL<br />
- - SS SULFUR SPRINGS<br />
RC ROCKY CRFEK<br />
SC SWEETWATER CItEEK<br />
LTOC LAKE TARPON OUTFALL CANAL<br />
, flc<br />
._ _I-.T ._.-.T.-.--.T -- .--<br />
JAN FTB MAR APR MAY JVN JUL AUG SEP OCT NOV DEC<br />
MONTll<br />
I<br />
to\ . , . .---<br />
LEGFNI)<br />
- - tlR<br />
- AR<br />
MR<br />
LMR<br />
fl C<br />
P+ILL~IXORO~I~II nwn<br />
ALAFIA nlVFR<br />
MANATEE nwn<br />
LITTLF MANATFE RlVEn<br />
TAMPA RYPASS CANAL<br />
RULLFROO CREEK<br />
ROCKY CRFEKICHANNEL A<br />
LAKE TARPON OUTFALL CANAL<br />
SWEETWATER CnEEK<br />
TOTAL<br />
I1ILL.SOOROUGII RIVER<br />
ALAFIA RIVER<br />
MANATEE nivEn<br />
LITTLE MANATFE RIVER<br />
BULLFROG CREEK<br />
MEAN ANNIJAL VOLUME<br />
1 10 100 1000<br />
(LIYEAR) Xtog<br />
Figure 17. Mean monthly flows in major and minor<br />
tributaries, and mean annual volume delivered to<br />
<strong>Tampa</strong> <strong>Bay</strong> (Dooris and Dooris 1985).
Table 6. Rank <strong>of</strong> <strong>Tampa</strong> <strong>Bay</strong> tributaries by tiow and load. Conc. = concentration (Dooris and Dooris<br />
1985).<br />
-- -<br />
Rank (1 highest) by<br />
Stream<br />
Flow<br />
Total P Total Ors N Fl uoride<br />
C~nd.~ D.O. Conc. Load Conc. Load Conc. Load<br />
L. Tarpon<br />
Outfall 6 2 1 6 6 2 6 N.D.C N.D.<br />
Hi 11 sborough<br />
River 1 4 5 3 2 5 3 3 2<br />
<strong>Tampa</strong> Bypass<br />
Canal 5 6 3 5 5 3 4 4 5<br />
A1 afi a River 2 3 4 1 1 4 2 1 I<br />
Little Manatee<br />
River 4 5 2 4 4 5 5 2 3<br />
Manatee River 3 1 6 2 3 1 1 3 4<br />
aCond.= conductivity.<br />
b ~ . = ~ dissolved . oxygen concentrations.<br />
CN.D. = no data.<br />
and load by the Hillsborough and Manatee<br />
Rivers, the Little Manatee, and the<br />
human-made canals. Total organic nitrogen<br />
is highest in the Manatee River (either by<br />
concentration or load), even though its<br />
flow rank is third; total loads <strong>of</strong> organic<br />
nitrogen in the Alafia and Hillsborough<br />
Rivers follow. Judging from its rank by<br />
oxygen content, the Little Manatee River<br />
del ivers less oxygen demanding materi a1 to<br />
<strong>Tampa</strong> <strong>Bay</strong> than any other natural river.<br />
Fluoride concentrations and loads to<br />
<strong>Tampa</strong> <strong>Bay</strong> reflect natural background<br />
levels <strong>of</strong> fl uoride-containing phosphate<br />
deposits, as well as the activity <strong>of</strong><br />
industries that mine and process the<br />
phosphate (Toler 1967). Mean fluoride<br />
concentrations are uniformly low, t~sually<br />
less than 2.0 mg/l as mean values, for all<br />
streams but the Alafia. <strong>The</strong> Alafia River<br />
has had enormously high levels <strong>of</strong><br />
fluoride, discharging up to 10 tonnes <strong>of</strong><br />
fluoride per day to Hillsborough <strong>Bay</strong> in<br />
the 1960's. Concentrations and loads in<br />
the river have been declining since then,<br />
although total loading via the Alafia<br />
River is still one or two orders <strong>of</strong><br />
magnitude greater than loading by other<br />
streams.<br />
Data from Moon (1985) on loads from<br />
permitted point sources indicate that<br />
waste discharges to the Alafia River<br />
render it the greatest source <strong>of</strong><br />
phosphorus and fluoride to the <strong>Bay</strong>. Point<br />
discharges are also imp1 icated by the same<br />
data as the reason for the Manatee River's<br />
distinction as the largest source <strong>of</strong><br />
organic nitrogen. On the other hand, the<br />
Little Manatee River is distinguished as<br />
the bay's healthiest natural river, at<br />
least ins<strong>of</strong>ar as dissolved oxygen,<br />
nutrients, and fluoride are concerned.<br />
Moon (1985) also reported on flows<br />
and loads from point sources directly to<br />
waters <strong>of</strong> <strong>Tampa</strong> <strong>Bay</strong>. Although the<br />
historic coastal basin between rivers was<br />
small and therefore re1 ati vel y unimportant<br />
as a source <strong>of</strong> nutrients, new coastal<br />
urbanization and anthropogenic discharges
ALAFIA RlVER<br />
HILLSBOROUGH RlVER<br />
MANATEE RlVER<br />
LITTLE MANATEE RlVER<br />
TAMPA BYPASS CANAL<br />
ROCKY CREEK<br />
LAKE 1 .ARPON OUTFALL CANAL<br />
SWEETWATER CREEK<br />
1 o3 1 o4 1 o5 10'<br />
PHOSPHORUS TOTAL/YEAR (KG)<br />
ALAFIA RIVER<br />
MANATEE RlVER<br />
nlvcn<br />
~~ILLSBO~~OUGI~<br />
LITTLE MANATEE RIVER<br />
SWEETWATER CREEK<br />
TAMPA BYPASS CANAL<br />
ROCKY CREEK<br />
LAKE TARPON OUTFALL CANAL<br />
MANATEE RlVER<br />
ALAFIA nlvcn<br />
titLLSUOROUGH RIVER<br />
lAMPA OYPASS CANAL<br />
LITTLE MANATEE Riven<br />
LAKE TARPON OUTFALL CANAL<br />
SWEETWATER CREEK<br />
ROCKY CREEK<br />
TOTAL ORGANIC N IYEAR (KG)<br />
ALAFIA RIVER<br />
WILLSBOROUQH RlVER<br />
LITTLE MANATEE RlVER<br />
MANATEE RIVER<br />
ROCKY CREEK<br />
TAMPA BYPASS CANAL<br />
SWEETWATER CREEK<br />
FLUORIDE (YEAR cKa)<br />
1 o3 1 o4 I 05<br />
Figure 18. Mean annual constituent loads to <strong>Tampa</strong> <strong>Bay</strong> (Dooris and Dooris 1985).<br />
from these 1 ocal areas coll ecti vely<br />
constitute a significant source <strong>of</strong> flow<br />
and load. Moon (1985) calculated that<br />
about one- fourth <strong>of</strong> all point-source<br />
flows go directly into the bay, and that<br />
such sources de1 iver about 839,160 kg <strong>of</strong><br />
phosphorus and 1,360,800 kg <strong>of</strong> ni trogen/yr<br />
(or 78% and 85% <strong>of</strong> all anthropogenic loads<br />
<strong>of</strong> these nutrients in the bay,<br />
respectively).<br />
2.3.4. Structure <strong>of</strong> Ground-water Svsterns<br />
Under the Bav<br />
<strong>The</strong> major confined aquifer below<br />
<strong>Tampa</strong> <strong>Bay</strong> is the <strong>Florida</strong>n Aquifer. This<br />
water-beari ng series <strong>of</strong> formations (Figure<br />
19) is approximately 300 m thick in<br />
Hillsborough County north <strong>of</strong> the bay and<br />
400 m thick in Manatee County south <strong>of</strong> the<br />
bay. <strong>The</strong> <strong>Florida</strong>n is confined to varying
0.<br />
190.<br />
.DO.<br />
log,<br />
.DO.<br />
#Do.<br />
goo.<br />
700.<br />
en01<br />
degrees by the overlying Hawthorn<br />
Formation, a late Miocene deposit that<br />
thickens and dips toward the south under<br />
the bay.<br />
Recharge to the <strong>Florida</strong>n Aquifer<br />
occurs primarily northeast <strong>of</strong> <strong>Tampa</strong> <strong>Bay</strong><br />
where formations are at or near the<br />
surface, as in the Green Swamp (Ryder<br />
1982). Upper Old <strong>Tampa</strong> <strong>Bay</strong> and<br />
Hill sborough <strong>Bay</strong> are likely areas <strong>of</strong><br />
vertical leakage, both upward and<br />
downward, due to the semipermeable nature<br />
<strong>of</strong> the confining beds <strong>of</strong> the Hawthorn.<br />
Recharge to the <strong>Florida</strong>n in Manatee County<br />
is primarily from inland areas east <strong>of</strong> the<br />
coast.<br />
Undifferentiated sands, silts, and<br />
clays <strong>of</strong> Pleistocene and Recent times<br />
overlie the Hawthorn and hold water<br />
derived from 1 ocal percolation. This<br />
surficial aquifer is 7-15 m thick<br />
throughout most <strong>of</strong> the bay area but is<br />
reduced to a thin veneer or is absent<br />
under <strong>Tampa</strong> <strong>Bay</strong>. Consequently, the<br />
thickness and imperviousness <strong>of</strong> the<br />
Hawthorn Formation controls hydrologic<br />
connections between the <strong>Bay</strong> and <strong>Florida</strong>n<br />
Aquifer.<br />
2.3.5. Ground-Water Dischar~es to Tamoa<br />
&a!<br />
Ground waters are discharged to <strong>Tampa</strong><br />
<strong>Bay</strong> from the surficial (water-table) and<br />
confined (<strong>Florida</strong>n) aquifers, Discharges<br />
from these sources are controlled by the<br />
re1 ationship <strong>of</strong> actual or potenti a1 water<br />
surface levels and land surface, and<br />
1 eakage. Figure 20 illustrates the<br />
movement <strong>of</strong> surficial waters to the bay<br />
and the effect <strong>of</strong> streams on direction <strong>of</strong><br />
movement (Cul breath et a1 . 1985).<br />
Although data from Manatee County are not<br />
illustrated, surficial discharges to the<br />
bay are significant (Hyde 1975).<br />
Surficial discharges to the bay are<br />
seasonal and greatest during and after the<br />
wet season. <strong>The</strong> roles <strong>of</strong> ground water<br />
discharge in bay ecology are poorly<br />
understood, but for discussion purposes<br />
can be postulated as (1) attenuating<br />
surface flows and constituent loads; (2)<br />
pro1 onging estuarine conditions along<br />
Figure 19. Relation <strong>of</strong> surficial and <strong>Florida</strong>n aquifers shore1 ines and in marshes or mangrove<br />
to <strong>Tampa</strong> <strong>Bay</strong> along three axes (Culbreath et al. 1985). forests, and (3) creating favorable<br />
23
Figure 20. Generalized flow in the surficial aquifer, Figure 21. Generalized flow in the <strong>Florida</strong>n aquifer,<br />
September 1980 (Culbreath et al. 1985). September 1980 (Culbreath et al. 1985).<br />
refugia and nursery areas for marine 1 ife<br />
in tidal creeks. Drainage <strong>of</strong> uplands<br />
around the bay has concentrated the<br />
different flows <strong>of</strong> surficial discharge,<br />
routed it to major stormwater outlets, and<br />
so a1 tered the hydrology and constituent<br />
loads <strong>of</strong> artificial tributaries that many<br />
functions <strong>of</strong> diffuse flows have probably<br />
been lost.<br />
<strong>The</strong> physical interaction <strong>of</strong> the<br />
<strong>Florida</strong>n Aquifer and <strong>Tampa</strong> <strong>Bay</strong> and its<br />
ecol oy ical consequences a1 so are poorly<br />
known, Figure 21 illustrates aquifer<br />
water moving toward and under the bay.<br />
Ryder (1982) estimated that 8.7 billion<br />
l/day <strong>of</strong> ground water are released from<br />
the <strong>Florida</strong>n Aquifer in southwest <strong>Florida</strong>,<br />
an "immense area <strong>of</strong> upward leakage."<br />
A1 though 90% <strong>of</strong> the leakage is in the form<br />
<strong>of</strong> springs, 10% occurs in the coastal area<br />
as diffuse leakage.<br />
<strong>The</strong>re are about a dozen springs in<br />
the <strong>Tampa</strong> <strong>Bay</strong> area, although no submarine<br />
ones are known (Rosenau et al. 1977).<br />
Pine1 1 as County has two dormant springs<br />
relevant to the bay, Phillippi and<br />
Espiritu Santo Springs. <strong>The</strong><br />
Hill sbor~ugh River Basin contains Purity,<br />
Sulphur, Eureka, Lettuce Lake, and Six<br />
Mi 1 e Springs. Buckhorn, Messer, and<br />
Lithia Springs are located in the Alafia<br />
River. No springs are reported in the<br />
Little Manatee and Manatee Rivers; this is<br />
consistent with the increased thickness <strong>of</strong><br />
confining 1 ayers. Together, these and<br />
lesser springs contribute an average <strong>of</strong><br />
3.5 m3/s <strong>of</strong> discharge, but ail <strong>of</strong> it<br />
either is consumed or added to the flows<br />
<strong>of</strong> their respective rivers.<br />
On the other hand, artesian flow is<br />
widespread around <strong>Tampa</strong> <strong>Bay</strong> and probably<br />
was substantial prior to development <strong>of</strong><br />
the region (Ryder 1982). As shown in<br />
Figure 22, artesian flow probably occurs<br />
in eastern Pine1 1 as County, within the<br />
<strong>Tampa</strong> <strong>Bay</strong> Bypass Canal (formerly Palm<br />
River), the Ruskin area, and coastal
<strong>Tampa</strong> Bypass Canal opened the aquifer,<br />
and ship channels probably have done so<br />
as well, meaning that vertical fluxes are<br />
further s ti1 1 from natural conditions<br />
(Motz 1975; Hutchinson 1983).<br />
It is apparent from the data on<br />
surface water and ground - water hydro1 ogy<br />
that much is known about physical<br />
conditions re1 ative to freshwater inputs<br />
to <strong>Tampa</strong> <strong>Bay</strong>, but details <strong>of</strong> ground-water<br />
dynamics and the ecological role <strong>of</strong><br />
freshwater in the bay are sorely<br />
understudied. No one today probably<br />
appreciates how wet the <strong>Tampa</strong> <strong>Bay</strong> region<br />
once was. Until we know the "original"<br />
hydrological conditions <strong>of</strong> the bay, it is<br />
likely that efforts to control its<br />
chemistry and biology will be misguided.<br />
2.4 HYDROGRAPHIC CHARACTERISTICS OF<br />
TAMPA BAY<br />
<strong>Tampa</strong> <strong>Bay</strong> is <strong>Florida</strong>'s largest<br />
open-water estuary and the second 1 argest<br />
after the expansive network <strong>of</strong> tidal<br />
rivers and creeks <strong>of</strong> the Everglades. <strong>The</strong><br />
Figure 22. Area <strong>of</strong> potential discharge from the bay covers 967 km2 and i s wider than 16 km<br />
<strong>Florida</strong>n aquifer, September 1980 (Culbreath et al. in places. Wi h wet1 ands, total area is<br />
1985). about 1,030 km $ . <strong>The</strong> bay has a bottom<br />
area <strong>of</strong> 794 mill ion m2, and a volume at<br />
mean tide <strong>of</strong> 3.48 bill ion m3 (Ross et a1 .<br />
1984).<br />
Manatee County (Peek 1959; Hyde 1975; 2.4.1. Shape and Shorelines<br />
Rosenau et a1 . 1977). Extensive artesian<br />
flow has supported truck farming and <strong>The</strong> main axis <strong>of</strong> <strong>Tampa</strong> <strong>Bay</strong> is<br />
tropical fish culture from <strong>Tampa</strong> to southwest to northeast (into Hillsborough<br />
Bradenton. In upper Old <strong>Tampa</strong> <strong>Bay</strong>, <strong>Bay</strong>) with a northwesterly branch into Old<br />
artesian flows into Rookery and Double <strong>Tampa</strong> <strong>Bay</strong>. Historically, natural shore-<br />
Branch Creeks were common because the lines included estuarine sandy beaches<br />
<strong>Florida</strong>n Aquifer is either poorly confined (found today at Piney Point), salt barrens<br />
or unconfined (Mann 1972). (Beacon Key), mangrove-dominated embayments<br />
(Cockroach <strong>Bay</strong>), low river marshes<br />
Actual rates <strong>of</strong> discharge from the and bluffs (Little Manatee River), and<br />
<strong>Florida</strong>n Aquifer depend on potentiometric pine flatwoods ( Interbay Peninsula). <strong>The</strong><br />
levels (the level to which water would only natural rock shoreline remaining in<br />
rise in a confined well open at its bottom the bay is a coquina outcrop north <strong>of</strong> the<br />
to the aquifer) and connections to the bay Alafia River near Archie Creek, although<br />
or ground surface. Long-term potentio- others occurred at Ballast Point and<br />
metric surface projections based on el sewhere (Hei lprin 1887).<br />
farming, new and forthcoming mining<br />
operations, and municipal consumption are Goodwin (1984) computed changes in<br />
about 9 m below existing levels ; this physical characteristics within subareas<br />
suggests a decreased potential for <strong>of</strong> the bay since 1885 (Figure 23; Table<br />
ground- water movement to the bay (Wilson 7). <strong>The</strong> area <strong>of</strong> <strong>Tampa</strong> <strong>Bay</strong> has been<br />
and Gerhart 1980). Excavation <strong>of</strong> the reduced by 3.6%, with most (3.0%)<br />
25
occurring before 1972. Hi1 1 sborough <strong>Bay</strong>'s<br />
surface area was reduced by 13.6%,<br />
primarily by residenti a1 and port-re1 ated<br />
filling. Lower <strong>Tampa</strong> <strong>Bay</strong> has lost 1.9% <strong>of</strong><br />
its total area, but this figure would be<br />
considerably higher if middle and upper<br />
Boca Ciega <strong>Bay</strong> were included (Linda11 and<br />
Trent 1975). <strong>The</strong> loss <strong>of</strong> bay area from<br />
fi 11 i ng occurred mostly along shorel ines<br />
and shallow areas <strong>of</strong> high biological<br />
productivity. Definitive data on<br />
shorel ine loss by type are not yet<br />
available for <strong>Tampa</strong> <strong>Bay</strong>, but a preliminary<br />
estimate <strong>of</strong> 44% loss in total mangrove<br />
acreage illustrates the re1 ative<br />
importance <strong>of</strong> the lost area (Lewis 1977).<br />
In Charlotte Harbor to the south, Harris<br />
et a1 . (1983) calculated that during<br />
1945-1982 mangrove acreage actually<br />
increased by lo%, so losses in <strong>Tampa</strong> <strong>Bay</strong><br />
have been considerable.<br />
2.4.2. De~th<br />
<strong>The</strong> bay contains at least three<br />
terraces or wave-cut benches associated<br />
with lower sea-level stands, with the<br />
deepest water in lower <strong>Tampa</strong> <strong>Bay</strong>. Egmont<br />
Channel at the mouth <strong>of</strong> <strong>Tampa</strong> <strong>Bay</strong> is the<br />
deepest inlet and has a natural depth <strong>of</strong><br />
27.4 m. A 96-km-long ship channel<br />
(dredged to 13 m) is the longest<br />
bathymetric feature on the <strong>Florida</strong> west<br />
coast.<br />
<strong>Tampa</strong> <strong>Bay</strong> is a shallow body <strong>of</strong> water,<br />
with a modal depth <strong>of</strong> 3.0 m and 90% <strong>of</strong> its<br />
area shallower than 6.7 m (Olson and<br />
Morrill 1955). Mean depths have been<br />
reported as 4.1 m for the bay as a whole<br />
at "mean tide,'' and 3.7 m (Goodwin 1984)<br />
based on supplemental data (Rosenshein et<br />
al. 1977). Differences in estimates are<br />
due to definitions used in compiling data<br />
and bay development such as the ship<br />
channel and re1 ated spoil islands.<br />
According to Goodwin (19841, the mean<br />
depth <strong>of</strong> <strong>Tampa</strong> <strong>Bay</strong> has increased more than<br />
5% during the past century with an<br />
increase <strong>of</strong> almost 30% in Hillsborough<br />
<strong>Bay</strong>. Most <strong>of</strong> the increased relief took<br />
place before 1972 as a result <strong>of</strong> early<br />
channel projects.<br />
2.4.3. Bottom Features<br />
Figure 23. Areas <strong>of</strong> physical change En <strong>Tampa</strong> <strong>Bay</strong><br />
since 1880 (Goodwin 1984).<br />
<strong>The</strong> primary bottom type in <strong>Tampa</strong> <strong>Bay</strong><br />
is unconsol idated sediment, or so-called<br />
26
Table 7. Physical characteristics <strong>of</strong> major subareas <strong>of</strong> <strong>Tampa</strong> <strong>Bay</strong> for 1880,1972. end projected<br />
I%% levels <strong>of</strong> development (Goodwin 1984).<br />
Percent change<br />
Physical Year - 1972- 1880-<br />
Characteri stics/Area 1880 1972 1972 1985 1985<br />
Surface area (mi2)<br />
Lower <strong>Tampa</strong> <strong>Bay</strong> 128.4<br />
Middle <strong>Tampa</strong> <strong>Bay</strong> 111.2<br />
Old <strong>Tampa</strong> <strong>Bay</strong> 77.8<br />
Hi 11 sborough <strong>Bay</strong> 42.7<br />
<strong>Tampa</strong> <strong>Bay</strong> 360.2<br />
Water volume (mi2 ft)<br />
Lower <strong>Tampa</strong> <strong>Bay</strong> 1,572<br />
Middle <strong>Tampa</strong> <strong>Bay</strong> 1,475<br />
Old <strong>Tampa</strong> <strong>Bay</strong> 689<br />
Hillsborough <strong>Bay</strong> 352<br />
<strong>Tampa</strong> <strong>Bay</strong> 4,088<br />
Average depth (ft)<br />
Lower <strong>Tampa</strong> <strong>Bay</strong> 12.2 12.2 12.5 t 2.4 0 t 2.4<br />
Middle <strong>Tampa</strong> <strong>Bay</strong> 13.3 13.5 13.5 + 1.5 0 t 1.5<br />
Old <strong>Tampa</strong> <strong>Bay</strong> 8.9 9.3 9.3 + 4.5 0 + 4.5<br />
Hillsborough <strong>Bay</strong> 8.2 9.6 10.5 t17.1 + 9.4 t28.0<br />
<strong>Tampa</strong> <strong>Bay</strong> 11.3 11.8 11.9 + 4.4 + 0.8 + 5.3<br />
Tidal prism (mi2 ft) computed<br />
at seaward end <strong>of</strong>:<br />
Lower <strong>Tampa</strong> <strong>Bay</strong> 792 764 761 - 3.5 - 0.4 - 3.9<br />
Middle <strong>Tampa</strong> <strong>Bay</strong> 570 548 541 - 3.8 - 1.3 - 5.1<br />
Old <strong>Tampa</strong> <strong>Bay</strong> 205 195 194 - 4.9 - 0.5 - 5.4<br />
Hi l 1 sborough <strong>Bay</strong><br />
116 105 98 - 9.5 - 6.7 -15.5<br />
--<br />
--<br />
s<strong>of</strong>t bottom. Goodell and Gorsl ine (1961) ha. This value probably was much greater<br />
gave details on this type <strong>of</strong> bay sediment, a century ago before shell was harvested<br />
<strong>The</strong> actual area <strong>of</strong> s<strong>of</strong>t, unvegetated for fill. Numerous earthworks around the<br />
bottom is not known but in Charlotte bay suggest intriguingly large acreages <strong>of</strong><br />
Harbor it represents about 80%-85% <strong>of</strong> the oysters in prehistory (Goggi n and<br />
total area (Estever 1981) and is presumed Sturtevant 1964). Hard or live bottom<br />
to be <strong>of</strong> similar extent in <strong>Tampa</strong> <strong>Bay</strong>. occurs in the lower bay and near Gandy<br />
Examples <strong>of</strong> s<strong>of</strong>t bottom include expansive Bridge, but in unknown amounts. <strong>The</strong>se<br />
tidal flats in McKay <strong>Bay</strong>, shallow basins areas <strong>of</strong> rocky relief are populated by<br />
in Terra Ceia <strong>Bay</strong>, the undulating colonial invertebrates such as sponges<br />
flocculent substratum in Hill sborough <strong>Bay</strong>, and tunicates. Attached mcroal gae are<br />
and the <strong>of</strong>fshore bars along the lower bay. diverse and plentiful, and the areas<br />
Some s<strong>of</strong>t bottom supports grassbeds. may serve as nurseries for juvenile<br />
About 30,970 ha <strong>of</strong> grassbeds once existed fishes. Hard bottom is common where<br />
in <strong>Tampa</strong> <strong>Bay</strong>, but such vegetated bottoms tidal currents have removed overlying<br />
have declined by 81%. sands from e, coquina, or other<br />
rock.<br />
Recent estimates <strong>of</strong> oyster coverage<br />
in the bay are limited to those by McNulty <strong>The</strong> final bottom channels are either<br />
et a1. (1972), who gave a total <strong>of</strong> 3,352 natural or dredged. Egmont Channel is<br />
27
incised into rock (Wm. H. Taft, Worcester<br />
Poiytechnic Institute, pers. comm.) and<br />
parts <strong>of</strong> the main ship channel are cut<br />
into limestone in middle and upper<br />
Hill sborough <strong>Bay</strong> (Hutchinson 1983).<br />
Smal ler channels lead to docking areas and<br />
emerge from river mouths.<br />
2.4.4. Sea Level and Tides<br />
Water level in <strong>Tampa</strong> <strong>Bay</strong> varies as a<br />
function <strong>of</strong> long term oceanic change,<br />
multiple year cycles, and solunar tidal<br />
action. Wind and storms also affect the<br />
level <strong>of</strong> bay waters.<br />
Lonq-term trends. Sea level is<br />
rising in <strong>Tampa</strong> <strong>Bay</strong>, although estimates <strong>of</strong><br />
the rates <strong>of</strong> apparent rise vary. Marmer<br />
(1951) estimated a mean rate <strong>of</strong> 0.91 cm/yr<br />
rise in sea level at Cedar Key. This is<br />
equal to a rise <strong>of</strong> 91 cm/century. Bruun<br />
(1962) estimated a rate <strong>of</strong> 0.30 cm/yr on<br />
the west coast <strong>of</strong> <strong>Florida</strong> for 1930-60, or<br />
a rate <strong>of</strong> 30 cmlcentury. Hicks and<br />
Sh<strong>of</strong>nos (1965) set the Cedar Key rate at<br />
0.27 cm for 1939-62, the same as for Key<br />
West over a period <strong>of</strong> 49 years. This rate<br />
equals a rise <strong>of</strong> 27 cm/century. Hicks<br />
(1972b) gave a rate for Cedar Key from<br />
1940-70 <strong>of</strong> 0.03 cm/yr, for a rate <strong>of</strong> only<br />
3.0 cm/century. Provost (1974) gave a<br />
rate <strong>of</strong> 21 cm/century for <strong>Tampa</strong> <strong>Bay</strong>.<br />
Not all <strong>of</strong> the observed rise in sea<br />
level has been due to oceanic changes,<br />
since subsidence <strong>of</strong> land contributes to a<br />
relative transgression <strong>of</strong> the sea.<br />
Nonetheless, the combined effect <strong>of</strong> a<br />
rising sea and sinking coastline is<br />
ecologically significant. In the <strong>Florida</strong><br />
Everglades the rise <strong>of</strong> the sea (relative<br />
to land) has caused a dissection <strong>of</strong> the<br />
mangrove coast in the Ten Thousand<br />
Islands, and even today seaward islands<br />
are drowning while the forest moves inland<br />
(Scholl and Stuvier 1967) . Shore1 ines <strong>of</strong><br />
<strong>Tampa</strong> <strong>Bay</strong> are eroding slowly, partly<br />
because <strong>of</strong> sea-level rise (Estevez and<br />
Mosura 1985), and the loss <strong>of</strong> bars bayward<br />
<strong>of</strong> intertidal seagrass beds may be<br />
declining for the same reason (Hands<br />
1983). Over a longer period <strong>of</strong> time, sealevel<br />
rise will cause an infill ing <strong>of</strong><br />
<strong>Tampa</strong> <strong>Bay</strong> (Brooks 1974) and realignment <strong>of</strong><br />
shorelines (Bruun 1962).<br />
During the next 50 years we foresee a<br />
1 oss <strong>of</strong> seaward mangrove shorel i nes<br />
similar to the loss during the past 50<br />
years and an invasion by these trees into<br />
lands now only inundated by the highest<br />
tides. However, since much <strong>of</strong> the<br />
shoreline has been bulkheaded at or above<br />
current mean high water, there will be<br />
little habitat for these trees to invade,<br />
resulting in a "pinching out" <strong>of</strong> this zone<br />
<strong>of</strong> intertidal, fringing vegetation.<br />
A redetermi nation <strong>of</strong> tidal datum<br />
planes in <strong>Tampa</strong> <strong>Bay</strong> was made during the<br />
past 10 years by the <strong>National</strong> Oceai~<br />
Survey. Relative to the reference <strong>of</strong> the<br />
<strong>National</strong> Geodetic Vertical Datum, these<br />
tidal planes are higher than their<br />
predecessors, which were derived from 1929<br />
data. Unfortunately, these new tidal<br />
planes are not commonly used by surveyors<br />
or engineers (or regulatory agencies}, sfi<br />
that shorel i ne projects are being designed<br />
too low on the shorel ine and too close to<br />
ecologically valuable intertidal areas.<br />
Annual trends. Tides vary daily and<br />
the cycle <strong>of</strong> tides in <strong>Tampa</strong> <strong>Bay</strong> has a<br />
lunar period, but underlying these changes<br />
is an annual variation <strong>of</strong> ecological<br />
importance, particularly for intertidal<br />
organi sms. Sea level is highest in<br />
August-October because <strong>of</strong> oceanic changes,<br />
the movement <strong>of</strong> coastal currents, warming<br />
<strong>of</strong> the sea, run<strong>of</strong>f, and solar and lunar<br />
effects. It is lowest in January and<br />
February, so the most rapid change in sea<br />
level is in November and December. <strong>The</strong><br />
difference between sea level during these<br />
extremes is about 24 cm (Marmer 1951).<br />
Provost (1974) showed that tides <strong>of</strong><br />
the same amp1 itude inundate fixed<br />
intertidal marsh points differently,<br />
depending on annual sea-1 eve1 changes.<br />
Estevez (1978) presented inundation curves<br />
for Cockroach Ray (Figure 24) and found<br />
that organisms located at mean high water<br />
were submerged 55% <strong>of</strong> the time in October<br />
but only 18% <strong>of</strong> the time in February. <strong>The</strong><br />
range <strong>of</strong> submergence (October through<br />
February) at mean tide was 80%-50% and<br />
only 96%-80% at mean low water. Estevez<br />
(1978) interpreted ecological data on red<br />
mangrove root-borers on the basis <strong>of</strong> these<br />
changes. Others working in the intertidal<br />
zone should keep this variation in mind,
+4.0 especially when interpreting positional<br />
data.<br />
*5.0 Tides. Tides in <strong>Tampa</strong> <strong>Bay</strong> are a<br />
mixture <strong>of</strong> lunar (semidiurnal) and solar<br />
'2.0 (diurnal ) tidal types (Goodwin and<br />
Michaelis 1976). <strong>The</strong> average tidal range<br />
..., is 0.67 m, a1 though, as noted above,<br />
L Y 9.0<br />
annual sea level variation results in the<br />
L<br />
shifting <strong>of</strong> this range vertically in<br />
L<br />
Z<br />
relation to the shore. Tides propagate<br />
0<br />
<<br />
uniformly from the Gulf <strong>of</strong> Mexico into the<br />
NRVO<br />
Y A<br />
"I bay (e.g., tidal cycles are delayed but<br />
not distorted much at different points up<br />
-1.0 the bay). Tidal changes relative to St.<br />
Petersburg are given in Table 8.<br />
-2.0 Typical tides in <strong>Tampa</strong> <strong>Bay</strong> are<br />
illustrated in Figure 25 (Goodwin 1984).<br />
When tides are mixed, a "lower" low tide<br />
-5.0 is followed by a "lower" high tide, then<br />
by a "higher" low and "higher" high tide.<br />
0 10 20 30 40 SO 00 TO 80 90 100<br />
TIHE 8U€iMERGE0 (PERCENT OF TOTAL) Southwesterly winds heighten tides and<br />
northerly winds lower tides by 1.0-1.5 m,<br />
Figure 24. Seasonal changes in tidal duration curves<br />
at Cockroach <strong>Bay</strong> (Estevez 1978).<br />
depending on wind strength and duration*<br />
<strong>The</strong> storm surge, a1 though technically not<br />
a tidal wave, is a1 so wind driven and may<br />
accentuate tidal variations. Figure 26<br />
illustrates the relative frequency <strong>of</strong><br />
occurrence <strong>of</strong> total tide height resulting<br />
from astronomic, barometric, and storm<br />
surge forces for gulf beaches on the<br />
Pinellas Peninsula. Relative to mean sea<br />
level a 1.5-1.8 m "tide" recurs on an<br />
-<br />
Table 8. Tide relations in <strong>Tampa</strong> <strong>Bay</strong>.<br />
Change relative to St. Petersburg<br />
High tide Low tide Range<br />
Place Heighta ~ i m e ~ Height Time (ft)<br />
Egmon t Key *0.gC -2:27 "0.9 -2:24 2.1<br />
Shell Point 0 +0:08 0 to: 17 2.3<br />
Hi 11 sborough <strong>Bay</strong> t0.5 +0:07 tO.l +0:26 2 -8<br />
Safety Harbor to. 5 tl:38 0.0 +1:55 2.8<br />
a Relative to mean lower low water.<br />
b~ours: minutes.<br />
C<br />
Asterisk identifies a value to be multiplied by predicted<br />
height at St. Petersburg.<br />
29
Figure 25. Typical and extreme tides in <strong>Tampa</strong> <strong>Bay</strong> (Goodwin 1984).<br />
average <strong>of</strong> 10 years; 2.5 m<br />
on a 25-year cycle.<br />
2.4.5. Circulation and Flushinq<br />
heights recur<br />
Circulation refers to the paths taken<br />
by water currents and their constituents<br />
due to tidal forces, run<strong>of</strong>f, wind, and<br />
other effects. Flushing is the net<br />
retention or export <strong>of</strong> water or<br />
waterborne material after circulation has<br />
occurred over a period <strong>of</strong> interest.<br />
Goodwin (1984) examined circulation and<br />
flushing <strong>of</strong> <strong>Tampa</strong> <strong>Bay</strong> for the period<br />
1880-1985.<br />
Both circulation and flushing in<br />
estuaries are determined largely by the<br />
relationship <strong>of</strong> freshwater inflow to tidal<br />
volume. otal inflow to <strong>Tampa</strong> <strong>Bay</strong> is<br />
about 45 m 4 /s, much less than the average<br />
t'dal flow at mid-tidal cycle <strong>of</strong> 25,500<br />
m 3 /s. Thus, <strong>Tampa</strong> <strong>Bay</strong> as a whole may be<br />
considered a neutral or mildly positive<br />
estuary which, because <strong>of</strong> bathymetry and<br />
low inflows, is vertically well mixed and<br />
generally unstrati fied with regard to<br />
sal ini ty (Dinardi 1978).<br />
<strong>The</strong> tidal prism, or volume <strong>of</strong> water<br />
in the bay between slack waters, is<br />
greatest in Lower <strong>Tampa</strong> <strong>Bay</strong> and least in
<strong>The</strong> pattern <strong>of</strong> currents in <strong>Tampa</strong> <strong>Bay</strong><br />
is known for flood and ebb cycles,<br />
although it is useful to note Goodwin's<br />
(1984) caveat that there are no fixed<br />
patterns <strong>of</strong> circulation in any estuary.<br />
In general, flood tidal currents enter<br />
<strong>Tampa</strong> <strong>Bay</strong> by the openings <strong>of</strong> the Sunshine<br />
Skyway Causeway and separate to the east<br />
and west shores <strong>of</strong> middle <strong>Tampa</strong> <strong>Bay</strong><br />
(Figure 27). Lesser speeds occur near<br />
shorelines and in the center <strong>of</strong> the middle<br />
bay. Water is transported at a<br />
diminishing rate into Old <strong>Tampa</strong> <strong>Bay</strong> to,<br />
but not much beyond, the Courtney Campbell<br />
Causeway. Transport into Hillsborough <strong>Bay</strong><br />
is minimal. <strong>The</strong> pattern is basically<br />
reversed on falling tide except that water<br />
transport in the central part <strong>of</strong> the<br />
midbay is greater.<br />
RETURN PERIOD (years)<br />
Figure 26. Total tide height (ft) above MSL versus<br />
return period in years (NOAA 1975). Curves applicable<br />
to St. Petersburg Beach-Clearwater coastline.<br />
the northern arms <strong>of</strong> the bay.<br />
In<br />
1880, respective prisms at their seaward<br />
ends were 1,006 km2-m for the lower bay,<br />
724 km2-m for the mid-bay, 260 k 2-m for<br />
Old <strong>Tampa</strong> <strong>Bay</strong>, and 147 kmf-m for<br />
Hillsborough <strong>Bay</strong>. As discussed below,<br />
these values have changed because <strong>of</strong><br />
dredging and filling, especially in<br />
Hi 11 sborough <strong>Bay</strong>, in a1 1 cases decreasing<br />
even though bay volume has increased.<br />
Currents. Typical current speeds<br />
range from 1.2-1.8 m/s at the entrance to<br />
<strong>Tampa</strong> <strong>Bay</strong>, to less than 0.14 m/s in<br />
Hi1 1 sborough <strong>Bay</strong>. Ebb tidal current<br />
speeds are greater than flood currents,<br />
reflecting the faster rate <strong>of</strong> water-level<br />
change on ebb tide. Winds and run<strong>of</strong>f may<br />
increase current speeds under extreme<br />
conditions.<br />
Net circulation. Average flooding<br />
and ebbing currents <strong>of</strong>fset each other over<br />
a complete tidal cycle except for a<br />
residual movement specific to each bay<br />
area. <strong>The</strong> residual transport is a measure<br />
<strong>of</strong> net circulation that will occur as long<br />
as similar tidal and other conditions<br />
prevail. Work by Ross et a1 . (1984) and<br />
Goodwin (1984) has done much to advance<br />
our knowledge <strong>of</strong> net circulation in <strong>Tampa</strong><br />
<strong>Bay</strong>, and provided very interesting results<br />
(Figure 28).<br />
First, there is a pronounced gradient<br />
in residual water transport (net<br />
circulation) from the bay entrance to<br />
upper bay areas. At the entrance,<br />
residual magnitu es are about 525 m3/s,<br />
comp red to 30 m 4 /s in Old <strong>Tampa</strong> <strong>Bay</strong> and<br />
15 m 3 /s in Hillsborough <strong>Bay</strong>. Second, net<br />
circulation in Hillsborough <strong>Bay</strong> always has<br />
been poor and, until recent channel<br />
dredging, was attributable more to river<br />
discharge than to other factors. Third,<br />
at least 20 gyres are present in the bay.<br />
<strong>The</strong> gyres are circular features <strong>of</strong><br />
tide-induced circulation which form when<br />
wind and density stratification are<br />
absent. <strong>The</strong> gyres range in diameter from<br />
1.5 to 10.0 km and adjoin neighboring<br />
gyres with opposite flow--much like a<br />
series <strong>of</strong> gears.<br />
<strong>The</strong> presence <strong>of</strong> gyres in <strong>Tampa</strong> <strong>Bay</strong><br />
has been known for several years, although<br />
their actual influence remains untested .<br />
Ross (1975) suggested a correlation<br />
between the size and location <strong>of</strong> gyres
Location <strong>of</strong> model cornputatrorl slte Inodel<br />
(only 25% <strong>of</strong> rtodes are show11 to aid clarity)<br />
\. Transport vector with rlode location symbol<br />
(vector magnitude defined by length <strong>of</strong> line<br />
o, ,Jo5 cllbic feet per second: vector<br />
dlrcctiorl defined from node location syrnhl<br />
to end <strong>of</strong> line)<br />
.)....* I.<br />
l........fl. .<br />
. .<br />
Figure 27. Water movement during a typical flood tide in 1985 (Goodwin 1984).<br />
w.i th scdimen tary features and possibly Goodwi n (1984) compared tide- i n duced<br />
macr<strong>of</strong>auna. Several unanswered residual transport to average tributary<br />
questions regarding gyre dynamics remain: inflow to identify eight significantly<br />
(1) Do they develop for sufficient periods different circulation zones (Figures 29<br />
to affect water quality, plankton and 30). Overall, circulation is high in<br />
dispersion, or pollutant transport (2) Zones 1 and 4, low in Zones 3, 6, and 8:<br />
Are their effects permanent or overwhelmed and variable in other zones. Zone 4<br />
by wind or other short-term events and (Upper <strong>Tampa</strong> <strong>Bay</strong>) is an area <strong>of</strong> naturally<br />
(3) Do gyres present problems or high rates <strong>of</strong> exchange with Hillsborough<br />
opportunities for resource management and Old <strong>Tampa</strong> <strong>Bay</strong>s, but is separated from
Location <strong>of</strong> model computation site lnodel<br />
(only 25% <strong>of</strong> nodes are shown to aid clarity)<br />
\, Transport vector with node location symbol<br />
(vector magnitude defined by length <strong>of</strong> line<br />
to end <strong>of</strong> line)<br />
Figure 28. Residual water movement after a complete tide cycle in 1985 (Goodwin<br />
1984).<br />
Lower <strong>Tampa</strong> 6ay by Zone 3, an area <strong>of</strong> residual transport may be treated as<br />
natural quiescence. <strong>The</strong> poorest circu- "flushing" in the popular sense, since it<br />
lation in <strong>Tampa</strong> <strong>Bay</strong> is in Zone 6, Upper reflects the tendency <strong>of</strong> the bay to export<br />
Hi1 lsborough <strong>Bay</strong>, despite improvements undesirable material. Tide induced<br />
flushing, however, is the flushing <strong>of</strong> a<br />
constituent minus transport caused<br />
f 1984) modeled tributary flow (Figure 31). Hig<br />
transport <strong>of</strong> phosphorus (due to high phosphorus concentrations were 2.5 mg/l in<br />
concentrations throughout the bay in 1975) Hill sborough <strong>Bay</strong> and 0.8 mg/l in Old <strong>Tampa</strong><br />
to assess constituent transport. <strong>The</strong> <strong>Bay</strong>, compared to less than 0.2 mg/l at the
- Zone Boundary<br />
(3) large (more than 100%) changes in<br />
flood and ebb tide transport caused<br />
by causeways and fill ing <strong>of</strong> upper<br />
Hi1 1 sborough <strong>Bay</strong>;<br />
(4) large (more than 100%) changes in net<br />
circulation in Old <strong>Tampa</strong> <strong>Bay</strong> and<br />
Hi 11 sborough <strong>Bay</strong>; and<br />
(5) increased in1 and (trapping) and<br />
seaward (export) exchange caused by<br />
tidally induced flushing.<br />
Overall , Goodwi n's work underscores<br />
three important conclusions, i .e., that<br />
physical changes to the bay have caused<br />
significant effects in circulation and<br />
flushing; Hi llsborough <strong>Bay</strong> was naturally<br />
an area <strong>of</strong> poor flushing (and was thus the<br />
worst place for municipal and industrial<br />
waste to have been discharged); and the<br />
continued flow <strong>of</strong> freshwater to <strong>Tampa</strong> <strong>Bay</strong><br />
and especi a1 ly Hi 11 sborough <strong>Bay</strong> is<br />
essential to maintain flushing, even<br />
though the volume is low compared to the<br />
average tidal prism. Most <strong>of</strong> these same<br />
conclusions regarding Hi 11 sborough <strong>Bay</strong><br />
also apply to Old <strong>Tampa</strong> <strong>Bay</strong>.<br />
Figure 29. Major circulation xones in <strong>Tampa</strong> <strong>Bay</strong><br />
(Goodwln 198Q).<br />
2.5 CHEMISTRY OF THE BAY<br />
Numerous studies <strong>of</strong> water chemistry<br />
in <strong>Tampa</strong> <strong>Bay</strong> are available as reviews<br />
(Fanning and Bell 1985), reports (Goetz<br />
and Goodwin 1980), data presentations<br />
bay entrance. Flood and ebb transport (Hi 11 sborough County Environmental<br />
resembled tidal water transport, reaching Protection Commission 1972-84), and<br />
maximum values in the midbay and low unpublished data. Less information is<br />
values in the upper arms <strong>of</strong> the bay. available on sediment chemistry, but that<br />
Residual constituent transport vectors which i s avai 1 able 1 argely corroborates<br />
assumed circular features similar to trends and patterns depicted by<br />
circulation gyres, a1 though magnitudes <strong>of</strong> water-qua1 ity data.<br />
transport were affected by the<br />
concentration gradient. <strong>The</strong> ship channel Selected physical and chemical<br />
gained importance for constituent properties <strong>of</strong> bay waters and sediment are<br />
transport, and the importance <strong>of</strong> tributary reviewed in this section from an<br />
flows for constituent flushing from <strong>Tampa</strong> ecological perspective, i.e., as a<br />
<strong>Bay</strong> remained high.<br />
description <strong>of</strong> the environment inhabited<br />
by estuarine plants and animals. Readers<br />
Chan~es since 1880. Goodwin (1984) interested more in water qua1 ity and human<br />
concluded that historic and recent uses <strong>of</strong> the bay should realize that<br />
a1 terations to the physical dimensions <strong>of</strong> subsequent comments support four<br />
<strong>Tampa</strong> <strong>Bay</strong> have been responsible for the conclusions, namely:<br />
following:<br />
(1) <strong>Tampa</strong> <strong>Bay</strong> is not grossly "polluted",<br />
(1) decreased surface area and tidal certainly not beyond the point <strong>of</strong><br />
prism, especially in Hillsborough rehabilitation;<br />
<strong>Bay</strong>; (2) Parts <strong>of</strong> the bay are "cleaner" than<br />
(2) increased depth and volume, others for natural as well as<br />
especially in Hill sborough <strong>Bay</strong>;<br />
cultural reasons;<br />
34
DISTANCE FROM MODEL BOUNDARY IN GULF OF MEXICO, IN MILES<br />
Figure 30. Average tributary streamflow and tide-induced circulation along longitudinal<br />
summary lines (see Figure 29) for 1880, 1972, and 1985 levels <strong>of</strong> development.<br />
DISTANCE FROM MODEL BOUNDARY IN GULF OF MEXICO, I<br />
Figure 31. Tide-induced and streamflow flushing <strong>of</strong> example constituent along longitudinal<br />
summary line (see Figure 29). from lower <strong>Tampa</strong> <strong>Bay</strong> to Hillsborough <strong>Bay</strong>, for 1880,1972,<br />
and 1985 levels <strong>of</strong> development.
some pollutants in the bay<br />
decl ining aver the past<br />
"qwal i ty" <strong>of</strong> bay zones is<br />
ameters are<br />
nt <strong>of</strong> human<br />
(HCEPC 19B-19113).<br />
oar; U, undesirable.<br />
Conditions in 03<br />
ly the water tn the northeast co
<strong>The</strong> waters <strong>of</strong> Pinellas County <strong>of</strong>f the<br />
St. Petersburg municipal waterfront have<br />
improved from poor (1977) to fair (1978,<br />
1981) or better in other years because <strong>of</strong><br />
reductions in that city's domestic waste<br />
discharges. Water quality in the lower<br />
bay generally is good to excellent,<br />
although the HCEPC documented a decline to<br />
poor in 1978 because <strong>of</strong> increased<br />
turbidity caused by harbor deepening. In<br />
summary, general water qua1 ity is good to<br />
excellent for much <strong>of</strong> <strong>Tampa</strong> <strong>Bay</strong>, declining<br />
in Old <strong>Tampa</strong> <strong>Bay</strong>, and undesirable in<br />
Hillsborough <strong>Bay</strong>. Point sources,<br />
especi a1 ly sewage treatment plant<br />
effluent, greatly affect water qua1 ity but<br />
improved effluents have resulted in<br />
improved water qua1 i ty.<br />
2.5.2. Hvdroqra~hi c Parameters<br />
Temperature. Water temperature<br />
ranges from ll°C-32OC in subtidal areas<br />
and more widely intertidally. <strong>The</strong> HCEPC<br />
data indicate very few localized areas <strong>of</strong><br />
exceptional ly 1 ow water temperature.<br />
Lower Boca Ciega <strong>Bay</strong>, eastern Hillsborough<br />
<strong>Bay</strong>, and eastern Old <strong>Tampa</strong> <strong>Bay</strong> may have<br />
above-average maximum temperatures, but<br />
overall the bay is thermally homogeneous.<br />
Mean annual variation for the bay is<br />
16°C-300C.<br />
Ten years <strong>of</strong> mean annual data are<br />
shown in Figure 33, which illustrate the<br />
temperature characteristics <strong>of</strong> four bay<br />
sectors, Old <strong>Tampa</strong> <strong>Bay</strong> is usually cooler<br />
26.0<br />
21.0<br />
24.0<br />
23.0<br />
22.0<br />
21.0<br />
- -<br />
20.0<br />
-<br />
YEAR<br />
HlLLSBOROLfQH BAY .-.--.-. LOWER TAMPA BAY<br />
---- MIDDLE TAMPA BAY<br />
-I- OLD TAMPA BAY<br />
Figure 33. Mid-depth water temperature in areas <strong>of</strong> <strong>Tampa</strong> <strong>Bay</strong> since 1975 (HCEPC 19&1).
than Hillsborough <strong>Bay</strong> by I~C-~QC, and a1 P is fresher than Old <strong>Tampa</strong> <strong>Bay</strong> (means <strong>of</strong><br />
bay sectors have been warming sfnce 1976, 20.9 and 22.5 ppt, respectively), although<br />
the range <strong>of</strong> salinity in Old <strong>Tampa</strong> <strong>Bay</strong> is<br />
Localized thermal plumes near power greater by 5-10 PP~.<br />
plants create elevated temperatures that<br />
vary most from background water Vertical differences in sal ini ty<br />
temperatures in winter. <strong>The</strong> ecalog ica usually are s1 ight, a1 though Firmcane and<br />
hazard <strong>of</strong> thermal plumes in a subtropical Oragovich (1966) reported a one time<br />
estuary like <strong>Tampa</strong> <strong>Bay</strong> is greater in vertical gradient <strong>of</strong> 19.6 ppt, thought by<br />
summer when extra heat drives water Simon (1974) to be the greatest known<br />
temperature beyond the tipper thermal difference, <strong>The</strong> HCEPC data since 1977<br />
tolerance <strong>of</strong> many species, usually about reveal a mean annual vertical sai ini ty<br />
32°G-350C. <strong>The</strong> cumulative effect <strong>of</strong> power gradient <strong>of</strong> 2 ppt or less for most bay<br />
plant discharges <strong>of</strong> heat to "<strong>Tampa</strong> Say has areas wSth a range from 0.3 to 7.7 ppt in<br />
not been studied. mean annual vertical difference. East<br />
<strong>Bay</strong>, a deep area between McKay and<br />
. Salinity <strong>of</strong> tray waters is HCllsborough <strong>Bay</strong>s, is more stratified with<br />
determined by tides and run<strong>of</strong>f. <strong>The</strong> respect to salinity than most places in<br />
extent to which oceanic salinity is the bay. Vertical salinity gradients in<br />
reduced by run<strong>of</strong>f and the range <strong>of</strong> East <strong>Bay</strong> are established by <strong>Tampa</strong> Bypass<br />
sallnjties observed at any place in the Canal discharge into the shallow waters <strong>of</strong><br />
bay are ecologically import,ant for two MeKay 8ay, which empties into Hillsborough<br />
reasons. First, $a1 inity gradients set up <strong>Bay</strong> as warm, brackish water and overlies<br />
gradients <strong>of</strong> conservative and non- cooler, denser water transported northward<br />
conservative constituents, ConsrrvatZve in the main ship channel.<br />
constituents are thoso for which observed<br />
concentrations can be explained on the Shipping channels have facil i tated<br />
basis <strong>of</strong> physical relationships such as the movement <strong>of</strong> both tidal and<br />
sol ubi 1 f ty, diffusion, advective freshwaters, Gaetz and Goodwin (1980)<br />
transport, or s~ttl Ins. Examples <strong>of</strong> reported inland movement <strong>of</strong> isohales near<br />
consaruatfva constituents in thr bay the main shjpping channel during flood<br />
include heat, color, fluorfde, and tides and seaward movement during ebb<br />
probably total phosphorus. tides (Figrrre 34). Giovanell i (1981)<br />
N<strong>of</strong>icenservative factors are biol ogical ly studied the influence <strong>of</strong> A1 afia River<br />
alterable and vary Indirectly or not at discharge on salinity in lower<br />
a with salinity; some examples are<br />
djsoolved oxygen, some melecular forms sf<br />
Hillsborough Say. <strong>The</strong> configuration <strong>of</strong><br />
the dredged channel and spoils results in<br />
nitrogen, and chloraphyl1. significant mixing at the river mouth. A<br />
25% reduct ion in specific conductance<br />
SalfnJty 1s equally important as an resulted From a 17-fold increase in river<br />
ecological Factar for establishing areas dis"argew'rthin<br />
the bay which are inhabitable for<br />
some species but not others, and as a Qis&lv~~&x~. <strong>The</strong> amount <strong>of</strong><br />
gufde to predictable resources such as gaseous oxygen dissolved in water depends<br />
Feeding or nursery grounds. Exclusion <strong>of</strong> on temperature, sa ini ty, degree <strong>of</strong><br />
oystrktr predators by law, varying saljnily physical mmixing, and the consumption or<br />
4s a well-known example fBahr and Lanier production <strong>of</strong> oxygen by organisms or<br />
19631), Spawning migrations by a variety chemical processes. Cold freshwater is<br />
<strong>of</strong> sport and comercia1 fishes and physicially capable <strong>of</strong> holding more oxygen<br />
invertebrates are another. than warm salt water, for example, and<br />
respiration by plants and animals can<br />
SalinS ty in the Gulf <strong>of</strong> Mexico ranges depress oxygen concentrations to hazardous<br />
from 22.6 to 39-0 parts per thousand (ppt) levels after a long, still night when<br />
and averages 34.1 ppt. fn lowar <strong>Tampa</strong> phatos~nthesSs has stopped and oxygenation<br />
<strong>Bay</strong>, Terra CeSa <strong>Bay</strong> to the east has an due to mixing is low. Anoxic conditions<br />
average salinity <strong>of</strong> 24.5 ppt and the occur when no oxygen is left in solution.<br />
widest range <strong>of</strong> any bay area --1.0 to Anox'ia may be tolerated by facultative<br />
33.7 ppt (Simon 1974). HI l sborough <strong>Bay</strong> anaerobes forgani sms wi th a1 ternate<br />
38
LEGEND<br />
-44 o- Line <strong>of</strong> equal specific conductance (in<br />
millimhos per centimeter at 25OCI: interval,<br />
2 millimhos<br />
+ 46 Site <strong>of</strong> sample collection showing specific<br />
conductance value<br />
0 4 KILOMETERS<br />
u<br />
Figure 34. Typical (A), high (B), and low (C) specific-cond<br />
(Goetz and Goodwin 1980).
espiratory systems) but results in death<br />
or displacement <strong>of</strong> most 1 ife. <strong>The</strong> State<br />
<strong>of</strong> <strong>Florida</strong> considers an oxygen<br />
concentration <strong>of</strong> 4 mg/l to be the minimum<br />
necessary for protection <strong>of</strong> marine life.<br />
Simon (1974) cited several documented<br />
cases <strong>of</strong> anoxia and associated fish kills<br />
in <strong>Tampa</strong> <strong>Bay</strong>.<br />
Simon (1974) gave a baywide range for<br />
dissolved oxygen <strong>of</strong> 0.9-11 -6 mg/l and a<br />
yearly mean for the entire system <strong>of</strong> 5.9<br />
mg/l. Greater extremes have since been<br />
documented. Vertical gradients <strong>of</strong> oxygen<br />
are much more pronounced than salinity in<br />
<strong>Tampa</strong> <strong>Bay</strong>, especially in deep water and in<br />
Hill sborough Say. Figure 35 illustrates<br />
average differences between surface and<br />
bottom dissolved oxygen levels in relation<br />
to depth for HCEPC data from 1981 through<br />
1983 at stations in Hillsborough <strong>Bay</strong>,<br />
Strong vertical gradients are induced by<br />
high oxygen demands <strong>of</strong> organic sediments<br />
and by accumulations <strong>of</strong> photosynthetic<br />
plankton near the surface, which shade<br />
deeper waters (Ross et al. 1984).<br />
Self -shading is known for other estuaries<br />
but is not well studied in <strong>Tampa</strong> <strong>Bay</strong>.<br />
More study <strong>of</strong> depth- stratified levels <strong>of</strong><br />
dissolved oxygen will be needed to<br />
evaluate impacts <strong>of</strong> harbor deepening and<br />
eutrophication.<br />
Phytopl ankton blooms are most<br />
frequent and prolonged in Hi 1 l sborough<br />
<strong>Bay</strong>, so dissolved oxygen extremes are<br />
larger than in other bay sectors. Minimum<br />
values are 1 ower in Hi 11 sborough <strong>Bay</strong><br />
because <strong>of</strong> depth (as above), reduced fetch<br />
(Ross et al. 1984), plankton respiration<br />
(HCEPC data) and benthic demands<br />
(McClelland 1984). Simon (1974) gave mean<br />
and range data for dissolved oxygen in<br />
several bay areas (Tab1 e 9).<br />
Goetz and Goodwin (1980) showed<br />
higher dissolved oxygen values and lower<br />
variability in Old <strong>Tampa</strong> <strong>Bay</strong> than<br />
Hillsborough <strong>Bay</strong>; this agrees with HCEPC<br />
data for 11 years <strong>of</strong> monitoring. Using<br />
HCEPC second minimum data for dissolved<br />
oxygen at the bottom for comparison<br />
(Figure 36), Hillsborough <strong>Bay</strong> has the most<br />
oxygen stress, followed by the east shore<br />
Table 9. Dissolved oxygen concentrations for bay<br />
areas (Simon 1974).<br />
Concentration <strong>of</strong><br />
di sso I ved oxvqen . --<br />
Section Mean (mg/l) Range (mg/l)<br />
-- -<br />
Old <strong>Tampa</strong> <strong>Bay</strong> 6.3 2.7-10.6<br />
Hillsborough <strong>Bay</strong> 6.4 0.9-11.6<br />
Upper <strong>Tampa</strong> <strong>Bay</strong> 5.8 1.1- 8.1<br />
Lower <strong>Tampa</strong> <strong>Bay</strong> 5.7 1.4- 8.5<br />
Boca Ciega <strong>Bay</strong> 5.4 1.6-10.6<br />
MIDDLE TAMPA BAY<br />
-- --'.-<br />
DEPTH. M 1<br />
1 I<br />
74 76 7. 77 76 TP do 81 82 I 2s<br />
YEAR<br />
Figure 35, Stratification <strong>of</strong> dissolved oxygen (surfacebottom<br />
values) in Hillsborough <strong>Bay</strong> in relation to Figure 36. Mean annual dissolved oxygen near the<br />
depth, 1981 through 1983. bottom in <strong>Tampa</strong> <strong>Bay</strong> (HCEPC 19841.
<strong>of</strong> upper <strong>Tampa</strong> <strong>Bay</strong> (Ruskin - Apollo<br />
Beach). <strong>The</strong> eastern shore <strong>of</strong> Old <strong>Tampa</strong><br />
<strong>Bay</strong> north <strong>of</strong> Interstate 275 also is<br />
re1 atively low in dissolved oxygen.<br />
Di ssol ved oxygen concentrat ions vary<br />
diurnally (because <strong>of</strong> depth, light, and<br />
temperature) and seasonally (because <strong>of</strong><br />
temperature). Bottom 1 evel s are highest<br />
in January and lowest in June through<br />
August (Figure 37). Bottom dissolved<br />
oxygen 1 evel s in Hi 11 sborough <strong>Bay</strong> viol ate<br />
existing state standards 60 to 90 days<br />
each year. Dissolved oxygen in Old <strong>Tampa</strong><br />
<strong>Bay</strong> covaries in range and pattern with<br />
<strong>Tampa</strong> <strong>Bay</strong>, but Hillsborough <strong>Bay</strong> is almost<br />
always lower. During the past decade,<br />
bottom oxygen 1 evel s have decl ined<br />
slightly and surface levels have increased<br />
at bay areas other than Hillsborough <strong>Bay</strong>.<br />
Bottom oxygen conditions regulate<br />
benthic fauna composition. In<br />
Hi1 1 sborough <strong>Bay</strong> annual anoxia affects<br />
density and dlversi ty patterns <strong>of</strong> benthic<br />
invertebrates (Santos and Simon 1980a).<br />
Anoxia in residential canals also causes<br />
fish kills (HCEPC 1984). <strong>The</strong> extent to<br />
which anoxic or near anoxic conditions in<br />
<strong>Tampa</strong> <strong>Bay</strong> are natural or cultural in<br />
origin is not known, but all<br />
circumstantial evidence imp1 i cates<br />
municipal wastes as the primary factor.<br />
Lisht. Light regulates productivity<br />
<strong>of</strong> phytoplankton and seagrasses in<br />
estuaries (Odum et a1 . 1974), a1 though an<br />
appreciation that light is a limit to<br />
productivity in <strong>Tampa</strong> <strong>Bay</strong> (or other<br />
shallow, inshore waters <strong>of</strong> the <strong>Florida</strong><br />
gulf coast) is recent (McClelland 1984).<br />
Much data on transparency and lightattenuating<br />
factors are avail able.<br />
Secchi disk measurements are<br />
available from the 1950's to the present.<br />
Unpublished studies in Sarasota <strong>Bay</strong>,<br />
immediately south <strong>of</strong> Anna Maria Sound,<br />
determined that 25%-30% <strong>of</strong> incident light<br />
in the photo-synthetical ly active range<br />
(PAR) <strong>of</strong> wavelengths penetrated to the<br />
Secchi depth (0.5-10.0 m), irrespective <strong>of</strong><br />
water mass. <strong>The</strong> amount <strong>of</strong> 1 ight required<br />
to sustain benthic algae and seagrass in<br />
<strong>Tampa</strong> <strong>Bay</strong> is not known, but for<br />
discussion's sake can be set<br />
conservatively as 1 ight available at the<br />
Secchi depth. This implies areas where<br />
real depth exceeds Secchi depth would not<br />
receive enough light to support benthic<br />
vegetation.<br />
Several years <strong>of</strong> HCEPC monitoring<br />
(Figure 38) reveal that the least<br />
transparent waters <strong>of</strong> <strong>Tampa</strong> <strong>Bay</strong> occur<br />
regularly in Hillsborough <strong>Bay</strong> and much <strong>of</strong><br />
Old <strong>Tampa</strong> <strong>Bay</strong>, where mean annual light<br />
penetration is less than 1.3 m (Figure<br />
39). Mean depths in these bay areas are<br />
3.2 m and 2.8 m, respectively. Light<br />
penetration improves in <strong>Tampa</strong> <strong>Bay</strong> except<br />
near the eastern shore in summer and is<br />
deepest near the bay entrance (greater<br />
than 2.8 m mean annual light penetration).<br />
LOWER TAICA M V %.,.<br />
3 04<br />
1 I 1 1 1 1 1<br />
J F M A U J J & 8 0 Y D<br />
MONTH<br />
Figure 37. Mean monthly dissolved oxygen in 1982<br />
near the bottom in <strong>Tampa</strong> <strong>Bay</strong> (HCEPC 1984).<br />
Figure 38. Mean annual effective (Secchi) light<br />
penetration in <strong>Tampa</strong> <strong>Bay</strong> lHECPC 1984).
Figure 39. Mean annual effective (Secchi) light<br />
penetration in 1982 (HCEPC 1984).<br />
Effective 1 fght penetration varies<br />
seasonally (Figure 40) in relation to<br />
run<strong>of</strong>f, phytoplankton blooms, and other<br />
factors, Transparency was greatest in<br />
January through March and decayed durlng<br />
April-September, so that by the fourth<br />
quarter <strong>of</strong> the year mean Secchi depths<br />
were less than 2.0 m everywhere north <strong>of</strong><br />
the Sunshine Skyway Bridge.<br />
Attenuation <strong>of</strong> light is caused by<br />
scattering and absorption. Color,<br />
chlorophyll, turbidity, and organic carbon<br />
are parameters useful in identifying<br />
causes <strong>of</strong> attenuation. Color is caused<br />
primarily by dt scharge <strong>of</strong> natural metal1 ic<br />
ions, tannins, 1 ignins, and other organic<br />
molecules from rivers and forested<br />
embayments such as Cockroach <strong>Bay</strong>. Color<br />
is greatest during the wet season.<br />
Patterns and trends <strong>of</strong> coloF in areas <strong>of</strong><br />
fampa <strong>Bay</strong> resemble those described for<br />
Secchi data, indicating the importance <strong>of</strong><br />
color as a factor in transparency (Figure<br />
41).<br />
Chlorophyll in phytopl ankt.on absorbs<br />
light, and the cells containing it scatter<br />
1 ight. Chlorophyll a has been measured<br />
at middepth by the HCEPC. Pigment<br />
concentrations are highest (greater than<br />
20 pg/r) in Hi1 1 sborough <strong>Bay</strong> and a1 ong the<br />
eastern shoreline south to Ruskin. Low<br />
values (less than 5 pg/l) are typical in<br />
lower <strong>Tampa</strong> <strong>Bay</strong>. Mean annual pigment<br />
concentrations in Old <strong>Tampa</strong> <strong>Bay</strong> vary and<br />
are usually highest near the Largo Inlet,<br />
<strong>The</strong> contribution <strong>of</strong> phytoplankton to 1 ight<br />
attenuation is probably understated by<br />
concentrations measured at middepth, since<br />
all HCEPC collections are made in<br />
day1 ight, when more plankton usually is<br />
near the surface. A complete<br />
understanding <strong>of</strong> light dynamics in the bay<br />
will require synoptic Secchi disk,<br />
transmissivity, and surface chemistry data<br />
(including chlorophyll), since only the<br />
water column above the Secchi depth is<br />
photical ly relevant.<br />
Chlorophyll is a partial indicator <strong>of</strong><br />
overall turbidity. Another indicator is<br />
total suspended sol ids, which are usually<br />
quantified as the weight <strong>of</strong> all filterable<br />
material in suspension (total solids) or<br />
the weight <strong>of</strong> organic material in<br />
suspension (volatile sol ids). Turbidity<br />
may also be measured as the loss <strong>of</strong> light<br />
through a water column (Jackson Turbidity<br />
Units or JTU) or normal scattering <strong>of</strong><br />
1 ight (nephelometric turbidity units or<br />
NTU). <strong>The</strong> latter units are roughly<br />
equivalent. Goodwin and Michael is (1981)<br />
re1 ated these turbidity measures for <strong>Tampa</strong><br />
<strong>Bay</strong> (Figure 42) by the expressions:<br />
Volatile solids = 0.456 (suspended solids)<br />
Nephelometric turbidity = 0.265 (suspended solids)' .l 55<br />
(Cm. Transparency-10) x Nephelometric turbidity = 500.<br />
It follows from these relations that<br />
suspended solids in the bay are (a)<br />
largely organic; and (b) contribute to<br />
variation in nephelometric turbidity,<br />
which in turn varies as the hyperbolic<br />
inverse <strong>of</strong> transparency (Secchi depth).
Figure 40. C<br />
(Secchi) light penetration
(Platinurn-Cobalt Units)<br />
Figure 41. <strong>Bay</strong>-wide distributions <strong>of</strong> light related parameters in 1982 (HCEPC 1964).
. Hillsborough <strong>Bay</strong><br />
'South <strong>Tampa</strong> <strong>Bay</strong><br />
Least-squares regression line<br />
VS = 0 . 4 5 6 ~ ~ ~ ~ ~ ~ ~<br />
. .<br />
,' ,,,' ,'<br />
-<br />
1 10 100 1,000 10,000 100.m<br />
SUSPENDED SOLIDS (mgll)<br />
.Hillsborough <strong>Bay</strong><br />
'South <strong>Tampa</strong> <strong>Bay</strong><br />
. ,<br />
between turbidity<br />
suspended solids (s<br />
/<br />
7 = 0.265ss'.'~~ standard<br />
/' '<br />
,;(<br />
,/, ,'. ,/<br />
,(,,' ;,<br />
,y,/<br />
deviation<br />
I<br />
10 100 1.w 10,000 100,000<br />
SUSPENDED SOLIDS (mgfll<br />
Ernplrical hyperbolic relation<br />
between transparency (TR)<br />
TURBIDITY (Nephelometric turbidity units)<br />
Figure 42. Relation <strong>of</strong> organic solids to transparency<br />
in <strong>Tampa</strong> <strong>Bay</strong> (Goodwin and Michaelis 1981).<br />
Based on HCEPC data, nephelometric<br />
turbidity usually is greatest in<br />
Hi1 1 sborough <strong>Bay</strong> and Largo In1 et (Figure<br />
41C), a1 though re1 atively high values are<br />
possible near Mu1 let Key. Otherwise, mean<br />
annual turbidity for bay waters is 3-5<br />
NTU. For the past decade, mean annual<br />
turbidity has ranged from 3.3 to 7.3 NTU<br />
for all bay sectors. <strong>The</strong> year 1980 was<br />
exceptional for 1 ow turbidity throughout<br />
the bay. Mean annual Secchi depths were<br />
about 1 m, mean annual color and turbidity<br />
were lower than for any other year on<br />
record. Chlorophyll was lower than<br />
previous years but still greater than 20.0<br />
1.19/1.<br />
<strong>The</strong> 1980 data and 10-year trends<br />
suggest that transparency in lower <strong>Tampa</strong><br />
<strong>Bay</strong> is control led by nonplanktonic<br />
turbidity, whereas plankton (as chlorophyll<br />
a ) controls transparency in<br />
Hillsborough <strong>Bay</strong>. Lower <strong>Tampa</strong> <strong>Bay</strong> mean<br />
annual transparency decl ined during<br />
1975-79 and rose thereafter (HCEPC 1984).<br />
Chlorophyll a and color were relatively<br />
constant for the same period, whereas<br />
turbidity rose from a 1975 low and peaked<br />
in 1978. We conclude that turbidity in<br />
the lower bay was either mineral or<br />
nonliving organic matter. In Hillsborough<br />
<strong>Bay</strong> transparency has been low and annual<br />
means have increased slightly. Transparency<br />
and chlorophyll data are relatively<br />
high and steady compared to color<br />
and turbidity, indicating that phytoplankton<br />
is the major factor controlling<br />
1 ight penetration.<br />
Turbidity is caused by ship traffic<br />
(Goetz and Goodwin 1980), suspension <strong>of</strong><br />
bottom sediments by currents and run<strong>of</strong>f,<br />
sewage outf a1 1 s and dredging (HCEPC<br />
1977-84). <strong>The</strong> extent to which dredging<br />
changes turbidity 1 eve1 s is much di sputed.<br />
Using HCEPC and other data, Goodwin and<br />
Michael is (1981) concluded that harbor<br />
deepening did not raise mean turbidity<br />
levels in Hi1 1 sborough <strong>Bay</strong> or lower <strong>Tampa</strong><br />
<strong>Bay</strong>, but that seasonal turbidity minima<br />
may have been slightly raised (Figure 43).<br />
Scientists at HCEPC interpret their data<br />
much differently:<br />
elatively high values [<strong>of</strong><br />
turbidity] in the vicinity <strong>of</strong> Mullet<br />
Key were the result <strong>of</strong> dredging<br />
operations occurring in that area as
TIME (yr)<br />
1978 1979 1980<br />
* n%br.rn$jt) trrrt~~dttk Stdnci
Disagreement on the effects <strong>of</strong><br />
dredging results in part from the<br />
different time frames used in each<br />
investigation, and also because neither<br />
study was designed nor executed to monitor<br />
dredging effects over local areas within<br />
the bay.<br />
2.5.3. Nutrients<br />
Phosphorus and nitrogen in elemental<br />
form and in molecular combination with<br />
other common elements are taken up by<br />
estuarine plants and animals for use in<br />
metabol i sm, structural growth, and<br />
reproduction. When an increase in<br />
avail abi 1 i ty <strong>of</strong> these substances stimulates<br />
biological activity, they are<br />
inferred to be limiting nutrients. In<br />
some cases si 1 ica can 1 imi t phytopl ankton<br />
growth and organic carbon may limit<br />
secondary production.<br />
coastal waters, <strong>Tampa</strong> <strong>Bay</strong> is considerably<br />
enriched in phosphate. In fact, no other<br />
major estuarine or coastal area we know <strong>of</strong><br />
even comes close to having as high a<br />
phosphate concentration. " <strong>The</strong>ir analysis<br />
confirmed the ranking <strong>of</strong> Hi1 1 sborough <strong>Bay</strong><br />
as highest in phosphate concentration,<br />
followed by upper <strong>Tampa</strong> <strong>Bay</strong>, Old <strong>Tampa</strong><br />
<strong>Bay</strong>, lower <strong>Tampa</strong> <strong>Bay</strong>, and Boca Ciega <strong>Bay</strong>.<br />
Fanning and Bell (1985) detected little<br />
evidence for seasonal i ty in phosphate<br />
trends except for the possibility <strong>of</strong> a<br />
minor winter minimum. Simon (1974) cited<br />
Taylor and Saloman (1968), Saloman and<br />
Taylor (1972) and data from the<br />
Hi 11 sborough County Environmental<br />
Protection Commi ssion to document a<br />
progressive enrichment <strong>of</strong> total phosphorus<br />
from 1952 to 1972. Thsre has been a<br />
reduction in mean annual phosphate<br />
concentration in Hi 11 sborough <strong>Bay</strong> and<br />
other bay segments since 1972 (Figure 44).<br />
Forms and amounts <strong>of</strong> phosphorus and<br />
nitrogen in <strong>Tampa</strong> <strong>Bay</strong> have received the<br />
most study due to their role in<br />
stimulating excessive algal growth. In<br />
1967, the Federal Water Pollution Control<br />
Admini stration (FWPCA 1969) studied odor<br />
in Hillsborough <strong>Bay</strong> and concluded the<br />
following:<br />
(1) Massive amounts <strong>of</strong> carbonaceous<br />
organic materi a1 , phosphorus, and<br />
nitrogen were discharged by the<br />
A1 afia and Hi1 1 sborough Rivers, <strong>Tampa</strong><br />
and MacDill Air Force Base sewage<br />
treatment ~l ants. and ~hos~hate<br />
chemical pl ants. '<br />
(2) Phosphorus, nitrogen, and chl orophyll<br />
1 eve1 s indicated rapid<br />
eutrophication, including changes to<br />
sediment chemistry in Hill sborough<br />
<strong>Bay</strong>.<br />
(3) Eutrophic conditions stimulated<br />
blooms <strong>of</strong> the macroal gae Graci 1 ari a,<br />
which decomposed along residential<br />
shore1 ines.<br />
(4) Nitrogen avai 1 abi 1 i ty was 1 imi t i ng<br />
still greater production <strong>of</strong><br />
phytoplankton and Graci 1 aria.<br />
<strong>The</strong> Alafia River is regarded as the<br />
primary source <strong>of</strong> phosphorus to<br />
Hillsborough <strong>Bay</strong>, due to naturally high<br />
background 1 evel s, upstream discharges <strong>of</strong><br />
mining and beneficiation operations,<br />
phosphate chemical processing at the river<br />
mouth, and leaking durind loading <strong>of</strong><br />
ships. <strong>The</strong>re is, however, not much<br />
evidence supporting the view that<br />
naturally high levels <strong>of</strong> phosphate in the<br />
Alafia River basin cause elevated levels<br />
I OYCRILL AVERAGE<br />
n HtrrssoaouoH srr<br />
0 SOUTH TAMP4 BAY 1<br />
1812 1874 18:s 1 u at<br />
YEAR<br />
Phosphorus. Fanning and Be1 1 (1985)<br />
stated "Compared to other estuaries and<br />
Figure 44. Trend in phosphate concentrations in<br />
<strong>Tampa</strong> <strong>Bay</strong>, 1972-1st (Fanning and Bell 1985).
<strong>of</strong> the nutrient in <strong>Tampa</strong> <strong>Bay</strong> as opposed to<br />
Hlllsborough <strong>Bay</strong>, <strong>The</strong> Little Manatee<br />
River drains simil ar geological formations<br />
but concentrations and loads <strong>of</strong> phosphorus<br />
are very much lower (<strong>Florida</strong> Department <strong>of</strong><br />
Environmental Regulation 1982; Dooris and<br />
Dooris 1985). <strong>The</strong> primary sources <strong>of</strong><br />
phosphorus to W.illsborough <strong>Bay</strong> have been<br />
discharges by the phosphate industry<br />
(Toler 3967). Recycling <strong>of</strong> process and<br />
nonprocess wastewater by the industry has<br />
resulted in a decline in total phosphorus<br />
loading to the Alafia River for the past<br />
decade, a trend also reflected in fluoride<br />
concentrations.<br />
Ross et al. (1984) suggested a mas<br />
balance for phosphate in which 1.07 x 10 f<br />
kg are in storage (plants, animals,<br />
sediments, and waters) ; inputs result From<br />
rain (45 kg/day), point and nonpoint<br />
sources (11,lIO kg/day)<br />
and benthic flux<br />
(9,300 kg/day); and exports result from<br />
tidal exchange ( - 19,960 kglday) , benthic<br />
flux (-22,120 kg/day) and other routes<br />
(-1,510 kg/day), Interesting aspects <strong>of</strong><br />
thh proposal are the ratio <strong>of</strong> storage to<br />
egchange, the re1 ative balance <strong>of</strong> imports<br />
and exports, and the net loading <strong>of</strong><br />
phosphate ta sediments. Fanning and Bell<br />
(1985) speculated that tributary loads <strong>of</strong><br />
phosphorus to the bay may be able to<br />
raplace phosphate In the water column <strong>of</strong><br />
the bey in about 1 month or less, and that<br />
srdimontary sources could cause the same<br />
replacemant in 30-300 days. <strong>The</strong>y conclude<br />
that the input and flow <strong>of</strong> phosphorus<br />
through the biological system <strong>of</strong> the bay<br />
could be tremendous, and they urge more<br />
study an the subject.<br />
i . Nitrogen is generally<br />
r*t; ardcd as the I imiting macronutrient for<br />
pr 7 tndry prodtkctlon in <strong>Tampa</strong> Ray, Nitrogen<br />
occurs it1 spawater as a dissolved gas and<br />
a
Figure 45. Nutrient distributions (mg/l) in <strong>Tampa</strong> <strong>Bay</strong>. (A) Ortho-P, Sept. 1972; (B) NH4, Dec. 1973;<br />
(C) NO3, Dec. 1972; (Dl Organic-N, Dec, 1973 (Goetz and Goodwin 1980).
many other estuaries. Fanning and Bell<br />
reported a mean ratio <strong>of</strong> NH3 to total<br />
inorganic nitrogen <strong>of</strong> 0.84 (range<br />
0.54-0.99).<br />
Ross et al. (1984) outlined the<br />
dimensions <strong>of</strong> a prel iminary nitrogen<br />
budget for <strong>Tampa</strong> <strong>Bay</strong>. <strong>The</strong>y suggested a<br />
nitrogen storage <strong>of</strong> 3.87 x lo7 kg, inputs<br />
from rain and cultural sources, (21,470<br />
kg/day) and benthic releases (55,750<br />
kglday) . Exports occur in tidal exchange<br />
(-16,100 kg/day) , biological losses<br />
(-8,140 kg/day) , and benthic uptake<br />
(-53,000 kg/day). By these estimates the<br />
benthos is a net source <strong>of</strong> nitrogen and is<br />
acting as a sink for phosphorus. Fanning<br />
and Bell (1985) computed a rapid turnover<br />
rate for nitrite and nitrate through <strong>Tampa</strong><br />
<strong>Bay</strong> <strong>of</strong> about 1.4 months, due to run<strong>of</strong>f.<br />
<strong>The</strong>y also estimated that benthic releases<br />
<strong>of</strong> ammonia could rep1 ace the over1 yi ng<br />
ammonia in 14 days.<br />
Nutrient relationshi~s. Fanning and<br />
Bell (1985) calculated a ratio <strong>of</strong> nitrogen<br />
to phosphorus <strong>of</strong> 0.3 in 1972 and 1.3 in<br />
1981 and concluded that phytopl ankton have<br />
been nitrogen-1 imi ted since 1972. <strong>The</strong>y<br />
cautioned against an interpretation that<br />
nitrogen 1 imitation has decl ined; rather,<br />
lower phosphate levels indicate that<br />
plants may be consuming more <strong>of</strong> the<br />
avai 1 able phosphate. McCl el 1 and (1984)<br />
found correlations <strong>of</strong> organic and total<br />
nitrogen, ortho and total phosphorus, and<br />
orthophosphorus and chlorophyll a , but<br />
concluded that all were trivial<br />
re1 ationshi ps.<br />
2.5.4. Sediments<br />
Despite the fact that since the<br />
1950's sediment composition and chemistry<br />
have been known to influence ecological<br />
conditions in <strong>Tampa</strong> <strong>Bay</strong> (Dawson 1953,<br />
Hutton et al. 1956) comparatively little<br />
is known <strong>of</strong> sediment structure or<br />
dynami cs . <strong>The</strong> most authoritative,<br />
descriptive work, by Goodel 1 and Gorsl ine<br />
(19611, is 25 years old. Methods for<br />
sediment-water nutrient exchange are<br />
recent and have been used only in small<br />
areas <strong>of</strong> the bay during the past few<br />
years.<br />
Granulometrv. Sedimentary types<br />
correspond with bathymetric features <strong>of</strong><br />
<strong>Tampa</strong> <strong>Bay</strong> (Goodel 1 and Gorsl ine 1961) . In<br />
sand and grass flats less than 2 m deep,<br />
mean grain size was 2.92 phi and sediment<br />
was 2.7% carbonate. In deeper natural<br />
channels more than 6 m deep, mean grain<br />
size was 2.05 phi and sediment was 25.2%<br />
carbonate. Lagoonal beaches were about<br />
28% carbonate, whereas mangrove beaches<br />
contained no carbonate.<br />
Mean grain size decreased from 2.2<br />
phi at the entrance to <strong>Tampa</strong> <strong>Bay</strong> to 3.20<br />
phi at its head (Figure 46). Mean<br />
carbonate content decreased from 16% to 2%<br />
over the same distance. Deeper waters in<br />
lower <strong>Tampa</strong> <strong>Bay</strong> had coarser sediments that<br />
contained more carbonate than average.<br />
Hillsborough <strong>Bay</strong> had finer sediment than<br />
average (mostly silt), and sediments<br />
between Interbay Peninsula and Big Bend<br />
had above-average amounts <strong>of</strong> carbonate.<br />
Organic content and sorting increased from<br />
the southeast side <strong>of</strong> lower <strong>Tampa</strong> <strong>Bay</strong> to<br />
the northwest corner <strong>of</strong> Old <strong>Tampa</strong> <strong>Bay</strong>, in<br />
a pattern almost 90° to the plane <strong>of</strong> mean<br />
grain size. <strong>The</strong>se results were<br />
interpreted as evidence for two<br />
sedimentary popul ations, terrigenous and<br />
biogenic, which are <strong>of</strong> similar density and<br />
travel together.<br />
Chemistry. Organic carbon and<br />
nitrogen and total phosphate distributions<br />
in Hillsborough <strong>Bay</strong> sediments were<br />
determined in 1968 by FWPCA (1969). All<br />
three constituents were in greatest<br />
concentration at the mouth <strong>of</strong> the Alafia<br />
River. Organic carbon and nitrogen<br />
concentrations were also high at Hookers<br />
Point and south <strong>of</strong> Long Shoal, east <strong>of</strong> the<br />
MacDill Air Force Base sewage treatment<br />
plant outfall. <strong>The</strong>se distributions may be<br />
different in 1985, because <strong>of</strong> extensive<br />
dredging and filling by the U.S. Army<br />
Corps <strong>of</strong> Engineers and improved municipal<br />
effluent qua1 i ty, but Hi1 1 sborough <strong>Bay</strong> is<br />
still an area <strong>of</strong> exceptional oxygen demand<br />
and uptake <strong>of</strong> ammonia and orthophosphate<br />
(McCl el 1 and 1984). Shore1 i ne areas <strong>of</strong> 01 d<br />
<strong>Tampa</strong> <strong>Bay</strong> also have rapid flux rates with<br />
regard to these parameters (Figures 47<br />
through 49).<br />
McClelland (1984) gave rates for<br />
constituent release from sediments in<br />
Hi1 lsborough <strong>Bay</strong> as 58 75 mg/m2/day<br />
(ammonia), 40.43 mg/mZ/day (total
,U-;r"a -- ,-,<br />
Total Texture<br />
.;>,our....<br />
,-'.<br />
*IIOYLIE*I<br />
Explanation <strong>of</strong> Rates<br />
H = High rate (4.0 rng P/hrlrn2)<br />
M<br />
'$<br />
= Medium rate 13.0 rng ~ihrim~1<br />
-1 All other areas low rate 11.0 mg plhrlm2)<br />
Figure 47. Orthophosphate uptake by bay sediments<br />
(McClelland 1984).<br />
Explanation <strong>of</strong> Rates<br />
ID I' Xll(l"LICHI<br />
Figure 46. Regional trend in (A) mean sediment grain<br />
size (phi) and (B) weight percent <strong>of</strong> carbonates in Figure 48. Ammonia uptake by bay sediments<br />
<strong>Tampa</strong> <strong>Bay</strong> (Goodell and Gorsline 1961). (McCleliand 1384).
extreme. On the other hand, vertical<br />
gradients in dissolved oxygen are strong;<br />
oxygen levels wary greatly due to<br />
phytoplankton blooms and sediment demands;<br />
and long periods <strong>of</strong> anoxia are common.<br />
Benthic faunal communities ref1 ect oxygen<br />
stress. Benthic nutrient fluxes are<br />
probably important in regulating<br />
water-column dynamics. Phosphate and<br />
fluoride levels have been very high in the<br />
past but are declining. Harbor projects<br />
may have improved circulation but flushing<br />
remains poor.<br />
2.6.2 Old Tam~a <strong>Bay</strong><br />
Figkxre 4% Olasalvsd: oxygen uptaka by bay sediments<br />
lMcClallend IWl.<br />
phosphate), and 19.88 mg/m2/day (total<br />
n 4 t ragen}. Constituent uptake rates<br />
characteristic <strong>of</strong> the sediments in<br />
Hl l l sbsrough <strong>Bay</strong> were 699.12 mg/m2/day<br />
(total organic carbon) F 6'8 mg/m2/day<br />
(niiri les and nitrates) and 0.54-9.10<br />
g/m /day (oxygen). Ross et al. (1984)<br />
used the same data to compute a baywide<br />
net flux <strong>of</strong> 2,750 kg nitrogenlday from<br />
sadimcnts, and an incorporation <strong>of</strong> 12,823<br />
kg phospharusdday into sediments.<br />
26 AREA SUMMARIES<br />
2-6* 1.<br />
WSllsborough <strong>Bay</strong> is the best studied<br />
area <strong>of</strong> <strong>Tampa</strong> <strong>Bay</strong>. This area is the<br />
deepest, most poorly flushed area; it has<br />
lowest average salinjtier and is aff~cled<br />
most by freshwater input (from 3 rivers),<br />
As a result, sa"9iity stratification<br />
occurs more <strong>of</strong>ten in Hi ll sborough <strong>Bay</strong> than<br />
el sewhere, but such condi t i ans are not<br />
This area is cooler than Hillsborough<br />
<strong>Bay</strong> but not as brackish. Inflows <strong>of</strong><br />
freshwater have been modified extensively<br />
and shoreline areas are rapidly being<br />
urbanized. Old <strong>Tampa</strong> <strong>Bay</strong> is relatively<br />
shallow, and waters south <strong>of</strong> the Courtney<br />
Campbell Causeway are moderate1 y we1 1<br />
flushed. Waters north <strong>of</strong> the causeway and<br />
in the Largo Inlet area have exhibited<br />
signs <strong>of</strong> eutrophication during the past<br />
decade. Because <strong>of</strong> development in the<br />
area and water qua1 i ty projections by<br />
McCIelland (1984) there is great concern<br />
that sediment conditions and water quality<br />
will deteriorate rapidly by the year 2000.<br />
2.6.3 Middle Tamoa <strong>Bay</strong><br />
Thi s area <strong>of</strong> geographical transition<br />
is also where physical and chemical<br />
gradients between the lower and upper bays<br />
are pronounced. Ci rcul at ion is good,<br />
a1 though flushing is variable depending on<br />
location. <strong>The</strong> eastern shore is not as<br />
highly developed as the western shore but<br />
is influenced in wet years by Hillsborough<br />
<strong>Bay</strong> and inadequate sewage treatment.<br />
General water quality <strong>of</strong>f St. Petersburg<br />
has been erratic and may foreshadow<br />
deterioration. Loss <strong>of</strong> transparency is a<br />
particular threat to this area, because<br />
seagrass loss has not been severe but may<br />
increase as 1 ight decl ines.<br />
2.6.4 Lower Tamoa Bav<br />
Because <strong>of</strong> its proximity to the Gulf<br />
<strong>of</strong> Hexico, this area continues to be least<br />
affected by cu1 tural influences.<br />
Circulation and flushing are comparatively<br />
good. Temperature and sal i ni<br />
ty ranges are<br />
lower than in upper bay areas. Oxygen and
transparency 1 eve1 s are high. Overall<br />
water quality is high and better where the<br />
area meets all other areas, except Boca<br />
Ciega <strong>Bay</strong>. <strong>The</strong> waters <strong>of</strong> lower <strong>Tampa</strong> <strong>Bay</strong><br />
are threatened most by maintenance and<br />
deepening <strong>of</strong> channels in the north and<br />
nutrient enrichment in the south.<br />
2.6.5 Boca Cieqa <strong>Bay</strong><br />
This area was investigated by the<br />
U.S. Bureau <strong>of</strong> Commercial Fisheries in the<br />
1950's and 1960's, when it was subject to<br />
extensive dredging and fill ing for<br />
residential waterfront property<br />
development. Simon (1974) summarized the<br />
early studies, but except for Geo-Marine,<br />
Inc. (1973) few recent data are reported.<br />
<strong>The</strong> bay has been channelized and filled<br />
extensively. Anaerobic sediments are<br />
found in poorly flushed canals and other<br />
areas. Nutrient concentrations are high<br />
and increased during the past decade<br />
because <strong>of</strong> sewage plant effluents and<br />
stormwaters. Light penetration is poor<br />
much <strong>of</strong> the time and phytoplankton blooms<br />
cause erratic oxygen variations.<br />
2.6.6. Terra Ceia Bav and the Manatee<br />
River<br />
<strong>The</strong>se areas have warmer winter air<br />
temperatures and as a result have the<br />
largest mangroves in <strong>Tampa</strong> <strong>Bay</strong>. Terra<br />
Ceia <strong>Bay</strong> and surrounding waters (including<br />
Bishop Harbor) were declared an aquatic<br />
preserve by the State <strong>of</strong> <strong>Florida</strong> in 1984<br />
because <strong>of</strong> high overall environmental<br />
quality. <strong>The</strong> bay is subject to oxygen and<br />
transparency depressions in the wet season<br />
due to run<strong>of</strong>f, but in this area such<br />
trends are natural. Conditions in the<br />
Manatee River are poorer than Terra Ceia<br />
<strong>Bay</strong> but the river as a whole is in good<br />
condition. Sediments near Bradenton are<br />
organic and anoxic because <strong>of</strong> municipal<br />
and industri a1 effluent; nutrients in the<br />
middle river are consequently high and<br />
phytopl ankton blooms reduce oxygen 1 eve1 s<br />
to lower than State standards. Withdrawal<br />
<strong>of</strong> freshwater from the Manatee River and<br />
its tributary, the Braden River, pose<br />
serious threats to the integrity <strong>of</strong> this<br />
environment by el iminating dry-season<br />
flows and reducing wet-season flows. <strong>The</strong><br />
Manatee River del i vers more organic<br />
nitrogen to <strong>Tampa</strong> <strong>Bay</strong> than any other<br />
river, and additional loading is likely to<br />
occur.<br />
2.7 COMPARISON OF TAMPA BAY TO<br />
CHARLOlTE HARBOR<br />
<strong>The</strong> natural history <strong>of</strong> Charlotte<br />
Harbor was reviewed by Taylor (1974) and<br />
Estevez (1981). Comparisons to <strong>Tampa</strong> <strong>Bay</strong><br />
are based on these reviews, which should<br />
be consulted for references to original<br />
1 i terature.<br />
Charlotte Harbor and its adjacent<br />
estuarine waters are about 70 square miles<br />
smaller than <strong>Tampa</strong> <strong>Bay</strong>. <strong>The</strong> harbor has<br />
nearly the same original shore1 ine. Like<br />
the bay, the harbor is Y-shaped, but its<br />
upper reaches are much narrower. <strong>The</strong>ir<br />
mean depths are comparable, as are their<br />
re1 ative depth distributions. <strong>The</strong> harbor<br />
has a more extensive lagoonal system than<br />
<strong>Tampa</strong> <strong>Bay</strong> (and for that reason had about<br />
two to three times more original seagrass<br />
acreage). Sediment cornposi ti on i s very<br />
similar in the two estuaries.<br />
<strong>The</strong> climate around Charlotte Harbor<br />
is warmer but only slightly wetter than<br />
<strong>Tampa</strong> <strong>Bay</strong>. However, run<strong>of</strong>f to the harbor<br />
and adjacent inshore waters is about onethird<br />
greater, or twice as great if the<br />
Caloosahatchee River is considered. <strong>The</strong><br />
Myakka River resembles the Little Manatee<br />
River in <strong>Tampa</strong> <strong>Bay</strong>, because both have low<br />
flows and periods <strong>of</strong> no flow, but no bay<br />
counterpart exists for the Peace River.<br />
Discharges from the Peace River cause a<br />
pronounced density stratification<br />
throughout much <strong>of</strong> the harbor, which is<br />
accompanied by vertical oxygen gradients<br />
and anoxia. Density stratification<br />
distinguishes Charlotte Harbor from <strong>Tampa</strong><br />
<strong>Bay</strong>, and oxygen dynamics in the harbor<br />
resemble that seen in Hillsborough <strong>Bay</strong>.<br />
<strong>The</strong> 1 atter area's dominant and<br />
characteristic phytoplankton blooms are<br />
also shared by the upper and middle<br />
portions <strong>of</strong> Charlotte Harbor.<br />
Dissol ved oxygen 1 eve1 s are simi 1 ar<br />
in Charlotte Harbor and <strong>Tampa</strong> <strong>Bay</strong>, a fact<br />
which deserves considerable investigation<br />
ins<strong>of</strong>ar as ecological consequences are<br />
concerned because the bays have much<br />
different salinity structures. In<br />
addition, low oxygen levels in <strong>Tampa</strong> <strong>Bay</strong>
are thought to be caused by human<br />
activities rather than natural forces, but<br />
it may be that biota in the two bays<br />
respond to reduced oxygen in comparable<br />
ways. Total nitrogen levels are roughly<br />
comparable, but total phosphorus is many<br />
times higher in <strong>Tampa</strong> <strong>Bay</strong> than in<br />
Char1 otte Harbor.<br />
It foll ows from this brief comparison<br />
thdt <strong>Tampa</strong> Ray is not physically unlike a<br />
nearby estuary except for different<br />
sal inity structure. Moreover, dissolved<br />
oxygen and nutrient data For the two<br />
systems are intriguing both where they<br />
agree and differ. Additional comparative<br />
studies are needed to understand the<br />
extent to which undesirable conditions in<br />
<strong>Tampa</strong> <strong>Bay</strong> are ec<strong>of</strong> ogicall y re1 evant ,<br />
significant, or reversible. It may be<br />
that widely held views about the two<br />
systems --or even the definition <strong>of</strong><br />
pollution in subtropical estuaries-- need<br />
to be revised.
CHAPTER 3.<br />
BIBLOGICAL CHARACTERISTICS<br />
3.1 PHYTOPLANKTON Skeletonema costatum (Greville)CIeve<br />
Phytoplankton are microscopic<br />
floating plants which are classified by<br />
size or taxonomic group. <strong>The</strong> smallest<br />
phytoplankton (ul trap1 ankton) are 1 ess<br />
than 5 pm in diameter; some <strong>of</strong> the larger<br />
forms in <strong>Tampa</strong> <strong>Bay</strong> may be up to 2 mm in<br />
diameter. <strong>The</strong>re are four principal groups<br />
<strong>of</strong> phytoplankton in <strong>Tampa</strong> <strong>Bay</strong> (Steidinger<br />
and Gardiner 1985) : phytomicr<strong>of</strong>l age11 ates,<br />
diatoms (Figure 50), din<strong>of</strong>l agel 1 ates, and<br />
blue-green algae. <strong>The</strong> early studies <strong>of</strong><br />
phytopl ankton in <strong>Tampa</strong> <strong>Bay</strong> (Marshal 1 1956,<br />
Pomeroy 1960, Dragovich and Kelly 1964,<br />
1966, Taylor 1970, Turner 1972) have been<br />
summarized by Steidinger and Gardiner<br />
(1985). <strong>The</strong>se studies were initiated in<br />
response to the problem <strong>of</strong> blooms (cell<br />
counts usually greater than 50,000 per<br />
1 i ter) o f toxic din<strong>of</strong>lagel 1 ates<br />
(Ptvchodi scus brevi s) , known as "red<br />
tides, " particularly the massive blooms <strong>of</strong><br />
1946-1947. <strong>The</strong> findings <strong>of</strong> all studies to<br />
date can be summarized as follows:<br />
(1) A north-to-south, or head-to-mouth,<br />
gradient exists in phytoplankton<br />
species numbers. In general as one<br />
moves from the less saline upper<br />
portions <strong>of</strong> the bay to the more<br />
saline, lower portions <strong>of</strong> the bay,<br />
water clarity and phytoplankton<br />
species numbers (or "diversity")<br />
increase, while nutrient levels,<br />
chl orophyll 2, and total<br />
phytoplankton cell counts decrease.<br />
<strong>The</strong> frequency <strong>of</strong> phytoplankton blooms<br />
and the eutrophic and turbid nature<br />
<strong>of</strong> the upper bay, particularly Hill s-<br />
borough <strong>Bay</strong>, have been a common<br />
observation in recent years (Federal<br />
Water Pollution Control<br />
Administration 1969; Simon 1974).<br />
25 A<br />
Ptychodiscus brevis (DavisISteidinger<br />
Figure 50. Typical <strong>Tampa</strong> <strong>Bay</strong> phytoplankton.<br />
Skeletonsma costatum is a diatom and Ptychodiscus<br />
brevis a din<strong>of</strong>lagellate.<br />
(2) Nanoplankton (5-20 pm) are generally<br />
the dominant size class <strong>of</strong> the<br />
phytoplankton. Small diatoms and<br />
mi cr<strong>of</strong>l agel 1 ates predominate, except<br />
when certain seasonal, monospeci f i c<br />
bl ooms <strong>of</strong> species <strong>of</strong> bl ue-green a1 gae<br />
(Schizothrix) or din<strong>of</strong>lagellates<br />
(Gymnodi ni urn nel soni i , Cerati um
hi rcus, Procentrum mi cans, Gonvaul ax<br />
spp. and others) dominate in<br />
~iJlsborough <strong>Bay</strong> and Middle <strong>Tampa</strong><br />
<strong>Bay</strong>.<br />
(3) At least 272 species <strong>of</strong> phytoplankton<br />
occur in the bay; the majority (167<br />
<strong>of</strong> 272) are diatoms (Steidinger and<br />
Gardiner 1985). <strong>The</strong> species fall<br />
into two cosmopol i tan classes: those<br />
characteristic <strong>of</strong> temperate and warm<br />
waters and those characteristic <strong>of</strong><br />
warm water only. <strong>The</strong> most dominant<br />
planktonic species is the diatom<br />
Skeletonema costatum. Numerically,<br />
it dominates samples taken between<br />
January and May and again in the<br />
fall. Other diatoms (Rhizosoleni a<br />
spp., Chaetoceros spp.) are dominant<br />
during late spring and summer.<br />
Local ized blooms <strong>of</strong> the bl ue-green<br />
alga Schizothrix calcicola and some<br />
din<strong>of</strong>l age11 ate species (Gonyairl ax<br />
monilata) can complicate this general<br />
pattern.<br />
(4) Short-term fluctuations in species<br />
composition and standing crop are<br />
common. Seven-fold to ten-fold<br />
differences in biomass are reported<br />
within one tidal cycle.<br />
(5) <strong>The</strong> majority <strong>of</strong> the bloom species are<br />
resident in the bay (autochthonous)<br />
but significant blooms occasionally<br />
occur due to species which invade<br />
from the Gulf <strong>of</strong> Mexico<br />
(allochthonous). Blooms <strong>of</strong> the toxic<br />
Ptvchodiscus LreMs originate 16-60<br />
kin <strong>of</strong>fshore <strong>of</strong> the mouth <strong>of</strong> the bay<br />
for reasons as yet unclear, and are<br />
carried into the bay. Between 1946<br />
and 1982, such invasions occurred at<br />
least 12 times (Steidinger and<br />
Gardiner 1985). In 1963 and 1971 the<br />
bloom extended into the upper reaches<br />
<strong>of</strong> the bay and resulted in massive<br />
fish kills. Many factors are<br />
imp1 icated in algal blooms including<br />
salinity regimes, availability <strong>of</strong> an<br />
inoculum, and low rates <strong>of</strong> mixing <strong>of</strong><br />
bay waters. For example, higher than<br />
normal salinities in the upper bay<br />
(up to 31 ppt) during 1963, and 1971<br />
allowed P. brevis to survive and<br />
bloom after invasion from the ocean<br />
(Steidinger and Gardiner 1985). For<br />
the bl ue-green algae Schizothrix,<br />
temperature and high 1 ight to1 erance<br />
are a1 so important. Johansson et a1 .<br />
(1985) noted that Schizothrix<br />
displaced Skel etonema and other<br />
diatoms at peak summer water<br />
temperatures above 30°C, but was<br />
virtually absent between late winter<br />
and early summer.<br />
(6) Many <strong>of</strong> the previous studies utilized<br />
analytical procedures which 1 imi t the<br />
quantitative comparison <strong>of</strong> all data;<br />
some uniform sampl ing strategy and<br />
analytical procedures are needed to<br />
make future data more usable<br />
(Steidinger and Gardiner 1985).<br />
Quarterly sampling and ignoring the<br />
nanopl ankton in taxonomic and<br />
production studies are two <strong>of</strong> the<br />
problem areas,<br />
Primary production studies on<br />
phytoplankton in <strong>Tampa</strong> <strong>Bay</strong> have been<br />
summarized by Johansson et a1. (1985).<br />
Table 10 lists the annual rates reported<br />
in several studies using three different<br />
methods. Whether the different values<br />
over time reflect a real increase in<br />
primary production by phytoplankton or<br />
simply the results <strong>of</strong> different<br />
method01 ogies cannot be determined at<br />
present. Earlier data may be <strong>of</strong> limited<br />
value due to the methodology used (lack <strong>of</strong><br />
grinding), which produces a probable<br />
underestimation <strong>of</strong> chlorophyll a in<br />
eutrophic waters; however, it is reasonable<br />
to assume a real increase in phytoplankton<br />
production due to eutrophication<br />
(Johansson et al. 1 85 . Annual production<br />
<strong>of</strong> 340 g C/m3 is suggested as a<br />
reasonable estimate for phytoplankton<br />
primary production in the deep9r portions<br />
<strong>of</strong> <strong>Tampa</strong> <strong>Bay</strong> and 50 g ~/m2 for shallower<br />
portions based upon the avail able data<br />
(Johansson et a1 . 1985).<br />
3.2 BENTHIC MICROALGAE<br />
Benthic microalgae are species <strong>of</strong><br />
algae, similar to the phytoplankton, that<br />
live on surfaces (sediment, seagrass<br />
blades, rocks) instead <strong>of</strong> being suspended<br />
in the water coiumn. Steidinger and<br />
Gardiner (1985) noted that benthic<br />
microargae have received very little<br />
attention in <strong>Tampa</strong> <strong>Bay</strong>, even though they<br />
may be a significant source <strong>of</strong> food for
Table 10. Estimated annual phytoplankton production rates in the <strong>Tampa</strong> <strong>Bay</strong> system<br />
(g C/m2/yrl (Johansson et at. 1985).<br />
01 d Hi 11 sborough Middl e Lower<br />
Dates and methods <strong>Tampa</strong> <strong>Bay</strong> <strong>Bay</strong> <strong>Tampa</strong> <strong>Bay</strong> <strong>Tampa</strong> <strong>Bay</strong><br />
1968<br />
Chlorophyll t 1 ight 170 270<br />
1965-67<br />
Oxygen<br />
1969-72<br />
Chlorophyll t 1 ight 290 580 490<br />
1973-83<br />
Carbon isotope - - 620 620<br />
many organisms. Primary production rates<br />
<strong>of</strong> 100-200 g c/m2 have been reported for<br />
benthic microalgal communities on shallow<br />
mudflats (Steidinger and Gardiner 1985).<br />
In addition, bacteria and microalgae are<br />
commonly the first colonizers on newly<br />
produced seagrass leaves and are grazed by<br />
organisms living on seagrass blades<br />
(Zieman 1982).<br />
Benthic din<strong>of</strong>lagellates (Amphidinium,<br />
<strong>The</strong>cadinium, Pol ykrikos, Scrioosi-<br />
- ella) can be numerous in sediments.<br />
Durako et al. (1982) demonstrated high<br />
rates <strong>of</strong> oxygen production by such benthic<br />
din<strong>of</strong>lagellates in a <strong>Tampa</strong> <strong>Bay</strong> seagrass<br />
bed.<br />
3.3 EPIPHYTIC MICROALGAE<br />
Epiphytic (living on plants]<br />
microalgae are treated here as a group<br />
separate from the other benthic algae<br />
because <strong>of</strong> their apparent importance in<br />
food webs in other <strong>Florida</strong> estuarjne<br />
systems (Fry 19841, and because those<br />
found growing on seagrass leaves in <strong>Tampa</strong><br />
<strong>Bay</strong> have received some study (Dawes 1985).<br />
<strong>The</strong> most comnion epiphytes are species <strong>of</strong><br />
Chamaia, lornentaria, Polysi~honia,<br />
Acrochaetium, Fosliella, Hy~nea, Soyridia,<br />
Cladosi whon, Ectocar~us, and Cl adoohora.<br />
<strong>The</strong> epiphytic brown algae are typically<br />
more common in winter. Although no<br />
detai 1 ed seasonal and taxonomic studies<br />
have been made on the algal epiphytic<br />
community in <strong>Tampa</strong> <strong>Bay</strong>, studies el sewhere<br />
in <strong>Florida</strong> (Humm 1964; Ballantine and Humm<br />
1975; Hall and Eiseman 1981) have revealed<br />
a diverse population <strong>of</strong> these algae on<br />
seagrass blades; up to 113 species have<br />
been identified during a 1 year study.<br />
<strong>The</strong> possible importance <strong>of</strong> epiphytic algae<br />
in the food web and the general health <strong>of</strong><br />
seagrasses in a eutrophic estuary like<br />
<strong>Tampa</strong> <strong>Bay</strong> will be discussed later. It is<br />
enough to note here that the abundant<br />
caridean shrimp and amphipods found in<br />
<strong>Tampa</strong> <strong>Bay</strong> seagrass meadows have been shown<br />
el sewhere to depend heavily upon seagrass<br />
algal epiphytes as a source <strong>of</strong> food (Ewald<br />
1969; Zimmerman et a1. 1979; Van Montfrans<br />
et al. 1982; Orth and Van Montfrans 1984).<br />
It is 1 ikely that the same dependence will<br />
be found here.<br />
3.4 ATTACHED AND DRIFT MACRQALGAE<br />
Macroal gae are abundant in <strong>Tampa</strong> <strong>Bay</strong><br />
and the 221 identified species from the<br />
bay represent a greater diversity than<br />
that reported for any other estuary in<br />
<strong>Florida</strong> (Dawes 1985). Red and green algae<br />
predominate, with brown algae being more<br />
abundant in the winter and early spring,<br />
though still not predominant .<br />
Ninety-nine species <strong>of</strong> red algae, 68<br />
species <strong>of</strong> green algae, 30 species <strong>of</strong>
own algae, and 1 Xanthophycean alga are<br />
listed by Dawes. Dominant genera include<br />
Gracilaria, -, Ul va Hvpnea, and<br />
Acanthophor3. Al though bl ue-green algae<br />
have not been extensively studied, about<br />
30 species are believed to occur.<br />
<strong>The</strong> ecological role <strong>of</strong> macroalgae in<br />
the bay has not been studied. In other<br />
parts <strong>of</strong> <strong>Florida</strong>, the drift algal<br />
assemblage (u spp., Graci 1 aria<br />
ti kvahiae, Hvpnea spp., Acanthoahora<br />
spicifera) commonly seen in the bay has<br />
been reported to provide fish and<br />
invertebrate habitat (Kulczycki et al.<br />
1981) and possibly food, both by being<br />
directly consumed and as attachment sites<br />
for epiphytic algae that also are directly<br />
consumed (Zimmerman et al. 1979; Lewis<br />
1982b) .<br />
Most studies <strong>of</strong> macroalgae in the bay<br />
have been taxonomic or physiological in<br />
nature (Dawes 1985); have focused on the<br />
overabundance <strong>of</strong> certain pol 1 ut ion<br />
indicator species (U spp., Gracilaria<br />
spp.) whf ch cause aesthetic problems<br />
(Federal Water Pol 1 uti on Control<br />
Administration 1969); have been implicated<br />
in the el imination <strong>of</strong> seagrass meadows<br />
from certain parts <strong>of</strong> the bay (Guist and<br />
Humm 1976) ; or have anecdotally reported<br />
consumption <strong>of</strong> macroalgae by manatees<br />
(Lewis et a1 . 1984). <strong>The</strong> Federal Water<br />
Pollution Control Administration (1969)<br />
studied the abundance and distribution <strong>of</strong><br />
macroalgae in Hillsborough and Old <strong>Tampa</strong><br />
<strong>Bay</strong> to determine the source <strong>of</strong> odor<br />
problems reported by residents a1 ong the<br />
western shore <strong>of</strong> Hillsborough <strong>Bay</strong>. <strong>The</strong><br />
study concluded that the odors were caused<br />
by excessive nutrient concentrations which<br />
led to massive blooms <strong>of</strong> the macroalga<br />
Gracilaria tikvahiae. This species, in<br />
turn, was killed by normal salinity<br />
reductions during times <strong>of</strong> heavy rainfall<br />
and decayed to produce the odor.<br />
More recently, after a period when a<br />
relatively low standing crop <strong>of</strong> macroalgae<br />
was observed --in conjunction with tne<br />
upgrading <strong>of</strong> treatments by major<br />
dischargers- - a bl oom <strong>of</strong> a1 gae occurred in<br />
1982. As a result, a I-year study <strong>of</strong> the<br />
distribution and abundance <strong>of</strong> macroalgae<br />
in Hi1 l sborough <strong>Bay</strong> was funded by the City<br />
<strong>of</strong> <strong>Tampa</strong> (Mangrove Systems, Inc. 1985).<br />
<strong>The</strong> results <strong>of</strong> that study indicated that<br />
large blooms <strong>of</strong> macroalgae still are<br />
occurring in Hillsborough <strong>Bay</strong>, and that<br />
seasonal and 1 arge-scal e, year-to-year<br />
variations may occur for reasons not well<br />
understood. Figure 51 shows the total<br />
estimated dry weight standing crop <strong>of</strong><br />
macroalgae in Hi 11 sborough <strong>Bay</strong> based upon<br />
quantitative sampl ing at eight permanent<br />
and three to four floating stations<br />
sampled monthly between February 1983 and<br />
April 1984. Normal year-to-year water<br />
temperature variations may be important.<br />
In any case, nutrient concentrations in<br />
the upper portions <strong>of</strong> the bay do not<br />
appear to have been reduced enough to<br />
1 imi t the macroalgal blooms.<br />
Rates <strong>of</strong> primary production by <strong>Tampa</strong><br />
<strong>Bay</strong> macroalgae <strong>of</strong> approximately 70 g<br />
~/m~/~r have been measured in both<br />
1 aboratory and field experiments (H<strong>of</strong>fman<br />
and Dawes 1980, Oawes 1985). <strong>The</strong> data are<br />
very sparse, and much additional work,<br />
particul arly seasonal field measurements,<br />
is needed.<br />
3.5 SEAGRASS MEADOWS<br />
Seagrasses are submerged flowering<br />
plants with true roots and stems (Figure<br />
52) and are quite different from<br />
"seaweeds" (rnacroal gae) , nonflowering<br />
alga1 species without true roots. Lewis<br />
24<br />
22<br />
@<br />
'<br />
SHALLOW WATER<br />
_. 20<br />
(depth less than 1 fathom MLW)<br />
0<br />
0<br />
0, 18 DEEP WATER<br />
o<br />
(depth greater llm~i 1 fathom MLWi<br />
0 1s<br />
-7 14<br />
I-<br />
= 12<br />
C7<br />
10<br />
3<br />
>- 8<br />
a<br />
6<br />
0<br />
* 4<br />
2<br />
0<br />
F M A M J J A S O N D J F M A<br />
E<br />
A<br />
B 1083 MONTH N 1984<br />
Figure 51. Estimated total drift algae standing crops<br />
in Hillsborough <strong>Bay</strong> during February 1983-April 1984<br />
(Mangrove Systems, Inc. 1985).
derived from actual transects establ ished<br />
during 1979-80 (Lewis and Phil 1 ips 1980).<br />
It is hypothesized that Types 2-4 are<br />
stages in the eventual disappearance <strong>of</strong> a<br />
seagrass meadow due to human-induced<br />
stress, as illustrated by the arrows in<br />
Figure 55. A brief description <strong>of</strong> each<br />
seagrass meadow type fol lows.<br />
Figure 52. Underwater photograph <strong>of</strong> flowering turtle<br />
grass (Thalassia testudinum), <strong>of</strong>f Snake Key in Lower<br />
<strong>Tampa</strong> <strong>Bay</strong>.<br />
et al. 1985a) reported that five <strong>of</strong> the<br />
seven species <strong>of</strong> seagrasses known from<br />
<strong>Florida</strong> are found in <strong>Tampa</strong> <strong>Bay</strong>: Thalassia<br />
testudinum (turtle grass); Svrinsodium<br />
fi 1 i forme (manatee grass) ; Hal odule<br />
wrisht i i (shoal grass) ; RupDia mari tima<br />
(widgeon grass) ; and Hal o ~hi 1 a enselmanni i<br />
(star grass).<br />
Seagrass meadows now cover 5,750 ha<br />
<strong>of</strong> the bottom <strong>of</strong> the bay (Figure 53).<br />
Based upon historical aerial photography<br />
and maps, it is estimated that seagrasses<br />
once covered 30,970 ha <strong>of</strong> the bay (Figure<br />
54). This 81% loss has had severe effects<br />
on the bay's fisheries (Lombard0 and Lewis<br />
1985).<br />
Box cores taken at 18 stations in the<br />
bay over a I-year period (Lewis et al.<br />
1985a) showed that seagrass meadows in<br />
<strong>Tampa</strong> <strong>Bay</strong> are largely monospecific, with<br />
approximately 40% being turtle grass, 35%<br />
shoal grass, 15% manatee grass, and 10%<br />
widgeon grass. Star grass was seen<br />
infrequently. Lewis et a1 . (1985a) defined<br />
five types <strong>of</strong> seagrass meadows in the bay<br />
based on location, form, and species<br />
composition (Figure 55) : (1) mid-bay shoal<br />
perennial - MBS(P); (2) healthy fringe<br />
perennial - HF(P); (3) stressed fricge<br />
perennial - SF(P); (4) 2phemeral - E; and<br />
(5) colonizing perennial - C(P). <strong>The</strong><br />
idealized cross sections in Figure 56 are<br />
Mid-bay shoal perennial (Figure 55<br />
and 57). <strong>The</strong>se meadows are generally<br />
composed <strong>of</strong> Hal odul e, Thal assi a and<br />
Svrinqodium. Ruppia rarely is observed,<br />
which may be attributed to the generally<br />
high current regime and/or higher<br />
salinities not typically found in meadows<br />
closer to shore. <strong>The</strong>se meadows are<br />
located on natural shoals existing in the<br />
middle portion <strong>of</strong> the bay. <strong>The</strong>y are<br />
present year round (perenni a1 ), a1 though<br />
variations in cover by the different<br />
species occur seasonally.<br />
Heal thv fri nqe ~erenni a1 (Figures 55<br />
and 58). <strong>The</strong>se meadows are the most<br />
common meadow type in the bay and extend<br />
from around the mean low water mark into<br />
water depths <strong>of</strong> approximately -2 m MSL.<br />
All five species <strong>of</strong> seagrasses found in<br />
the bay occur in this meadow type.<br />
Zonation begins with Ruppia in the<br />
shallowest water close to shore and grades<br />
with increasing depth through nearly pure<br />
patches <strong>of</strong> Halodule, followed by Thalassia<br />
and then Svrinqodium. Healthy fringe<br />
meadows in <strong>Tampa</strong> <strong>Bay</strong> normally have an<br />
<strong>of</strong>fshore, unvegetated sand bar separating<br />
the main portion <strong>of</strong> the meadow from open<br />
bay waters and creating a "basin" behind<br />
the bar. This basin was described by<br />
Phillips (1960b) as a "central<br />
decl ivity." Similar sand bars have been<br />
observed <strong>of</strong>fshore <strong>of</strong> seagrass meadows in<br />
Charlotte Harbor and are plainly visiblc<br />
in aerial and satellite photography <strong>of</strong><br />
that area. <strong>The</strong> <strong>of</strong>fshore bar may be<br />
critical in intercepting waves and<br />
reducing storm and boat wake damage to<br />
these seagrass meadows. Its complete loss<br />
may make replanting <strong>of</strong> seagrasses and the<br />
restorat ion <strong>of</strong> the fringe meadows very<br />
difficult. A typical cross section<br />
through a heal thy fringe perenni a1<br />
seagrass meadow is diagrammed in Figure<br />
57.<br />
Stressed frinse perennia'l (Figure<br />
55). <strong>The</strong>se meadows are similar to heal thy
= SEAGRASS<br />
= UNCLASSIFIED 1<br />
---
monospecific Rup~i a meadow near the Big<br />
Bend power pl ant in Hi 11 sborough <strong>Bay</strong><br />
during 1976-78. <strong>The</strong>se meadows probably<br />
represent the final stage <strong>of</strong> seagrass<br />
meadow degradation in <strong>Tampa</strong> <strong>Bay</strong> and would<br />
be followed by the complete absence <strong>of</strong><br />
meadows which presently is the case in<br />
most <strong>of</strong> Hi 11 sborough <strong>Bay</strong>.<br />
Colonizins perennial (Figures 55 and<br />
59). This meadow type commonly is found<br />
in a narrow band in the euphotic zone <strong>of</strong><br />
human-made f i 11 s scrch as Courtney Campbell<br />
Causeway (Figure 59), Howard Frank1 and<br />
Bridge Causeway, and the Picnic Island<br />
fill. It is believed to represent a<br />
meadow type dominated by those species<br />
that can produce abundant propagules that<br />
disperse and colonize appropriate shallow<br />
substrates. Only Ruwia shows large-scale<br />
sexual reproduction and seed product on in<br />
<strong>Tampa</strong> <strong>Bay</strong> (Lewis et al. 1985a). Seed<br />
production by the other four species is<br />
rare to nonexistent, and therefore, these<br />
seagrasses colonize by dispersal <strong>of</strong> shoots<br />
or rhizomes produced asexually through<br />
fragmentation. Because <strong>of</strong> the exposed<br />
nature <strong>of</strong> the human-made fills and their<br />
Figure 54. Estimated historical seagrass meadow generally coarser sediments, RuDoi a is not<br />
coverage in <strong>Tampa</strong> <strong>Bay</strong>, c. 1879 (from Lewis et al. as common as in the inshore portions <strong>of</strong><br />
1985a). the fringe meadows. Both Halodule and<br />
Svri nqodi um produce 1 arge amounts <strong>of</strong><br />
detached rhizomes, particularly during<br />
storms, and it is possible that these<br />
fringe perennial meadows except that total float into unvegetated areas, attach<br />
cover is reduced within the basin behind through new root formation, and establish<br />
the <strong>of</strong>fshore bar. Destabilization <strong>of</strong> the new meadows. Thal assi3 produces<br />
<strong>of</strong>fshore sand bar apparently leads to its relatively fewer detached shoots and<br />
inshore migration and eventual rhizomes, and, due to their increased<br />
di sappearance. This type <strong>of</strong> meadow buoyancy, these are less likely to sink<br />
generally occurs in areas closer to into an area appropriate for meadow<br />
Hillsborough <strong>Bay</strong> where a tenfold increase establishment. Even if sinking and<br />
in average chlorophyll 2 values (compared attachment occur, slower root and rhizome<br />
to <strong>Tampa</strong> <strong>Bay</strong>) is typical .<br />
growth rates would make establishment <strong>of</strong> a<br />
new meadow by asexual means less likely.<br />
E~hemeral (Figure 55). <strong>The</strong>semeadows This may explain why Halodule and<br />
are composed almost entirely <strong>of</strong> Rup~ia Syrinqodium are the dominant species in<br />
with occasional sprigs <strong>of</strong> Halodule. <strong>The</strong>y this meadow type.<br />
are not present year round and their<br />
locations <strong>of</strong>ten vary from year to year. As noted by Lewis et a1. (1985a), most<br />
Phil1 ips (1962) noted the unusual <strong>of</strong> the work to date on seagrass meadows in<br />
appearance <strong>of</strong> Rupwi a patches in <strong>Tampa</strong> <strong>Bay</strong> has concentrated on descriptive<br />
Hi1 lsborough <strong>Bay</strong> along <strong>Bay</strong>shore Boulevard biology (distribution, reproduction,<br />
and at the mouth <strong>of</strong> Delaney Creek in the infaunal communities). <strong>The</strong> elucidation <strong>of</strong><br />
winter <strong>of</strong> 1961. No other seagrass was the functional role <strong>of</strong> seagrass meadows in<br />
seen in these areas. Mangrove Systems, the bay in terms <strong>of</strong> value as a food source<br />
Inc. (1978) also noted the cyclic (direct herbivory, detrital, drift and<br />
appearance and disappearance <strong>of</strong> a epiphytic algal component) and habitat is<br />
61
H. HALODULE Re RUPPIA S . SYRINQODIUM T . THALASSIA<br />
Figure 55. Seagrass meadow types in <strong>Tampa</strong> <strong>Bay</strong> as described in Lewis et at. 1985a.
1 M H L W -<br />
-4 1<br />
MHHW. MEAN HIGHER HIGH WATER<br />
MLHW MEAN LOWER HIGH WATER<br />
MHLW MEAN HIGHER LOW WATER<br />
MLLW MEAN LOWER LOW WATER<br />
A. ALGAE<br />
f H. HALODULE<br />
R . R I Z<br />
& S. SYRINGODIUM<br />
,# T, THALASSW<br />
0. UNVEGETATED<br />
-10;- 1. -3<br />
Figure 56. Typical seagrass meadow zonation in <strong>Tampa</strong> <strong>Bay</strong> (from Lewis et at. 198%).<br />
Figure 57. Aerial photograph <strong>of</strong> a perennial healthy<br />
fringe seagrass meadow <strong>of</strong>fshore <strong>of</strong> Bishops Harbor,<br />
Lower <strong>Tampa</strong> <strong>Bay</strong>.<br />
Figure 58. Aerial photograph <strong>of</strong> a perennial mid-bay<br />
shoal seagrass meadow, Lower <strong>Tampa</strong> <strong>Bay</strong>.<br />
being initiated only now, primarily in<br />
relation to larval fish use. Even<br />
estimates <strong>of</strong> total primary production by<br />
seagrasses are hampered by the lack <strong>of</strong><br />
comprehensive baywide seasonal data.<br />
Using oxygen production measurements,<br />
Pomeroy (1960) calculated that turtle<br />
grass and manatee grass production in<br />
lower <strong>Tampa</strong> <strong>Bay</strong> was 500 g ~/rn~/~r. This<br />
technique is no longer considered to be<br />
accurate because recycling <strong>of</strong> oxygen in<br />
the lacuna1 spaces <strong>of</strong> seagrasses<br />
introduces error (Hartman and Brown 1966).<br />
For purposes <strong>of</strong> calculating baywide<br />
sea rass production, a mean value <strong>of</strong> 2 g<br />
C/m 9 /day (730 g ~ /m~/~r) may be used based<br />
upon Zieman's (1982) commonly used<br />
rass production range <strong>of</strong> 1-4 g<br />
Heffernan and Gibson (1985), using<br />
the technique and a special chamber<br />
(Heffernan and Gibson 1983) reported
noted that eight sciaenid species have<br />
been associated with seagrass meadows in<br />
southwestern <strong>Florida</strong> and that the spotted<br />
seatrout (Cynosci on nebul osus) , the spot<br />
(Leiostomus xanthurus), and the silver<br />
perch (Ba i rdi el la chrysoura) are commonly<br />
found in seagrass beds as juveniles. <strong>The</strong><br />
sheepshead (Archosarqus probatocephal us)<br />
and the snook (Centropomus undecimal is)<br />
a1 so use seagrass meadows as habitat<br />
during their 1 ife cycles (Odum and Heald<br />
1970; Gilmore et a1 . 1983).<br />
Figure 59. Aerial photograph <strong>of</strong> a perennial colonizing<br />
seagrass meadow, south side <strong>of</strong> Courtney Campbell<br />
Causeway, Old <strong>Tampa</strong> <strong>Bay</strong>.<br />
productivity rates for two sampl i ng<br />
periods (October and February 1982).<br />
Gravimetric rates (g C/g dry wt/hr) ranged<br />
from 72.6 to 95.0 in October and from 3.0<br />
to 9.6 in February. Areal rates (g<br />
c/m2/hr) ranged fr~m a high <strong>of</strong> 5.2 in<br />
October to as low as 0.004 in February.<br />
Significantly, they noted that <strong>Tampa</strong> <strong>Bay</strong><br />
seagrasses had more epiphytic biomass than<br />
seagrass in the Bahamas or the Indian<br />
River Lagoon. For example, in February an<br />
average <strong>of</strong> 76% <strong>of</strong> the weight <strong>of</strong> a seagrass<br />
blade in <strong>Tampa</strong> <strong>Bay</strong> was composed <strong>of</strong><br />
epiphytes, while only 29% and 26% <strong>of</strong> leaf<br />
weights in the Indian River Lagoon and the<br />
Bahamas, respectively, were composed <strong>of</strong><br />
epiphytes. <strong>The</strong>se prel iminary data may<br />
indicate significant stress on seagrasses<br />
in <strong>Tampa</strong> <strong>Bay</strong> due to eutrophication and<br />
competition for 1 ight similar to that<br />
previously reported for the Indian River<br />
(Rice et al. 1983), Rhode Island (Harlin<br />
and Thorne-Mi 11 er 1981) and Austral i a<br />
(Cambridge 1975, 1979).<br />
It is likely that seagrass meadows in<br />
<strong>Tampa</strong> <strong>Bay</strong> are important habitat for<br />
benthic invertebrates and certain species<br />
<strong>of</strong> juvenile fish. Virnstein et al. (1983)<br />
noted in their studies in the Indian River<br />
that seagrass meadows had a density <strong>of</strong><br />
infaunal invertebrates three times that <strong>of</strong><br />
unvegetated sediments, and that epifaunal<br />
organisms were 13 times as abundant in<br />
seagrass as in sandy areas. Zieman (1982)<br />
Similar data for seagrass meadows in<br />
<strong>Tampa</strong> <strong>Bay</strong> are sparse, but the existing<br />
data support the importance <strong>of</strong> seagrass<br />
meadows as habitat for fish and<br />
invertebrates. Studies <strong>of</strong> fish<br />
populations in <strong>Tampa</strong> indicate that<br />
seagrass meadows are one <strong>of</strong> several<br />
important nursery habitats for juvenile<br />
fish species (Springer and Woodburn 1960;<br />
Comp 1985). Collections by Springer and<br />
Woodburn (1960) at two areas containing<br />
mixed seagrass and algae had the highest<br />
number <strong>of</strong> species (108 and 93,<br />
respectively, <strong>of</strong> a total <strong>of</strong> 253 species).<br />
<strong>The</strong> lowest species numbers (48) were<br />
reported for a sandy beach (unvegetated)<br />
station.<br />
Taylor and Saloman (1968) (in<br />
documenting the filling <strong>of</strong> 1,400 ha <strong>of</strong> bay<br />
bottom in Boca Ciega <strong>Bay</strong> and the loss <strong>of</strong><br />
1,133 t <strong>of</strong> annual standing crop <strong>of</strong><br />
seagrasses) estimated infaunal biomass for<br />
well-vegetated bay bottoms to be 137 4 dry<br />
wt/m2 in comparison to 12 g dry wt/m for<br />
unvegetated bay bottoms. Godcharl es<br />
(1971) reported the results <strong>of</strong> testing a<br />
commercial hydraulic s<strong>of</strong>t-she1 1 clam<br />
dredge at six experimental sites in Middle<br />
and Lower <strong>Tampa</strong> <strong>Bay</strong>, Boca Ciega <strong>Bay</strong>, and<br />
just <strong>of</strong>fshore <strong>of</strong> Mullet and Egmont Keys.<br />
He listed 142 species <strong>of</strong> macroinvertebrates<br />
and 47 species <strong>of</strong> fish<br />
collected from these sites using the<br />
dredge, a trynet, and a benthic plug<br />
sampler. Figure 60 summarizes the numbers<br />
<strong>of</strong> species in each group and the<br />
percentage <strong>of</strong> the total number <strong>of</strong> species<br />
found at each site. Three <strong>of</strong> the sites<br />
were heavily vegetated with seagrass, a<br />
fourth had a mixture <strong>of</strong> algae {Cauler~a)<br />
and seagrass, and two were unvegetated,<br />
It is apparent from Figure 60 that four to<br />
five times more invertebrate species and<br />
ten times as many fish species were found
% TOTAL NUhlBER OF SPECIES<br />
I<br />
HEAVY SEAGRASS<br />
Thaiassia dominant<br />
61%<br />
EAVY SEAGRASS<br />
[Thalassia dominant<br />
71%<br />
33 70%<br />
EAVY SEAGRASS<br />
I Svrinqodium dominant I<br />
47%<br />
EAVY ALGAE<br />
HIN SEAGRASS<br />
Caulerpa dominant<br />
53%<br />
BARE SAND<br />
BARE SAND<br />
14% INVERTEBRATES<br />
FISH<br />
Figure 60. Comparison <strong>of</strong> the numbers <strong>of</strong> species (crude diversity) <strong>of</strong> fish and invertebrates<br />
collected from dense seagrass, sparse seagrass, and bare sand stations in Lower <strong>Tampa</strong><br />
<strong>Bay</strong> (original data from Godcharles and Jaap 19731.<br />
at the sites dominated by turtle grass as Godcharl es (1971) and Gadchar1 es and<br />
were collected in the unvegetated areas. Jaap (1973) also noted that the areas <strong>of</strong><br />
Even the manatee grass-dominated site and seagrass that were dredged did not recover<br />
the mixed algae and seagrass site commonly during the study. One <strong>of</strong> the sites had<br />
had three times as many invertebrate shown no natural seagrass recolonization<br />
species and nine times as many fish 36 months after the original seagrass<br />
species as the unvegetated sites. cover was removed by the clam dredge.
This observation confirms that <strong>of</strong> Phillips<br />
(1960a), Zieman (1976), and Phillips and<br />
Lewis (1983) that natural recolonization<br />
<strong>of</strong> excavated areas in existing seagrass<br />
meadows is slow. It is not unusual for<br />
3-5 years to elapse before recovery is<br />
visible in a turtle grass meadow; complete<br />
recovery might take 10 years or more,<br />
depending on the size <strong>of</strong> the denuded site.<br />
This assumes the area is undisturbed<br />
during the recovery period. Repeated<br />
scarring by boat propel 1 ers, for example,<br />
can delay recovery or lead to the loss <strong>of</strong><br />
an even larger area <strong>of</strong> seagrasss.<br />
3.6 TIDAL MARSHES<br />
About 7,200 ha <strong>of</strong> emergent wetlands<br />
border <strong>Tampa</strong> <strong>Bay</strong> (Lewis and Whitman 1985).<br />
<strong>The</strong>y are located at 14 major sites as<br />
mapped by Estevez and Mosura (1985)<br />
(Figure 61). <strong>The</strong>se sites are: (1) Upper<br />
Boca Ciega; (2) Lower Boca Ciega; (3)<br />
Weedon Island Complex; (4) Gateway; (5)<br />
Upper Old <strong>Tampa</strong> <strong>Bay</strong>; (6) Interbay; (7)<br />
McKay <strong>Bay</strong>; (8) Archie Creek; (9) Alafia to<br />
Kitchen Complex; (10) Wolf Creek; (11)<br />
Little Manatee and Cockroach <strong>Bay</strong>; (12)<br />
Bishop Harbor; (13) Terra Ceia; and (14)<br />
Perico units. <strong>The</strong> vegetation <strong>of</strong> these<br />
emergent wet1 ands consists <strong>of</strong> various<br />
mixtures <strong>of</strong> five major p1 ant species<br />
(Figure 62), two <strong>of</strong> which are tidal marsh<br />
species: bl ack needlerush (Juncus<br />
roemerianus and smooth cordgrass<br />
(Sparti na a terni fl ora) . Mi nor species in<br />
these tidal marshes include leather fern<br />
(Acrostichum danae<strong>of</strong>ol ium) and the<br />
bracki sh water cattail fTyoha<br />
dominclensis). A typical <strong>Tampa</strong> <strong>Bay</strong> tidal<br />
marsh is shown in Figure 63.<br />
Estimates <strong>of</strong> the percentage <strong>of</strong> the<br />
total emergent wetlands which are tidal<br />
marsh vary from 10% to 18% (Estevez and<br />
Mosura 1985; Ed Pendleton, U.S. Fish and<br />
Wildlife Service, Slidell, Louisiana; pers.<br />
comm. ) . Mangroves are the dominant<br />
vegetation, but periodic freezes allow<br />
substantial areas <strong>of</strong> tidal marsh to<br />
persi st as cold-sensi tive mangroves are<br />
pruned or kill ed (Estevez and Mosura<br />
1985).<br />
Estevez and Mosura (1985) noted that<br />
"regrettably little is known <strong>of</strong> the<br />
organization or functioning <strong>of</strong> tidal<br />
marshes in <strong>Tampa</strong> <strong>Bay</strong>. " Decomposed marsh<br />
plant fragments, known as detritus, have<br />
been shown to be important in some<br />
estuarine food webs, a1 though considerable<br />
controversy exists as to the magnitude <strong>of</strong><br />
that role (Haines 1976; Nixon 1980; Stout<br />
1984; Durako et al. 1985). <strong>The</strong><br />
controversy arises from the ambiguous<br />
results from isotope studies designed to<br />
pinpoint the source <strong>of</strong> carbon in the diet<br />
<strong>of</strong> specific marsh animals, A diet that<br />
includes a mixture <strong>of</strong> benthic micr<strong>of</strong>l ora<br />
and vascular pl ant detritus, for example,<br />
could give a value halfway in between<br />
those expected if only a single carbon<br />
source was utilized.<br />
Figure 61. <strong>The</strong> generalized distribution <strong>of</strong> mangrave<br />
forests and tidal marshes in <strong>Tampa</strong> <strong>Bay</strong>. Names <strong>of</strong><br />
numbered areas are listed in text (from Estevez and<br />
Mosura 1985).<br />
<strong>The</strong> role <strong>of</strong> marsh surfaces and creeks<br />
as habitat for juvenile and adult fishes,<br />
invertebrates, and birds is 'less<br />
controversial, though not well studied<br />
(Durako et al. 1985). Subrahmanyam et al.<br />
(1976) reported 55 species <strong>of</strong>
Figure 62. Typical form <strong>of</strong> the five dominant plant species found in intertidal wetlands <strong>of</strong><br />
<strong>Tampa</strong> <strong>Bay</strong>. A: Juncus roemerianos, black needlerush; B: Spartina alterniflora, smooth cordgrass;<br />
C: Laguncularia racemosa, white mangrove; D: Rhizophora mangle, red mangrove;<br />
E: Avicennia germinans, black mangrove (from Estevez and Mosura 1985).
since emergent wet1 ands restoration and<br />
creation efforts in the bay are<br />
concentrating on the use <strong>of</strong> smooth<br />
cordgrass (H<strong>of</strong>fman et a1 . 1985).<br />
<strong>The</strong> reasons for this, discussed by<br />
Lewis (1982a, 1982b), include the fact<br />
that smooth cordgrass, although not a<br />
dominant plant in the bay, has been<br />
observed to be a pioneer species on spoil<br />
islands in the bay. Smooth cordgrass, in<br />
turn, facil itates the invasion <strong>of</strong> mangrove<br />
seeds by stabil izing the substrate and<br />
reducing wave energy and is eventually<br />
replaced by these mangroves (Lewis and<br />
Dunstan 1975a).<br />
Because the frequency <strong>of</strong> cold weather<br />
can cause dieback or kill mangroves on<br />
<strong>Tampa</strong> <strong>Bay</strong> (Estevez and Mosura 1985),<br />
direct planting <strong>of</strong> mangroves only is not<br />
encouraged (Lewis 1982b, H<strong>of</strong>fman et al.<br />
1985). <strong>The</strong> functional roles <strong>of</strong> both<br />
natural and created marshes as sources <strong>of</strong><br />
energy and as fish and wildlife habitat is<br />
thus a high priority research item.<br />
Figure 63. Typical tidal marsh along the shores <strong>of</strong><br />
<strong>Tampa</strong> <strong>Bay</strong> with dominant cover <strong>of</strong> black needlerush<br />
(Juncus roemerianus) and a lower elevation fringe <strong>of</strong><br />
smoath cardgrass (Spartina alternifloral.<br />
invertebrates from north <strong>Florida</strong> tidal<br />
marshes. Fish and shell fish species<br />
important to <strong>Florida</strong>'s commercial and<br />
recreational fisheries, including shrimp,<br />
menhaden, bl ue crabs, and mu1 1 et, commonly<br />
inhabit tidal marsh creeks (Durako et a1 .<br />
1985). Fifty-three species <strong>of</strong> fish,<br />
dominated by the ki 11 if i shes (Fundul us<br />
1 i s F. grandis, and Cyerinodon<br />
varieqatus), are present in these marshes<br />
(Subrahmanyam and Drake 1975).<br />
Kruczynski et al. (1978) reported<br />
primary production va ues ranging from 390<br />
to 1,140 g dry wt/m 1 /yr for needlerush,<br />
and 130-700 g dry ~t/m~/~r for smooth<br />
cordgrass in north <strong>Florida</strong>. <strong>The</strong> overall<br />
mean value would be around 600 g dry<br />
~t/m~/~r. No similar productivity data or<br />
the previously mentioned habitat data are<br />
available for <strong>Tampa</strong> <strong>Bay</strong> marshes. This<br />
information is particularly important<br />
3.7 MANGROVE FORESTS<br />
In contrast to tidal marshes,<br />
mangrove forests on the bay have received<br />
some study (Estevez and Mosura 1985),<br />
although it is primarily descriptive in<br />
nature.<br />
<strong>The</strong> forests are composed <strong>of</strong> three<br />
species, red mangrove (Rhizoehora manqle);<br />
bl ack mangrove (Avicenni a serminans) ; and<br />
white mangrove (Laquncul ari a racemosa)<br />
(Figure 62) . Unl i ke mangrove forests<br />
further south (Odum and Heald 1972),<br />
mangrove forests on <strong>Tampa</strong> <strong>Bay</strong> are composed<br />
<strong>of</strong> a mixture <strong>of</strong> all three species, and<br />
while exhibiting natural zonation similar<br />
to that described by Davis (1940), have<br />
some unique features (Estevez and Mosura<br />
1985, Lewis et a1 . 1985b).<br />
Lugo and Snedaker (1974) have<br />
classified mangrove assemblages into six<br />
forest "types" based on the influence <strong>of</strong><br />
environmental factors, appearance <strong>of</strong> the<br />
vegetation, and community energetics. Not<br />
all mangrove stands in <strong>Tampa</strong> <strong>Bay</strong> are<br />
easily categorized by this system, but in<br />
general most forests resemble the "fringe"<br />
forest type <strong>of</strong> Lugo and Snedaker (1974)<br />
wherein the plant assemblages:
(1) grow on mainland shorelines <strong>of</strong><br />
gradual slope;<br />
(2) are exposed to tides but are not<br />
daily overwashed;<br />
(3) have sluggish internal water flow on<br />
high tides, and minor to no scouring;<br />
and<br />
(4) export particulate as well as labile<br />
organic matter.<br />
<strong>The</strong> "overwash" mangrove forest type is<br />
well developed along the north shore <strong>of</strong><br />
upper Old <strong>Tampa</strong> <strong>Bay</strong> and the east shore <strong>of</strong><br />
Lower <strong>Tampa</strong> <strong>Bay</strong>, especially in Cockroach<br />
<strong>Bay</strong>. <strong>The</strong> sa1 inity and velocity <strong>of</strong> water in<br />
overwash forests are higher than in fringe<br />
forests, and i sl ands are completely<br />
inundated by daily tides. Overwas h<br />
islands are <strong>of</strong>ten uniform stands <strong>of</strong> red<br />
mangrove, a1 though some bl ack mangroves<br />
may be present.<br />
Mangroves grow on banks along the<br />
mouths <strong>of</strong> rivers, but we regard these as<br />
extensions <strong>of</strong> the fringe form rather than<br />
the "riverine" forest type and are termed<br />
"tributary" forests (Table 11). Where<br />
upriver, but tidal, habitat is avai 1 able<br />
for the development <strong>of</strong> the riverine forest<br />
one instead finds Juncus marshes.<br />
One new forest type may be<br />
appropriate for mangrove assemblages in<br />
<strong>Tampa</strong> <strong>Bay</strong>, the "shrub" form created by<br />
repetitive freezes, water stress, and<br />
other factors (Estevez and Mosura 1985).<br />
Provost (1967) described this type as<br />
"scrub-marsh" and noted its occurrence<br />
around <strong>Tampa</strong>.<br />
<strong>The</strong> shrub forest grows primarily on<br />
mainland shorelines, like fringing<br />
forests. It is composed <strong>of</strong> a mixture <strong>of</strong><br />
red and black mangrove, the reds being<br />
shorter and denser in aspect. <strong>The</strong> forests<br />
are low, <strong>of</strong>ten averaging 2-3 m. Lugo and<br />
Zucca (1977) re1 ated temperature stress to<br />
decreased leaf size and number, and<br />
increased tree density. <strong>The</strong>se features<br />
are typical <strong>of</strong> shrub forests in the bay.<br />
Limbs <strong>of</strong> red and black mangroves killed by<br />
previous frosts are frequently evident<br />
above the live canopy. <strong>The</strong> shrub forest<br />
may support epiphytes or fungal galls, or<br />
both. Examples <strong>of</strong> shrub forests are on<br />
the eastern shore <strong>of</strong> <strong>Tampa</strong> <strong>Bay</strong> north <strong>of</strong><br />
Wolf Creek, including the stands in McKay<br />
<strong>Bay</strong>, and the Bower tract in Upper Old<br />
<strong>Tampa</strong> <strong>Bay</strong>.<br />
Table 11. Mangrove tree size by species and forest type in <strong>Tampa</strong><br />
<strong>Bay</strong> (Williamson and Mosura 1979).<br />
--<br />
Cumul ative mean D. B.H.<br />
(cm)<br />
Forest type Rhizophora Avicennia Laguncul ari a<br />
Fringe 2.69 + 2.26 4.59 + 3.16 2.31 + 2.64<br />
(139) (186) (203 1<br />
Overwash 3.37k2.04 5.2751.37<br />
(90) (7 1<br />
Tributary 2.91 + 2.01 1.85 + 0.99 2.57 + 0.38<br />
(50) (17) (10)<br />
aDiameter at breast height.<br />
b~urnbers in parentheses are sample sizes.<br />
69
<strong>The</strong> typical zonation pattern and<br />
species makeup along a transect through an<br />
undisturbed mangrove forest located on the<br />
east side <strong>of</strong> Middle <strong>Tampa</strong> <strong>Bay</strong> (Wolf<br />
Branch) are shown in Figure 64 and Table<br />
12. Table 11 gives data for cumulative<br />
size expressed as diameter at breast<br />
height for three mangrove forest types on<br />
the bay. <strong>The</strong> data for the fringe type are<br />
applicable to the Wolf Branch transect.<br />
<strong>The</strong>se data indicate that the forests occur<br />
over a range <strong>of</strong> elevations from 0.06 to<br />
0.76 m above mean sea level (MSL), and the<br />
lower elevation zones are occupied by red<br />
mangroves (Figure 651, which are gradually<br />
replaced by black and white mangroves as<br />
the elevation increases. <strong>The</strong>re is not a<br />
distinct zonation between the black and<br />
white mangroves; they intergrade over much<br />
<strong>of</strong> the area <strong>of</strong> the forest, although the<br />
black mangroves extend to a somewhat lower<br />
elevation. At the higher elevations<br />
normally reached by tides only once or<br />
twice a month, only stunted and scattered<br />
black mangroves are found; soil sal ini ties<br />
can be over 100 ppt due to the evaporation<br />
<strong>of</strong> seawater and residual salt<br />
accumulation. In this area <strong>of</strong> the forest<br />
a salt barren, or salina, is found with<br />
areas <strong>of</strong> very salt-tolerant, low-growing<br />
vegetation interspersed with barren<br />
patches devoid <strong>of</strong> all vegetation (Figure<br />
66). <strong>The</strong>se pl ant assembl ages are<br />
dominated by sea purslane (Sesuvi um<br />
portul acastrum) , gl asswort (Sal icornia<br />
virainica), saltwort (Batis maritima), sea<br />
oxeye daisy (Borrichia frutescens), sea<br />
1 avender (Limoni um carol i ni anum), and<br />
various sal t-to1 erant grasses.<br />
<strong>The</strong> latitude <strong>of</strong> <strong>Tampa</strong> <strong>Bay</strong> is near the<br />
northern limit <strong>of</strong> mangroves and<br />
low-temperature stress is common in the<br />
mangrove forests . Repetitive freezes can<br />
intensify temperature effects on the<br />
structure <strong>of</strong> the forest. Initially the<br />
canopy is parti a1 ly destroyed. If another<br />
freeze quickly follows, the damaged trees<br />
ELEVATION<br />
0 100<br />
fl=<br />
a.<br />
W. 50<br />
0<br />
LAGUNGULARlA<br />
I"" T'''l'll'<br />
I/lIIl If"" ""1""<br />
OF5 1b 16 2 r 2 S 3 r 3 S 4'0 46 5b 55 0b 86 T)<br />
" ' 1 , ' " ' ' " ' [ ' I '<br />
CONTROL AREA TRANSECT<br />
Figure 64. Distribution <strong>of</strong> mangroves on an undisturbed (contioil shoreline near Wolf Creek<br />
(20-m sampling intervals). Elevations are st~own in feet (from Detwiler et al. 1975).
Table 12. Elevation ranges and mean elevations <strong>of</strong> 10 plant species<br />
found in the control area <strong>of</strong> an undisturbed mangrove community near<br />
Wolf Greek (Detweiler et ai. 1975). Elevation in ft above mean sea level.<br />
No. <strong>of</strong><br />
Mean<br />
Species quadrats Range el evat i on<br />
Rhi zophora mans1 e<br />
Avicenni a serminans<br />
Laquncul ari a racemosa<br />
Spartina a1 terni fl ora<br />
Sal icornia vir~inica<br />
Sesuvi um ~ortul acastrum<br />
Limonium carolinianum<br />
Batis maritima<br />
Borrichi a frutescens<br />
Phi 1 oxerus vermi cul ari s<br />
Figure 65. Typical view <strong>of</strong> fringing red mangroves.<br />
Lower <strong>Tampa</strong> <strong>Bay</strong>.<br />
Figure 66. Aerial photograph <strong>of</strong> view across a mangrove<br />
forest bordering Middle <strong>Tampa</strong> <strong>Bay</strong>. <strong>The</strong> pale<br />
areas at the bottom are salt barrens.
are killed. In recent years two fr~lo~es larg~st diameter tree in the forest (Table<br />
have occurred re1 atively clos~ toqcther 131, particularly iq the frlnge and<br />
(1977 and 1983). During January 1977, a overwash forests which are the dominant<br />
minimum temperature <strong>of</strong> -5°C was reachod types in the bay.<br />
and snow fell for the first time in over<br />
100 years. <strong>The</strong> Christmas frwze <strong>of</strong> 19513 This sise difference is believed to<br />
involved 2 days during which the exist because these trees are older,<br />
temperature In Tanipa fell to -5.7"C having survived some freezes that killed<br />
follaw~d by a -7.2% reading the npxt day. red and white mangroves. <strong>The</strong> 1983 freeze<br />
Such low tcnrperatcrres had not occilrretl in was significant in that even sove <strong>of</strong> the<br />
<strong>Tampa</strong> since the h~starical freeze <strong>of</strong> 1 arge black mangroves which sur-vi ved<br />
1894-95 which dealt a s~rious blow to the earlier freezes were killed or frozen back<br />
then flourishinq citrus industry in to the ground. It is likely that the<br />
<strong>Florida</strong> {Sanders 1980). <strong>The</strong>se fre~rrs structure <strong>of</strong> forests on t,he bay has been<br />
eaushld siqni ficant lossc~ ctf mangro~es and<br />
the total area <strong>of</strong> tidal marsh on the bay<br />
may increase as more low temperatt~rc<br />
tolerant marsh plants invade areas left<br />
barren by the tfcatti <strong>of</strong> the rtlaiiqrovc$<br />
(Figuve 67). Ilc~ring a lcss severe frost<br />
or free^ selec tive survival <strong>of</strong> mangroves<br />
has been observed, with the black mnnqtove<br />
having the greatest roc;ist anco to frwacz<br />
darnage dnd the whi tc manqr ovc3 t trt. loac t ,<br />
<strong>The</strong> black manyrove i s typically the<br />
significantly a1 tered by these freezes,<br />
particularly thase in the northern third<br />
<strong>of</strong> the bay, where air temperatures can be<br />
as much as 4% lower than in the southern<br />
portion <strong>of</strong> the bay (Estevez and Mosura<br />
1985). It is not surprising, then, to see<br />
a north-to south gradient in the bay with<br />
the better developed mangrove forests in<br />
the southern half and the more<br />
freeze clamaged forests mixed with tidal<br />
nrarsh species in the northern half.<br />
Primary ~roduct ion rates as measured<br />
by 1 itter fall arc reported by Estever and<br />
fifortrra f 1985) to have a mean value <strong>of</strong> 3.1<br />
(1 ~/m~/day (11.3 t C/ha/'yr) for three<br />
sites in iampa <strong>Bay</strong>. 'fhese values are<br />
cc~nservativc, since they do not inct udr.<br />
hinmass added to the structure <strong>of</strong> the<br />
forest as Fhc trees grow or metabolic<br />
pn(>rqy losses .<br />
As with tidal marsh research in tho<br />
bay, funct,ional studies <strong>of</strong> the role <strong>of</strong><br />
mangroves as sources <strong>of</strong> carbon or as<br />
habitat are rare. Ihe only functional<br />
value that has received some study is t.he<br />
role <strong>of</strong> mangroves as nesting sites for<br />
colonial sea birds and wading birds flewis<br />
and Dunstan 1975b; Schreiber and Schreiher<br />
1918; Lewis and Lewis 1978; Paul and<br />
Woolfonden 1985). Wool fenden and<br />
Schrciber (1973) stated that mangrove<br />
forhest r;:<br />
. . . are absolutely essential to the<br />
existence <strong>of</strong> a large number <strong>of</strong> water<br />
birds that breed in <strong>Florida</strong>, for<br />
essentially a71 <strong>of</strong> the breeding<br />
to1 c~ities <strong>of</strong> uei icans, cormorants,<br />
herons, and ibises <strong>of</strong> saline environs<br />
Figure 67. Deed mengraves at fish Creek In Old are in mangrove. Not only does<br />
<strong>Tampa</strong> <strong>Bay</strong>. Low tarnperarures irl 1383 killed this forest vangrove supply breeding sites, but<br />
af predominantly btsck and white mengroves<br />
also the nutrients necessary early in<br />
72
Table 13. Estimated annual production <strong>of</strong> primary producers based on areal coverage in the<br />
<strong>Tampa</strong> <strong>Bay</strong> system (modified from Johansson et al. 1985).<br />
Total<br />
Percent<br />
Produc ion Are$ Production <strong>of</strong><br />
Primary producer (g C/m 8 /yr) (km ) (g C/yr x lo6) Total<br />
Seagrass and<br />
epiphytes 730 57.5 42.0 8.5<br />
Macroal gae 70 100.0 7.0 1.4<br />
Benthic<br />
microalgae<br />
Mangrove forests 1, 132a 64.5b 73.0 14.7<br />
Tidal marshes 300 10.5~ 3.2 0.6<br />
Phytopl anktonC 340 864.0 293.8 59.1<br />
Phytopl anktond 5 0 96.0 48.0 9.7<br />
Riverine forests N D ~ ND N D ND<br />
aEstevez and Mosura 1985.<br />
b~ssuming 14% <strong>of</strong> the bays emergent wet1 ands are tidal marsh.<br />
CFor bay areas deeper than 2 m.<br />
d~or bay areas shallower than 2 m.<br />
eNo data available.<br />
the food webs that lead to the items<br />
taken as prey by birds.<br />
A1 though the necessary habitat<br />
uti 1 ization studies have not been<br />
conducted for <strong>Tampa</strong> <strong>Bay</strong>, the value <strong>of</strong><br />
mangroves to <strong>Florida</strong>'s fisheries is well<br />
documented (Lewis et a1 . 1985b). Mangroves<br />
are known to serve as one <strong>of</strong><br />
several critical habitats in the life<br />
history <strong>of</strong> many fish and she1 Jfish<br />
species important in commercial and<br />
recreational fisheries, includins the<br />
pink shrimp (Penaeus duorarum) , tedf ish<br />
or red drum (Sciaenops ocellatus), tarpon<br />
(Mega1 ops at1 anticus r a n d snook<br />
(Centroponius undecimal is) (Odum et a1 .<br />
1982; Lewis et al. 1985b).<br />
While the frequently flooded lower<br />
portions <strong>of</strong> mangrove forests and tidal<br />
marshes are documented to be valuable<br />
habitat, the roles <strong>of</strong> the higher marsh and<br />
mangrove forest and tidal salt flats<br />
behind the lower elevation habitats are<br />
less well understood. Heald et a1 . (1974)<br />
noted that:<br />
. . . during the dry season, when the<br />
high marsh areas are drying rapidly,<br />
the deeper, more permanent, ponds<br />
within the impoundment provide<br />
temporary refuge for retreating<br />
fishes. At this point wading bird<br />
populations are able to efficiently<br />
exploit them.<br />
Richard T. Paul (<strong>National</strong> Audubon<br />
Society, <strong>Tampa</strong>; pers. comm.) observed the<br />
salt flat habitat on <strong>Tampa</strong> <strong>Bay</strong> being<br />
extensively uti l ized as foraging and<br />
breedlng nabitat by a variety <strong>of</strong> forage<br />
fish species incl tiding Cv~rinodon,<br />
Fundulus, and Poecilia. In turn, these<br />
fish became important food sources for a<br />
variety <strong>of</strong> herons and egrets during times<br />
<strong>of</strong> high tides when the fiats were flooded.<br />
Paul stated that the reddish egret
(Eqretta rufescens), the rarest egret in<br />
<strong>Florida</strong>, is uniquely suited to feed in<br />
this habitat because <strong>of</strong> its active feeding<br />
behavior. Further documentat ion <strong>of</strong> this<br />
habitat va1 ue is important.<br />
3.8 RlVERlNE FORESTS AND ADJACENT<br />
WETLANDS<br />
All major rivers and streams entering<br />
the bay have floodplain forests and<br />
adjacent wetl ands that drain eventually<br />
into the bay. <strong>The</strong>se freshwater wetlands<br />
serve as the first <strong>of</strong> a series <strong>of</strong> filters<br />
to cleanse up1 and drainage before it<br />
enters the bay and also act as<br />
contributors <strong>of</strong> dissolved and particulate<br />
organic matter and nutrients.<br />
Typical <strong>of</strong> these wetlands are those<br />
bordering the Alafia River. Clewell et<br />
al. (1983) described these wetlands as<br />
supporting 409 pl ant species including 84<br />
tree species dominated by red maple (&r<br />
rubrum) and swamp tupelo (Nvssa bi fl ora) .<br />
Sipe and Swaney (1974) noted that the<br />
acreage <strong>of</strong> freshwater wetl ands <strong>of</strong><br />
Hi1 1 sborough County has decl ined<br />
significantly since historical times.<br />
Losses would be expected to reduce the<br />
ability <strong>of</strong> these systems to filter upland<br />
run<strong>of</strong>f, allowing more turbid water to<br />
reach the bay.. Particulate organic matter<br />
inputs to the bay from litter fall in<br />
adjacent wetl and and terrestrial habitats<br />
would also be expected to decline, and<br />
nutrient inputs would probably increase as<br />
fi 1 tration capacity decl ined. In<br />
addition, many streams have been<br />
channelized, and even if the wetlands are<br />
intact hydraul ic exchange with the<br />
adjacent water body may be impaired.<br />
Total streamflow input to <strong>Tampa</strong> <strong>Bay</strong><br />
is estimated to average 2 x 10¹² l/yr<br />
(Hutchinson 1983). If it can be assumed<br />
that total organic carbon concentration<br />
(TOC) averages 10 mg C/1 (Dooris and<br />
Dooris 1985), then TOf input via<br />
streamflow would be 2 x 10 kg C/yr. TOC<br />
measurements <strong>of</strong> this sort are typically<br />
made on unfif tered water samples, but do<br />
not take into account bedload transport <strong>of</strong><br />
organic materi a1 derived from adjacent<br />
wetlands and uplands or pulse events when<br />
large amounts <strong>of</strong> organic matter may be<br />
moved in a relatively short period <strong>of</strong><br />
time. For this reason, the above input<br />
value should be considered conservative.<br />
3.9 TOTAL PRIMARY PRODUCTION AND<br />
ORGANIC MATERIAL INPUT<br />
Total net primary production (carbon<br />
reduced by photosynthesis) by natural<br />
plant communities in <strong>Tampa</strong> <strong>Bay</strong> (1 isted by<br />
category &n Table 13) is estimated at<br />
478.2 x 10 kg/yr. <strong>The</strong>se figures indicate<br />
that <strong>Tampa</strong> <strong>Bay</strong> can be characterized as a<br />
phytopl ankton-based system when compared<br />
to other sources <strong>of</strong> net primary<br />
production. By virtue <strong>of</strong> their high<br />
annual production, mangroves are the<br />
second most important primary producer in<br />
the estuary.<br />
In addition to primary production,<br />
organic material can be transported to the<br />
bay from outside sources by streamfl ow,<br />
sewage discharges, urban run<strong>of</strong>f from<br />
streets, rainfall, and ground-water<br />
discharge. <strong>The</strong>se values (1 isted in Table<br />
14) account for a t tal input <strong>of</strong> organic<br />
carbon <strong>of</strong> 92.7 x 10⁸<br />
kg/yr, or about 25%<br />
<strong>of</strong> the amount produced by photosynthesis<br />
(or marine plants) in the bay. This<br />
figtrre was probably much higher prior to<br />
recent improvements in industrial and<br />
municipal discharges, and substantial<br />
deposits <strong>of</strong> residual organic matter are<br />
still present in bay sediments (Ross et<br />
al. 1984). <strong>The</strong> estimate <strong>of</strong> Ross et al.<br />
for current allochthonous sources <strong>of</strong><br />
organic carbon is somewhat less than ours<br />
(66.7 vs. 92.7 x lo6 kg/yr) .<br />
3.110 SECONDARY PRODUCERS<br />
Secondary producers are the animal<br />
communities, either herbivorous or<br />
carnivorous, that consume the organic<br />
carbon in an area. A very simple <strong>Tampa</strong><br />
<strong>Bay</strong> food chain is illustrated in Figure<br />
58. A simplified food web for the bay is<br />
shown in Figure 69. Ideally, one should<br />
be able to measure the amount <strong>of</strong> fish or<br />
crab biomass produced over a period <strong>of</strong><br />
time. This is total secondary production.<br />
From studies with simpler systems, we know<br />
that total secondary production typical iy<br />
cannot exceed 10% <strong>of</strong> primary production<br />
because <strong>of</strong> inefficiencies in energy
Table 14. Organic inputs to <strong>Tampa</strong> Bey from allochthonous sources.<br />
Source<br />
mg/l TOC<br />
Streamfl owa 1,447 2 x 10¹² 10 20.0 x lo6<br />
Ground waterb 100 1.4 x 10¹¹ 0.1 0.014 x lo6<br />
Municipal and<br />
industrial<br />
di schargeC 520 7.1 x 10¹¹ 100 71.2 x lo6<br />
Urban run<strong>of</strong>fd - - - --- --- ---<br />
Total<br />
aModified from Hutchinson 1983.<br />
b~utchinson 1983.<br />
CMoon 1985.<br />
d~ata unavai 1 able.<br />
eWi thout urban run<strong>of</strong>f data.<br />
92.7 x<br />
transfer and the use <strong>of</strong> consumed energy to<br />
fuel 1 ife processes (Odum and Odum 1981).<br />
As noted in the section on total primary<br />
production and organic carbon input, the<br />
available data a1 1 ow only an approximation<br />
<strong>of</strong> the amount <strong>of</strong> organic material produced<br />
or delivered to the bay. Data on<br />
secondary production have not been<br />
generated accurately. Ross et al. (1984)<br />
estimate fish standing crop in the bay at<br />
271 x 10 f kg by multiplying the commercial<br />
landing data by a factor <strong>of</strong> 10. <strong>The</strong><br />
accuracy <strong>of</strong> this figure is unknown.<br />
In order to understand how the bay<br />
works it will be important to quantify<br />
both the types and amounts <strong>of</strong> primary and<br />
secondary production. Simply having 1 arge<br />
amounts <strong>of</strong> both may not necessarily be<br />
ideal. A bay ecosystem with a large<br />
variety <strong>of</strong> plant and animal species<br />
actually may require less organic material<br />
input. <strong>The</strong> typical "green pea soup"<br />
appearance in a polluted pond or sewage<br />
treatment plant lagoon is an example <strong>of</strong><br />
high primary product ion that a1 so<br />
indicates an imba anced system. Proper<br />
management <strong>of</strong> <strong>Tampa</strong> <strong>Bay</strong> to provide stable,<br />
balanced populations without abnormal<br />
algal blooms and fish kills will require a<br />
better understanding <strong>of</strong> both primary and<br />
secondary product ion.<br />
3.11 ZOOPLANKTON<br />
Zooplankton in <strong>Tampa</strong> <strong>Bay</strong> are divided<br />
into holopl ankton (animals who spend their<br />
entire 1 ives as p1 ankton) and meropl ankton<br />
(temporarily planktonic) . Copepods are<br />
typical ho1 opl ankton. Barnacles and<br />
oysters are typical meropl ankton, spending<br />
their early lives floating in the bay<br />
until they find a suitable point <strong>of</strong><br />
attachment (e.g., a mangrove prop root, a<br />
boat hull), at which Lime they<br />
metamorphose into their more familiar<br />
attached forms. Other meropl ankton , e-g.,<br />
pink shrimp, blue crabs, larval fish and<br />
some marine snai 1 s, metamorphose into<br />
mobi 1 e forms.<br />
<strong>The</strong> most extensive study <strong>of</strong><br />
zooplankton to date (Hopkins 1977)<br />
provides much useful data, but the author<br />
emphasized that cd1 ections were only<br />
taken at the surface <strong>of</strong> the bay once every<br />
3 months (quarterly] for one year. <strong>The</strong><br />
data are <strong>of</strong> limited value in describing<br />
long term cycles but are essential as a
Figure 68. SimpEe <strong>Tampa</strong> <strong>Bay</strong> food chain illustrating energy flow through seagrass epiphytes,<br />
caridean shrimp, and spotted seatrout.
Figure 69. A generalized <strong>Tampa</strong> <strong>Bay</strong> food web.<br />
first step in describing the general<br />
characteristics <strong>of</strong> bay zooplankton.<br />
Thi rty-seven species <strong>of</strong> hol opl ankton were<br />
identified in the study and were grouped<br />
into three categories based upon abundance<br />
(Table 15). Mean biomass for all<br />
zooplankton was 39.6 mg dry wt/m3. <strong>The</strong><br />
dominant species were three copepods<br />
(Oi thona colcarva, Acartia tonsa,<br />
Paracalanus crassirostris) , which made up<br />
56% <strong>of</strong> the zooplankton biomass. <strong>The</strong><br />
cosmopolitan species Acartia tonsa alone<br />
accounted for 30% <strong>of</strong> total zooplankton<br />
biomass. Although no feeding studies for<br />
this species have been done in <strong>Tampa</strong> Ray<br />
Conover (1956) and Reeve and Walter (1977)<br />
indicated that it is an omnivore,<br />
consuming phytopl ankton, zooplankton, and<br />
detritus.<br />
Researchers have been unable to find<br />
a significant re1 ationship between<br />
chlorophyll concentration (as a measure <strong>of</strong><br />
phytoplankton abundance) and numbers <strong>of</strong><br />
the 10 most abundant holoplankton species<br />
(Hopkins 1977). This indicates that<br />
phytoplankton occur in numbers greater<br />
than those needed to feed the existing<br />
population <strong>of</strong> zooplankton, and that other<br />
factors control the maximum population<br />
densities <strong>of</strong> zooplankton, or that other<br />
food sources are being uti 1 i zed.<br />
Holoplankton are important in the<br />
diet <strong>of</strong> larval fish in <strong>Tampa</strong> <strong>Bay</strong>, as is<br />
further described in the section on fish.<br />
For this reason and others, the population<br />
dynamics <strong>of</strong> hol opl ankton need additional<br />
study.
-<br />
U<br />
C3<br />
*i<br />
w<br />
m<br />
a<br />
-<br />
r.<br />
.r<br />
if-<br />
-<br />
' z<br />
4.<br />
1-h<br />
'&a<br />
1-5<br />
1;<br />
tx<br />
$2<br />
I-'.
Meropl ankton fa1 1 into two groups,<br />
invertebrate and fish meropl ankton<br />
(ichthyoplanktonj. Meroplankton data for<br />
<strong>Tampa</strong> <strong>Bay</strong> have been summarized by Weiss<br />
and Phillips (1985). Hopkins (1977), in<br />
sampling for holoplankton, found 19% <strong>of</strong><br />
total zooplankton numbers and 8% <strong>of</strong> the<br />
total biomass (3.2 g dry wt/m3) were<br />
meroplankton. Table 16 1 ists his general<br />
data for meropl ankton abundance. No<br />
detailed taxonomic descriptions were<br />
attempted for these collections.<br />
Invertebrate meropl ankton have been<br />
sampled primarily to locate and quantify<br />
1 arvae <strong>of</strong> invertebrates important in<br />
commercial fisheries. Thus, most early<br />
studies concentrated on examining samples<br />
for pink shrimp (Penaeus duorarum) and<br />
stone crab (Meni me mercenari a) 1 arvae.<br />
Eldred et al. (1961, 1965) examined the<br />
distribution <strong>of</strong> 1 arval and postlarval<br />
penaeid shrimp in the bay area. <strong>The</strong>y<br />
reported spawning by the adult shrimp<br />
16-64 km <strong>of</strong>fshore in the Gulf <strong>of</strong> Mexico<br />
between April and June; postlarvae moved<br />
inshore and into the bay in July, where<br />
they sought seagrass meadows as nursery<br />
habitat (Joyce and Eldred 1966). While<br />
maturing in the bay, the shrimp may be<br />
taken in small commerci a1 roll er-frame<br />
trawls and sold as bait shrimp, both a1 ive<br />
and dead. After the shrimp mature, they<br />
Table 16. Meroplankton species collected by Hopkins<br />
(19n1.<br />
Group Size Type<br />
Group I >1,000/m3 Bivalve 1 arvae<br />
Barnacle 1 arvae<br />
Pol ychaete 1 arvae<br />
Gastropod larvae<br />
Group I1 100-1,000/m3 Echinoderm 1 arvae<br />
Bryozoan 1 arvae<br />
Decapod 1 arvae<br />
Group I11
Adult female spawning in open sea<br />
A'---',<br />
r<br />
Adult migrating to sea<br />
Larva<br />
(nauplius-magnified ,<br />
d "<br />
Juvenile in bay<br />
nursery grounds<br />
Figure 70. Life cycle <strong>of</strong> the pink shrlmp (Penaeusduararum), Illustrating the use <strong>of</strong> inshore<br />
estuarine habitat as nursery areas (Joyce and Eldred 1966).<br />
Table 17. Dominant meroplankton species collected<br />
by Blanchet et al. (1977) and Phillips and Blanchet<br />
(1980).<br />
Fanii ly<br />
Decapods<br />
Penaei ds<br />
Species<br />
Pinnixia savana<br />
Eurvoanooeus deoressus<br />
Hexaoanopeus anqustifrons<br />
Uoosebia affinis<br />
Meni ooe mercenari a<br />
Rhi thropanopeus harri si i<br />
Panopeus herbstii<br />
Neooano~e texana<br />
Penaeus duorarum<br />
Sicvonia sp.<br />
Trachvpenaeus sp.<br />
Weiss and Phillips (1985) listed the<br />
dominant ichthyoplankton from three<br />
surveys (Tab1 e 18). In a1 1 three surveys<br />
the groups dominant as eggs were anchovy<br />
(Engraul idae) and drum (Sci aenidae) . In<br />
addition to these two families <strong>of</strong> fish,<br />
gobies (Gobi idae) , sardines (Harensul a),<br />
sheepshead (Archosarqus) and pigfish<br />
(Ortho~ri sti s) were common as both eggs<br />
and larvae.<br />
<strong>The</strong> seasonal occurrence <strong>of</strong> the two<br />
dominant ichthyopl ankton groups is<br />
illustrated in Figure 71. <strong>The</strong> greatest<br />
densities <strong>of</strong> eggs occurred in spring and<br />
the greatest diversity <strong>of</strong> larvae in the<br />
summer months. <strong>The</strong> bimodal peaks <strong>of</strong><br />
larval densities are theorized by Weiss<br />
and Phillips (1985) to represent a<br />
protracted spawning season. Winter<br />
col1 ections were dominated by bl enny<br />
(Blennidae) and gobies (Gobi idae) ,<br />
a1 though numbers usual 1y were low.
Table 18. Dominant fish egg and larval taxa as percentage <strong>of</strong> all eggs or larvae collected from three<br />
ichthyoplankton surveys in <strong>Tampa</strong> <strong>Bay</strong> (Weiss and Phillips 1985).<br />
Lower Hi 11 sborough Lower Hi1 1 sborough Upper Old<br />
<strong>Bay</strong> (1976) <strong>Bay</strong> (1979) <strong>Tampa</strong> <strong>Bay</strong> (1978)<br />
Engraul idaea<br />
sciaenidaeb<br />
CarangidaeC<br />
Engraul idae 51.1<br />
Sciaenid e 48.7<br />
Soleidae 1 0.1<br />
Engraul idae 82.2<br />
Sciaenidae 15.4<br />
Soleidae 1.1<br />
Anchoa spp.<br />
Sciaenidae<br />
Gobi idae<br />
pomadasyidaee<br />
Carangidae<br />
Larvae<br />
- A. mitchilli 74.4<br />
- H. .iaquana 16.3<br />
Sciaenidae 3.1<br />
Blennidae 1.5<br />
Prionotus sp. 0.9<br />
Anchoa sp. 83.6<br />
~obiidaef 13.3<br />
Sciaenidae 1.1<br />
Atherinid eg 1.1<br />
Bl ennidae i 0.3<br />
aAnchovies.<br />
b~rums.<br />
CJacks.<br />
d~ol es .<br />
eGrunts.<br />
f~obies.<br />
gsilversides.<br />
h ~ ennies l .<br />
3.12 BENTHOS<br />
<strong>The</strong> benthic community consists <strong>of</strong><br />
animals that live in the sediment as<br />
infauna by burrowing or forming permanent<br />
or semi-permanent tubes extending just<br />
above the sediment surface; animals that<br />
live on the sediment surface either as<br />
mobile epifauna or sedentary epifauna; and<br />
animals that form specialized communities<br />
such as oyster reefs or live-bottom<br />
communities.<br />
Taylor (1973) and Simon (1974)<br />
summarized the benthic studies conducted<br />
in <strong>Tampa</strong> <strong>Bay</strong>. Early work (Hutton et al.<br />
1956; Bullock and Boss 1963; Dragovich and<br />
Kelly 1964) listed species from random<br />
collections and identified 82 species <strong>of</strong><br />
invertebrates from the bay. <strong>The</strong> <strong>National</strong><br />
Marine Fisheries Service conducted more<br />
intensive sampling starting in I963 along<br />
a series <strong>of</strong> transects containing more than<br />
400 stations. From this work and a number<br />
<strong>of</strong> more recent intensive quantitative<br />
infaunal studies re1 ated to red-tide<br />
effects and pollution studies (Bloom et<br />
al. 1970; Dauer and Simon 1976; Dauer and<br />
Conner 1980; Santos and Simon 1980a,<br />
1980b; Dauer 1984) a fairly detailed<br />
understanding <strong>of</strong> the species composition<br />
and seasonal variations in density <strong>of</strong> the<br />
macroi nfauna (retained on a 0.5-mm sieve)<br />
has developed. Work has just begun on the<br />
mei<strong>of</strong>auna (small organisms from 0.5 mm to<br />
0.063mm in size (Bell and Coen 1982); and<br />
the larger mobile and sedentary epifauna<br />
still need more study, as do the fauna<br />
associated with seagrasses, mangroves, and<br />
marshes.<br />
Benthic studies have resulted in the<br />
foll owing general concl usions regarding<br />
this group <strong>of</strong> invertebrates in <strong>Tampa</strong> <strong>Bay</strong>:<br />
1. <strong>The</strong> estuary supports "an extremely<br />
abundant and diverse assembl age <strong>of</strong><br />
bottom organisms, except in<br />
Hi 11 sborough <strong>Bay</strong>, dredged regions <strong>of</strong><br />
Boca Ciega <strong>Bay</strong>, and a system <strong>of</strong><br />
inland canals developed in upper<br />
<strong>Tampa</strong> <strong>Bay</strong>" (Taylor 1973)- Taylor
AMCMOA SPP. LARVAE<br />
UPPER OLD .<br />
TAMPA BAY '<br />
MONTH<br />
SGEAENIDAE LARVAE<br />
MONTH<br />
4 0 0 r<br />
MONTH<br />
Flgclre 71. Wan densities <strong>of</strong> Anchbe spp. (anchovy) and Sciaenidile (drum) eggs and larvae<br />
vafietd In thrcara studies <strong>of</strong> <strong>Tampa</strong> <strong>Bay</strong> tchthyoplankton (from Weiss and Phlltlps 1985).
1 isted 207 species <strong>of</strong> polychaetes,<br />
231 species <strong>of</strong> mollusks, and 29<br />
species <strong>of</strong> echinoderms found in the<br />
bay. Simon and Mahadevan (1985)<br />
stated that approximately 1,200<br />
infaunal and epifaunal benthic<br />
species (excl uding the mei<strong>of</strong>auna)<br />
occur in the bay.<br />
Seasonal fluctuations in the<br />
abundance and diversity <strong>of</strong> these<br />
organisms are pronounced. Seasonal<br />
variabil i ty in benthic populations is<br />
high and densit'es can range from 0<br />
to 200,00O/m (Figure 72),<br />
particul arly in areas <strong>of</strong><br />
pol lution-re1 ated stress.<br />
3. Seagrass beds have declined with a<br />
concomitant decrease in faunal<br />
diversity. As discussed earl ier,<br />
seagrass meadows in <strong>Tampa</strong> <strong>Bay</strong> have<br />
not been sampled extensively for<br />
invertebrates, but existing data<br />
indicate they typical 1 y support a<br />
greater number and diversity <strong>of</strong><br />
benthic invertebrates than do<br />
unvegetated areas (Figure 60) (Santos<br />
and Simon 1974). <strong>The</strong> 81% decl ine in<br />
seagrass meadow coverage in the bay<br />
would thus be expected to have<br />
great1 y reduced the popul ations <strong>of</strong><br />
invertebrates.<br />
4. Opportunistic and "pollution<br />
indicator" species are abundant,<br />
particularly in Hill sborough <strong>Bay</strong><br />
where pol 1 uti on problems have been<br />
well documented for many years. Both<br />
Santos and Simon (1980a) and Dauer<br />
(1984) noted that parts <strong>of</strong> the bay<br />
periodically undergo catastrophic<br />
disturbance due to anoxia (no<br />
oxygen). This condition was first<br />
BOTTOM WATER TEMPERATURE<br />
10 l<br />
BO'ITOM DISSOLVED OXYGEN<br />
35 [<br />
BOTTOM SALINITY<br />
Figure 72. Trends in environmental parameters and benthic invertebrates, Hilfsborough <strong>Bay</strong> 1975-78 (from Santos<br />
and Simon 1980b).
documented by the Federal Water<br />
Pollution Administration (1969) and<br />
the <strong>National</strong> Marine Fisheries<br />
Laboratory (Taylor et al. 1970)<br />
during the mid 1960's and is similar<br />
to conditions reported for Chesapeake<br />
<strong>Bay</strong> (Officer et a1. 1984) as far back<br />
as the 1930's.<br />
If the anoxic area is small, as<br />
happens if 1 arge amounts <strong>of</strong> drifting<br />
macroalgae (u) wash into the<br />
intertidal zone and decay, densities<br />
<strong>of</strong> the 10 most common polychaete<br />
species can be reduced by up to 89%<br />
(Dauer 1984). A rapid recovery to<br />
control or higher densities also can<br />
occur; Dauer attributed this to the<br />
high proportion <strong>of</strong> opportunistic<br />
species with high reproductive<br />
ootent i a1 . <strong>The</strong>se include the<br />
polychaetes Ca~i tell a ca~i tata,<br />
Heteromastus fil iformis, Nereis<br />
succinea, Pol vdora 1 iqni , and<br />
Streblos~io benedicti.<br />
For larger scale defaunation due to<br />
anoxia in deeper water (4-5 m),<br />
similar rapid recovery rates for the<br />
eight dominant (95% <strong>of</strong> the density)<br />
invertebrates were observed for three<br />
annual summer periods <strong>of</strong> low (~1.0<br />
mg/l ) oxygen (Figure 72). Foll owing<br />
a fourth event, however, recovery was<br />
not observed during the 10 weeks <strong>of</strong><br />
sampling before the study ended<br />
(Santos and Simon 1980a). <strong>The</strong> eight<br />
dominant invertebrates included two<br />
mollusks (Mvsell a pl anul ata, Mu1 ini 9<br />
1 ateral is) , two amphi pods (Ampel i sca<br />
abdi ta, Grandidierell a bonnieroides) ,<br />
a cumacean (Cvclaspis sp.), and three<br />
polychaetes (Streblospio benedicti ,<br />
Mediomastus cal iforniensis, Nereis<br />
succinea). Maximum densities were<br />
reached during late spring or earl<br />
summer at over 200,000 individuals/ni 3<br />
(Figure 72). <strong>The</strong> populations crashed 5.<br />
to 0 typically in July-August <strong>of</strong> each<br />
year as bottom water temperatures<br />
reached maximum values (27OC-2g°C)<br />
and dissolved oxygen reached minimum<br />
val ues (t 1 mg/1) .<br />
Sampling 45 stations in Hillsborough<br />
<strong>Bay</strong> during August and September <strong>of</strong><br />
1963 revealed no live mollusks at 19<br />
stations. Only 18 stations had one<br />
or more <strong>of</strong> the dominant species,<br />
(Mu1 inia lateralis, Amygdal urn<br />
I<br />
papyra, Nassarius vibex, Tagelus<br />
lebe~us), and only 8 stations had<br />
Real thv no1 lusk oooulations . .<br />
(Taylor<br />
et ai. 1970). <strong>The</strong> depaupekate<br />
molluscan fauna was attributed to<br />
periodic anoxia and inability to<br />
recolonize.<br />
Hi1 1 sborough County Environmental<br />
Protection Commission (1982) reported<br />
that through 1981 "Hi 11 sborough <strong>Bay</strong><br />
has consistently had the lowest<br />
minimum dissolved oxygen levels at<br />
the bottom indicating a stressed<br />
benthic environment, " and noted<br />
further that it has also had the<br />
highest maximum dissolved oxygen<br />
levels at the surface, indicating<br />
algal bloom conditions. It appears<br />
these conditions have continued for<br />
at 1 east two decades.<br />
While it is interesting to note the<br />
rapid recovery <strong>of</strong> pollution tolerant<br />
species in some areas <strong>of</strong> the bay<br />
subjected to stress, Dauer (1984)<br />
noted that "species that are<br />
long-1 ived or that take several years<br />
to reach maturity (e.g., many species<br />
<strong>of</strong> bivalves and decapods) wi 11<br />
recover at a much slower rate."<br />
Such species include invertebrates <strong>of</strong><br />
importance to commercial and<br />
recreational fisheries such as the<br />
blue crab (Call inectes sa~idus) , the<br />
American oyster (Crassostrea<br />
virqinica) , and the hard-she1 led clam<br />
(Mercenaria campechiensi s) . In<br />
addition, fish species which consume<br />
benthic invertebrates, such as the<br />
redfish (Sciaenops ocell atus), can be<br />
expected to exhibit popul ation<br />
declines as their food supply is<br />
el iminated periodical 1y.<br />
Sediment type appears to be a<br />
controlling factor in determining<br />
infaunal distribution in the bay.<br />
Bloom et a1. (1972) sampled along<br />
three shallow shore1 i ne transects in<br />
<strong>Tampa</strong> <strong>Bay</strong>, each with a distinct<br />
sediment type (mud, sand, muddy<br />
sand). <strong>The</strong>y concluded that benthic<br />
assemblages along two <strong>of</strong> the<br />
transects were distinct, and the<br />
assemblage along the third was a
composite <strong>of</strong> the other two. <strong>The</strong><br />
dominant species for the various<br />
assemblages are 1 isted in Table 19.<br />
<strong>The</strong> data from Bl oom et a1 . confirmed<br />
a correl ati on between i nfaunal<br />
trophic type and sediment type:<br />
suspension feeders (e.g. Taqel us, a<br />
bivalve mollusk) being largely<br />
confined to sandy or firm mud bottoms<br />
(station l(U+M), Table 19), while<br />
deposit feeders (e.g., Ophiophraclmus,<br />
a brittle star) attain higher<br />
densities on s<strong>of</strong>t, muddy substrata<br />
(station 2U, Table 19).<br />
6. A general increase in species<br />
richness and decrease in total<br />
population abundance are evident on a<br />
north-to-south gradient in the bay.<br />
Simon (1979) sampled at three<br />
1 ocations along a north-to-south<br />
gradient for 11 months in 1978.<br />
<strong>The</strong>se locations were at Bullfrog<br />
Creek (north station), Little Manatee<br />
River (middle station) and Cockroach<br />
<strong>Bay</strong> (south station). <strong>The</strong> largest<br />
number <strong>of</strong> species (119) was found at<br />
the southern station and the smallest<br />
number (69) at the northern station<br />
(Table 20). <strong>The</strong> middle station had<br />
an intermediate number (104). A<br />
similar pattern was found in mean<br />
biomass (weight) <strong>of</strong> the organisms<br />
collected. Density values were<br />
variable and did not indicate a<br />
strong gradient. As noted before,<br />
however, previous studies at even<br />
more northerly stations in<br />
Hi1 1 sborough <strong>Bay</strong> have found densi tie<br />
<strong>of</strong> more than 200,000 individual s/m 5<br />
(Figure 72). <strong>The</strong> precise cause<br />
Table 19. Major and minor species components for the invertebrate assemblages identified by Bloom<br />
et al. (1972) along three transects each with three stations (U = upper; M = middle; L = lower) in Old<br />
<strong>Tampa</strong> <strong>Bay</strong>. Data for Station 3U omitted.<br />
Assemblages Median grain Major % Total Mi nor % Total<br />
by station size (mm) species organisms species organi sms<br />
1 (UtM) 0.152 Tasel us divi sus<br />
1 L 0.118 Arabel 1 a i ri col or<br />
Nassari us vi bex<br />
Kinberqonuphi s<br />
simoni<br />
Oohi o~hrasmus<br />
f i 1 oqraneus<br />
Prunum aoicinum<br />
2 U 0.232 O~hiophraqmus<br />
f i 1 oqraneus<br />
2 (MtL) 0,174 Branchi ostoma<br />
cari bbaeum<br />
Acanthohaustorius<br />
SP .<br />
3 (MtL) 0.208 Diooatra cu~rea<br />
Nassarius vi bex<br />
ki nberqonu~hi s<br />
s i mon i<br />
Uooqebia affinis<br />
Macoma constricta 3.1<br />
Diouatra cuurea 1.1<br />
Branchi ostoma<br />
cari bbaeum 5.7<br />
Di opatra cu~rea 1.3<br />
Nassarius vi bex 4.8<br />
Ophioohraqmus<br />
f i 1 oqraneus 2.6<br />
Pinnixia sp. 2.1<br />
Macoma constricta 3.8<br />
Pinnixia sp. 1.4<br />
Taqel us divisus 2.5
Table 20. Summary <strong>of</strong> benthic infaunal data from three sites a6ong a north<br />
to south gradient in <strong>Tampa</strong> <strong>Bay</strong> (from Simon 1979).<br />
Site<br />
Mean no. Mean Mean<br />
<strong>of</strong> species densi ty/m2 biomass (g/m2)<br />
Bull frog Creek<br />
(north station) 69 5,955 13.4<br />
Little Manatee River<br />
(middle station) 104 11,440 7.7<br />
Cockroach <strong>Bay</strong><br />
(south station) 119 6,766 4.9<br />
<strong>of</strong> these gradients has not been<br />
examined in detail. <strong>The</strong> generally<br />
finer-grained and more organically<br />
rich upper bay sediments may be<br />
responsible for high densities <strong>of</strong> a<br />
f2w pollution-tolerant species, while<br />
the lower bay sediments with larger<br />
grain size and fewer adjacent<br />
pol 1 uti on sources may support fewer<br />
numbers <strong>of</strong> more diverse but less<br />
pol 1 ution-to1 erant species.<br />
Two other benthic communities, oyster<br />
reefs and live bottom reefs. occur in<br />
<strong>Tampa</strong> <strong>Bay</strong>. Although oyster reefs in <strong>Tampa</strong><br />
<strong>Bay</strong> have not been studied, Bahr and Lanier<br />
(1981) provided a comprehensive discussion<br />
<strong>of</strong> their ecology along the south Atlantic<br />
coast, and much <strong>of</strong> their general<br />
discussion would apply to the reefs in the<br />
bay. <strong>The</strong> oyster reef community really<br />
consists <strong>of</strong> a group <strong>of</strong> invertebrates and<br />
some resident fish. Bahr and Lanier<br />
(1981) 1 isted 42 species <strong>of</strong> invertebrates<br />
associated with oyster reefs in Georgia.<br />
Most <strong>of</strong> the same species are known to<br />
occur in the bay and it is likely they<br />
would be found associated with the oyster<br />
reef community. <strong>The</strong> surface area <strong>of</strong> shell<br />
available for epi fauna ha been estimated<br />
to be at least 50 m2/mi <strong>of</strong> substratum<br />
(Bahr and Lanier 1981).<br />
As with the Georgia oyster reefs, the<br />
reefs in <strong>Tampa</strong> <strong>Bay</strong> typically are located<br />
just <strong>of</strong>fshore <strong>of</strong> the natural intertidal<br />
mangroves and marshes; the reef can become<br />
co'lonired by these plants as it accretes<br />
and reaches a sufficient elevation to<br />
support colonizing mangrove or marsh plant<br />
seeds or other propagules (approximately<br />
0.3 to 0.6 m above mean sea level). In<br />
addition to the group <strong>of</strong> organisms listed<br />
by Bahr and Lanier (1981), Tabb et al.<br />
(1962) noted the occurrence <strong>of</strong> the crown<br />
conch (Me1 onqena corona), a bl enny<br />
(Chasmodes saburae), and a goby (Gobiosoma<br />
robustum) on oyster reefs in northern<br />
<strong>Florida</strong> <strong>Bay</strong>. <strong>The</strong> same organisms are<br />
common in <strong>Tampa</strong> <strong>Bay</strong> oyster reefs.<br />
Lund (1957) stated that an acre <strong>of</strong><br />
oysters could biodepos i t 280 tons/acre/yr<br />
<strong>of</strong> sediment. Considering the problems<br />
with turbidity in <strong>Tampa</strong> <strong>Bay</strong> (Hill sborough<br />
County Environmental Protection Commission<br />
1982, Lewis et a1 , 1985b), the role <strong>of</strong><br />
oysters in maintaining and improvi ng water<br />
qua1 i ty certainly needs examination.<br />
Most <strong>of</strong> the existing intertidal and<br />
subtidal oyster reefs occur in areas <strong>of</strong><br />
the bay that currently are closed to<br />
shellfish harvesting. Areas still open to<br />
harvesting (Lower <strong>Tampa</strong> <strong>Bay</strong>) are located<br />
in the higher-salinity waters <strong>of</strong> the bay<br />
far removed from the major developed<br />
areas; however, oysters flourish in the<br />
lower-sal inity areas where they are<br />
protected from predation (Old <strong>Tampa</strong> <strong>Bay</strong><br />
and Hillsborough <strong>Bay</strong>). Historically,<br />
oysters were an important fishery resource<br />
in the bay, but are not commercially<br />
harvested today. Sewage discharges, urban<br />
run<strong>of</strong>f, and septic tank leakage have<br />
raised col iform bacteria counts in most <strong>of</strong>
the bay to such levels that, while the<br />
oysters and other fil ter-feeding moll usks<br />
may be present, they are unsafe to eat.<br />
Live-bottom communities consist <strong>of</strong><br />
assembl ages <strong>of</strong> sessi 1 e invertebrates such<br />
as sea fans, sea whips, hydroids,<br />
anemones, tunicates, sponges, bryozoans,<br />
and hard corals, usually attached to a<br />
natural exposed rock or reef formation.<br />
Derrenbacker and Lewis (1985) first<br />
reported on these communities in <strong>Tampa</strong><br />
<strong>Bay</strong>. <strong>The</strong> communities contain a high<br />
diversity <strong>of</strong> animals and plants (Figure<br />
73) and are unusual in <strong>Tampa</strong> <strong>Bay</strong> because<br />
most <strong>of</strong> the bottom is sandv or muddv and<br />
supports little attached piant or Girnal<br />
life.<br />
Two types <strong>of</strong> 1 ive bottom communities<br />
have been identified. <strong>The</strong> first, located<br />
in higher salinity portions <strong>of</strong> the bay,<br />
consists <strong>of</strong> an assemblage which includes a<br />
sea whip (Le~toqoraia viraul ata), the<br />
loggerhead sponge (Soheci osponqia<br />
vesoari a), boring sponges (Cl i ona spp. ) ,<br />
tunicates, a hard coral (Siderastrea<br />
radians) , and various algae including<br />
Saraassum f i 1 i oendul urn and Caul er~a<br />
mexicana. <strong>The</strong> second type is found in a<br />
more variable and lower-sal ini ty regime in<br />
the upper bay and consists <strong>of</strong> fewer<br />
species, with the hard coral, the<br />
loggerhead sponge, and several <strong>of</strong> the<br />
algae species being absent. Sheepshead<br />
(Archosarqus ~robatoceahalus) are abundant<br />
around these reef areas. Because <strong>of</strong> the<br />
difficulty <strong>of</strong> locating and mapping these<br />
areas, it is 1 ikely that other reef areas<br />
are present in the bay but have not been<br />
located to date. <strong>The</strong> ecological role <strong>of</strong><br />
these reefs in the bay is not known.<br />
<strong>The</strong>ir importance as habitat has been<br />
reported for other areas (Hedgepeth 1954;<br />
Grussendorf 1981; Wenner et al. 1983), and<br />
it is 1 ikely they serve an equally<br />
important role in <strong>Tampa</strong> <strong>Bay</strong>.<br />
3.13 FISH<br />
Springer and Woodburn (1960) 1 i sted<br />
253 species <strong>of</strong> fish found in the <strong>Tampa</strong> <strong>Bay</strong><br />
area. Additional studies raised the total<br />
number to 312 (Springer and McErlean 1961;<br />
Moe and Martin 1965). Comp (1985) noted<br />
that many <strong>of</strong> these species were <strong>of</strong>fshore<br />
species and would 1 i kely never be found in<br />
the bay. He prepared a list <strong>of</strong> 203<br />
species which were actually collected<br />
within the bay. He believed that only 125<br />
<strong>of</strong> these could be considered common<br />
inhabitants, and a1 though the 1 ist<br />
indicates a diverse fish assemblage, 10 or<br />
fewer species usually made up the majority<br />
<strong>of</strong> the fish caught in sampling programs.<br />
Table 21 lists the 10 most common fish in<br />
<strong>Tampa</strong> <strong>Bay</strong> in terms <strong>of</strong> numerical abundance<br />
in collections made with standard gear.<br />
As both Springer and Woodburn and Comp<br />
emphasized, the standard gear used for<br />
sampling <strong>of</strong> fishes in the bay is biased<br />
toward capturing smaller, 1 ess mobile<br />
species. .sharks and rays, for example,<br />
are abundant in <strong>Tampa</strong> <strong>Bay</strong>, but due to<br />
their mobility and size are sampled<br />
rarely. Even mullet are probably<br />
undersampled, although they are one <strong>of</strong> the<br />
most abundant species in the bay.<br />
Accordi ng to Springer and Woodburn<br />
(1960), <strong>of</strong> the 10 dominant species only<br />
two (pinfish and mullet) exhibit any<br />
degree <strong>of</strong> direct dependence on plant<br />
material in their diets. <strong>The</strong> rest consume<br />
a very similar range <strong>of</strong> items, including<br />
copepods, mysids, ostracods, amphi pods,<br />
small mollusks, polychaetes, and insects<br />
or insect larvae. To our knowledge, the<br />
only quantitative data on the diets <strong>of</strong><br />
Figure 73. Underwater photograph <strong>of</strong> a natural rock f i s/i i n <strong>Tampa</strong> <strong>Bay</strong> are being generated by<br />
reef in Lower <strong>Tampa</strong> <strong>Bay</strong>. <strong>The</strong> sponges are Cliona the <strong>Florida</strong> Department <strong>of</strong> Natural<br />
species.<br />
Resources, Marine Research Laboratory, in
Table 21. <strong>The</strong> 10 dominant fish species in <strong>Tampa</strong> <strong>Bay</strong> listed in approximate order <strong>of</strong> abundance with<br />
notation as to area <strong>of</strong> the bay where found (modified from Springer and Woodburn 1960; Finucane<br />
1966; Comp 1985).<br />
Coastal Lower Middle Hi 11 sborough<br />
beaches <strong>Tampa</strong> <strong>Bay</strong> <strong>Tampa</strong> <strong>Bay</strong> and McKay<br />
(high (medium to high (med i um <strong>Bay</strong>s (low<br />
Species sal ini ty) sal i ni ty) sal inity) sal ini ty)<br />
Tidewater sil verside<br />
Menidia peninsulae<br />
<strong>Bay</strong> anchovy<br />
Anchoa mitchilli<br />
Scaled sardine<br />
Harenqul a jaquana<br />
Striped mullet<br />
Muqil ceohal us<br />
Pinfish<br />
Lasodon rhomboides<br />
Longnose kill i fi sh<br />
Fundul us simi 1 is<br />
Spot<br />
Leiostomus xanthurus<br />
Silver perch<br />
Bairdiell a chrvsoura<br />
Si 1 ver jenny<br />
Eucinostomus &<br />
Code goby<br />
Gobiosoma robusturn<br />
St. Petersburg as part <strong>of</strong> an ongoing study<br />
titled "Early Life History <strong>of</strong> Sciaenids in<br />
<strong>Tampa</strong> <strong>Bay</strong>." Figure 74 was provided by<br />
the Department and i 11 ustrates the<br />
changing diet <strong>of</strong> juvenile red drum<br />
(Sci aeno~s ocell atus) from a planktonic<br />
stage (up to 10 mm) to a late juvenile<br />
stage (130 mm). <strong>The</strong> diet gradually shifts<br />
from the smaller zooplankton (copepods) at<br />
sizes less than 10 mm, to larger<br />
zoopl ankton and epifauna (mysids and<br />
amphipods) between 10 and 120 mm in size,<br />
finally shifting to larger epifauna and<br />
small fish at the maximum size sampled<br />
(130 mm). This generalized change in<br />
feeding habits with growth is<br />
characteristic <strong>of</strong> most fish (Livingston<br />
1982, 1984) and is referred to as the<br />
"ontogenetic trophic unit" concept.<br />
A1 though the specific importance <strong>of</strong> a<br />
given food varies with species, it is<br />
obvious that the maintenance <strong>of</strong> a healthy<br />
and diverse fish population depends upon<br />
heal thy popul ations <strong>of</strong> their required food<br />
items and the habitat needed for their<br />
early life stages.
j-<br />
Crabs<br />
lu 50<br />
0<br />
-<br />
I<br />
Shrimp<br />
50<br />
a<br />
lsopods<br />
50<br />
3<br />
0 Fish<br />
50<br />
0 Polychaetes<br />
50<br />
Z<br />
w<br />
0 50<br />
a<br />
w<br />
a 50<br />
50<br />
Insects<br />
Amphipods<br />
Mysids<br />
I 1 1 I , Copepods<br />
Figure 74. Stomach content analysis <strong>of</strong> juvenile <strong>Tampa</strong> <strong>Bay</strong> red drum (Sciaenops ocellatus) up to<br />
130 mm in length (courtesy <strong>of</strong> <strong>Florida</strong> Department <strong>of</strong> Natural Resourcesl.<br />
As noted before, the two species in<br />
the top 10 that have some dependence on<br />
plant materials are the pinfish and the<br />
mullet. <strong>The</strong> pinfish exhibits a choice <strong>of</strong><br />
food items similar to those <strong>of</strong> the other<br />
common species up to a size <strong>of</strong> 120 mm<br />
(Livingston 1982, 1984). At this size it<br />
appears to start consuming large<br />
quantities <strong>of</strong> seagrass and algae, although<br />
considerable controversy has surrounded<br />
the question <strong>of</strong> whether it actually<br />
depends on the plant material as an energy<br />
source or consumes it accidently as it<br />
pursues its prey in vegetated habitats,<br />
Springer and Woodburn (1960) observed that<br />
11 <strong>of</strong> 57 pinfish stomachs they examined<br />
contained "exclusively or almost<br />
exclusively masses <strong>of</strong> Dip1 anthera<br />
(Halodule wriqhtii or shoal grass) and one<br />
contained mostly Enteromorpha (an alga)."<br />
<strong>The</strong>y stated "we feel that pinfish ingest<br />
plant materi a1 del i berately" . Fry (1984)<br />
found that <strong>of</strong> nine fish species associated<br />
with seagrass meadows in the Indian River,<br />
F orida, only one, the pinfish, had delta<br />
-&C values a measure <strong>of</strong> dietary sources<br />
<strong>of</strong> food) that indicated consumption <strong>of</strong><br />
seagrass leaves and associated epiphytic<br />
a1 gae. <strong>The</strong> striped mullet feed by<br />
ingesting surface mud layers or grazing on<br />
surface attached a1 gae. Diatoms,<br />
din<strong>of</strong>l age11 ates, plant detritus, and<br />
copepods comprise their diet as adults.<br />
Larvae and small juveniles feed on<br />
zoopl ankton (Harris et a1 . 1983).<br />
Larger adults <strong>of</strong> some <strong>of</strong> the top 10<br />
species (Table 21) may consume juveniles<br />
<strong>of</strong> other fish species, but because <strong>of</strong><br />
their generally small size as adults their<br />
diet does not change greatly from that<br />
already outlined, and other fish are not<br />
important as food items. Adults <strong>of</strong><br />
larger, more predatory species <strong>of</strong> fish, on<br />
the other hand, typically depend upon the<br />
top 10 as their main source <strong>of</strong> food. Many<br />
<strong>of</strong> the species in this category are <strong>of</strong><br />
importance to recreational and commercial<br />
fisheries and include tarpon (Mesa7 ODS<br />
at1 anticus), snook (Centropomus<br />
undecimal is) , cobi a (Rachvcentron<br />
canadum), spotted seatrout (Cynoscion<br />
nebul osus), sand seatrout (Cynoscion<br />
arenarius) , and various species <strong>of</strong> sharks.<br />
Other important fish species appear to<br />
depend on invertebrates as their main<br />
source <strong>of</strong> food. <strong>The</strong>se include the red<br />
drum, black drum (Poqonias cromis), gag<br />
grouper (Mvcteroperca mi crol eai s j , and<br />
catfish (Arius fel js, Baqre marinus).
V)<br />
.*<br />
tc<br />
224<br />
o m<br />
4 w<br />
A2<br />
re-re-<br />
t-<br />
3 rrr<br />
wx<br />
.-<br />
f el<br />
rew<br />
-<br />
u<br />
0<br />
t<br />
tT<br />
.P<br />
cc<br />
0<br />
0,<br />
n:<br />
r<br />
SFwit.<br />
z z<br />
0<br />
cr c<br />
.- .,-<br />
34-<br />
OF-<br />
V1 .-<br />
0 ra<br />
Zv,
Table 22. Concluded.<br />
Species name<br />
Common name<br />
Centro~omus undecimal is<br />
Snook<br />
Epine~hel us ita.iara Jewf i sh<br />
Eoinephel us morio<br />
Red grouper<br />
Mycteroperca mi croleoi s Gag<br />
Rachycentron canadum Cobi a<br />
Muqil cephalus<br />
Striped mu1 1 et<br />
Muqil curema<br />
White mullet<br />
Muqil trichodon<br />
Fantai 1 mu1 1 et<br />
Chasmodes saburrae<br />
<strong>Florida</strong> bl enny<br />
Hvosobl ennius hentzi Feather bl enny<br />
Gobi osoma bosci<br />
Naked goby<br />
Gobi osoma robustum<br />
Code goby<br />
Microsobi us qulosus Clown goby<br />
Scomberomorus macul at us Spani sh mackerel<br />
Pri onotus sci tul us<br />
Leopard searobi n<br />
Prionotus tribulus<br />
Bighead searobin<br />
Para1 ichthvs a1 biqutta Gulf flounder<br />
Achirus 1 ineatus<br />
Lined sole<br />
Trinectes macul atus Hogc ho ker<br />
Svm~hurus DI aqi usa<br />
Bl ackcheek tonguef i sh<br />
Caranx hi BROS<br />
Creval le jack<br />
Lutjanus qriseus<br />
Gray snapper<br />
Lut'janus svnaqri s<br />
Lane snapper<br />
Diaoterus ~lumeiri Striped mojarra<br />
Eucinostomus arqenteus Spotfin mojarra<br />
Eucinostomus gula<br />
Silver jenny<br />
Gerres cinereus<br />
Yellowfin mojarra<br />
Archosarsus ~robatocephalus Sheepshead<br />
Laqodon rhomboi des<br />
Pinfish<br />
Bairdiell a chrysoura Silver perch<br />
Cvnoscion arenarius Sand seatrout<br />
Cynoscion nebul osus Spotted seatrout<br />
Leiostomus xanthurus Spot<br />
Menticirrhus americanus Southern kingfish<br />
Menticirrhus saxatilis Northern ki ngfi sh<br />
Mi cropoqoni as undul atus Atlantic croaker<br />
Poqonias cromis<br />
Black drum<br />
Sciaenops ocell atus Red drum<br />
Chaetodi oterus faber Atlantic spadefish<br />
Chi 1 omvcterus schoe~fi Striped burrfish<br />
larval and juvenile fish typically migrate<br />
into shallow, protected, low-salinity<br />
nursery areas <strong>of</strong> the bay to feed and<br />
mature (Figure 75) (Comp 1985; Lewis et<br />
a7. 1985b). One exception may be the<br />
larval spotted seatrout, which seeks out<br />
seagrass meadows for nursery area.<br />
Seagrass meadows in the lower-sal ini ty<br />
areas <strong>of</strong> the bay (Hillsborough <strong>Bay</strong>, Upper<br />
Old <strong>Tampa</strong> <strong>Bay</strong>) have largely disappeared in<br />
recent years (Figure 53) and thus the<br />
primary nursery area for this species may<br />
have been severely reduced. <strong>The</strong> major<br />
decline in the commercial catch <strong>of</strong> spotted<br />
seatrout in the bay (Lombardo and Lewis<br />
1985) may be a result <strong>of</strong> this loss af<br />
nursery habitat.
f "Iniacirncr 6 1966) and Sykes and 3.14 REPTILES<br />
flnucane (1966) sampled at 50 stations<br />
arsund tks bay For more than 4 years Only two species <strong>of</strong> marine reptiles<br />
f Flgure 76) and found the stlver perch and are comon in the bay the dimmndback<br />
tkr bay anchovy were the most comon<br />
speales tn deep-water samples. <strong>The</strong><br />
ttdewatar silverside, spat, and pinfish<br />
w6re the most comon specles in shallow<br />
wafer. <strong>The</strong>y furtksrnctt@dthat21 species not been studied. ~ag(yerhead turtles<br />
<strong>of</strong> eam@rc-ltllly Important fish and two (Qatd occasional 1 y are<br />
spalc;i!ss <strong>of</strong> com~rcial ly important observed in on the gulf side <strong>of</strong><br />
tnva~teiat*eE~;ts used the gstuary as a Egmont Key (Reynolds and Patton 1985)-<br />
wursery arca. <strong>The</strong> rgsults <strong>of</strong> this study<br />
rr@ sumartzed 4n Figures 76 and 77. '<strong>The</strong><br />
d8ifFerenr@ Sin nttmbers sf immature fjsh 3.75 BIRRS<br />
between sampling area III (Old <strong>Tampa</strong> <strong>Bay</strong>)<br />
and areis !V fHtls5orm@gh <strong>Bay</strong>), <strong>of</strong> siattilar Seabirds itnd watrf4ng bfrrfs as@ a very<br />
zbze and cxh$b.iting sfmilar salinity and visible and important component <strong>of</strong> the<br />
temperature patterns, was attributed to animal 1 iiFe <strong>of</strong> the bay. Because they are<br />
the lass @f nursePy habitat and greater relatively easy to observe* counts and<br />
dl; %charge <strong>of</strong> pollutants into Hill sborough species observations are abundant<br />
<strong>Bay</strong>,<br />
(Woolfenden and Schreiber 3973; Dunstan<br />
92
and Lewis 1974; Lewis and Lewis 1978;<br />
Schrei ber and Schrei ber 1978; Schrei ber<br />
1979; Paul and Wool fenden 1985).<br />
Table 23 lists 83 species <strong>of</strong> birds<br />
associated with marine habitats in the<br />
bay. Many <strong>of</strong> these use certain bay<br />
habitats for nesting and raising young<br />
(Figure 78), and also wade in the shallows<br />
(Figure 79) or dive in deeper waters to<br />
feed on fish and invertebrates.<br />
<strong>The</strong> brown pel i can (Pel ecanus<br />
occidentalus) is particularly we1 1 studied<br />
(Wool fenden and Schrei ber 1973; Schrei ber<br />
and Schreiber 1983). <strong>The</strong> adults nest in<br />
the canopy <strong>of</strong> mangroves on natural or<br />
artificial islands in the bay where they<br />
are protected from mammal i an predators<br />
(e.g. , raccoon, Procvon 1 otor) which<br />
typically do not swim across water<br />
barriers. Success <strong>of</strong> nestlings is tied<br />
vitally to the food supply that the adults<br />
can collect. A young pel ican needs 264 kg<br />
<strong>of</strong> fish to mature to the point where it<br />
Figure 76. Stations and subareas <strong>of</strong> <strong>Tampa</strong> <strong>Bay</strong> sarn- can fly and begin to feed itsel f . Adults<br />
pled by the Bureau <strong>of</strong> Commercial Fisheries (<strong>National</strong> requi re about 2.5 kg <strong>of</strong> f i sh/day<br />
Marine Fisheries Service), August 1961 -June 1984 (Woo1 fenden and Schrei her 1973) .<br />
(Finucane 1966).<br />
SILVER MULLET<br />
MVI'I cu
Table 23. Birds associated with marine environments <strong>of</strong> <strong>Tampa</strong> <strong>Bay</strong> (Local status: W-wintering,<br />
T-transient. P-permanent, B-breeding) (modified from Dunstan and Lewis 19741.<br />
Species name<br />
Common name<br />
Local<br />
status<br />
Podiceos auritus<br />
Horned grebe<br />
Pelecanus occidentalisb,~ Brown pel i can<br />
- P. ervthrorhvnchos<br />
White pel i can<br />
Freqata maqni fi censd<br />
Magnificent frigatehird<br />
Phal acrocorax auri tus<br />
Double-crested cormorant<br />
Anas fulviqul a<br />
Mottled duck<br />
-- A. acuta<br />
Northern pintail<br />
A. americana<br />
American wigeon<br />
A. clvoeata<br />
Northern shoveler<br />
- A. discors<br />
Bl ue-wi nged teal<br />
-- A. crecca<br />
Green-winged teal<br />
Avthva val isineria<br />
Canvasback<br />
A. affinis Lesser scaup<br />
Mersus serrator<br />
Red-breasted merganser<br />
Cathartes<br />
Turkey vulture<br />
Corasv~s atratus<br />
El ack vulture<br />
Circus cvaneus<br />
Marsh hawk<br />
Hal i aeetus leucoceohal usa,C Bald eagle<br />
Pandion ha1 i aetus<br />
Opsrey<br />
Casmerodi us a1 bus<br />
Great egret<br />
Eqretta qc<br />
Snowy egret<br />
E. rufescens Reddish egret<br />
E. tricolore Tricolored heron<br />
E. caeruleae Little blue heron<br />
Bubulcus iJ&<br />
Cattle egret<br />
Ardea herodi as<br />
Great blue heron<br />
Butorides stri atus<br />
Green- backed heron<br />
Nvcticorax nvcticorax<br />
Bl ack-crowned night heron<br />
Nvctanassa viol aceus<br />
Ye1 low-crowned night heron<br />
Pl eqadi s fa1 cine1 lus<br />
Glossy ibis<br />
Eudocimus a1 bus<br />
White ibis<br />
A.iaia a m Roseate spoonbill<br />
Mvcteria americana<br />
Wood stork<br />
Ral lus lonqirostris Clapper rai 1<br />
Gal 1 inul a chl oro~us<br />
Common moorhen<br />
Ful ica ameri cana<br />
American coot<br />
Haematoous all i atusd<br />
American oystercatcher<br />
Himantoous mexicanus<br />
Bl ack-necked stilt<br />
Pluvial is sauatarol a<br />
Black-be1 1 ied plover<br />
Charadri us semi oalmatus<br />
Semi pal mated plover<br />
- C. wilsonia<br />
Wi I son's plover<br />
-- Limosa fedoa<br />
Marbled godwi t<br />
Actitis macularia<br />
Spotted sandpiper<br />
Catootrouhorus semi~almatus Willet<br />
Tri nqa me1 an01 euca<br />
Greater ye1 1 owl egs<br />
Trinqa flavioes<br />
Lesser ye1 1 owl egs<br />
Limnodromus qri seus<br />
Short-billed dowitcher<br />
- L. scol opaceus<br />
Long-bill ed dowitcher<br />
Arenari a i nterures<br />
Ruddy turnstone<br />
(continued)<br />
94
Species name<br />
Cal idris canutus<br />
Cal idris alpinna<br />
C. - alba<br />
C. minutilla<br />
- C. pusilla<br />
-- C. mauri<br />
Larus marinus<br />
L. arqentatus<br />
L. del awarens i s<br />
L. atricilla<br />
- L. philadelphia<br />
Sterna anti 11 arumd<br />
S. forsteri<br />
S. sandvicensis<br />
S. maximus<br />
- S. cas~ia<br />
Chlidonias niqer<br />
Rhvnchoos niqer<br />
Zenaida macroura<br />
Columbina ~asserina<br />
Chordeiles minor<br />
Cervl e a1 cvon<br />
Corvus ossifraqus<br />
Mimus pol vql ottos<br />
Toxostoma rufum<br />
Lanius 1 udovicianus<br />
Dendro i ca d i scol or<br />
Aqel ai us ohoeniceus<br />
Cardinal is cardinal is<br />
Pi pi 1 o ervthro~hthalmus<br />
Coccvzus minor<br />
Tvrannus dominicensi s<br />
Vireo a1 ti 1 oauus<br />
Table 23. Concluded.<br />
Common name<br />
Red knot<br />
Dun1 in<br />
Sander1 i ng<br />
Least sandpi per<br />
Semi palmated sandpi per<br />
Western sandpiper<br />
Great bl ack-backed gull<br />
Herring gull<br />
Ring-billed gull<br />
Laughing gull<br />
Bonaparte's gull<br />
Least tern<br />
Forster's tern<br />
Sandwich tern<br />
Royal tern<br />
Caspian tern<br />
Black tern<br />
Black skimmer<br />
Mourning dove<br />
Common ground dove<br />
Common nighthawk<br />
Be1 ted kingfisher<br />
Fish crow<br />
Northern mockingbird<br />
Brown thrasher<br />
Loggerhead shrike<br />
Prairie warbler<br />
Red-winged bl ackbi rd<br />
Northern cardinal<br />
Rufous-sided towhee<br />
Mangrove cuckoo<br />
Gray ki ngbi rd<br />
Bl ack-whi skered vireo<br />
Local<br />
status<br />
a~ederaly 1 i sted as endangered.<br />
b~ederal ly 1 i sted as threatened.<br />
C<br />
Endangered - <strong>Florida</strong> Committee on Rare and Endangered Plants and<br />
Animals (FCREPA).<br />
d~hreatened - FCREPA.<br />
e~pecies <strong>of</strong> special concern - FCREPA.<br />
f~are - FCREPA.<br />
Wool fenden and Schrei ber noted that "We population. " Many other bird species<br />
g the depend on the same fish species for food.<br />
<strong>The</strong> total breeding population <strong>of</strong><br />
colonial birds in <strong>Tampa</strong> <strong>Bay</strong> is estimated<br />
to be 75,000 pairs, two-thirds <strong>of</strong> which<br />
are laughing gulls (Paul and Wool fenden
population <strong>of</strong> 2,700-3,000 breeding pairs<br />
represents nearly one-third <strong>of</strong> the entire<br />
<strong>Florida</strong> population <strong>of</strong> such birds. In 1983<br />
an estimated 10,200 pairs <strong>of</strong> white ibis<br />
were present in one large colony at the<br />
A1 af i a River (Paul and Wool fenden 1985) .<br />
McKay <strong>Bay</strong> (Figure 3) in the northeast<br />
corner <strong>of</strong> <strong>Tampa</strong> <strong>Bay</strong>, ty~ically supports a<br />
winter population <strong>of</strong> almost 25,000 marine<br />
birds, which during 11 years <strong>of</strong> censusing<br />
has included 75 species. Almost 80% <strong>of</strong><br />
these birds are <strong>of</strong> five species: lesser<br />
scaup, ruddy duck, dun1 in, short-billed<br />
dowitcher, and western sandpiper (Paul and<br />
Wool fenden 1985).<br />
Figure 78. Brown pelican with young in nest in mangroves,<br />
Lower <strong>Tampa</strong> <strong>Bay</strong>.<br />
Although some species which formerly<br />
nested in the bay have returned recently<br />
(reddish egret in 1974, roseate spoonbill<br />
in 1975), recent population declines in<br />
many species are apparent. Paul and<br />
Wool fenden 1 i sted red tides, parasite<br />
outbreaks, dredge and fill activities,<br />
pesticide use, and oil spills as having<br />
generally negative effects on bird<br />
abundance. Waterfowl surveys <strong>of</strong> the bay<br />
have indicated a sharp decline in the<br />
wintering population <strong>of</strong> 1 esser scaup, from<br />
105,900 in 1976 to 8,400 in 1979. Major<br />
dredging in Hillsborough <strong>Bay</strong> is imp1 icated<br />
as a possible cause <strong>of</strong> the decline, since<br />
over 400 ha <strong>of</strong> open water habitat was lost<br />
during this period because <strong>of</strong> spoil island<br />
creation.<br />
3.16 MARINE MAMMALS<br />
Figure 79. Shore birds and wading birds feeding in<br />
McKay <strong>Bay</strong>.<br />
1985). <strong>The</strong> laughing gull population is<br />
estimated to be one-third <strong>of</strong> the entire<br />
breeding population in the southeast<br />
United States. <strong>The</strong> brown pel ican<br />
Reynolds and Patton (1985) have<br />
summarized the existing information on<br />
marine mammals <strong>of</strong> the <strong>Tampa</strong> <strong>Bay</strong> area.<br />
Only two species normally are found within<br />
the bay, the bottlenose dolphin (Tursio~s<br />
truncatus) and the West Indian manatee<br />
(Trichechus manatus). <strong>The</strong> bottlenose<br />
dolphin is a year-round resident and the<br />
'local population is estimated at 100-200<br />
individuals, found in small herds <strong>of</strong> 3-6<br />
animal s (Reynolds and Patton 1985).<br />
Little research beyond aerial surveys <strong>of</strong><br />
popul at<br />
in the<br />
In a baywide survey over a period <strong>of</strong><br />
1 year (Patton 1980) found that numbers <strong>of</strong><br />
manatees varied seasonally; a maximum <strong>of</strong><br />
55 was observed in the winter. <strong>The</strong>y
appeared to aggregate around industrial the Alafia River in February 1980. Levis<br />
thermal discharges into the bay. <strong>The</strong> et a1 . (1984) observed manatees feeding on<br />
largest single aggregation was 42 macroalgae in the same area in January<br />
individuals observed around the mouth <strong>of</strong> 1981.
CHAPTER 4.<br />
ECOLOGICAL INTERRELATIOIMS#IPS<br />
4.1 INTRODUCTION<br />
This chapter is short because <strong>of</strong> the<br />
general absence <strong>of</strong> studies on ecological<br />
interrelationships in the bay. Unlike<br />
studies in Apalachicol a <strong>Bay</strong> (Livingston<br />
1984), most scientific work in <strong>Tampa</strong> <strong>Bay</strong><br />
basicall y has been descriptive or has<br />
concentrated on a single structural or<br />
functional aspect <strong>of</strong> the bay's ecology.<br />
<strong>The</strong>refore, we use the best available data<br />
from <strong>Tampa</strong> <strong>Bay</strong> studies and better data<br />
from other studies to address four topics<br />
concerning ecological interrelationships:<br />
(1) energy sources; (2) abiotic controls<br />
In communities; (3) plant and animal<br />
interactions; and (4) fisheries habitats.<br />
4.2 ENERGY SOURCES<br />
<strong>The</strong> flow <strong>of</strong> energy from the sun<br />
through plants to the animal communities<br />
<strong>of</strong> the bay is illustrated in Figures 68<br />
and 69. <strong>The</strong>se graphic representations are<br />
based largely upon studies from other<br />
estuaries, For example, the util ization<br />
<strong>of</strong> epiphytic algae as an energy saurce by<br />
caridean shrimp, and their use in turn as<br />
food for spotted seatrout (Figure 68) is<br />
based upon the work <strong>of</strong> Tabb (1961), Carr<br />
and Adarns (1973), Kitting et al. (1984),<br />
and Virnstein et al. (1983), none <strong>of</strong> which<br />
Has done in <strong>Tampa</strong> <strong>Bay</strong>.<br />
None <strong>of</strong> the boxes or arrows in Figure<br />
69 have numbers associated with them<br />
because the specific quantities <strong>of</strong> energy<br />
contributed to various animal groups by<br />
the major plant types have not been made.<br />
Table 13 1 i st$ phytoplankton as the source<br />
<strong>of</strong> 68.8% <strong>of</strong> the bay's primary production.<br />
This does not mean that phytoplankton<br />
provide 68.8% <strong>of</strong> the energy consumed by<br />
animals in the bay, because the quantity<br />
<strong>of</strong> energy captured by phytopl anktonic<br />
photosynthesis that is subsequently lost<br />
to sedimentation and flushing from the bay<br />
is unknown. Because <strong>of</strong> eutrophication, it<br />
is likely that much phytoplankton<br />
productivity is incorporated as organic<br />
deposits in the bottom <strong>of</strong> the bay and may<br />
contribute to anoxic conditions reported<br />
in Hillsborough <strong>Bay</strong> (Figure 80). Similar<br />
events have been attributed to high<br />
phytoplankton productivity in Chesapeake<br />
<strong>Bay</strong> (Officer et a1 . 1984).<br />
<strong>The</strong> elucidation <strong>of</strong> the role <strong>of</strong> the<br />
bay's pl ant communities, including<br />
phytoplankton, in providing energy to<br />
support animal communities remains a<br />
necessary, but as yet unstudied, research<br />
need for the bay.<br />
4.3 ABIOTIC CONTROLS IN COMMUNITIES<br />
<strong>The</strong> annual cycles <strong>of</strong> temperature and<br />
rainfall, and the common events <strong>of</strong><br />
hurricanes, drought, and frost are the<br />
basic control1 ing factors for all life<br />
cycles in the bay. However, no attempts<br />
have yet been made to statistically<br />
correlate physical factors to biological<br />
0 DAY<br />
NIGHT<br />
Figure 80. Anoxic conditions in Hillsborough <strong>Bay</strong><br />
(from Federal Water Pollution Control 1969).
variables in the bay. Within the analyses<br />
<strong>of</strong> some individual studies (Figure 72)<br />
distinct correlations are demonstrated.<br />
Without these analyses, conclusions as to<br />
cause and effect in bay processes can be<br />
erroneous. An example is the general<br />
anecdotal observation that water cl ari ty<br />
in the bay is improving; this is <strong>of</strong>ten<br />
attributed to improved sewage treatment at<br />
such plants as the City <strong>of</strong> <strong>Tampa</strong>'s Hookers<br />
Point facility. Trends in water clarity<br />
(Figure 38) and chlorophyll - a (Hillsborough<br />
County Environmental Protection<br />
Cornmi ssion, unpubl . data) tend to support<br />
these observations. What is not taken<br />
into account is the fact that several<br />
recent winters have been the coolest in<br />
100 years, and rainfall has been less<br />
than average. Both <strong>of</strong> these climtological<br />
features potentially could<br />
contri bute to reduced phytoplankton<br />
populations and increased water clarity.<br />
For example, Flint (1985), in<br />
examining el even years <strong>of</strong> biotic and<br />
abiotic data for Corpus Christi <strong>Bay</strong>, noted<br />
that episodic events (floods, hurricanes)<br />
stimulated estuarine productivity and thus<br />
represented a significant forcing factor<br />
to the estuary. He stated that "without<br />
the reconstruction <strong>of</strong> a long-term data set<br />
. . . these perceptions <strong>of</strong> ecosystem<br />
function could not have been developed"<br />
(p. 168).<br />
Unfortunately, we do not have<br />
simultaneous, long-term data sets <strong>of</strong><br />
abiotic and biotic information from which<br />
to draw simi 1 ar information about <strong>Tampa</strong><br />
<strong>Bay</strong>. Although large amounts <strong>of</strong> abiotic<br />
data are collected, there has been no<br />
similar effort toward the collection <strong>of</strong><br />
concurrent biotic community data. <strong>The</strong><br />
problems <strong>of</strong> understanding the role <strong>of</strong><br />
physical parameters in bay processes are<br />
immense but without that understanding,<br />
decisions on bay management wi 11 continue<br />
to be made on the basis <strong>of</strong> symptomatic,<br />
rather than causative, considerations.<br />
4.4 PLANT AND ANIMAL INTERACTIONS<br />
example, brown pel icans seek out mangrove<br />
islands for nesting during the spring<br />
(Paul and Wool fenden 1985), and young<br />
pinfish are found in large numbers in<br />
seagrass meadows (Springer and Woodburn<br />
1960) at about the same time.<br />
Quantitative sampl ing for fauna has been<br />
limited largely to benthic infauna in<br />
unvegetated habitats (see Section 3.12).<br />
<strong>The</strong> studies by Santos and Simon (1974) <strong>of</strong><br />
polychaetes in a seagrass meadow and Lewis<br />
(1983) on invertebrates in a mangrove<br />
forest are two <strong>of</strong> the few exceptions.<br />
<strong>The</strong> assumption is made that the loss<br />
<strong>of</strong> certain vegetated habitats has<br />
contributed to declines in fish and<br />
wildlife in the bay (H<strong>of</strong>fman et al. 1985;<br />
Lewis et a1 . 1985b; Paul and Wool fenden<br />
1985) and that reestabl ishment <strong>of</strong> these<br />
plant communities would restore fish and<br />
wild1 ife populations to some higher<br />
numbers (H<strong>of</strong>fman et al. 1985). Though<br />
most scientists would not disagree with<br />
these general assumptions, supporting data<br />
are not available for <strong>Tampa</strong> <strong>Bay</strong>. More<br />
importantly, the direction <strong>of</strong> restoration<br />
efforts should have a sound scientific<br />
basis in order to produce measurable<br />
results.<br />
4.5 FISHERIES HABITATS<br />
Fish and shellfish <strong>of</strong> commercial and<br />
recreational importance in <strong>Tampa</strong> <strong>Bay</strong><br />
include mu1 1 et, blue crabs, hard she1 1<br />
clams, tarpon, snook, and spotted seatrout<br />
(Lombardo and Lewis 1985). <strong>The</strong> harvest<br />
<strong>of</strong> these species is a particularly visible<br />
and important part <strong>of</strong> the value <strong>of</strong> the bay<br />
as perceived by most citizens.<br />
As noted above, it has been assumed<br />
that declines in fisheries habitats<br />
(seagrass meadows, mangrove forests, and<br />
tidal marshes) are a major cause <strong>of</strong> these<br />
apparent declines. We say "apparent"<br />
because again, the data to support these<br />
declines are largely anecdotal or have<br />
other problems (see Lombardo and Lewis<br />
1985).<br />
In addition to their role as sources Lewis (1977) reports that total<br />
<strong>of</strong> energy, plant communities in the bay emergent marine wetlands (tidal marshes<br />
are important as habitat. C e r t a i n and mangrove forests) on <strong>Tampa</strong> <strong>Bay</strong> have<br />
species are found in particular habitats decl ined from historical coverage (ca.<br />
at specific times <strong>of</strong> the year. For 1876) <strong>of</strong> 10,053 ha to a current coverage<br />
99
(ca. 1976) <strong>of</strong> 5,630 ha, a loss <strong>of</strong> 44% <strong>of</strong><br />
the original areal cover. Much <strong>of</strong> that<br />
loss was due to dredging and filling <strong>of</strong><br />
shallow intertidal areas to create<br />
waterfront residential sites and<br />
commercial port-related facilities.<br />
Significant areas <strong>of</strong> seagrass meadows were<br />
also removed during these same dredge and<br />
fill projects (Taylor and Saloman 1968).<br />
As noted in Section 3.5, only 19% (5,750<br />
ha) <strong>of</strong> the original seagrass acreage in<br />
<strong>Tampa</strong> <strong>Bay</strong> remains.<br />
If these areas are in fact necessary<br />
to support heal thy populations <strong>of</strong><br />
harvestable fishery resources, one would<br />
expect that some evidence <strong>of</strong> decl ining<br />
harvests would appear. In fact,<br />
commerci a1 1 andings <strong>of</strong> species dependent<br />
upon tidal marshes, mangrove forests, and<br />
seagrass meadows have declined, in some<br />
cases dramatically (Lombardo and Lewis<br />
1985). When compared with another estuary<br />
<strong>of</strong> similar size, but with much less<br />
habitat loss (Charlotte Harbor),<br />
commercial landings data for spotted<br />
seatrout and red drum indicate a declining<br />
harvestable resource (Figure 81). <strong>The</strong>re<br />
are limitations to the value <strong>of</strong> commercial<br />
landings data [as discussed by Lombardo<br />
and Lewis (1985) and Harris et al.<br />
(1983)j, but as an indicator <strong>of</strong> fisheries<br />
harvest trends, we be1 ieve the data are<br />
useful. Commercial landings <strong>of</strong> both red<br />
drum and spotted seatrout have remained<br />
stable or have shown sl ight increases<br />
during the period <strong>of</strong> record (1952-82) in<br />
Charlotte Harbor (Figure 81). During the<br />
same period the areal cover <strong>of</strong> mangroves<br />
has increased by 10% (from 20,860 to<br />
22,928 ha], while seagrass acreage has<br />
dccl ined by 29% (from 33,586 ha to 23,682<br />
ha; Harris et al. 1983). As previously<br />
mentioned, losses <strong>of</strong> seagrasses (-81%) and<br />
rnangrnves and marshes (-44%) in <strong>Tampa</strong> <strong>Bay</strong><br />
have been much greater. A relationship<br />
between areal cover <strong>of</strong> important nursery<br />
habitat or food sources and the resulting<br />
harvestabl e fishery resources has been<br />
postulated and supported by data from<br />
several sources worldwide (Turner 1977,<br />
1982). Thus, the marked decline in the<br />
commercial landings <strong>of</strong> spotted seatrout<br />
and the markedly lower harvests <strong>of</strong> redfish<br />
in <strong>Tampa</strong> <strong>Bay</strong>, when compared with those<br />
from Char1 otte Harbor, support the concept<br />
<strong>of</strong> the value <strong>of</strong> these habitats in<br />
maintaining heal thy and productive fishery<br />
resources. A1 though similar quantitative<br />
data are not available for recreational<br />
fishery harvests, the general expressions<br />
<strong>of</strong> recreational fishermen when interviewed<br />
are (1) fishery harvests are declining;<br />
and<br />
(2) causes are perceived to include<br />
overharvesting, habitat loss, and poor<br />
water qua1 ity (Be1 1 et a1 . 1982) .<br />
<strong>The</strong> first major fish survey <strong>of</strong> <strong>Tampa</strong><br />
<strong>Bay</strong> occurred during 1958- 59 (Spr i nger and<br />
Woodburn 1960). Comp (1985, p. 412)<br />
discussed those data and more recent<br />
studies and noted:<br />
Due to the sampling 1 imitations . . .<br />
only gross changes in abundance could<br />
have been detected over time. <strong>The</strong><br />
data reviewed in this report suggests<br />
that such a chanqe has not occurred<br />
in <strong>Tampa</strong> <strong>Bay</strong> . . . . However, most<br />
<strong>of</strong> the recent studies have been<br />
restricted to re1 atively small areas<br />
. . . so the results obtained cannot<br />
be extrapolated and used to determine<br />
the stability <strong>of</strong> the fish abundance<br />
or community structure throughout the<br />
bay.<br />
We do not know whether fish<br />
popul at i ons have decl i ned because <strong>of</strong><br />
habitat loss. <strong>The</strong> previous discussion<br />
hints at a connection but the necessary<br />
data are not avail able. Nil 1 large-scale<br />
habitat restoration increase fish and<br />
shellfish populations Again we do not<br />
know. <strong>The</strong> role <strong>of</strong> pollutant discharge to<br />
the bay in control 1 i ng f i sheri es abundance<br />
may be as critical as habitat alteration<br />
(see Summers et a1 . 1985 and Polgar et al.<br />
1985). With hundreds <strong>of</strong> thousands <strong>of</strong><br />
do1 1 ars projected for expenditure to<br />
restore what are assumed to be habitats<br />
important to fish, we must provide for<br />
more scientific analyses <strong>of</strong> these efforts.
RED DRUM<br />
k9"<br />
TAMPA<br />
BAY<br />
L , , , , , l , , , , , , , , , , I , . , l . " . . , l l , , , ~ l<br />
1950 1955 1960 1965 1970 1975 1980<br />
YEAR<br />
7001 SPOTTED SEATROUT<br />
1 l , , . , , , , , . , . , , , I . . I 1 l I I I ' I l , I . l I ~<br />
1950 1955 1960 1965 1970 1975 1980<br />
YEAR<br />
Figure 81. Commercial landings <strong>of</strong> red drum and spotted seatrout.
CHAPTER 5.<br />
MANAGEMENT<br />
Accounts <strong>of</strong> the decline in natural<br />
resources <strong>of</strong> <strong>Tampa</strong> <strong>Bay</strong> began about 100<br />
years ago (Heilprin 1887; Smeltz 1897).<br />
Although other such observations were made<br />
in the following decades, communities<br />
around <strong>Tampa</strong> <strong>Bay</strong> continued to grow and<br />
thrive under the seemingly 1 imi tless<br />
subsidies provided by the bay. Fisheries<br />
seemed inexhaustible (a1 though sturgeon<br />
were extirpated from the bay by 1900).<br />
<strong>The</strong> Hfllsborough River was dammed to<br />
produce electricity at a time when the<br />
impacts <strong>of</strong> instream dams were not known,<br />
and during the great residental boom a<br />
"worthless" marsh in Hi1 1 sborough <strong>Bay</strong> was<br />
filled to make the Davis Islands.<br />
Entrepreneurs created a bridge and a<br />
causeway from <strong>Tampa</strong> to Pinellas County<br />
across Old <strong>Tampa</strong> <strong>Bay</strong> in the 1920's.<br />
Congress had authorized deepening <strong>of</strong> the<br />
ship channel and <strong>Tampa</strong> port area more than<br />
once by the onset <strong>of</strong> the Depression, and<br />
the phosphate industry was using the<br />
Alafia River as a source <strong>of</strong> rock and a<br />
waste dump as early as 1929. Increased<br />
shipping activity after the war made it<br />
necessary to deepen the bay several more<br />
times, and waterfront lots were created to<br />
house the growing population. <strong>The</strong> Manatee<br />
and Braden Rivers were dammed to supply<br />
water in the south-bay area opened for<br />
growth by the new Sunshine Skyway Bridge.<br />
Power plants ringed the bay, generating<br />
electricity for phosphate mines and new<br />
communities and discharging thermal<br />
effluent in shallow waters <strong>of</strong> the bay.<br />
McKay <strong>Bay</strong> became a center for heavy<br />
shipping and industry, and overtaxed<br />
sewage systems <strong>of</strong> Bradenton, <strong>Tampa</strong>, and<br />
St. Petersburg usually overflowed during<br />
the rainy season, causing raw sewage to<br />
flow to the region's rivers and the bay.<br />
<strong>The</strong> first modern recognition <strong>of</strong> the<br />
bay's decline occurred more than 30 years<br />
ago and came from the U.S. Pub1 ic Health<br />
Service (Galtst<strong>of</strong>f 1954, pp. 564-565):<br />
Pollution <strong>of</strong> the <strong>Tampa</strong> <strong>Bay</strong><br />
drainage is caused by municipal<br />
discharges serving more than 300,000<br />
persons and by industrial waste from<br />
6 upstream phosphate mines, several<br />
citrus canneries, and miscellaneous<br />
plants.<br />
<strong>The</strong> larger cities in the<br />
resort area either do not have<br />
treatment faci 1 i ties or have<br />
inadequate ones . . . . <strong>Tampa</strong> <strong>Bay</strong><br />
is grossly polluted, and bathing<br />
waters in Clearwater Harbor and St.<br />
Joseph Sound have been affected<br />
adversely. Several large she1 1 -<br />
fishing areas are closed to the<br />
taking <strong>of</strong> shellfish because <strong>of</strong><br />
pol 1 ution.<br />
<strong>The</strong> first suggestion that controls on<br />
eutrophication and dredging impacts were<br />
needed came in 1969. <strong>The</strong> Federal Water<br />
Pollution Control Administration (1969)<br />
recommended a water qua1 i ty management<br />
plan and waste abatement program to<br />
control odor and other pol 1 ution symptoms<br />
in Hillsborough <strong>Bay</strong>, and a master plan for<br />
dredging and filling in the bay. None <strong>of</strong><br />
these important baywide management<br />
strategies have been implemented to date,<br />
although the report did lead to the<br />
provision <strong>of</strong> major federal funding for<br />
upgrading the City <strong>of</strong> <strong>Tampa</strong>'s Hookers<br />
Point sewage treatment plant from primary<br />
to advanced waste treatment capabilities.<br />
<strong>The</strong>refore, it is not surprising that no<br />
other aspect <strong>of</strong> natural resources<br />
management in <strong>Tampa</strong> <strong>Bay</strong> is addressed<br />
comprehensively, given that the 1969<br />
recommendat ions have not been imp1 emented.<br />
Concerned citizens around <strong>Tampa</strong> <strong>Bay</strong><br />
have sought bay-wide management during the<br />
past 20 years. In 1968, a conference<br />
sponsored by the University <strong>of</strong> South
<strong>Florida</strong> recommended that present bay<br />
bottom area or mean bay dimensions below<br />
mean high water should not be reduced, and<br />
present bay bottom should not be modified<br />
except for navigation channels. <strong>The</strong> group<br />
a1 so recommended 1 imi ts to municipal<br />
wastewater discharges and establishment <strong>of</strong><br />
a bay-wide management committee<br />
(University <strong>of</strong> South <strong>Florida</strong> 1970). No<br />
action was taken regarding the first<br />
conclusion but a local act <strong>of</strong> the <strong>Florida</strong><br />
Legislature did implement stringent 1 imits<br />
on sewage treatment plant effluents which<br />
were maintained for a decade but have<br />
since been relaxed. Another local act<br />
actually created a <strong>Tampa</strong> <strong>Bay</strong> Conservation<br />
and Development Commission in 1970 (Chap.<br />
70-524 <strong>Florida</strong> Statutes). Unfortunately,<br />
the Commission never met.<br />
In 1982, the first scientific<br />
symposium on <strong>Tampa</strong> <strong>Bay</strong> was held at the<br />
University <strong>of</strong> South <strong>Florida</strong>. <strong>The</strong> 4- day<br />
conference involved topical presentations<br />
by 50 invited speakers (Treat et al.<br />
1985). <strong>The</strong>y concluded that (1) <strong>Tampa</strong> <strong>Bay</strong><br />
can be comprehended as a single ecological<br />
system; (2) the bay is immensely resistant<br />
to environmental challenges, when impacts<br />
are removed; (3) a clear pattern <strong>of</strong><br />
decline is evident in some measures <strong>of</strong><br />
ecological condition; and (4) the<br />
management needs <strong>of</strong> <strong>Tampa</strong> <strong>Bay</strong> are<br />
relatively clear, and if implemented in a<br />
comprehensive and bay-wide manner, would<br />
result in tangible improvements to the bay<br />
and its usefulness to people.<br />
That same year the <strong>Tampa</strong> <strong>Bay</strong> Regional<br />
Pl anni ng Counci 1 establ i shed the <strong>Tampa</strong> <strong>Bay</strong><br />
Study Committee to identify and verify bay<br />
management issues. After 19 months <strong>of</strong><br />
work, the Committee reported on a total <strong>of</strong><br />
42 problems and issues (Table 24). <strong>The</strong><br />
Table 24. Resource management issues in <strong>Tampa</strong> <strong>Bay</strong> (modified from TBRPC 1983).<br />
Rank<br />
Issue<br />
1. Lack <strong>of</strong> funding for bay management projects.<br />
2. Loss <strong>of</strong> seagrass meadows<br />
3. Nonpoint discharge entering the bay.<br />
4. Lack <strong>of</strong> baywide management plan for dredging, spoiling, and spoil<br />
i sl and maintenance.<br />
5. Hazardous waste disposal management.<br />
6. Inadequate enforcement <strong>of</strong> existing environmental regulations.<br />
7. Septage wastes.<br />
8. Need for management <strong>of</strong> aquatic preserves in bay.<br />
9. Need for seagrass and mangrove habitat creation.<br />
10. Limiting municipal and industrial discharges.<br />
11. Ineffective wetlands regulation.<br />
12. Need for ecosystem level <strong>of</strong> management for rivers and tidal creek<br />
systems.<br />
(continued)
Rank<br />
Table 24. Continued.<br />
Issue<br />
. .-<br />
13. Inadequate predictions <strong>of</strong> bay" ability to assimilate wastes.<br />
14. lack <strong>of</strong> knowledge on sire <strong>of</strong> fishery stocks and relative impact <strong>of</strong><br />
power plants, Fishing pressure, and other stresses.<br />
15. Need far perpetual maintenance <strong>of</strong> hazardous material dump at a<br />
phosphate processing pl ant on bay shore1 ine.<br />
16. Effective and fair requlation <strong>of</strong> sport and comrriercial fishiny.<br />
17. Documenting the economic importance <strong>of</strong> <strong>Tampa</strong> <strong>Bay</strong>.<br />
18. Educating an ecologically uninformed public to the value <strong>of</strong> a h~althy<br />
bay.<br />
19. Provision <strong>of</strong> public access to bay and giving priority in shor~linc<br />
development to watcr-cfcpcndct'lt rises.<br />
20. Providing load relicf for overburdened sewage treatment Facilities.<br />
21. Improving water qua1 i ly whcre rec-roational user are pr~sentl y<br />
prohibited.<br />
22. Establishing guidelines for starinwater controls in redevelopment <strong>of</strong><br />
urban areas.<br />
23. C1 irninat ion <strong>of</strong> cfupl icat ion dnd gaps in cnv i ronacntal rule5 and<br />
regtr 1 at ions .<br />
24. Dcvelapnlcnt crf d rccutrrce ~nanaqcnrent plan for McKdy <strong>Bay</strong>.<br />
25, Classifying all bay watprs for shellfish sanitation and improviny<br />
canditions in prrsently closed areas.<br />
25. Determining the oxt~nt <strong>of</strong>, and controlling as necessary. destruction<br />
<strong>of</strong> Idrval and juvenile f rshcs entrained by power plants.<br />
27. Rehabil itntion <strong>of</strong> lit tlc R~dfish Creek.<br />
28. Oevelaping a rradincss plan for pub1 .ic acqtiisi tion <strong>of</strong> vulncr'dble<br />
private lands along t hcl shore1 ine fol lowing exlenzive hurricane<br />
damage.<br />
29, Developing a mibiydtion bdnk so thdt impacts can be <strong>of</strong>fsclt rat tirr Chdn<br />
ignored (by agencles) or qui~tly acceptod (by pub1 ic).<br />
30. Providing for managerner~t o f natclrai shore ines in upper Q7d <strong>Tampa</strong> Uay.<br />
31. Securtng con~putent managcment for the Passdge Key <strong>National</strong> Mi Id1 2 te<br />
Refuge.
Table 24. Concluded.<br />
Rank<br />
Issue<br />
32. Rehabilitating Boca Ciega <strong>Bay</strong>.<br />
33. Developing management systems for urban waterfronts.<br />
34. Restoring tidal portions <strong>of</strong> "Channel A," a major human-made<br />
drainageway emptying into upper Old <strong>Tampa</strong> <strong>Bay</strong>.<br />
35. Improving localized water quality problems through the use <strong>of</strong> one-way<br />
gates, tidal pumps, and other passive systems.<br />
36. Reconciling conflicts among user groups in the bay area.<br />
37. Need for a proactive, environmentally sound and imp1 ementabl e marina<br />
siting pol icy.<br />
38. & 39. Environmental concerns associated with bridge construction.<br />
40. Provision <strong>of</strong> launching sites for sailboats.<br />
41. Odor.<br />
42. Preventing cumulative water qua1 ity problems in the Manatee River due<br />
to relict, existing, and proposed bridge crossings.<br />
issues may be grouped into categories <strong>of</strong><br />
eutrophication, dredge and fill, habitat<br />
management, contaminants, fisheries,<br />
development and recreation, and<br />
regul ati on. In 1984, the <strong>Florida</strong><br />
Legislature established the <strong>Tampa</strong> <strong>Bay</strong><br />
Management Study Commission to identify<br />
specific methods to remedy each <strong>of</strong> the<br />
issues. This commission recommended that<br />
a coordinating body be establ i shed within<br />
the <strong>Tampa</strong> <strong>Bay</strong> Regional Planning Council,<br />
to be named the Agency on <strong>Bay</strong> Management.<br />
Following the submittal <strong>of</strong> the<br />
Commission's report in 1985 (<strong>Tampa</strong> <strong>Bay</strong><br />
Regional Pl anning Counci 1 1985), the<br />
Agency was establ i shed. <strong>The</strong> Agency serves<br />
a planning and coordinating role for other<br />
bay managers. In addition, the Agency is<br />
attempting to oversee the implementation<br />
<strong>of</strong> remedies to problems identified in<br />
previous studies.<br />
Nearly six million dollars worth <strong>of</strong><br />
studies and new programs have been<br />
suggested, including a comprehensive<br />
fisheries research, monitoring and<br />
regul ation program ($1,067,000) ; the<br />
completion and refinement <strong>of</strong> the <strong>Tampa</strong> <strong>Bay</strong><br />
wasteload allocation study ($1,000,000);<br />
comprehensive seagrass monitoring,<br />
research and restoration ($825,000); the<br />
establishment <strong>of</strong> a shellfish sanitary<br />
survey team in the <strong>Tampa</strong> <strong>Bay</strong> area<br />
($600,000); permanent management staffing<br />
<strong>of</strong> the three <strong>Tampa</strong> <strong>Bay</strong> area aquatic<br />
preserves ($550,000); a study <strong>of</strong> toxic<br />
contamination in the <strong>Tampa</strong> <strong>Bay</strong> estuary<br />
($500,000); a regional pub1 ic education<br />
campaign regarding non-point sources and<br />
water pollution in <strong>Tampa</strong> <strong>Bay</strong> ($400,000);<br />
and increased compliance monitoring <strong>of</strong><br />
point source discharges into <strong>Tampa</strong> <strong>Bay</strong><br />
($270,000). None <strong>of</strong> these recommended<br />
studies has been funded and the 45-member<br />
Agency on <strong>Bay</strong> Management is currently<br />
hampered by a lack <strong>of</strong> stable funding, the<br />
absence <strong>of</strong> any full-time staff, and the<br />
1 ack <strong>of</strong> regulatory "teeth.<br />
In addition to these recommended<br />
expenditures and general pol i cies<br />
regarding <strong>Tampa</strong> <strong>Bay</strong>, the Commission
ecommended and the Agency is supporting a<br />
number <strong>of</strong> other legislative action;.<br />
<strong>The</strong>se included the foll owing :<br />
(1) requiring saltwater recreational<br />
fishing licenses;<br />
(2) consol idating and standardizing all<br />
local fishing 1 aws and regulations;<br />
(3) requiring existing development to<br />
retr<strong>of</strong>it stormwater discharge<br />
facilities when redevelopment occurs;<br />
(4) preventing the dredging or spoil ing<br />
<strong>of</strong> any significant areas <strong>of</strong><br />
previously undisturbed bay bottom;<br />
(5) requiring developers to purchase<br />
sewage treatment capacity rights and<br />
prohibiting the issuance <strong>of</strong> an<br />
interceptor permit unless the<br />
municipality can demonstrate adequate<br />
sewage treatment capacity ;<br />
(6) requiring advanced wastewater<br />
treatment <strong>of</strong> a1 1 municipal discharges<br />
to <strong>Tampa</strong> <strong>Bay</strong>, prior to the completion<br />
<strong>of</strong> the waste1 oad a1 1 ocati on study;<br />
(7) creating an Aquatic Preserve<br />
Management Trust Fund derived from<br />
submerged land lease fees; and<br />
(8) creation <strong>of</strong> a <strong>Tampa</strong> <strong>Bay</strong> habitat<br />
mi tigation bank.<br />
In its closing remarks, the <strong>Tampa</strong> <strong>Bay</strong><br />
Regional PI anning Counci 1 (1985) stated:<br />
It is recognized that the ultimate<br />
success <strong>of</strong> the recommended Agency on<br />
<strong>Bay</strong> Management within the <strong>Tampa</strong> <strong>Bay</strong><br />
Regional Planning Council will be<br />
dependent upon the overall<br />
strengthening <strong>of</strong> state growth<br />
management legislation.<br />
In the absence <strong>of</strong> significant<br />
strengthening <strong>of</strong> state growth<br />
management 1 egi sl at ion in the near<br />
future, the <strong>Tampa</strong> <strong>Bay</strong> Management<br />
Study Commission recommends that the<br />
Legislature initiate the development<br />
<strong>of</strong> enabling legislation for the<br />
establishment <strong>of</strong> a <strong>Tampa</strong> <strong>Bay</strong><br />
Management Authority . . . .<br />
Political arguments against the<br />
establishment <strong>of</strong> a <strong>Tampa</strong> <strong>Bay</strong> management<br />
authority with regulatory powers, however,<br />
remain quite strong. Many powerful<br />
interests around the bay view the proposal<br />
as add! ng "another 1 ayer <strong>of</strong> bureaucracy"<br />
to an already complex and sluggish<br />
environmental permitting system. It is<br />
for this reason that the <strong>Tampa</strong> <strong>Bay</strong><br />
Management Study Commission decided<br />
against the recommendation <strong>of</strong> establ ishing<br />
an empowered bay management authority ,<br />
even though the majority <strong>of</strong> members felt<br />
that in the long term, this alternative<br />
would be needed to effectively accompl i sh<br />
all stated bay management goals and<br />
objectives.<br />
<strong>The</strong> final form and effect <strong>of</strong> bay<br />
management strategies remains unsettled,<br />
but at least attempts have begun. More<br />
importantly, the si te-specific and<br />
process-specific issues have been<br />
identified, and their remedies are being<br />
pursued by the Agency on <strong>Bay</strong> Management.<br />
<strong>The</strong> following sections out1 ine what<br />
resource managers or scientists new to the<br />
region should be told are the most<br />
important management issues re1 ated to<br />
<strong>Tampa</strong> <strong>Bay</strong>. Whether the Agency will be<br />
able to have a measurable impact on the<br />
major problem areas remains to be seen. A<br />
stable funding source and some permanent<br />
full-time staff are essential to even<br />
begin to seek real results. As <strong>of</strong> this<br />
writing, support has not been provided to<br />
the Agency.<br />
5.2 IMPORTANT MANAGEMENT ISSUES<br />
5.2.1 Dredqe and Fill<br />
As noted in Section 2.4.1, the total<br />
surface area <strong>of</strong> the ay has been reduced<br />
by 3.6% (33.67 km B ) because <strong>of</strong> the<br />
dredging <strong>of</strong> navigation channels and the<br />
filling <strong>of</strong> shallow intertidal or deeper<br />
open-water areas for power generation<br />
sites, residential, port, or<br />
transportation development. If all this<br />
fill ed land was concentrated in one place,<br />
it would constitute an area the size <strong>of</strong><br />
all the Interbay Peninsula south <strong>of</strong><br />
Ballast Point, including all <strong>of</strong> MacDill<br />
Air Force Base and surrounding submerged<br />
land out to the 2-m depth contour (Figure<br />
82). Although this 3.6% reduction does<br />
not seem large, nor does it approach the<br />
65% reduction in the size <strong>of</strong> San Francisco<br />
<strong>Bay</strong> (Ode11 1972; Nichols et a1 . 19861, the<br />
dredge and fill activities in <strong>Tampa</strong> <strong>Bay</strong><br />
were concentrated in areas <strong>of</strong> mangrove<br />
forest, tidal marsh, and seagrass meadows<br />
on the estuarine shelf <strong>of</strong> the bay. This
<strong>The</strong> last major dredge and fill project in<br />
the bay was the <strong>Tampa</strong> Harbor Deepening<br />
Project, which involved the dredging <strong>of</strong><br />
over 55,000,000 m3 <strong>of</strong> material to deepen<br />
(from 10 to 13 m) and widen the main ship<br />
channel, and included the creation <strong>of</strong> two<br />
large (total 445 ha) diked disposal<br />
islands (Lewis 1977; Fehring 1983, 1985).<br />
<strong>The</strong>se islands were specifically located<br />
away from sensitive shallow water habitats<br />
because <strong>of</strong> economic concerns, but it is<br />
unl i kely that any future disposal is1 ands<br />
wi 11 be constructed because <strong>of</strong><br />
environmental concerns. A considerable<br />
amount <strong>of</strong> controversy surrounded this<br />
project, particularly with regard to<br />
inflexible policies <strong>of</strong> the U.S. Army Corps<br />
<strong>of</strong> Engineers and the <strong>Tampa</strong> Port Authority<br />
with regard to disposal a1 ternatives,<br />
monitoring, and compliance with<br />
environmental regul at ions.<br />
Figure 82. If all the submerged lands dredged and<br />
filled in <strong>Tampa</strong> <strong>Bay</strong> since t88Q were collected in one<br />
place, the area would equal all <strong>of</strong> the lnterbay Peninsula<br />
south <strong>of</strong> Ballast Point, and surrounding shallow<br />
waters above a depth <strong>of</strong> 2 meters.<br />
concentration resulted in the filling or<br />
excavation <strong>of</strong> 44% <strong>of</strong> the bay's marsh and<br />
mangrove habitat (Lewis 1977) and<br />
contributed, through direct excavation or<br />
burial and increased water turbidity, to<br />
the loss <strong>of</strong> 81% <strong>of</strong> the bay's<br />
seagrasses<br />
(Lewis et a1 . 1985a) . Goodwin (1984)<br />
attributed about 11% <strong>of</strong> the alterations to<br />
causeways, 15% each to residential and<br />
commercial development, and 60% to port<br />
devel opment including channel s, f i 11 ed<br />
sites, and dredged material (spoil)<br />
disposal sites.<br />
Because <strong>of</strong> scientific documentation<br />
in the early 1970's <strong>of</strong> the value <strong>of</strong> tidal<br />
wetlands as wild1 ife and fisheries<br />
habitat, the type <strong>of</strong> dredge and fill<br />
projects which routinely were permitted by<br />
regulatory agencies in the 1950's and<br />
1960's no longer are permitted, and any<br />
proposed project undergoes close scrutiny.<br />
As Fehring (1983, 1985) and the <strong>Tampa</strong><br />
<strong>Bay</strong> Regional Planning Council (1985)<br />
noted, the future problems associated with<br />
dredge and fill work in <strong>Tampa</strong> <strong>Bay</strong> will<br />
rev01 ve around developing a long-term<br />
navigation channel maintenance dredging<br />
and disposal program, combined with a<br />
wetlands mitigation and restoration<br />
program for the bay.<br />
Approximate1 y 841,000 m3 <strong>of</strong> channel<br />
and berth maintenance material needs to be<br />
dredged annually from the main ship<br />
channel and the Port <strong>of</strong> <strong>Tampa</strong>. Additional<br />
unknown amounts will need removal from<br />
<strong>Bay</strong>boro Harbor and Port Manatee (<strong>Tampa</strong> <strong>Bay</strong><br />
Regional Planning Council 1985).<br />
Considerable controversy has arisen over<br />
disposal sites for this material. A<br />
designated <strong>of</strong>fshore disposal area 33 km<br />
<strong>of</strong>f the mouth <strong>of</strong> the bay in the Gulf <strong>of</strong><br />
Mexico is under consideration for disposal<br />
<strong>of</strong> maintenance material. <strong>The</strong> two diked<br />
disposal islands in Hi1 1 sborough <strong>Bay</strong> also<br />
are scheduled for use for disposal <strong>of</strong><br />
finer-grained material from that part <strong>of</strong><br />
the harbor. <strong>The</strong> <strong>Tampa</strong> <strong>Bay</strong> Management<br />
Study Commission supported the use <strong>of</strong> some<br />
<strong>of</strong> the better (larger grain size) dredged<br />
material for marsh creation in<br />
Hi 11 sborough <strong>Bay</strong> (<strong>Tampa</strong> <strong>Bay</strong> Regional<br />
PI anning Council 1985). Unfortunate1 y, no<br />
significant progress has been made towards<br />
imp1 ernenting a bay-wide dredged materi a1<br />
disposal program, and disagreements and
delays will 1 ikely result when dredging is typical smooth cordgrass marsh creation<br />
needed again .<br />
project.<br />
Mitigation, or the reduction or<br />
el imination <strong>of</strong> negative environmental<br />
impacts, has been a commonly required<br />
action by regulatory agencies as part <strong>of</strong><br />
their permitting process in <strong>Tampa</strong> <strong>Bay</strong>.<br />
Lewis et al. (1979), Fehring (1983) and<br />
H<strong>of</strong>fman et al. (1985) discussed a number<br />
<strong>of</strong> mi tigation projects related to dredging<br />
and filling. Most included planting or<br />
transplanting wetland vegetation onto<br />
dredged material i sl ands, grading <strong>of</strong><br />
upland sites to wetland elevations, or<br />
restoration <strong>of</strong> sites following temporary<br />
fill placement. Figure 83 illustrates a<br />
H<strong>of</strong>fman et al. (1985) listed 16<br />
intertidal mi tigation or restoration<br />
projects and 10 subtidal seagrass<br />
restoration attempts in the bay through<br />
1982. Now there are probably three times<br />
as many intertidal plantings. Few<br />
additional seagrass pl anti ngs have been<br />
attempted.<br />
H<strong>of</strong>fman et al. (1985) noted that both<br />
the success <strong>of</strong> plantings and the qua1 ity<br />
<strong>of</strong> the restored or created habitat vary<br />
widely. <strong>The</strong> most beneficial plantings in<br />
terms <strong>of</strong> habitat value appear to be<br />
Figure 83. Tidal marsh creation on <strong>Tampa</strong> <strong>Bay</strong>. A, Completed site excavation (April 1978); B, Six months later<br />
(October 1978); C, One year later (April 1979); D, Nineteen months later (November 19791.
"1 arger continuous pl antings which are<br />
remote from human interference" (p. 649).<br />
Fehring (1983) discussed the possible<br />
value <strong>of</strong> mitigation "banking" in dredge<br />
and fill projects where a centralized<br />
mitigation plan based upon the best<br />
scientific understanding <strong>of</strong> the estuary in<br />
question, combined with estuary-specific<br />
resource management goal s, could a1 1 ow<br />
larger, more controlled areas to be<br />
designated as mitigation sites. This<br />
would permit more economical use <strong>of</strong><br />
limited funds, since the per hectare cost<br />
<strong>of</strong> mitigation declines with increasing<br />
size <strong>of</strong> the project. It would also ensure<br />
success <strong>of</strong> the mitigation project, since<br />
the work could be done and approved prior<br />
to the filling <strong>of</strong> the wetland under<br />
examination in the permit process, <strong>The</strong>re<br />
is presently no provision for mitigation<br />
banking in <strong>Florida</strong>, but the adoption <strong>of</strong><br />
rules governing the mi tigation process is<br />
pending, and the opportunity to develop<br />
such a system may lead to its use in <strong>Tampa</strong><br />
<strong>Bay</strong>.<br />
5.2.2 Fisheries<br />
ODES TO BIVALVES<br />
Oysters growing on trees! . . . by the by,<br />
the lower bay is the finest oyster-ground<br />
on the continent . . . . I have not<br />
eaten such oysters anywhere.<br />
--George A. McCall, 1824<br />
<strong>The</strong> oysters are caught in the bay and are<br />
1 arger and finer than any I ever saw.<br />
--Clement Clairborne Clay, 1851<br />
used to be. Harvests <strong>of</strong> oysters from the<br />
bay were second only to those <strong>of</strong> the<br />
still -productive Apal achicola <strong>Bay</strong> for most<br />
<strong>of</strong> the 19th century. In 1942, 60,500 1 <strong>of</strong><br />
oyster meat were landed in Pinellas<br />
County; in 1951 1,877 1, but by 1970 the<br />
industry was gone. <strong>The</strong> last commercial<br />
harvest <strong>of</strong> scallops from the bay<br />
apparently occurred in 1960 with 5,800 1<br />
reported, most not. from the bay but from<br />
the St. Joseph's Sound area north <strong>of</strong><br />
Cl earwater. <strong>Bay</strong> scall op harvests from<br />
Manatee and Hi 11 borough Counties<br />
collapsed in 1952.<br />
<strong>Tampa</strong> <strong>Bay</strong> commercial finfish landings<br />
peaked in 1964 when a total <strong>of</strong> more than<br />
8,000,000 ki 1 ograms were 1 anded (Figure<br />
84; Lombardo and Lewis 1985). Since then,<br />
there has been a steady decline with<br />
current harvest levels at about 5 mill ion<br />
kilograms per year. Several <strong>of</strong> the<br />
sought-after species such as spotted<br />
seatrout (Cynoscion nebulosus) and red<br />
drum (Sciaenops ocellatus) show signs <strong>of</strong><br />
much 1 ower avai l abil i ty to commerci a1<br />
fishermen than landing data indicate for<br />
Charlotte Harbor, a smaller but healthier<br />
estuary south <strong>of</strong> <strong>Tampa</strong> <strong>Bay</strong> (Figure 81).<br />
17<br />
16<br />
,",<br />
Finfish<br />
\<br />
\<br />
Ate Rocky Point oysters for two days.<br />
--Diary <strong>of</strong> Henry Metcalf, February 17,<br />
1885<br />
<strong>Tampa</strong> <strong>Bay</strong> oysters are fine and sell for<br />
one dollar a barrel at the wharf.<br />
--<strong>Tampa</strong> Tribune, March 9, 1887<br />
<strong>Tampa</strong> <strong>Bay</strong>, once a glory <strong>of</strong> the state, is<br />
filth. It's a mess. <strong>The</strong>re will never be<br />
an oyster in <strong>Tampa</strong> <strong>Bay</strong> again.<br />
--Sports Illustrated, 1981<br />
(Mormino and Pizzo 1983)<br />
Sports Illustrated's observation that<br />
"there will never be an oyster in <strong>Tampa</strong><br />
<strong>Bay</strong>" is a bit exaggerated, but fishery<br />
harvests from the bay are not what they<br />
YEAR<br />
Figure 84. Tmpa <strong>Bay</strong> commercial shellfish and<br />
finfish landings.
Shellfish landings peaked in 1956<br />
with almost 9,000,000 kilograms reported.<br />
Significant decl ines in reported landings<br />
have occurred since then with a low <strong>of</strong><br />
900,000 kilograms in 1971 (Figure 84).<br />
Recent increases in landings are largely<br />
from the <strong>of</strong>fshore fishery for calico<br />
scal 1 ops (Arqo~ecten qi bbus) , not from<br />
increased estuarine harvests.<br />
None <strong>of</strong> these data document the<br />
reported decl ines in recreational fishery<br />
harvest from the bay, because data are not<br />
collected systematically on this fishery.<br />
A four-part newspaper series on "Fishing<br />
<strong>Tampa</strong> <strong>Bay</strong>" published in February 1985,<br />
contained these typical comments:<br />
Most <strong>of</strong> the shrimp, crabs, and<br />
manatees are gone, crowded out by<br />
shore1 i ne devel opment , canal<br />
dredging, pesticide and nutrient-rich<br />
stormwater run<strong>of</strong>f, and municipal<br />
sewage.<br />
Fish are still available,<br />
but they are not as abundant as they<br />
once were . . . "Mark my word" he<br />
said, "unless the water is cleaned,<br />
pollution stopped and bag limits set<br />
for recreational and commerci a1<br />
catches, fishing will be mostly a<br />
thing <strong>of</strong> the past by the year 2000 "<br />
(Keefer 1985).<br />
More accurate documentation <strong>of</strong> trends<br />
in the recreational harvest is needed, but<br />
it is generally agreed that the trend is<br />
not upward. A proposed $7.00 statewide<br />
resident recreational fishing 1 icense<br />
would go a long way toward providing<br />
funding for better documentation and<br />
necessary research and habitat management<br />
and restoration.<br />
5.2.3 Freshwater Flow to the <strong>Bay</strong><br />
<strong>The</strong> importance <strong>of</strong> freshwater flow<br />
into the bay <strong>of</strong>ten is overlooked. More<br />
than 60 years <strong>of</strong> marine research (Gunter<br />
1961, 1967) have shown conclusively that<br />
low-salinity estuarine water combined with<br />
the physical protection and energy sources<br />
suppl ied by marine plants, constitutes the<br />
primary nursery habitat for most <strong>of</strong> the<br />
commercially and recreational ly important<br />
fish and shellffsh species in the Gulf <strong>of</strong><br />
Mexico, Despite this understanding, it is<br />
a common misconception <strong>of</strong> the average<br />
citizen and politician that freshwater<br />
discharged to the bay is "wasted" and<br />
should be diverted for industrial,<br />
agricultural , or domestic use.<br />
With the population <strong>of</strong> the <strong>Tampa</strong> <strong>Bay</strong><br />
area at 1.7 million in 1985 and projected<br />
to reach 2.5 million by the end <strong>of</strong> the<br />
century, pub1 ic demand for increased<br />
diversion <strong>of</strong> freshwater is increasing.<br />
Already, routine water shortages occur<br />
every summer before the onset <strong>of</strong> the rainy<br />
season in June.<br />
<strong>The</strong> words <strong>of</strong> Gunter (1961),<br />
therefore, need to be strongly<br />
re-emphasized:<br />
A number <strong>of</strong> workers on the Gulf<br />
coast have demonstrated that a great<br />
many <strong>of</strong> the important marine animal s<br />
<strong>of</strong> that area have similar 1 ife<br />
hi stories. <strong>The</strong> adults spawn <strong>of</strong>fshore<br />
and the young move back into the<br />
estuaries where they grow up in<br />
low-salinity waters; after a time<br />
they return to the sea and the larger<br />
adults <strong>of</strong> many species are found only<br />
in the sea.<br />
<strong>The</strong> preponderant macroorganisms,<br />
both in numbers <strong>of</strong> species<br />
and individuals, are mostly motile<br />
species which undergo the general<br />
type <strong>of</strong> life history described above.<br />
In southern waters these are the<br />
mu1 1 et, menhaden, croakers, shrimp<br />
and crabs. Vast numbers <strong>of</strong> these<br />
animals may be found in estuaries at<br />
one time or another and in genera1<br />
the very smallest sizes are found in<br />
the lower salinities. Estuaries are<br />
predominantly nursery grounds.<br />
As discuised in Section 3.13,<br />
Finucane (1966) and Sykes and Finucane<br />
(1966) reported that 23 species <strong>of</strong> fish<br />
and shellfish <strong>of</strong> major importance in Gulf<br />
<strong>of</strong> Mexico commercial fisheries util ize<br />
<strong>Tampa</strong> <strong>Bay</strong> as a nursery area. <strong>The</strong>se<br />
include pink shrimp, blue crabs, oysters,<br />
menhaden, Spanish mackerel, mullet,<br />
spotted seatrout, and red drum. If the<br />
fish species important as food items for<br />
these commercial species and species<br />
important to the recreational fishermen,<br />
such as snook and tarpon, are included,<br />
the list <strong>of</strong> fish species utilizing <strong>Tampa</strong><br />
<strong>Bay</strong> as a nursery area totals 80 (Table
22). Inclusion <strong>of</strong> prey species wotrld<br />
boost the total even more.<br />
In comparing various parts <strong>of</strong> the<br />
bay, Sykes and Finucane (1966) noted<br />
that portions <strong>of</strong> the bay with the lowest<br />
salinities and the necessary marine<br />
wetl ands provided the best nursery habitat<br />
(Old <strong>Tampa</strong> <strong>Bay</strong>). A similar area with<br />
reduced salinities but without significant<br />
marine wetl ands (Hi 11 sborough <strong>Bay</strong>) no<br />
longer was a productive nursery area.<br />
<strong>The</strong>se observations emphasize the<br />
importance <strong>of</strong> marine wetland habitat<br />
restoration in low-sal ini ty areas such as<br />
Hi 11 sborough <strong>Bay</strong> to increase nursery<br />
habitat.<br />
Another major point is that<br />
freshwater must be allowed to naturally<br />
enter the bay in quantities necessary to<br />
lower sal inities within vegetated<br />
habitats, not just a lower salinity<br />
anywhere. <strong>The</strong>se critical vegetated areas<br />
and adjacent water areas need to be<br />
identified and mapped in order to be<br />
protected.<br />
This issue needs immediate attention.<br />
We hypothesize that the tidal brackish to<br />
tidal freshwater marshes dominated by<br />
Slack need1 erush mixed with freshwater<br />
plants, located in the upper portions <strong>of</strong><br />
tidal creeks and streams such as Double<br />
Branch Creek and the Alafia, Little<br />
Manatee, Manatee and Braden Rivers,<br />
ultimately will be identified as some <strong>of</strong><br />
this critical nursery habitat. Gilmore et<br />
al. (1983), for example, identified<br />
peripheral tidal freshwater streams<br />
draining into salt marshes as the prime<br />
nursery habitat for snook in the Indian<br />
River. During their study, 692 juvenile<br />
snook with a mean standard length <strong>of</strong> 27.5<br />
mm were collected from such habitats. <strong>The</strong><br />
fresh to brackish water mosquito fish<br />
(Gambusia affinis) was the most important<br />
identifiable food item in the gut contents<br />
<strong>of</strong> juvenile snook 40 to 60 days old<br />
collected during that study. We predict<br />
similar results in <strong>Tampa</strong> <strong>Bay</strong>. A study <strong>of</strong><br />
juvenile snook nursery habitats is<br />
presently being conducted by the <strong>Florida</strong><br />
Department <strong>of</strong> Natural Resources and Mote<br />
Marine Laboratory.<br />
underway for redfish,<br />
3.13.<br />
Similar studies are<br />
as noted in Section<br />
With such a wealth <strong>of</strong> available<br />
information, we urge that plans to divert<br />
additional flows <strong>of</strong> freshwater away from<br />
the bay receive careful biological study.<br />
Unfortunately this is not the case, as<br />
illustrated by the recent request <strong>of</strong><br />
Manatee County to increase its current 100<br />
million l/day withdrawal from the<br />
headwaters <strong>of</strong> the Manatee River (Lake<br />
Manatee) by 25%. <strong>The</strong> request was examined<br />
by the Southwest <strong>Florida</strong> Water Management<br />
District which is responsible for<br />
regulating water resources in the <strong>Tampa</strong><br />
<strong>Bay</strong> watershed. <strong>The</strong> District is legally<br />
capable <strong>of</strong> considering estuarine impacts<br />
<strong>of</strong> tributary alterat.ions and has taken the<br />
lead in planning and research on the<br />
subject. In this case, however, in<br />
establishing a "minimum flow" needed to<br />
the estuary, the District required no<br />
identification <strong>of</strong> impact from historical<br />
withdrawals on the estuarine nursery<br />
function <strong>of</strong> the freshwater tidal streams,<br />
and only asked that studies be done to<br />
establish that no significant change occur<br />
from existing conditions (e.g., 100<br />
million llday). <strong>The</strong>se studies looked at<br />
exi sting water qual i ty and pl ant community<br />
distribution, but did not examine any<br />
biological factors related to the estuarine<br />
nursery habitat role that the mapped<br />
vegetation might be providing (Mjnatee<br />
County Utilities Dept., 1984). Addition-<br />
al wi thdrawl s were permi tted, and undocumented<br />
changes may have occurred. Another<br />
nearby project, expansion <strong>of</strong> Braden<br />
River reservoir and increased withdrawal,<br />
was permitted without the benefit <strong>of</strong> any<br />
estuarine study, whatsoever.<br />
Such site-specific decision-making<br />
must cease if the efforts to improve<br />
commercial and recreational fishing in<br />
lampa <strong>Bay</strong> through regulation <strong>of</strong> the<br />
fishermen are not to be <strong>of</strong>fset by subtle<br />
and not-so-subtl e habitat modification.<br />
Optimum flows for all the tributaries to<br />
<strong>Tampa</strong> <strong>Bay</strong> need to be established based<br />
upon studies <strong>of</strong> the biology CIS well as the<br />
water qual i ty <strong>of</strong> these systems.<br />
Particular emphasis should be placed on<br />
salinity patterns in tidal areas, In<br />
addition, sewage effluent reuse needs to<br />
be increased to reduce the demand for new<br />
potable water sources. Much potable wdter<br />
is truly "wasted" on lawn irrigation, when<br />
recycled effluent would be a much better<br />
source <strong>of</strong> such water.
Eutrophication is defined as the<br />
process <strong>of</strong> increasing dissolved nutrient<br />
concentrations to a point where nutrient<br />
enrichment produces certain characteristic<br />
responses in a water body. <strong>The</strong>se<br />
responses i ncl ude a1 gal blooms, noxious<br />
odors, declines in dissolved oxygen, and<br />
periodic fish kills. Such characteristic<br />
responses had been observed in <strong>Tampa</strong> <strong>Bay</strong>,<br />
particularly Hi 11 sborough <strong>Bay</strong>, for 20<br />
years prior to the Federal Water Pollution<br />
Control Administration (1969) study <strong>of</strong> the<br />
problem and documentation <strong>of</strong> nutrient<br />
enrichment from partially treated sewage<br />
discharges as the primary cause.<br />
Subsequently, over $100 million was<br />
spent to upgrade the Hookers Point sewage<br />
treatment facility from primary to<br />
advanced or tertiary treatment (Garrity et<br />
a1 . 1985). <strong>The</strong> upgraded plant came on 1 i ne<br />
in 1979. After that, other studies done<br />
by the <strong>Florida</strong> Department <strong>of</strong> Environmental<br />
Regulation, McClel land (1984), the U.S.<br />
Geological Survey, and the City <strong>of</strong> <strong>Tampa</strong><br />
(Giovanell i and Murdoch 1985) concl uded<br />
that urban run<strong>of</strong>f from streets and parking<br />
lots could contribute up to 25% <strong>of</strong> the<br />
biochemical oxygen demand, 35% <strong>of</strong> the<br />
suspended solids, and 15% <strong>of</strong> the nitrogen<br />
loading to Hillsborough <strong>Bay</strong> (Table 25).<br />
An additional aspect to the problem<br />
was added by Fanning and Bell (1985) when<br />
they suggested that nutrient fluxes from<br />
the bay's sediments could be important as<br />
sources <strong>of</strong> nutrients to the water column.<br />
Table 26 (from their paper) illustrated<br />
that ammonia (NH3) in <strong>Tampa</strong> <strong>Bay</strong> reached<br />
values higher than those found in other<br />
studied estuaries. In addition, the ratio<br />
<strong>of</strong> ammonia to total inorganic nitrogen<br />
(NO - t NO2- t NH3) was quite high<br />
(0.84t0.12) as noted in Section 2.5.3.<br />
A1 though dec 1 i nes in phosphorus<br />
concentrations have been documented for<br />
Table 25. Estimated short term pollutant loadings to Hillsborough <strong>Bay</strong> by source (from Giovanelli<br />
and Murdoch 1985).<br />
Percent <strong>of</strong> short-term pollution load by source:<br />
Load Biochemical Suspended Total Total<br />
source oxygen demand sol ids n i trogen phosphorus<br />
URBAN RUNOFFa<br />
Dry season 2 5<br />
Wet season 15<br />
RIVER FLOWS~<br />
Dry season 45<br />
Wet season 7 0<br />
POINT SOURCESC<br />
Dry season 30<br />
Wet season 15<br />
:urban run<strong>of</strong>f represents pol uti on 1 oads from the adjacent urban areas.<br />
River flows represent pollution loads from the Hillsborough, Alafia, and<br />
Palm Rivers.<br />
C<br />
Point sources represent those discharging directly to Hi 11 sborough <strong>Bay</strong>.
Table 26. Concentrations (pm0l) <strong>of</strong> nutrient nitrogen in <strong>Tampa</strong> <strong>Bay</strong> and other estuaries<br />
(adapted from Fanning and Bell 1985).<br />
Area (N03-)+(N02-) (NH3) NH3: (NO3- )+(NOz-)+(NH3)<br />
West <strong>Florida</strong> coast<br />
<strong>Tampa</strong> <strong>Bay</strong><br />
Rookery <strong>Bay</strong><br />
El sewhere<br />
Wadden Sea,<br />
Nether1 ands<br />
Cami nada <strong>Bay</strong>,<br />
Louisiana<br />
Baratari a <strong>Bay</strong>,<br />
Louisiana<br />
Narragansett <strong>Bay</strong>,<br />
Rhode Island<br />
Rhode Is1 and<br />
coastal 1 agoons<br />
Bahia de Mochima<br />
and Laguna Grande,<br />
Venezuela<br />
the bay, nitrogen concentrations in the<br />
water column have remained high.<br />
Windsor (1985) examined existing<br />
water quality data for 28 coastal areas <strong>of</strong><br />
<strong>Florida</strong> and found only three in which<br />
nutrient enrichment was indicated and<br />
definite problems <strong>of</strong> di ssol ved oxygen<br />
depletion were observed: Perdido <strong>Bay</strong>,<br />
<strong>Tampa</strong>/Hillsborough <strong>Bay</strong>, and Biscayne <strong>Bay</strong>.<br />
Lewis et al. (1985a) noted that<br />
eutrophication leading to microalgal and<br />
macroalgal blooms may have contributed to<br />
the decline in seagrasses in the bay due<br />
to reduction in downwell ing l ight throuyh<br />
competition and epiphytic algae 1 oading on<br />
seagrass blades. Direct experimental<br />
evidence <strong>of</strong> this phenomenon has been<br />
provided by Twilley et a1 . (1985) where<br />
artifical nutrient loading led to light<br />
attenuation by microalgae, epiphytic algae<br />
loading on leaves <strong>of</strong> macrophytes and<br />
significant decreases in biomass <strong>of</strong><br />
submerged macrophytes. Orth and Moore<br />
(1983) hypothesized that the significant<br />
loss <strong>of</strong> submerged aquatic vegetation in<br />
Chesapeake <strong>Bay</strong> may be due, in part, to<br />
similar nutrient enrichment.<br />
Fanni ng and Be1 1 (1985) recommended<br />
that four areas <strong>of</strong> research be pursued to<br />
further clarify the problem <strong>of</strong><br />
eutrophication in <strong>Tampa</strong> <strong>Bay</strong>:<br />
(1) long-range coordinated nutrient<br />
sampling <strong>of</strong> the bay to accurately<br />
characterize conditions and detect<br />
changes;<br />
(2) sampling to determine pathways and<br />
rates <strong>of</strong> nutrient transformation;
(3) a study <strong>of</strong> interactions and exchanges<br />
<strong>of</strong> nutrients in the bay with the Gulf<br />
<strong>of</strong> Mexico; and<br />
(4) clarification <strong>of</strong> the role <strong>of</strong><br />
sediments as sinks or sources <strong>of</strong><br />
nutrients under varying conditions.<br />
<strong>Tampa</strong> <strong>Bay</strong> is an aesthetic resource<br />
for the large, growing population which<br />
surrounds it. <strong>The</strong> bay is a buffer and<br />
refuge from the assaults <strong>of</strong> urban i ife.<br />
For all but the affluent, the hay 4s the<br />
on y accessible coastal resource where<br />
comparative isolation and wilderness can<br />
be experienced. Management <strong>of</strong> the bay<br />
somehow must work to preserve the key<br />
elements <strong>of</strong> this experience which, for<br />
exan~ples, include silence, long vistas,<br />
darkness at night, encounters with<br />
wildlife, and the feeling <strong>of</strong> solitude.<br />
<strong>The</strong> value <strong>of</strong> special places in thr<br />
bay area, such as Cockroach <strong>Bay</strong> or Doublc<br />
Cranrh Creek, rests as much with their<br />
scientifically dot umented productivity a5<br />
with their possessian <strong>of</strong> int,anyible<br />
wilderness opportunities, Proposals to<br />
develop ohorelines near such sensitive<br />
areas may meet or even exceed specific<br />
rcyr 1 dtory rtrqui rctnonts which protect<br />
resource qudntitics or quality, but still<br />
tlostroy I he intangible and increasing 1 y<br />
rsrr cl~aractcr <strong>of</strong> the site.<br />
5.3 CONCLUSION<br />
Whon sewage treatment is inadequate<br />
we have depended on lampa Ray to<br />
assimilate and disinfect the effluents.<br />
Whtw more pat able water is needed, we have<br />
damrncd rivers first and considered the<br />
effects later. When a ship channel is in<br />
ncod sf deepening we haw simply dumped<br />
the spoil on nearby w~llands. And when a<br />
convenient and free place is noedrd to<br />
dump toxic wastes, we have constructed<br />
pipes and ditches flowing to the bay.<br />
<strong>Tampa</strong> <strong>Bay</strong> is a bill ion dollar<br />
resource [fable 27). It has satisfied the<br />
agendas <strong>of</strong> a l social and economic<br />
interests In tne region, free <strong>of</strong> charge<br />
and with no managerlacnt for 100 years. It.<br />
cannot continue to do so, because natut.31<br />
threshholds are being approached beyond<br />
which ecosystems fail, Fisheries will<br />
rontinue to decline because fish stocks<br />
cannot sirnu1 taneously adapt to 1 arge<br />
habitat losses, anaxic waters, ~:ortality<br />
from power plant entrainment, unl i r l ~ ted i<br />
sport and commercial fishing pressure, and<br />
toxic materials.<br />
Corlsideration should be qiver to<br />
holistic management. <strong>of</strong> Tarya Ray. Respans<br />
i b il i ty far m nagprnent <strong>of</strong> resource<br />
in the bay 1s fragrrenfed along artificial<br />
line5 and no ecosysten! level mnaigerylenl:<br />
exists. One state agency reyu lates<br />
effluents and power plants; several<br />
agencies participate in wetland regulation;<br />
another agency protects frcl5hwater<br />
sperles. <strong>The</strong> situation is analaqous to<br />
one hiyhway deparbnent heinq in charge <strong>of</strong><br />
north-south roads, another in charge <strong>of</strong><br />
cast-wect roads, and still another rerponsible<br />
for inters~ctions and traffic<br />
r, ignal s.<br />
Joseph C . Simon stated in his 1974<br />
synopsis <strong>of</strong> <strong>Tampa</strong> <strong>Bay</strong>:<br />
To %peak <strong>of</strong> managenlent or<br />
nji ~;manayefncnt <strong>of</strong> the <strong>Tampa</strong> 8ay<br />
Estuarine System prior to the late<br />
1960s is inappropriate -- up to that<br />
time, there was simply development.<br />
Management imp1 ies control over a<br />
system. Mi smanagenlent imp1 i es<br />
improper control. Only in the past<br />
few years hds the public demanded<br />
management pract ices be appl ied to<br />
<strong>Tampa</strong> <strong>Bay</strong>. It is too soon to make<br />
the judgement whether these practices<br />
are going in the right direction<br />
(i.e., proper management) ar whether<br />
governmental bodies are sinrply paying<br />
l ip-service ta the problems f i .e.,<br />
mismanagement). <strong>The</strong> lack <strong>of</strong> wrllingnrss<br />
to slow growth until plans can<br />
be implemented to solve old and<br />
1 ingering problen~s would seenu to<br />
imply we are headed towards mismanagement.<br />
<strong>Tampa</strong> <strong>Bay</strong> lannut wait<br />
much longer far advanced sewage<br />
treatment, nor can it tolerate more<br />
dredging without further degradation<br />
<strong>of</strong> its waters and botton:s.<br />
Hopefully, an irate citizenry w;!!<br />
awaken policy making bodies to adapt<br />
sound management practices and wi i<br />
not accept mi srnanagement $2 an<br />
a1 ternative.
Table 27. Known economic benefits for selected aspects <strong>of</strong> <strong>Tampa</strong> <strong>Bay</strong>, by county (MacAulay<br />
1986).<br />
Direct benefits bv county (mi 11 ions <strong>of</strong> do1 1 arsl<br />
Item Hi 11 sborough Manatee Pine11 as Total<br />
Shipping<br />
Waste disposal<br />
Sanitary<br />
Cool ing<br />
$281 .O Not studied Not studied $281.0<br />
$137.0a Not studied $ 41.0~ $178.0<br />
40.5 Not studied 41.0 81.5<br />
Fishing<br />
Commerci a1<br />
Recreational<br />
Recreation<br />
Boat sales<br />
Beaches/Ramps<br />
Real estate<br />
Total<br />
---------------- Studied, no estimate----------------------<br />
$963.8<br />
a Employs least expensive a1 ternative to selected plan <strong>of</strong> expanding Hookers<br />
Point Plant.<br />
b~orth Pinel las County only.<br />
[Editor's note: Progress has been $7.74 mil lion do1 lars is proposed for the<br />
made toward implementing and funding a first three years <strong>of</strong> funding this<br />
<strong>Tampa</strong> <strong>Bay</strong> management program. In 1986, program.]<br />
the Legislature passed a resolution<br />
recognizing the singularity <strong>of</strong> <strong>Tampa</strong> <strong>Bay</strong><br />
(Figure 85). <strong>The</strong> 1987 legislative ses- We hope our efforts to bring<br />
sion passed a funding program as part <strong>of</strong> together this information about the bay<br />
the new Surface WaJer Improvement and will encourage bay management to<br />
Flanagement (SblIM) program. A total <strong>of</strong> begin.
A rcmluttrm In rntaqtrsiton <strong>of</strong> tho aingulartty af<br />
l arn(,r lily<br />
Wlif RXAS. Tdnlpa flay tr tI\a Inrgast artuary In <strong>Florida</strong>, and<br />
WtiF NI AS. Iarn(2.a flay I% r nrstor mdrlnn nurrery area for rlor~da<br />
lcms <strong>of</strong> ~~rrllutlati artd ovardavclopmerrt <strong>of</strong> the bay, and<br />
WbiCl{tA tl~e refrot oi the rnntrn8%alori arttitled '<strong>The</strong> F~itt~ra .;rf<br />
Ta~litta Oay ix t,ow ltusrly tnrrrl~~nented by the Agency on FIsy<br />
Mrnrl;etr*tnt at tile Yiacrtpr tlry Regional I'larrir~rtg (ounr~l, and<br />
Wt4K ill A tnllry tnrtt\ fr ia17J~ oC tElr (.ray rnri inaml,ri t id ttre<br />
t$z"ri~y arc brartirly Irllat,~n%nu to nrnrrfl~siln the need to furttier<br />
prrtrtat t dtid raitxw.r I .rrrig,a I\ry NOW 1tlI RI ((1111 .<br />
Ittat the liou%v <strong>of</strong> Rtwrc%anl*ttvar uf the State <strong>of</strong> I Ior~Ja harrlry<br />
racojinires ttle ltnportanee <strong>of</strong> prntectinr~ and tcatrrrng Irtnpa Orb and<br />
connqamar,t eo ttr
Applin, P.R., and E.R. Applin. 1965.<br />
<strong>The</strong> Comanche Series and associated<br />
rocks in the subsurface in central and<br />
south <strong>Florida</strong>. U.S. Geol. Surv. Pr<strong>of</strong>.<br />
Pap. 447.<br />
Backman, T.W., and D.C. Barilotti.<br />
1976. Irradiance reduction effects on<br />
standing crops <strong>of</strong> the eel grass Zostera<br />
marina in a coastal lagoon. Mar.<br />
W ( ~ e r 1 ) . 34: 33-40.<br />
Bahr, L.M., and W.P. Lanier. 1981.<br />
<strong>Ecology</strong> <strong>of</strong> intertidal oyster reefs <strong>of</strong><br />
the South Atlantic Coast: a community<br />
pr<strong>of</strong>ile. U.S. Fish Wildl. Serv.<br />
FWS/OBS-81/15.<br />
Ballantine, D., and H.J. Humnn. 1975.<br />
Benthic algae <strong>of</strong> the Anclote estuary.<br />
I. Epiphytes <strong>of</strong> seagrass leaves. Fla.<br />
Sci. 38:150-162.<br />
Bell, F.W., P.E. Sorensen, and V.R.<br />
Leeworthy. 1982. <strong>The</strong> economic inpact<br />
and valuation <strong>of</strong> saltwater recreational<br />
fisheries in <strong>Florida</strong>. Fla. Sea<br />
Grant College, Gainesville, Rep. 47,<br />
118 pp.<br />
Be1 1, . S.S., and C.D. Coen. 1982. Inves<br />
tigations on epibenthic mei<strong>of</strong>auna.<br />
I. Abundances on, and repopula tion<br />
<strong>of</strong>, the tube-caps <strong>of</strong> Dio atra cuprea<br />
(Polychaeta: Onuphid
Cambrid~e, M.L. 1975. Seagrasses <strong>of</strong><br />
south-rtestern Australia with special<br />
reference to the ecnl oqy <strong>of</strong> i'o idonia<br />
australis Hook T. in a polluted<br />
environment. Aquat. Ibt. 1: 149-161,<br />
Garihridgc, M.L. 1979. Cockburn Sound<br />
envi ronrental study - techrtical report<br />
on seagrass, Dep. Conscrv. Envi ron.<br />
Western Auz tralia Rep. I. 100 pit.<br />
Carr, W.E., and C.A. Adarss. 1973. Food<br />
habits <strong>of</strong> juvenile rmrine fisisecl<br />
occupying scaqrass hcds in thp<br />
estuarine zone near Crys tdl River,<br />
Fl orida. Trans. Am. Fish. Sac.<br />
101 :511-540.<br />
Chm, C.S. 1965. Regiorral 1i thos tratiqraphic<br />
analysis <strong>of</strong> Paleocene dnd<br />
Eocene racks <strong>of</strong> <strong>Florida</strong>. Fla, Ceat .<br />
Surv, Rull. 45. 105 pp.<br />
Clcwcll, A.F., J.A. Goolrhy, and A.G.<br />
Shuey. 1983. Hiverine forests <strong>of</strong> the<br />
south prong Aldf ia River 5 ys t tn~,<br />
Floridd. <strong>Wetlands</strong> :11-72.<br />
Ctrrap, C.S. 1985. A <strong>of</strong> the di5-<br />
tribtttron and rniqrdtion <strong>of</strong> t,h~ fishes<br />
in Tartrfld Fby. Patja!s 39."1-.tr in Y.F.<br />
Irmt, ,l.l. Sinen, R.li, Lewis ITt drld<br />
R. I*, Wh i lirrdn, ,Ire, ed' . F1rocecti 1 ncjs ,<br />
Tdntpd Uay Arm sr*icrrtific infor~~k~tron<br />
svmpoc, iurtr (Fh y Ic)W) . 811 rq(.\~,s I)LJI)-<br />
lishiny Lo., Inc,, Minncctpul.is, MN.<br />
Availahlp f'rcxrl Tanpn OASIS, fIn%>t<br />
Offirr Box 2911l01, Tnn~pa, !-I. 3.3681.<br />
Cor~aver, f,,T,, and t-aanrt~, S.D. J97f)+<br />
Rivrr basin drld t\@roloc]ic unit tr@(r <strong>of</strong><br />
rlurrida. f lti, flb~r", <strong>of</strong> GPO'I. M ~ D %,r.<br />
i;! *<br />
--- -<br />
iii
symposium (May 1982). Burgess Publishing<br />
Co., Inc., Minneapolis, MN.<br />
663. pp. Available from <strong>Tampa</strong> BASIS,<br />
Post Office Box 290197, <strong>Tampa</strong>, FL<br />
33687.<br />
Detweiler, T., F.M. Dunstan, R.R. Lewis,<br />
and W.K. Fehring. 1975. Patterns <strong>of</strong><br />
secondary succession in a mangrove<br />
community. <strong>Tampa</strong> <strong>Bay</strong>, <strong>Florida</strong>. Pages<br />
52-81 in R.R. Lewis, 111, ed. Proceedings<strong>of</strong><br />
the second annual conference<br />
on restoration <strong>of</strong> coastal<br />
vegetation in <strong>Florida</strong>. <strong>Tampa</strong>, R.<br />
Dinardi , D.A. 1978. <strong>Tampa</strong> <strong>Bay</strong> circulatory<br />
survey. 1963 NOS Oceanogr.<br />
Circulatory Surv. Rep. 2, NOAA. 39<br />
PP*<br />
Dooris, P.M., and G.M. Dooris. 1985.<br />
Surface flows to <strong>Tampa</strong> <strong>Bay</strong>: quantity<br />
and qua1 i ty aspects. Pages 88-106 in<br />
S.F. Treat, J.L. Simon, R.R. ~ e w K<br />
111, and R.L. Whitman, Jr., eds. Proceedings,<br />
<strong>Tampa</strong> <strong>Bay</strong> area scientific<br />
information symposium (May 1982).<br />
Burgess Publishing Co., Inc.,<br />
Minneapolis, MN. 663 pp. Available<br />
from <strong>Tampa</strong> BASIS, Post Office Box<br />
290197, <strong>Tampa</strong>, FL 33687.<br />
Doyle, L.H. 1985. Marine geology <strong>of</strong><br />
<strong>Tampa</strong> <strong>Bay</strong>. In S.F. Treat, J.L. Simon,<br />
R.R. Lewis IT, and R.L. Whitman, Jr.,<br />
eds. Proceedings, <strong>Tampa</strong> <strong>Bay</strong> area scientific<br />
information symposium (May<br />
1982). Burgess Pub1 ishing Co., Inc.,<br />
Minneapolis, MN. Available from <strong>Tampa</strong><br />
BASIS, Post Office Box 290197, <strong>Tampa</strong>,<br />
FL 33687.<br />
Dragovich, A., and J.A. Ke1 ly, Jr.<br />
1964. Prel imi na ry observations on<br />
phytopl ank ton and hydrology in <strong>Tampa</strong><br />
<strong>Bay</strong> and the immediate adjacent <strong>of</strong>fshore<br />
waters. Pages 4-22 in A col lection<br />
<strong>of</strong> data in referenceto red tide<br />
outbreaks during 1963. <strong>Florida</strong> Board<br />
<strong>of</strong> Conservation, St. Peters burg.<br />
(Mimeo) .<br />
Dragovich, A., and J.A. Kelly , Jr. 1966.<br />
Distribution and occurrence <strong>of</strong><br />
Gymnodinium brevis on the west coast<br />
<strong>of</strong> <strong>Florida</strong>. 1964-65. U.S. Fish - . Wildl. .<br />
Serv. spec. Sci. Rep. ~ish. 541. 15<br />
PP*<br />
Drew, E.A, and B.P. Jupw. 1976. Some<br />
aspects -<strong>of</strong> the growth <strong>of</strong> Posidonia<br />
oceanica in FBlta. Pages 357-367 in<br />
E.A. Drew, J.N. Lythsoe, and J.K<br />
Woods, eds . Underwater-research. Academi<br />
c Press, London.<br />
Drew, R.D., N.S. Schomer, and S.H.<br />
Wolfe. An ecological characterization<br />
<strong>of</strong> the <strong>Tampa</strong> <strong>Bay</strong> watershed. U.S. Fish<br />
W i l dl. Serv. Unpubl .<br />
Dunstan, F.M., and R.R. Lewis, 111.<br />
1974. Avian utilization and plant<br />
success ion on dredged material<br />
islands in <strong>Tampa</strong> <strong>Bay</strong>, <strong>Florida</strong>.<br />
Coastal ' Zone Resources Corp.,<br />
Wilmington, N.C. 73 pp.<br />
Durako, M.J., R.A. f%dlyn, and M.D.<br />
M<strong>of</strong>fler. 1982. Particulate matter<br />
resuspens ion via metabol i cal ly<br />
produced gas bubbles from benthic<br />
estuarine mi croal gae communi ties.<br />
Limn01 . Oceanogr. 27(4) :752-757.<br />
Durako, M.J., J.A. Browder, W.L.<br />
Kruczyns ki , C.B. Subrahmanyam, and<br />
R.E. Turner. 1985. Salt marsh<br />
habitat and fishery resources <strong>of</strong><br />
<strong>Florida</strong>. Pages 189-280 2 W. Seaman,<br />
Jr., ed. <strong>Florida</strong> aquatic habitat and<br />
fishery resources. Fla. Chap. Am.<br />
Fish. Soc., Kissimmee. 543 pp.<br />
Eldred, B., R.M. Ingle, K.D. Woodburn,<br />
R.F. Hutton, and H. Jones. 1961.<br />
Bi 01 ogi cal observations on the<br />
commercial shrimp Penaeus duorarum<br />
Burkenroad, in <strong>Florida</strong> waters=<br />
State Board Conserv. Mar. Lab. Pr<strong>of</strong>.<br />
Pap. Ser. 3. 139 pp.<br />
Eldred, B., J. Williams, G.T. Martin,<br />
and E.A. Joyce, Jr. 1965. Seasonal<br />
distribution <strong>of</strong> penaeid larvae and<br />
post larvae <strong>of</strong> the <strong>Tampa</strong> <strong>Bay</strong> area,<br />
<strong>Florida</strong>. Fla. State Board Conserv.<br />
Mar. Lab. Tech. Ser. 44. 47 pp.<br />
Estevez, E.D. 1978. Ecoloqy <strong>of</strong><br />
~phaerma terrebrans (Bate) , a --woodborina<br />
isoood in a <strong>Florida</strong> mnqrove<br />
foresi. ~h.0. Dissertation. ~njversity<br />
<strong>of</strong> South <strong>Florida</strong>, <strong>Tampa</strong>. 154 pp.<br />
Es tevez , E.D. 1981. Charlotte Harbor<br />
estuarine ecosystem complex and the
Peace River. Pbte Mar. tab. Rev. Ser.<br />
No. 3. 1,077 pp.<br />
Estevez, E.D. 1982. Technique for managing<br />
cumulative impacts in <strong>Florida</strong>'s<br />
coastal wetlands. Pages 147-158 in<br />
P.M. McCaffrey et a1 ,, eds. ~roceeK<br />
ings: symposium on proqress in wetlands<br />
utilization and managemnt.<br />
<strong>Florida</strong> Department <strong>of</strong> Envi ronrmntal<br />
Regulation, Tal lahassee.<br />
Estevez, E.D., and L. Mosura. 1985.<br />
Emergent vegetation. Pages 248-278 in<br />
S.F. Treat, J.L. Simon, R.R. ~ e w E<br />
1 I I, and R.L. Whi tman, Jr., eds. Proceedings,<br />
<strong>Tampa</strong> Ray area scientific<br />
information ~ymposium (May 1982).<br />
Burgess Pub1 ishing Co., Inc.,<br />
Minneapolis , MN, Available From Tarrpa<br />
BASIS, Post <strong>of</strong>fSce Rox 290197, <strong>Tampa</strong>,<br />
FL 33687.<br />
Estevez, E.D,, B. J. Hartman, R. Kautz,<br />
and E.D. Purdum. 1984. Ecosystems<br />
<strong>of</strong> surface waters, Chapter 7 E.A.<br />
Fernald and D,J. Patton, cds. Water<br />
resources atlar <strong>of</strong> <strong>Florida</strong>. <strong>Florida</strong><br />
State University, Tal lahassee.<br />
Ewald. 5,J. 1969. Observations an the<br />
bi viogy <strong>of</strong> Tozeuma carol i nense<br />
( Decdoada , W i o ~ o frm71 <strong>Florida</strong>,<br />
with special reference to larval<br />
dev~10pln~nt. M'il. Mar. Sci. (krl.)<br />
19(3) :51Q-549.<br />
Fanninq, K,A., and 1.M. k11. 1985,<br />
Nutrients in <strong>Tampa</strong> Oay. Pages 109-120<br />
In S,F. Treat, J.L. Sirnon, R.R. I-wis<br />
n1, and R.L. Whitrmtl, Jr., eds. Proccedirtgs<br />
, <strong>Tampa</strong> b y area scientific<br />
informtion syrrylosium (May 1982).<br />
aurgess Publishing Co., Inc.,<br />
Mrrrneapoljc , MN, Available from Tanpa<br />
BASIS, Post CKfce rtnx 290197, <strong>Tampa</strong>,<br />
FL. 33687.<br />
Federal Water Pal lut<br />
ion Control Adrni nistsation,<br />
1969. Pr<strong>of</strong>il ens and mnagemcnt<br />
<strong>of</strong> water qclal i ty in Itills borough<br />
<strong>Bay</strong>, <strong>Florida</strong>, klashington, D.C. 86<br />
PP *<br />
Fehring, W,K, 1983. Ports, industrial<br />
fisheries--can they coexist Pages<br />
36-38 in J,W. Reintjes, ed, Inprclving<br />
multipE use <strong>of</strong> coastal and mrine<br />
resources. American Fisheries<br />
Society, aethesda, MD. 96 pp.<br />
Fehring, W.K. 1985. History and development<br />
<strong>of</strong> the port <strong>of</strong> <strong>Tampa</strong>. Pages<br />
512-524 in S.F. Treat, J.L. Simon,<br />
R.R. ~ewis111, and R.L. blhitmn, Jr.,<br />
eds. Proceedings, <strong>Tampa</strong> <strong>Bay</strong> area<br />
scientific informtion symposium (May<br />
1982). Burgess Puhl ishing Co., linc.,<br />
Minneapolis, MN. Available from Tama<br />
BASIS, Post Office Box 290197, <strong>Tampa</strong>,<br />
FL 33687.<br />
Fi nucane, J.H. 1966. Faunal production<br />
project. Pages 18-22 in Report <strong>of</strong> the<br />
Bureau <strong>of</strong> Commercial ~Eheries Bi ological<br />
Station, St. Petersburg Beach,<br />
<strong>Florida</strong>, fiscal year 1965. U.S. Fish<br />
Wildl. Serv. Circ. 242.<br />
Finucane, J.H., and A. Dragovich. 1966.<br />
Hydrographic observations in Talrapa<br />
<strong>Bay</strong>, <strong>Florida</strong> and adjacent Gulf <strong>of</strong><br />
Mexico waters - 1963. U.S. Fish<br />
Wildl. Serv., Data Rep. 14.<br />
Flint, R.W. 1985. Long-ten estuarine<br />
variability and associated biological<br />
response. Estuaries 8~158-169.<br />
<strong>Florida</strong> Department <strong>of</strong> Envi ranmntal<br />
Regulation. 1982. Report to the<br />
Environmental Regulation Commission on<br />
the proposed designation <strong>of</strong> the Little<br />
Manatee River as an outstanding<br />
Fl oricta water. Ta1 la hassee.<br />
Fry, 0. 1984. 13C:12C ratios and<br />
troohic imaortance <strong>of</strong> a1 qae in <strong>Florida</strong><br />
fi lifor6 seagras s<br />
Mar. Biol. 7$(1):11-19.<br />
Galts<strong>of</strong>f, P.S. 1954. Gulf <strong>of</strong> Mexico.<br />
Its origin, waters and mrine life.<br />
U.S. Fish Wildl. Serv. Fish. Bull. 89.<br />
604 pp.<br />
Garrity, R.D., N. McCann, and J.<br />
Murdoch. 1985. W review <strong>of</strong> the<br />
envi ronmental impacts <strong>of</strong> municipal<br />
services in <strong>Tampa</strong>, Pages 526-550 in<br />
S.F. Treat, J.L. Simon, R.R. L W ~<br />
,* r<br />
and 2 . Whi*&&n, 3r., ~25.<br />
Proceedings, <strong>Tampa</strong> <strong>Bay</strong> area scientific<br />
informtion symposium (May 1982).<br />
Burgess Publishing Go., Inc.,<br />
Minneapolis, MN. Available from Tanpa
BASIS, Post Office Box 290197, <strong>Tampa</strong>,<br />
FL 33687.<br />
Geo-Marine, Inc. 1973. A field study<br />
<strong>of</strong> selected ecological properties <strong>of</strong><br />
upper Boca Ciega <strong>Bay</strong>, Cross <strong>Bay</strong>ou<br />
Canal, and adjacent areas. Geomarine,<br />
Inc., St. Petersburg, FL.<br />
Gilmore, R.G., C.J. Donohoe, and D.W.<br />
Cooke. 1983. Observations on the<br />
distribution and biology <strong>of</strong> eastcentral<br />
<strong>Florida</strong> populations <strong>of</strong> the<br />
common snook, Centro omus undecimal is<br />
(Block). Fla-%%%eC. Issue.<br />
Gi ovanel li , R.L. 1981. Re1 ation<br />
between freshwater flow and salinity<br />
distributions in the Alafia River,<br />
Bullfrog Creek, and Hi1 lsborough <strong>Bay</strong>,<br />
<strong>Florida</strong>. U.S. Geol . Surv. Water<br />
Resour. Invest. 80-102, 62 pp.<br />
Giovanelli , R.F., and J. Murdoch. 1985.<br />
Urban stormwater run<strong>of</strong>f in the Tawa<br />
<strong>Bay</strong> area. Pages 568-593 in S.F.<br />
Treat, J.L. Simon, R.R. Lewis TI, and<br />
R.L. Whitman, Jr., eds. Proceedings,<br />
<strong>Tampa</strong> <strong>Bay</strong> area scientific information<br />
symposium (May 1982). Burgess Publishing<br />
Co., Inc., Minneapolis, MN.<br />
Available from Tanipa BASIS. Post<br />
Office Box 290197, <strong>Tampa</strong>, FL 33687.<br />
G~dcharles, M.F. 1971. A study <strong>of</strong> the<br />
effects <strong>of</strong> a commercial hydraulic clam<br />
dredge on benthic communi ties in<br />
estuarine areas. Fla. Dep. Nat.<br />
Resour. Tech. Ser. No. 64. 51 pp.<br />
Godcharles, M.F., and W.C. Japp. 1973.<br />
Fauna and flora in hydraulic clam<br />
dredge collections from <strong>Florida</strong> west<br />
and southeast coasts. Spec. Sci. Rep.<br />
40, <strong>Florida</strong> Department <strong>of</strong> Natural<br />
Resources, St. Petersburg. 89 pp.<br />
Goetz, C.L., and C.R. Goodwin. 1980.<br />
Water qua1 i ty <strong>of</strong> <strong>Tampa</strong> <strong>Bay</strong>, <strong>Florida</strong>:<br />
June 1972 to May 1976. U.S. Geol.<br />
Surv. Water Resour. Invest. 80-12. 58<br />
PP*<br />
Goggin, J.M., and W.C. Sturtevant.<br />
1964. <strong>The</strong> Calusa: a stratified<br />
nonagricultural society. Pages<br />
179-230 W.H. Goodenough, ed.<br />
Explnr-dtions in cultural anthropology.<br />
ClcGraiq-Fiil 1, Men York-<br />
Gooilel 1, il.~. , and D.S. Gorsline. 1961.<br />
il srdirent<strong>of</strong>ogic study <strong>of</strong> <strong>Tampa</strong> <strong>Bay</strong>,<br />
<strong>Florida</strong>. FIa-. State Univ. Oceanogr.<br />
Inst. Contrjb. 157. Proc. Int. Geol.<br />
Congr. 21 Sess- Norden, 1960. pt.<br />
23:75-88.<br />
Goodwin, C.R. 1984. Changes in tidal<br />
flow, circulation, and flushing caused<br />
by dredge and fill in <strong>Tampa</strong> <strong>Bay</strong>,<br />
<strong>Florida</strong>. U.S. Geol. Surv. Open File<br />
Rep. 84-447,<br />
Goo&in, C.R., and D.M. Michael is.<br />
1976. Tides i n <strong>Tampa</strong> <strong>Bay</strong>, <strong>Florida</strong>:<br />
June 1971 to December 1973. U.S.<br />
Geol. Surv. Open File Rep. FL75004,<br />
Tal lahassee.<br />
Goorlwin, C.R., and D.M. Michaelis.<br />
1981. Appearance and water quality <strong>of</strong><br />
turbidity plumes created by dredging<br />
in lantpa <strong>Bay</strong>, <strong>Florida</strong>. U.S. Geol.<br />
Surv. Water Resour. Invest. Open File<br />
Rep. 81-541, Tal lahassee.<br />
Grussendorf , M. J . 1982.<br />
Why study live<br />
botton!~ Estuaries 4(3) :303.<br />
Guist, E.E., and H. J. Humm. 1976.<br />
Effects <strong>of</strong> sewage effluent on growth<br />
<strong>of</strong> Ulva lactiica, Fla. Sci, 39(4):267-<br />
2 7 1 7<br />
Gunter, G. 1961. Some relations <strong>of</strong><br />
estuarine organisms to salinity.<br />
Limnol . Oceanogr. 6(2) :182-190.<br />
Gunter, G. 1967. Some relationships <strong>of</strong><br />
estuaries to the fisheries <strong>of</strong> the Gulf<br />
<strong>of</strong> Mexico. Pages 621-638 - in G.H.<br />
Lauff, ed. Estuaries. Am. Assoc.<br />
Advance. Sci. Publ. NO. 83. 757 pp.<br />
tiaines, F.G. 1976. Relation between<br />
the stable carbon isotope composition<br />
<strong>of</strong> fiddler crabs, plants and soils in<br />
a salt marsh, Limn01 . Oceanogr*<br />
21(6) :880-883,<br />
Hall, MOO., and N.J. Eisman. 1981.<br />
<strong>The</strong> seagrass epiphytes <strong>of</strong> "the Indian<br />
River, Flarida. 1- Soecies list with<br />
descriptions and seas&a~ occurrences*<br />
i3ot. hr. 24:139-146.
Harlin, M.M., and B. Thokne-Mil ler.<br />
1981. Nutrient enrichment <strong>of</strong> seagrass<br />
beds in a Rhode Island coastal lagoon.<br />
Mar. Biol . (Berl .) 65:221-229.<br />
Harris, B.A., K.D. Haddad, K.A.<br />
Steidinger, and J.A. Huff. 1983.<br />
Assessment <strong>of</strong> fisheries habitat:<br />
Charlotte Harbor and Lake Worth,<br />
<strong>Florida</strong>. <strong>Florida</strong> Departwnt <strong>of</strong><br />
Natural Resources, St, Petersburg .<br />
211 pp. + Append,<br />
Hartman, R.T., and D. Brown. 1966.<br />
Methane as a constituent <strong>of</strong> the internal<br />
atmosphere <strong>of</strong> vascular hydrophytes.<br />
Limn01 . Oceanogr. ll(1) :104-<br />
112.<br />
Heald, E.J., W.E. Odum, and D.C. Tabb.<br />
1974. Mangroves in the estuarine food<br />
chain. Pages 182-189 in D.J. Gleason,<br />
ed. Environments <strong>of</strong>-south <strong>Florida</strong>:<br />
present and past. Miami Geol . Soc,<br />
Mem. 2. 452 pp.<br />
Hedgpeth, J.W. 1954. Bottom communities<br />
<strong>of</strong> the Gulf <strong>of</strong> Mexico. U.S. Fish<br />
Wildl. Serv. Fish Bull. 55:203-214.<br />
Heffernan, J.J., and R.A. Gibson. 1983.<br />
A comparison <strong>of</strong> primary production<br />
rates in Indian River, <strong>Florida</strong> seagrass<br />
sys tans. Fla. ~ c. i 46(3/4) :295-<br />
306.<br />
Heffernan, J.J., and R,A. Gibson. 1985.<br />
Seagrass productivity in <strong>Tampa</strong> <strong>Bay</strong>: a<br />
comparison with other subtropical cmmunities.<br />
Page 247 in S.F. Treat,<br />
J.L. Simon, R.R. Lewis-111, and R.L.<br />
Wh i tman, Jr ., eds. Proceedings , <strong>Tampa</strong><br />
<strong>Bay</strong> area scientific information symposium<br />
(May 1982). Burgess Publ. Co.,<br />
Inc., Minneapolis, MN. 663 pp.<br />
Available from <strong>Tampa</strong> BASIS, Post<br />
Office Box 290197, <strong>Tampa</strong>, FL 33687.<br />
(Abstr.)<br />
Heilprin A. 1887. Explorations on the<br />
west coast <strong>of</strong> <strong>Florida</strong> and Okeechobee<br />
wi1 derness. Trans., Wagner Ins t. Vol .<br />
1.361-507,<br />
Henry, J.A,, and S.E. Dicks. 1984.<br />
Drought in Southeastern United States.<br />
Fla. Sci. 47(2):114-130.<br />
Hicks, S.D. 1972a. On the classification<br />
and trends <strong>of</strong> long period sea<br />
level series . Shore and Beach<br />
40(1) :20-23.<br />
Hicks, S.D. 1972b. As the oceans rise.<br />
NOAA Bulletin 2(2).<br />
Hicks, S.D., and Ghn. Sh<strong>of</strong>nos. 1965.<br />
Yearly sea level variations for the<br />
United States. J. Hydraul. Div., Am.<br />
Soc. Civil Eng. 91 (HY 51, September:<br />
23-32.<br />
Hi1 1s borough County Environmental Protection<br />
Commission (HCEPC). 1972-84.<br />
Annual report on envi ronmental qual i -<br />
ty, Hi1 lsborough County, <strong>Tampa</strong>, R.<br />
Hi1 1s borough County Envi ronmental Protection<br />
Commission (HCEPC) . 1984.<br />
Annual report on envi ronmental qual i t y<br />
1982-83. Hi1 lsborough County, <strong>Tampa</strong>,<br />
FL.<br />
Ho, C.L., and B.B. Barrett. 1977. Distribution<br />
<strong>of</strong> nutrients in Louisiana's<br />
coastal waters infl uenced by the Mi s-<br />
sissippi River. Esutarine Coastal<br />
Mar. Sci , 5:173-195.<br />
H<strong>of</strong>fmann, W.E., and C.J. Dawes. 1980.<br />
Phytosynthetic rates and primary production<br />
by two <strong>Florida</strong> benthic red<br />
algal species from a salt marsh and a<br />
mangrove community. Bull. Mar. Sci.<br />
30:358-364.<br />
H<strong>of</strong>fmann, W.E., M.J. Durako, and R.R.<br />
Lewis, 111. 1985. Habitat Restoration<br />
in <strong>Tampa</strong> <strong>Bay</strong>. Pages 636-657 in<br />
S.F. Treat, J.L. Simon, R.R. ~ e w E<br />
I I, and R. L. Whitman, Jr., eds. Proceedings,<br />
<strong>Tampa</strong> <strong>Bay</strong> area scientific<br />
information symposium (May 1982).<br />
Burgess Publishing Co., Inc .,<br />
Minneapolis, MN. Available from <strong>Tampa</strong><br />
BASIS, Post Office Box 290197, <strong>Tampa</strong>,<br />
FL 33687.<br />
Hopkins, T.L. 1977. Zooplankton distri<br />
bution in surface waters <strong>of</strong> <strong>Tampa</strong><br />
<strong>Bay</strong>, <strong>Florida</strong>. Bull. Mar. Sci.<br />
27 3467-478.<br />
Hulings, N.C. 1979. <strong>The</strong> ecology, biometry<br />
and biomass <strong>of</strong> the seagrass<br />
Hal ophil a s tipul aceae a1 ong the
Jordanian coast <strong>of</strong> the Gulf <strong>of</strong> Aquaba.<br />
Bot. Mar. 42: 525-430.<br />
Humm, H.J. 1964. Epiphytes <strong>of</strong> the sea<br />
grass, Thal assia testudinum in<br />
<strong>Florida</strong>. Bull. Mar. Sci. Gulf Caribb.<br />
Hunn, J.D. 1975. Hydrology <strong>of</strong> Lake<br />
Tarpon near Tarpon Springs, <strong>Florida</strong>.<br />
Southeast Geol . Soc. Field Conf.<br />
Guideb. 17: Hydrogeology <strong>of</strong><br />
west-central <strong>Florida</strong>. 43-47.<br />
Hutchinson, C.B. 1983. Assessment <strong>of</strong><br />
the interconnection between <strong>Tampa</strong> <strong>Bay</strong><br />
and the <strong>Florida</strong>n Aquifer, <strong>Florida</strong>.<br />
U.S. Geol, Surv. Water Resour. Invest.<br />
82-54.<br />
Hutton, R.F., B. Idred, K.D. Woodburn,<br />
and R.M. Ingle. 1956. <strong>The</strong> ecology <strong>of</strong><br />
Boca Ciega <strong>Bay</strong> with special reference<br />
to dredging and f il ling operations.<br />
Fla. State Board Conserv. Tech. Ser.<br />
No. 17. 87 pp.<br />
Hyde, L.W. 1975. Principal aquifers in<br />
<strong>Florida</strong>. Map ser. 16, Fla. Bur. Geol .,<br />
Tallahassee.<br />
Johansson, J.O., K.A. Steidinger, and<br />
D.C. Carpenter. 1985. Primary production<br />
in <strong>Tampa</strong> <strong>Bay</strong>: a review.<br />
Pages 279-298 in S.F. Treat, J.L.<br />
Simon, R.R. LKis 111, and R.L.<br />
Whi tman, Jr., eds. Proceedings, <strong>Tampa</strong><br />
<strong>Bay</strong> area scientific information<br />
symposium (May 1982). Burgess Publishing<br />
Co., Inc., Minneapolis, MN.<br />
Available from <strong>Tampa</strong> BASIS, Post<br />
Office Box 290197, <strong>Tampa</strong>, FL 33687.<br />
Jordan, C.L. 1973. Climate. Pages<br />
IIA-1 to IIA-14 -in- J.J. Jones et al.,<br />
eds. A summary <strong>of</strong> knowledge <strong>of</strong> the<br />
eastern Gulf <strong>of</strong> Mexico - 1973. State<br />
University System <strong>of</strong> <strong>Florida</strong>, Institute<br />
<strong>of</strong> Oceanography, St, Petersburg.<br />
Joyce, E.A., and 5. Eldred. 1966. <strong>The</strong><br />
<strong>Florida</strong> shrimping industry. Educational<br />
Ser. 15. Marine Laboratory,<br />
Fla. Board bnserv., St. Petersburg.<br />
47 PP*<br />
Keefer, R. 1985. Fishing <strong>Tampa</strong> <strong>Bay</strong>.<br />
St. Petersburg Times, 12, 13, 15, 16<br />
February 1985.<br />
Kemp, W.M., R.C. Wetzel, W.R. Boynton,<br />
C.F. D'Elia, and J.C. Stevenson.<br />
1982. Nitrogen cycling and estuarine<br />
interfaces: some current concepts and<br />
research directions. Pages 209-230<br />
W .S. Kennedy, ed. Estuarine compari -<br />
sons. Academic Press, New York.<br />
Kinne, 0. 1975. Marine ecology. Wiley<br />
Interscience, New York.<br />
Kitting, C.L., 8. Fry, and M.D. Morgan.<br />
1984. Detection <strong>of</strong> inconspicuous<br />
epiphytic a1 gae supporting food webs<br />
in seagrass meadows. Oecol ogi a<br />
(Berl .) 62: 145-149.<br />
Kruczynski , W .L., C.B. Subrahmanyum, and<br />
S.H. Drake. 1978. Studies on the<br />
plant community <strong>of</strong> a North <strong>Florida</strong><br />
salt marsh. I. Primary production.<br />
Bull. Mar. Sci. 28:316-334.<br />
Kulczychi, G.R., W.G. Nelson, and R.W.<br />
Virnstein. 1981. <strong>The</strong> relationship<br />
between fish abundance and alga1<br />
biomass in a seagrass-drift algae communi<br />
ty. Estuarine Coastal Shelf Sci .<br />
12: 341-347.<br />
Kunneke, J.T., and T.F. Palick. 1984.<br />
<strong>Tampa</strong> <strong>Bay</strong> envi ronmental atlas . U.S.<br />
Fish Wildl. Serv. Biol. Rep. 85(15).<br />
74 pp. + 38 separate maps.<br />
Leipper, D.F. 1954. Marine meteorology<br />
<strong>of</strong> the Gulf <strong>of</strong> Mexico. Pages<br />
89-97 - in P.S. Galst<strong>of</strong>f, ed. Gulf <strong>of</strong><br />
Mexico: its origin, waters and marine<br />
life. U.S. Fish Wildl. Serv. Fish.<br />
Bull. 89.<br />
Lewis, F.G., 111. 1982. Habitat complexity<br />
in a subtropical seagrass<br />
meadow: the effects <strong>of</strong> macrophytes on<br />
species composition and abundance in<br />
benthic crustacean assmblages. Dissertation.<br />
<strong>Florida</strong> State University,<br />
Ta1 lahassee.<br />
Lewis, R.R. 1977. Impacts <strong>of</strong> dredging<br />
in the <strong>Tampa</strong> <strong>Bay</strong> estuary, 1876-1976.<br />
Pages 31-55 fi E.L. Pruitt, ed.<br />
Proceedings <strong>of</strong> the second annual con-
ference <strong>of</strong> the coastal society - timestressed<br />
environments: assessments<br />
and future actions. Coastal Society,<br />
Arlington, VA.<br />
Lewis, R.R. 1982a. Low marshes, peninsular<br />
<strong>Florida</strong>. Ch. 7, pages 147-152<br />
- in R.R. Lewis, ed. Creation and<br />
restoration <strong>of</strong> coastal plant communities.<br />
CRC Press, Boca Raton, FL.<br />
Lewis, R.R. 1982b. Mangrove forests.<br />
Ch. 8, pages 153-171 in R.R. Lewis,<br />
ed. Creation and restoration <strong>of</strong><br />
coastal plant communities. CRC Press,<br />
Boca Raton, FL.<br />
Lewis, R.R. 1983. Imact <strong>of</strong> oil spills<br />
on mangrove forests. Pages 171-183 in<br />
H. J. Teas, ed. Bi 01 ogy and ecol ogy <strong>of</strong><br />
mangroves. Tasks for vegetation<br />
science 8. Dr. W. Junk, <strong>The</strong> Hague.<br />
Lewis, R.R., and F.M. Dunstan. 1975a.<br />
Possi bl e role <strong>of</strong> Spartina a1 ternifl ora<br />
Loisel in establishment <strong>of</strong> manclroves<br />
in <strong>Florida</strong>. Pages 82-100 in- R.R.<br />
Lewis, ed. Proceedings <strong>of</strong> thesecond<br />
annual conference on restoration <strong>of</strong><br />
coastal vegetation in <strong>Florida</strong>. <strong>Tampa</strong>,<br />
FL.<br />
Lewis, R.R., and F.M. Dunstan. 1975b.<br />
Use <strong>of</strong> spoil islands in reestablishing<br />
mangrove communities in<br />
<strong>Tampa</strong> <strong>Bay</strong>, <strong>Florida</strong>. Pages 766-775<br />
- in G. Walsh, S. Snedaker and H. Teas,<br />
eds. Proceedings <strong>of</strong> the international<br />
symposium on biology and management <strong>of</strong><br />
mangroves, Vol. 2. Gainesvil le, FL.<br />
Lewis, R.R., and C.S. Lewis. 1978.<br />
Colonial bird use and plant succession<br />
on dredged material islands in<br />
<strong>Florida</strong>. Vol. 11. Patterns <strong>of</strong> vegetation<br />
succession. U.S. Army Corps <strong>of</strong><br />
Engineers Waternays Experiment Station,<br />
Vicksburg, MS 196 pp.<br />
Lewis, R.R., and R.C. Phillips. 1980.<br />
Seagrass mapping project, Hi1 lsborough<br />
County, <strong>Florida</strong>. <strong>Tampa</strong> Port<br />
Authority, FL. 30 pp. + maps.<br />
Lewis, R.R. 111, and R.L. Whitman, Jr.<br />
1985. A new geographic description <strong>of</strong><br />
the boundaries and subdivisions <strong>of</strong><br />
<strong>Tampa</strong> <strong>Bay</strong>. Pages 10-18 - in S,F. Treat,<br />
J.L. Simon, R.R. Lewis 111, and R.L.<br />
Whi tman, Jr., eds. Proceedings, <strong>Tampa</strong><br />
<strong>Bay</strong> area scientific information symposium<br />
(May 1982). Burgess Publishing<br />
Co., Inc., Minneapolis, MN. Available<br />
from <strong>Tampa</strong> BASIS, Post Office Box<br />
290197, <strong>Tampa</strong>, FL 33687.<br />
Lewis, R.R., C.S. Lewis, W.K. Fehring,<br />
and J.R. Rodgers. 1979. Coastal<br />
habitat mitigation in <strong>Tampa</strong> <strong>Bay</strong>,<br />
<strong>Florida</strong>. Pages 136-149 in W.C.<br />
Melander and G.A. Swanson, edc Proceedi<br />
ngs <strong>of</strong> the mi tigation symposium.<br />
Gen. Tech. Prep. RM-65. U.S. Dep.<br />
Agriculture, Fort Col li ns , CO.<br />
Lewis, R.R., J.M. Carlton, and R.<br />
Lombardo. 1984. Alqal consump tion by<br />
the manatee (~richechus manatus L.) in<br />
<strong>Tampa</strong> Bav. <strong>Florida</strong>. Fla. Sci.<br />
Lewis, R.R., M.J. Durako, M.D. M<strong>of</strong>fler,<br />
and R. C. Phi 11 ips. 1985a. Seagrass<br />
meadows <strong>of</strong> <strong>Tampa</strong> <strong>Bay</strong>: a review.<br />
Pages 210-246 in S.F. Treat, J.L.<br />
Simon, R.R. ~ s i s 111, and R.L.<br />
Whitman, Jr., eds. Proceedings, <strong>Tampa</strong><br />
<strong>Bay</strong> area scientific information<br />
symposium (May 1982). Burgess Publishing<br />
Co., Inc., Minneapolis, MN.<br />
Available from <strong>Tampa</strong> BASIS, Post<br />
Office Box 290197, <strong>Tampa</strong>, FL 33687.<br />
Lewis, R.R., 111, R.G. Gilmore, Jr.,<br />
D.W. Crewz, and W.E. Odum. 1985b.<br />
Mangrove habitat and fishery resources<br />
<strong>of</strong> <strong>Florida</strong>. Pages 281-336 in W. Seaman,<br />
Jr., ed. <strong>Florida</strong> aquatic habitat<br />
and fisher-y resources. <strong>Florida</strong><br />
Chapter <strong>of</strong> the American Fisheries<br />
Society, Kissimmee, FL.<br />
Lincer, J.L. 1985. Special species and<br />
their endangered habitat. Page 635 in<br />
S.F. Treat, J.L. Simon, R.R. ~ewE<br />
111, and R.L. Whi tman, Jr ., eds.<br />
Proceedings, <strong>Tampa</strong> <strong>Bay</strong> area scientific<br />
information symposium (May 1982).<br />
Burgess Publishing Co., Inc,,<br />
Minneapolis, MN. Available from <strong>Tampa</strong><br />
BASIS, Post Office Box 290197, <strong>Tampa</strong>,<br />
FL 33687. (Abstr.)<br />
Lindall, W.N., Jr., and L. Trent. 1975.<br />
Housing development canals in the<br />
coastal zone <strong>of</strong> the Gulf <strong>of</strong> Flexico:
ecologi ca1 consequences, regulations,<br />
and recommendation. Mar. Fish. Rev.<br />
37(10) :19-24.<br />
Livings ton, R. J. 1982. Trophic organization<br />
<strong>of</strong> fishes in a coastal seagrass<br />
system. Mar. Ecol . Prog. Ser.<br />
7:l-12.<br />
Livingston, R.J. 1984. Trophic<br />
response <strong>of</strong> fishes to habitat variabil<br />
i t y in coastal seagrass ecosystems.<br />
<strong>Ecology</strong> 65(4) :1258-1275.<br />
Lombardo, R., and R.R. Lewis. 1985. A<br />
review <strong>of</strong> commercial fisheries data.<br />
Pages 614-634 in S.F. Treat, J.L.<br />
Simon, R.R. ~ G i s 111, and R.L.<br />
Whitman, Jr., eds. Proceedings, <strong>Tampa</strong><br />
<strong>Bay</strong> area scientific information symposium<br />
(May 1982). Burgess Publishing<br />
Co., Inc., Minneapolis, MN. Available<br />
from <strong>Tampa</strong> BASIS, Post Office Box<br />
290197, <strong>Tampa</strong>, FL 33687.<br />
Long, R.W., and 0. Lakela. 1971. A<br />
flora <strong>of</strong> tropical <strong>Florida</strong>. Banyan<br />
Books, Miami .<br />
Loraamm, L. P. 1983. Sandbars: when<br />
the waters ebb. Sea Frontiers 29(2):<br />
94- 103.<br />
Lugo, A.E., and S.C. Snedaker. 1974.<br />
<strong>The</strong> ecology <strong>of</strong> mangroves. Annu. Rev.<br />
Ecol . Systematics 5:39-64.<br />
Lugo, A.E., and C.P. Zucca. 1977. <strong>The</strong><br />
impact <strong>of</strong> low temperature stress on<br />
mangrove structure and growth. Trop.<br />
ECO~ . 18:149-161.<br />
Lund, E.J. 1957. Self-silting by the<br />
oyster and its significance for sedimentation<br />
geology. Publ . Inst. Mar.<br />
Sci . Univ. Tex. 4(2) :328-341.<br />
MacAulay, R.W. 1986. Documenting the<br />
economic importance <strong>of</strong> <strong>Tampa</strong> <strong>Bay</strong>.<br />
<strong>Tampa</strong> <strong>Bay</strong> Regional Planning Council,<br />
St. Petersburg. 143 pp.<br />
Mahadevan, S., J.J.B. Murdoch, F.S.<br />
Reeves, J .K. Cul ter, R.A. Lotspeic h,<br />
and J.D. Murdoch. 1977. An analysis<br />
and summary <strong>of</strong> studies on the effects<br />
<strong>of</strong> the cooling water system on aquatic<br />
fauna: a 316 demonstration. Chap. 4<br />
- A study on the effects <strong>of</strong> thermal<br />
discharges on benthic i nfaunal community<br />
structure at Big Ben, <strong>Tampa</strong><br />
<strong>Bay</strong>, <strong>Florida</strong>. Final Rep. <strong>of</strong> Ecological<br />
Surveys <strong>of</strong> Big Bend Area.<br />
Uol. 2 <strong>Tampa</strong> Electric Co., <strong>Tampa</strong>, R.<br />
415 pp.<br />
Manatee County Util i ties Department, and<br />
Camp, Dresser & McKee. 1984. Downstream<br />
effects <strong>of</strong> permitted and proposed<br />
withdrawals from Lake Manatee<br />
reservoir. Rep. to SW Fla. Water Management<br />
Dist.<br />
Mangrove Sys tans, Inc. 1978. Ps sessrent<br />
<strong>of</strong> natural revegetation on disturbed<br />
dredge material islands,<br />
breakwaters and bay bottom in the<br />
vicinity <strong>of</strong> the Big Bend Station, Rep.<br />
No. 3, <strong>Tampa</strong> Electric Co. 15 pp.<br />
Mangrove Systans, Inc. 1985. A study<br />
<strong>of</strong> the drift macroalgae community <strong>of</strong><br />
Hi1 lsborough <strong>Bay</strong>. Department ~f Public<br />
Works, <strong>Tampa</strong>, Fla. 32 pp. +<br />
Appendix.<br />
Mann, J.A. 1972. Hydrologic aspects <strong>of</strong><br />
freshening upper Old <strong>Tampa</strong> <strong>Bay</strong>,<br />
<strong>Florida</strong>. Fla. Bur. Geol. Inf. Circ.<br />
No. 76.<br />
Manner, H.A. 1951. Tidal datum planes.<br />
U.S. Dep. Commerce, Coast & Geodetic<br />
Surv. Spec. Publ. No. 135. Wash.,<br />
D.C.<br />
Marshal 1, N. 1956. Chlorophyll 'a' in<br />
the phytoplankton in coastal waters <strong>of</strong><br />
the eastern Gulf <strong>of</strong> Mexico. J. Mar.<br />
Res. 15(1) :14-32.<br />
McClelland, S. 1984. Draft <strong>Tampa</strong> <strong>Bay</strong><br />
205(j) water quality inpact study.<br />
Fla. Dep. Envi ron. Reg. Water Qua1 .<br />
Tech. Ser. 2. Tallahassee.<br />
McCoy, E.D., and S.S. Bell. 1985.<br />
<strong>Tampa</strong> <strong>Bay</strong>: the end <strong>of</strong> the line<br />
Pages 460-474 -in- S.F. Treat, J.L.<br />
Simon, R.R. Lewis 111, and R.L.<br />
Whitman, Jr., eds . Proceedings , <strong>Tampa</strong><br />
<strong>Bay</strong> area scf entific informtion sympos<br />
ium (May 1982). Burgess Pub1 is hing<br />
Co., Inc., Minneapolis, MN. Available<br />
from <strong>Tampa</strong> BASIS, Post Office Box<br />
290197, <strong>Tampa</strong>, FL 33687.
McNulty, J.K., W,N. Linda1 1, Jr., and<br />
J.E. Sykes. 1972. Cooperative Gulf<br />
<strong>of</strong> Mexi co estuarine inventory and<br />
study . <strong>Florida</strong>: phase 1, area<br />
description. NOAA Tech. Rep. WFS<br />
CIRC-368. 126 pp.<br />
Meade, P.H. 1982. Sources, sinks and<br />
storage <strong>of</strong> river sediment in the<br />
Atlantic drainage <strong>of</strong> the United<br />
States. J. Geol . 90(3) :235-253.<br />
Menke, C.G., E.W. Meredith, and W.S.<br />
ktterhall . 1961. Water resources <strong>of</strong><br />
Hi11sborough County, <strong>Florida</strong>. Fla.<br />
Geol . Surv. Rep. Invest. 25.<br />
Tal lahassee.<br />
Merner, D.T. 1985. Fungi, their occurrence<br />
and potential roles in the<br />
<strong>Tampa</strong> <strong>Bay</strong> ecosystem. Pages 305-327 in<br />
S.F. Treat, J.L. Simon, R.R. Lewz<br />
111, and R.L. Whitman, Jr., eds.<br />
Proceedings, <strong>Tampa</strong> <strong>Bay</strong> area scientific<br />
information symposium (May 1982).<br />
Burgess Publishing Co., Inc.,<br />
Mi nneapol is , MN. Avail a bl e from <strong>Tampa</strong><br />
BASIS, Post Office Box 290197, <strong>Tampa</strong>,<br />
FL 33687.<br />
Moe, M.A., Jr., and G.T. Martin, 1965.<br />
Fishes taken in monthly trawl samples<br />
<strong>of</strong>fshore <strong>of</strong> Pinel las County, <strong>Florida</strong>,<br />
with new additions to the fish fauna<br />
<strong>of</strong> the <strong>Tampa</strong> <strong>Bay</strong> area. Tulane Stud.<br />
2001. 12(4) :129-151.<br />
Moon, R.E. 1985. Point source discharge<br />
in the <strong>Tampa</strong> <strong>Bay</strong> area. Pages<br />
551-562 in S.F, Treat, J.L. Simon,<br />
R.R. ~ewisl-111, and R.L. Whitman, Jr.,<br />
eds. Proceedings, <strong>Tampa</strong> <strong>Bay</strong> area<br />
scientific information symposium (May<br />
1982). Burgess Publishing Co., Inc.,<br />
Minneapolis, MN. Available from <strong>Tampa</strong><br />
BASIS, Post Wfice Box 290197, <strong>Tampa</strong>,<br />
FL 33687.<br />
Monnino, G.R., and A.P. Pizzo. 1983.<br />
<strong>The</strong> treasure city <strong>Tampa</strong>. Gontinental<br />
Heritage Press. <strong>Tampa</strong>, Fla. 272 pp.<br />
Motz, L.H. 1975. Hydrologic effects <strong>of</strong><br />
the <strong>Tampa</strong> bypass canal system,<br />
<strong>Florida</strong>. Bur. Geol. Rept. Invest. 82.<br />
Tal lahassee,<br />
<strong>National</strong> Oceanic and Atmospheric Admi n-<br />
istration (NOAA). 1982. Local cl imtological<br />
data for <strong>Tampa</strong>, <strong>Florida</strong>,<br />
1982. NCPC, Asheville, NC. 2 pp.<br />
Newel 1, G.E., and R.C. Newell. 1963.<br />
Marine plankton. Hutchi nson Educati<br />
onal , Ltd., London. 221 pp.<br />
Nichols, F.H., J.E. Cloern, S.N. Luoma,<br />
and D.H. Peterson. 1986. <strong>The</strong> modification<br />
<strong>of</strong> an estuary. Science 231:<br />
567-573.<br />
Nixon, S.W. 1980. Between coastal<br />
marshes and coastal waters - a review<br />
<strong>of</strong> twenty years speculation and<br />
research on the role <strong>of</strong> salt marshes<br />
in estuarine productivity and water<br />
chemistry. Pages 437-525 in P.<br />
Hamil ton, and K.B. Macdonal d,-eds .<br />
Estuarine and wetland processes with<br />
emphasis on modeling. Plenum, New<br />
York.<br />
Nixon, S.W., and V. Lee. 1981. <strong>The</strong><br />
flux in carbon, nitrogen and phosphorus<br />
between coastal lagoons and<br />
<strong>of</strong>fshore waters. Pages 325-347 in<br />
Coastal lagoon research, present a x<br />
future. UNESCO Tech. Pap. Mar. Sci.<br />
33.<br />
Nixon, S.W., C.A. Oviatee, and S.S.<br />
Hale, 1976. Nitrogen regeneration<br />
and the wtabolism <strong>of</strong> coastal marine<br />
bottom communities. Pages 269-283 in<br />
J.M. Anderson and A. Macfadyed, edc<br />
<strong>The</strong> role <strong>of</strong> terrestrial and aquatic<br />
organisms in decomposition processes.<br />
Proceedings 17th symposium, British<br />
Ecological Society. Blackwell Sci .<br />
Pub1 . , London.<br />
Odell, R. 1972. <strong>The</strong> saving <strong>of</strong> San<br />
Francisco <strong>Bay</strong>. <strong>The</strong> Conservation Foundation,<br />
Washington, D.C. 114 pp.<br />
Odum, H.T., and E.C. Odum. 1981.<br />
Energy basis for man and nature.<br />
McGraw-Hill, New York. 337 pp.<br />
Odum, W.E., and E.J. Heald. 1972.<br />
Trophic analyses <strong>of</strong> an estuarine mngrove<br />
community. Bull. Mar. Sci.<br />
22(3) :671-738.
Odum, W.E., C.C. Mclvor, and T. J. Smith,<br />
111. 1982. <strong>The</strong> ecology <strong>of</strong> the mangroves<br />
<strong>of</strong> south <strong>Florida</strong>: A community<br />
pr<strong>of</strong>ile. U.S. Fish Wildl. Serv.<br />
FWS/OBS-81-24. 144 PP*<br />
Officer, C.B., R.B. Biggs, J.C. Taft,<br />
L.E. Cronin, M.A. Tyler, and W.A.<br />
Boynton . 1984. Chesapeake <strong>Bay</strong><br />
anoxia: origi n, development and<br />
significance. Science 223:22-27.<br />
Olson, J.C.W. 1953. <strong>Tampa</strong> <strong>Bay</strong> studies.<br />
Fla. State Univ. Oceanogr. Inst. Rep.<br />
1, Contrib. 19. 27 pp.<br />
Olson, J.C.W., and J.B. Morrill. 1955.<br />
Literature survey <strong>of</strong> the <strong>Tampa</strong> <strong>Bay</strong><br />
area. Fla. State Univ. Oceanogr.<br />
Inst. Rep. Tallahassee. (mimeo.)<br />
Orth, R.J., and K.A. Moore. 1983. Submerged<br />
vascular plants: techniques<br />
for analyzing their distribution and<br />
a bundance. Mar. Tech. Soc. J.<br />
17(2) :38-52.<br />
Orth, R.J., and J. Van Montfrans. 1984.<br />
Epiphyte-seagrass relationships with<br />
an emphasis on the role <strong>of</strong> micrograzing:<br />
a review. Aquat. Bot. 18:43-<br />
69.<br />
0s tenfeld, C.H. 1905. Prel imi nary<br />
remarks on the distribution and biology<br />
<strong>of</strong> the Zostera <strong>of</strong> the Danish<br />
Seas. Bot. T%%%'lF. 27:123-125.<br />
Palmer, C.E. 1978. Appendix C -<br />
Climate. Pages C-1 to C-44 in 1978<br />
Executive summry . Southwest T orida<br />
Water Management District,<br />
Brooksvi 1 le.<br />
Patton, G.W. 1980. Studies <strong>of</strong> the west<br />
Indian manatee (~richechus manatus) in<br />
<strong>Tampa</strong> <strong>Bay</strong> (<strong>Florida</strong>). Mote Mar. Lab.<br />
Sarasota, FL.<br />
Paul, R.T., and G.E. woolfenden. 1985.<br />
Current status and recent trends in<br />
bird populations <strong>of</strong> <strong>Tampa</strong> <strong>Bay</strong>. Pages<br />
426-447 in S.F. Treat, J.L. Simon,<br />
R.R. Lewis111, and R.L. Whi'tman, Jr.,<br />
eds. Proceedings, <strong>Tampa</strong> <strong>Bay</strong> area<br />
scientific infomation symposium (May<br />
1982). Burgess Publishing Co., Inc.,<br />
Minneapolis, MN. Available from <strong>Tampa</strong><br />
BASIS, Post Office Box 290197, <strong>Tampa</strong>,<br />
FL 33687.<br />
Peek, H.M. 1959. <strong>The</strong> artesian water <strong>of</strong><br />
the Ruskin area <strong>of</strong> Hillsborough<br />
County, <strong>Florida</strong>. Fla. Geol. Surv.<br />
Rep. Invest. 21. Tal lahassee.<br />
Phillips, G.L., D. Eminson, and B. bbss.<br />
1978. A mechanism to account for<br />
macrophyte decl i ne in progressively<br />
eutrophi cated f res hwa ters . Aqua t.<br />
Bot. 4:103-126.<br />
Phillips, R.C. 1960a. <strong>Ecology</strong> and distribution<br />
<strong>of</strong> marine algae found in<br />
<strong>Tampa</strong> <strong>Bay</strong>, Boca Ciega <strong>Bay</strong>, and at<br />
Tarpon Springs, Fla. Q. J. Fla. Acad.<br />
Sci . 23(4) :222-260.<br />
Phil 1 ips , R.C. 1960b. Observations on<br />
the ecology and distribution <strong>of</strong> the<br />
<strong>Florida</strong> seagrasses. Fla. State Board<br />
Conserv. Mar. Lab. Pr<strong>of</strong>. Pap. Ser. 2.<br />
27 PP.<br />
Phillips, R.C. 1962. Distribution <strong>of</strong><br />
seagrasses in <strong>Tampa</strong> <strong>Bay</strong>, <strong>Florida</strong>.<br />
Fla. State Board Canserv. FBr. Lab.<br />
Spec. Sci. Rep. 6. 12 pp.<br />
Phillips, R.C., and R.R. Lewis. 1983.<br />
Influence <strong>of</strong> environmental gradients<br />
on variations in leaf widths and<br />
transplant success in North American<br />
seagrasses. J. Mar. Tech. Soc.<br />
17(2) : 59-68.<br />
Phillips, T.D., and R.H. Blanchet.<br />
1980. A study <strong>of</strong> selected mroplankton<br />
species <strong>of</strong> lower <strong>Tampa</strong> <strong>Bay</strong>.<br />
Pages 4-47 in S. khadevan, ed. 316(a)<br />
and (b) -hemonstratlon, Big Bend<br />
station, Unit 4, <strong>Tampa</strong> Electric Co.<br />
Stone & Webster Engr. Corp. Val. 2,<br />
Appendix 1.<br />
Phillips, T.D., J.M. Lyons, J.M. Daily,<br />
and M. Sigurdson. 1977. A stuctgr <strong>of</strong><br />
i chthyopl ank ton seasonal i ty and entrainment<br />
by the Big Bend Power Plant,<br />
<strong>Tampa</strong> <strong>Bay</strong>, <strong>Florida</strong>. Pages 51-128 in<br />
R.D. Garrity, W.3. Tiffany, and<br />
Ma hadevan , eds . Ecol ogi cat stud4 es at<br />
Big Ben steam electric station (Tanpa<br />
Electric Gmpany): An analysis and<br />
summary <strong>of</strong> studies on the effects <strong>of</strong>
the cooling water systm on aquatic<br />
fauna. Vol. 3.<br />
Polgar, T.T., J.K. Summers, R.A.<br />
Cummins, K.A. Rose, and D.G. Heimbuch.<br />
1985. Investigation <strong>of</strong> re1 a tionships<br />
among pollutant loadings and fish<br />
stock levels in northeastern es tuaries.<br />
Estuaries 8:125-135.<br />
Pomeroy , L . R. 1960. Primary productivity<br />
in Boca Ciega <strong>Bay</strong>, <strong>Florida</strong>.<br />
Bull. hr. Sci. Gulf. Caribb. lO(1):<br />
1- 10.<br />
Provost, M.W. 1967. Pnanagi ng impounded<br />
salt marsh for mosquito control and<br />
estuarine resource conservation.<br />
Pages 163-171 in Marsh estuarine<br />
symposium. ~ouisana State University,<br />
Baton Rouge.<br />
Provost, M.W. 1974. Mean high water<br />
mark and use <strong>of</strong> tidelands in <strong>Florida</strong>.<br />
Earth Space Sci. 36(1) :50-66.<br />
Rainwater, E.H. 1960. Stratigraphy and<br />
its role in the future exploration for<br />
oil and gas in the gulf coast. Trans.<br />
Gulf Coast. Assoc. Petrol. Geol.<br />
10:33-75.<br />
Reeve, M.R., and M.A. Walter. 1977.<br />
Observations on the existence <strong>of</strong> lower<br />
threshhol d and uouer critical food<br />
concentrations for' the copepod Acartia<br />
tonsa Dana. J. Exp. Plar. Bi 01 . Ecol .<br />
29:211-221.<br />
Reynolds, J.E., and G.W. Patton. 1985.<br />
Marine mammals, reptiles and amphibians<br />
<strong>of</strong> <strong>Tampa</strong> <strong>Bay</strong> and adjacent coastal<br />
waters <strong>of</strong> the Gulf <strong>of</strong> Mexico. Pages<br />
448-459 in S.F. Treat, J.L. Simon,<br />
R.R.<br />
~ewi111, and R.L.<br />
Whi tman, Jr.,<br />
eds . Proceedings , <strong>Tampa</strong> <strong>Bay</strong> area scientific<br />
informtion symposium (May<br />
1982). Burgess Publishing Co., Inc.,<br />
Minneapolis, MN. Available from Talrpa<br />
BASIS, Post Office Box 290197, <strong>Tampa</strong>,<br />
FL 33687.<br />
Robinson, D.E. 1985. Variabil i ty in<br />
the vertical distribution <strong>of</strong><br />
ichthyoplankton in lower <strong>Tampa</strong> <strong>Bay</strong>.<br />
Pages 359-383 in S.F. Treat, J.L.<br />
Simon, R.R. Lewis 111, and R.L.<br />
Whi tman, Jr., eds. Proceedings , <strong>Tampa</strong><br />
<strong>Bay</strong> area scientific information symposium<br />
(May 1982). Burgess Pub1 ishing<br />
Co., Inc., Minneapolis, MN. Available<br />
from <strong>Tampa</strong> BASIS, Post Office Box<br />
290197, <strong>Tampa</strong>, FL 33687.<br />
Rosenau, J.C., G.L. Fau1 kner, C.W.<br />
Hendry, Jr., and R.W. Hall. Springs<br />
<strong>of</strong> <strong>Florida</strong>. Fla. Bur. Geol. Bull. 31.<br />
Tal la hassee.<br />
Rosenshein, J.S., C.R. Goodwin, and A.<br />
Jurado. 1977. Bottom configuration<br />
and environment <strong>of</strong> <strong>Tampa</strong> <strong>Bay</strong>.<br />
Photogr. Eng. Remote Sensing 43(6) :<br />
69 3- 699.<br />
Ross, B.E., M.A. Ross, and P.D. Jerkins.<br />
1984. Wasteload allocation study,<br />
<strong>Tampa</strong> <strong>Bay</strong>, <strong>Florida</strong>. <strong>Florida</strong> Department<br />
<strong>of</strong> Environmental Regulation,<br />
Tallahassee. Vol . 1-4.<br />
Ross, F.W. 1975. Sedimentary<br />
structures and animal -sediment<br />
relationships: Old <strong>Tampa</strong> <strong>Bay</strong>. M.S.<br />
<strong>The</strong>sis (unpubl .) , University <strong>of</strong> South<br />
<strong>Florida</strong>, <strong>Tampa</strong>. 129 pp.<br />
Roush, R.B. 1985. Terraces and soils<br />
<strong>of</strong> the <strong>Tampa</strong> <strong>Bay</strong> area. Pages 33-52 in<br />
S.F. Treat, J.L. Simon, R.R. Lewis<br />
111, and R.L. Whitman, Jr., eds.<br />
Proceedings, <strong>Tampa</strong> <strong>Bay</strong> area scientific<br />
information symposium (May 1982).<br />
Burgess Publishing Co., Inc.,<br />
Minneapolis, MN. Available from <strong>Tampa</strong><br />
BASIS, Post Office Box 290197, <strong>Tampa</strong>,<br />
FL 33687.<br />
Ryder, P.D. 1982. Digital model <strong>of</strong><br />
predevelopment flm in the tertiary<br />
1 imes tone (<strong>Florida</strong>) aquifer system in<br />
west-central <strong>Florida</strong>. U. S. Geol .<br />
Surv. Water Resour. Invest. 81-54.<br />
Rice, J.D., R.P. Trocine, and G.N. Saloman, C.H., and J.L. Taylor. 1972.<br />
We1 1s. 1983, Factors influencing Hydrographic observations in <strong>Tampa</strong><br />
seagrass ecology in the Indian River <strong>Bay</strong>, <strong>Florida</strong> - 1969. Natl. Mar. Fish.<br />
Lagoon. Fla. Sci. 46(3/4) :276-286. Serv., Data Rep. 73:l-82.
Sanders, M.L. 1980. <strong>The</strong> great freeze<br />
<strong>of</strong> 1894-95 in Pinellas County. <strong>Tampa</strong><br />
<strong>Bay</strong> History 2(1):5-14.<br />
Sand-Jensen, K. 1977. Effect <strong>of</strong> epiphytes<br />
on eel grass photosynthesis.<br />
Aquat. Bot. 3:55-63,<br />
Santos, S.L., and J.L. Simon. 1974.<br />
Distribution and abundance <strong>of</strong> the<br />
polychaetous annelids in a south<br />
<strong>Florida</strong> estuary. Bull. Mar. Sci.<br />
24(3) :669-689.<br />
Santos, S.L., and J.L. Simon. 1980a.<br />
Marine s<strong>of</strong>t-bottom ccnnmuni ty estab-<br />
1 ishrnent fol lowing annual defaunation:<br />
larval or adult recruitment Mar,<br />
Ecol . Prog. Ser. 2:235-241.<br />
Santos, S.L., and J.L. Simon. 1980b.<br />
Response <strong>of</strong> s<strong>of</strong> t-bottom benthos to<br />
annual catastrophic disturbance in a<br />
south <strong>Florida</strong> estuary. Mar. Ecol.<br />
Prog. Ser. 3:347-355.<br />
Scholl, D.W., and M. Stuvier. 1967.<br />
Recent submergence <strong>of</strong> southern<br />
<strong>Florida</strong>: A comparison with adjacent<br />
coasts and other eustatic data. Geol.<br />
Soc. Pm, Bull. 78:437-454.<br />
Schreiber, R.W. 1979. Reproductive<br />
~erformance <strong>of</strong> the eastern brown<br />
pelican Pelecanus occidentalis.<br />
Contrib. Sci. Nat. Hist. as. Los<br />
Angeles Co. No. 317:l-43.<br />
Schreiber, R.W., and E.A. Schreiber.<br />
1978. Colonial bird use and plant<br />
succession on dredged material is1 ands<br />
in <strong>Florida</strong>. Vol. I. Sea and wading<br />
bird colonies. U.S. Army Corps <strong>of</strong><br />
Engineers Wa te ways Experiment<br />
Station, Vicksburg, MS. 63 pp. +<br />
appendices.<br />
Schrei ber, R.W., and E.A. Schrei ber.<br />
1983. Use <strong>of</strong> age classes in rnonitoring<br />
population stability <strong>of</strong> brmn<br />
pelicans. J. Wildl. Manage. 47:105-<br />
111.<br />
Sheldon, R.B., and C.W. Boylen. 1977.<br />
Maximum depth inhabited by aquatic<br />
vascular plants. Am. Midl. Nat.<br />
97(10) ~248-254.<br />
Simon, J.L. 1974. <strong>Tampa</strong> <strong>Bay</strong> estuarine<br />
system - a synopsis. Fla. Sci. 37(4):<br />
217-245.<br />
Simon, J.L. 1979. <strong>Tampa</strong> Harbor deepening<br />
project sensitive areas and<br />
benthic monitoring. <strong>Tampa</strong> Port<br />
Authority, FL. 62 pp.<br />
Simon, J.L., and D.M. Dauer. 1972. A<br />
quantitiative evaluation <strong>of</strong> red tide<br />
induced mass mrtalities <strong>of</strong> benthic<br />
invertebrates in <strong>Tampa</strong> <strong>Bay</strong>, <strong>Florida</strong>.<br />
Envi ron. Lett. 3:229-234.<br />
Simon, J.L., and D.M. Dauer. 1977. Reestabl<br />
i shnent <strong>of</strong> a benthic community<br />
fol 1 owing natural defaunation. Pages<br />
139-154 in B.C. Coull, ed. <strong>Ecology</strong> <strong>of</strong><br />
marine bGthos. University <strong>of</strong> South<br />
Carolina Press, Columbia.<br />
Simon, J.L., and S.K. Mahadevan. 1985.<br />
Benthic macroinvertebrates <strong>of</strong> <strong>Tampa</strong><br />
<strong>Bay</strong>. Page 384 in S.F. Treat, J.L.<br />
Simon, R.R. ~ewTs 111, and R.L.<br />
Whi tman, Jr., eds. Proceedings, <strong>Tampa</strong><br />
<strong>Bay</strong> area scientific information symposium<br />
(May 1982). Burgess Publ ishing<br />
Col., Inc., Minneapolis, MN. Available<br />
from <strong>Tampa</strong> BASIS, Post Office Box<br />
290197, <strong>Tampa</strong>, FL 33687.<br />
Sipe, N.G., and D.P. Swaney. 1974.<br />
Energy basis for Hi1 lsborough County:<br />
a current and historic analysis.<br />
Hi1 1s borough County Envi ronrnental Protection<br />
Commission. University <strong>of</strong><br />
<strong>Florida</strong>, Gainesvil le. 87 pp.<br />
Smeltz, A. 1897. Oyster bars <strong>of</strong> the<br />
west coast <strong>of</strong> <strong>Florida</strong> - their depletion<br />
and restoration. Bull. U.S.<br />
Fish. Comm. 17:305-308.<br />
Spence, D.H.N. 1975. Light and plant<br />
response in freshwater. Pages 93-133<br />
- in G.C. Evans, R. Bainbridge, and P.<br />
Rackham, eds. Light as an ecological<br />
factor. Blackwell Scientific Publ .<br />
Oxford .<br />
Springer, V.G., and A.J. McEr'lean.<br />
1961. Notes on and additions to the<br />
fish fauna <strong>of</strong> the <strong>Tampa</strong> <strong>Bay</strong> area.<br />
Copei a 4 ~480-482.
Springer, V.G., and K.D. Woodburn.<br />
1960. An ecological study <strong>of</strong> the<br />
fishes <strong>of</strong> the <strong>Tampa</strong> <strong>Bay</strong> area. Fla.<br />
State Board Conserv. Mar. Lab. Pr<strong>of</strong>.<br />
Pap. Ser. 1. 104 pp.<br />
Stahl, L.E. 1970. Fbrine geology <strong>of</strong><br />
<strong>Tampa</strong> <strong>Bay</strong>. M.S. <strong>The</strong>sis, <strong>Florida</strong> State<br />
University, Tallahassee.<br />
Steidi nger, K.A., and W.E. Gardi ner.<br />
1985. Phytoplankton <strong>of</strong> <strong>Tampa</strong> <strong>Bay</strong>: a<br />
review. Pages 147-183 in S.F. Treat,<br />
J.L. Simon, R.R. ~ewis-f-11, and R.L.<br />
Whitman, Jr., eds., Proceedings, <strong>Tampa</strong><br />
<strong>Bay</strong> area scientific information symposium<br />
(May 1982). Burgess Pub1 ishing<br />
Co., Inc., Minneapolis, MN. Available<br />
from <strong>Tampa</strong> BASIS, Post Office Box<br />
290197, <strong>Tampa</strong>, FL 33687.<br />
Steidinaer. K.A., and J. Williams.<br />
4 -<br />
1964. ~~mnodinium brevis Davis.<br />
<strong>Florida</strong> Board Conserv. Leaf1 . Ser.:<br />
Plankton. l(1A).<br />
Stoner, A.W., and R. J. Livings ton.<br />
1986. Ontogenetic patterns in diet<br />
and feeding morphology in sympatric<br />
sparid fishes from seagrass meadows.<br />
Copeia 1: 179-187.<br />
Stout, J.P. 1984. <strong>The</strong> ecology <strong>of</strong><br />
irregularly flooded salt marshes <strong>of</strong><br />
the northeastern Gulf <strong>of</strong> Mexico: a<br />
community pr<strong>of</strong>ile. U.S. Fish Wildl.<br />
Serv. Biol. Rep. 85(7.1). 98 pp.<br />
Subrahrnanyam, C.B., and S.H. Drake.<br />
1975. Studies on the animal cmunities<br />
in two North <strong>Florida</strong> salt<br />
marshes. I. Fish communities. Bull.<br />
Mar. Sci. 25:445-465.<br />
Subrahmanyam, C.B., W.L. Kruczynski, and<br />
S.H. Drake. 1976. Studies on the<br />
animal communities in two North<br />
<strong>Florida</strong> salt marshes, 11. Macroinvertebrate<br />
communities, Bull. Mar.<br />
Sci. 26:172-195.<br />
Summers, J.K., T.T. Polgar, J.A. Tarr,<br />
K.P.. Rose, D.G. Heimbtlch, J. McCurley,<br />
R.A. Cummins, G.F. Johnson, K.T.<br />
Yetman, and G.T. DiNardo. 1985.<br />
Reconstruction <strong>of</strong> long-term time<br />
serjes for commercial fisheries abun-<br />
dance and estuarine pol 1 ution loadings.<br />
Estuaries 8:114-124.<br />
Swanson, R.L. 1974. Variability <strong>of</strong><br />
tidal datums and accuracy in deterrnining<br />
datums from short series <strong>of</strong> observations.<br />
NOAA Tech. Rep. 64.<br />
Sykes, J.E., and J.H. Finucane. 1966.<br />
Occurrence in <strong>Tampa</strong> <strong>Bay</strong>, <strong>Florida</strong> <strong>of</strong><br />
immature species donii nant in Gulf <strong>of</strong><br />
Mexico commercial fisheries. U.S.<br />
Fish Wild. Serv. Fish. Bull.<br />
65(2) :369-379.<br />
Tabb, D.C. 1961. A contribution to the<br />
bioloav <strong>of</strong> the s~otted seatrou t,<br />
Cynos
Taylor, J.L., J.R. Hall, and C.H.<br />
Saloman. 1970. Mollusks and benthic<br />
environments in Hi1 lsborough <strong>Bay</strong>.<br />
<strong>Florida</strong>. U.S. Fish Wildl. Serv. Fish,<br />
Bull. 68(2) :191-202.<br />
Thompson, M.H. 1978. Species composition<br />
and distribution <strong>of</strong> seagrass beds<br />
in the Indian River Lagoon, <strong>Florida</strong>.<br />
Fla. Sci. 41(2):90-96.<br />
Toler, L.G. 1967. Fluoride in water<br />
in the Alafia and Peace River basins,<br />
<strong>Florida</strong>. Fla. Geol. Surv. Rep.<br />
Invest. 46. Tall ahassee.<br />
Treat, S.F., J.L. Simon, R.R. Lewis 111,<br />
and R.L. Whitman, Jr., eds. 1985.<br />
Proceedings, <strong>Tampa</strong> <strong>Bay</strong> area scientific<br />
information symposium (May 1982).<br />
Burgess Pub1 ishing Co., Inc.,<br />
Minneapolis, MN. Available from <strong>Tampa</strong><br />
BASIS, Post Office Box 290197, <strong>Tampa</strong>,<br />
FL 33687.<br />
Turner, J.F. 1979. Steamflow simulation<br />
studies <strong>of</strong> the Hillsborough,<br />
Alafia, and Anclote Rivers, west<br />
Central <strong>Florida</strong>. U.S. Geol. Surv.<br />
Water Resour. Invest. 78-102.<br />
Turner, J .T. 1972. <strong>The</strong> phytopl ank ton<br />
<strong>of</strong> the <strong>Tampa</strong> <strong>Bay</strong> system, <strong>Florida</strong>.<br />
M.S. <strong>The</strong>sis, University <strong>of</strong> South<br />
<strong>Florida</strong>. 188 pp.<br />
Turner, J.T., and T.L. Hopkins. 1974.<br />
Phytoplankton <strong>of</strong> the <strong>Tampa</strong> <strong>Bay</strong> system,<br />
<strong>Florida</strong>. Bull. Mar. Sci, 24:lOl-121.<br />
Turner, R.E. 1977. Intertidal vegetation<br />
and commercial yields <strong>of</strong> penaeid<br />
shrimp. Trans. Am. Fish. Soc.<br />
106:411-416.<br />
Turner, R.E. 1982. Wetland losses and<br />
coastal fisheries: an enigmatic and<br />
economi cal ly siqni f icant de~endencv<br />
Louisiana State- Univ., at on ~ouge.<br />
CEL-SG-82-010.<br />
Twilley, R.R.3 W.M. Kemp, K.W. Staver,<br />
J.C. Stevenson, and W.R. Boynton.<br />
1985. Nutrient enrichment <strong>of</strong><br />
estuarine submersed vascular plant<br />
communities. 1. Algal growth and<br />
effects on production <strong>of</strong> plants and<br />
.<br />
associated communities. Mar. Ecol.<br />
Prog. Ser. 23 :179-191.<br />
University <strong>of</strong> South <strong>Florida</strong>. 1970.<br />
Impacts <strong>of</strong> dredging and filling on<br />
bays and estuaries <strong>of</strong> <strong>Florida</strong>. Proceedings<br />
<strong>of</strong> Workshops in 1968 and<br />
1969, sponsored by the U.S.F. Center<br />
for Continuing Education. <strong>Tampa</strong>.<br />
Van der Eijk, M. 1979. <strong>The</strong> Dutch<br />
Wadden Sea. Pages 197-228 in M.J.<br />
Dunbar, ed. brine production-mchanisms.<br />
Int. Biol. Programme Vol.<br />
Prog . 20. Cambridge University Press,<br />
New York.<br />
Van Pbntfrans, J., R.J. Orth, and S.A.<br />
Vay. 1982. Prel imi nary studies <strong>of</strong><br />
grazing by Bi ttium varium on eel grass<br />
periphyton. ~ q u a t x t . 14:75-89.<br />
Van Vleet, E.S. 1985. Hydrocarbons in<br />
<strong>Tampa</strong> <strong>Bay</strong>: a review. Pages 130-146<br />
- in S.F. Treat, J.L. Simon, R.R. Lewis<br />
111, and R.L. Whi tman, Jr., eds.<br />
Proceedings , <strong>Tampa</strong> <strong>Bay</strong> area scientific<br />
information symposium (May 1982).<br />
Burgess Publishing Co., Inc.,<br />
Minneapolis , MN. Available from <strong>Tampa</strong><br />
BASIS, Post Office Box 290197, <strong>Tampa</strong><br />
FL 33687.<br />
Vernon, R.O. 1951. <strong>The</strong> geology <strong>of</strong><br />
Citrus and Levy Counties, <strong>Florida</strong>.<br />
Fla. Geol . Surv. hl1. 33. 256 pp.<br />
Vi rnstein, R,W ., P.S. Mi kkelsen, K.D.<br />
Cairns, and M.A. Capone. 1983.<br />
Seagrass beds versus sand bottoms:<br />
the trophic importance <strong>of</strong> their<br />
associated benthic invertebrates .<br />
Fla. Sci . 46(3/4) :363-381.<br />
Vishner, F.N., and G.H. Hughes. 1969.<br />
Difference between rainfall and potential<br />
evaporation in <strong>Florida</strong>. U.S.<br />
Geol. Surv. Flap Ser. No. 32.<br />
Wehle, J.R. 1978. District water rnanagement<br />
plan. 1978. Appendix D:<br />
Hydrogeology. Southwest <strong>Florida</strong> Water<br />
Management District, Brooksville*<br />
Weiss, W.R., E.P. Wilkins, and D.N,<br />
Perkey. 1979. Entrainment and<br />
impingement monitoring program, A.M.<br />
Higgins power plant. Final Rep. for
Fla. Power Corp., St. Petersburg, by<br />
lVUS Corp., Clearwater. 177 pp.<br />
Weiss, W.R., and T.D. Phillips. 1985.<br />
Fkroplankton and the <strong>Tampa</strong> <strong>Bay</strong> system.<br />
Pages 345-358 fi S.F. Treat, J.L.<br />
Simon, R.R. Lewis 111, and R.L.<br />
Whitman, Jr., eds. Proceedings, <strong>Tampa</strong><br />
Ray area scientific infomation sflposium<br />
(May 1982). Burgess Publishing<br />
Co., Inc., Minneapolis, MN. Available<br />
from <strong>Tampa</strong> BASIS, Post Off ice Box<br />
290197, <strong>Tampa</strong>, FL 33687.<br />
Wenner, E.L., D.M. Knott, R.F. Van<br />
Dulah, and V.G. Burrell, Jr. 1983.<br />
Invertebrate ccmmunities associated<br />
with hard bottom habitats in the South<br />
Atlantic bight. Estuar. Coastal Shelf<br />
Sci. 17:143-158.<br />
Larlite, W.A, 1953, Some geomorphic features<br />
<strong>of</strong> central peninsula <strong>Florida</strong>.<br />
Fla. Geol . Surv. Bull. No. 41. 92 pp.<br />
kfhite, W.A. 1970. Geomorphology <strong>of</strong> the<br />
Florid6 peninsula. Fla. Bur. Geol.<br />
Bull. 51. 164 pp.<br />
Wilhelm, 0,, and M. Ewing. 1972. Geology<br />
and history <strong>of</strong> the Gulf <strong>of</strong><br />
Mexico. Geol. Soc. ILn. Bull. 83(3):<br />
55l-934,<br />
W'illSams, S.L., and C.P. McRoy. 1982.<br />
Seagrass productivity: the effect <strong>of</strong><br />
light: on carbon uptake. Aquat. Bot.<br />
12:321-344.<br />
Wi11inmson, G.R., and E.C. Mosura.<br />
197eJ- Cold stress on nnngroves in<br />
<strong>Tampa</strong> Uay, <strong>Florida</strong>. <strong>Tampa</strong> Port<br />
Authority, 63 pp.<br />
Wflson, W.E., and J.M. Gerhart. 1980.<br />
SSniulated effects <strong>of</strong> groundwater<br />
dcvelnwent on potentiometri c surface<br />
<strong>of</strong> the <strong>Florida</strong> Aquifer, west central<br />
<strong>Florida</strong>. U.S. Geol. Surv. Water<br />
Resour. Invest. Open File Rep. 79-<br />
1271.<br />
Windsor, J.G., Jr. 1985. Nationwide<br />
review <strong>of</strong> oxygen depletion and eutrophication<br />
in estuarine and coastal<br />
waters: <strong>Florida</strong> region. Project<br />
report Brookhaven <strong>National</strong> Laboratory,<br />
Upton, NY. 177 pp.<br />
Woolfenden, G.E., and R.W. Schreiber.<br />
1973. <strong>The</strong> cmmon birds <strong>of</strong> the saline<br />
habitats <strong>of</strong> the eastern Gulf <strong>of</strong><br />
Mexico:<br />
their distribution, seasonal<br />
status , and breeding ecol ogy . Pages<br />
1115-1 through 1115-22 in J.I. Jones,<br />
R.E. Ring, M.L. ~inkx, and R.E.<br />
Smith, eds. A summary <strong>of</strong> knowledge <strong>of</strong><br />
the eastern Gulf <strong>of</strong> Mexico 1973.<br />
State University System <strong>of</strong> <strong>Florida</strong><br />
Institute <strong>of</strong> Oceanography, St.<br />
Peters burg.<br />
Wooten, G.R. 1985. Meteorology <strong>of</strong><br />
<strong>Tampa</strong> <strong>Bay</strong>. Pages 19-26 in S.F. Treat,<br />
J.L. Simon, R.R. Lewis III, and R.L.<br />
Whi tman, Jr., eds. Proceedings, <strong>Tampa</strong><br />
<strong>Bay</strong> area scientific information symposium<br />
(May 1982). Burgess Publishing<br />
Co., Inc., Minneapolis, MN. Available<br />
from <strong>Tampa</strong> BASIS, Post Office Box<br />
290197, <strong>Tampa</strong>, FL 33687.<br />
Zieman, J.C. 1976. <strong>The</strong> ecological<br />
effects <strong>of</strong> physical damage from motorboats<br />
on turtle grass beds in southern<br />
<strong>Florida</strong>. Aquat. Bot. 2:127-139.<br />
Zieman, J.C. 1982. <strong>The</strong> ecology <strong>of</strong> the<br />
seagrasses <strong>of</strong> south <strong>Florida</strong>: a community<br />
pr<strong>of</strong>ile. U.S. Fish Wildl.<br />
Serv. FWS/OBS-82/85. 158 pp.<br />
Zimmerman, Re, R. Gibson, and J.<br />
Harrington. 1979. Herbivory and<br />
detri tivory among gammaridean amphipods<br />
from a <strong>Florida</strong> seagrass cmmunity.<br />
Mar. Biol . (Berl .) 54:41-47.
<strong>The</strong> <strong>Ecology</strong> <strong>of</strong> <strong>Tampa</strong> <strong>Bay</strong>, <strong>Florida</strong>:<br />
An Estuarine Pr<strong>of</strong>ile<br />
XMangrove Systems, Inc. 2Mote Marine Laboratory<br />
P. 0. Box 290197 1600 City Island Park<br />
<strong>Tampa</strong>, FL 33687 Sarasota, FL 33577<br />
-<br />
12. Sponsorins Or8aniratlun Name and Address<br />
U.S. Department <strong>of</strong> the Interior<br />
Fish and Wildlife Service<br />
<strong>National</strong> <strong>Wetlands</strong> Research Center<br />
Washington, DC 20240<br />
.- --<br />
IS. Supplementary Notes<br />
* -<br />
16. Abstract (Limit: 200 words)<br />
j13. Type <strong>of</strong> Report P Period Cwersd<br />
I<br />
<strong>Tampa</strong> <strong>Bay</strong> is <strong>Florida</strong>'s largest open-water estuary and one <strong>of</strong> the most highly<br />
urbanized. This report summarizes and synthesizes many years <strong>of</strong> scientific<br />
i nvcstigation into <strong>Tampa</strong> <strong>Bay</strong>' s geology, hydro1 ogy and hydrography, water<br />
chemistry, and biotic components. <strong>The</strong> estuary is a phytoplankton-based system,<br />
with mangroves being the second most important primary producer. Benthic<br />
organisms are abundant and diverse, although in parts <strong>of</strong> the bay the<br />
benthos consists <strong>of</strong> a relatively few opportunistic and pollution indicator<br />
species. <strong>The</strong> estuary provides habitat for the juveniles and adults <strong>of</strong> a<br />
number <strong>of</strong> commercial and recreational fi shery species. Significant changes<br />
occurring as a result <strong>of</strong> urbanization and industrialization include significant<br />
declines in intertidal wetlands and seagrass meadows, changes in circulation<br />
and f 1 ushing, and degradation <strong>of</strong> water qua1 ity. Important management issues<br />
include dredge and f i 11 operations, restoration <strong>of</strong> fisheries, increasing<br />
freshwater flow to the bay, and eutrophication.<br />
--<br />
17. Document Analysis a. Descriptors<br />
Estuary Cl imatology Hydro1 ogy<br />
Geology Biology Fishes<br />
Invertebrates Benthos Seagrasses<br />
Mangroves<br />
b. ldenttfienfOpen.Ended Terms<br />
<strong>Tampa</strong> <strong>Bay</strong> Mi croa 1 gae Eutrophication<br />
Wet1 ands<br />
Zooplankton<br />
Phytoplankton Dredge and Fi 11<br />
I Unlimited<br />
I Unclassified<br />
I-Iars (This Page) 1 Zt. Price<br />
L I Unclassified<br />
I<br />
(Sea ANSI-239.18)<br />
OF~~OYAL FORM 272 (4-17)<br />
(Formarly NllS.35)<br />
~bunamsnt d cammme


