Lesson 34: Photoelectric Effect Graphs
Lesson 34: Photoelectric Effect Graphs
Lesson 34: Photoelectric Effect Graphs

You also want an ePaper? Increase the reach of your titles
YUMPU automatically turns print PDFs into web optimized ePapers that Google loves.
<strong>Lesson</strong> <strong>34</strong>: <strong>Photoelectric</strong> <strong>Effect</strong> <strong>Graphs</strong><br />
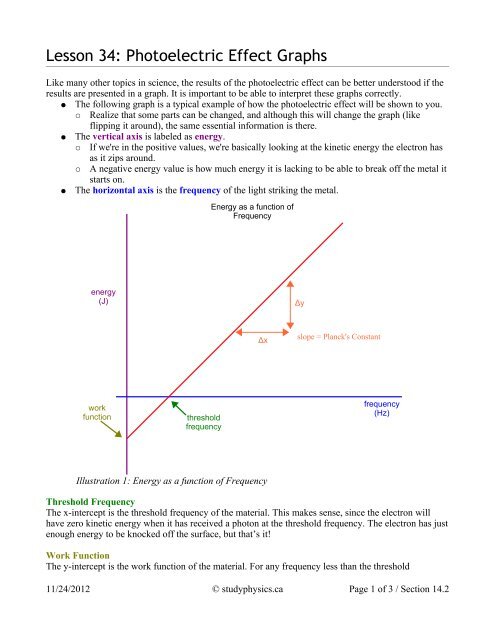
Like many other topics in science, the results of the photoelectric effect can be better understood if the<br />
results are presented in a graph. It is important to be able to interpret these graphs correctly.<br />
● The following graph is a typical example of how the photoelectric effect will be shown to you.<br />
○ Realize that some parts can be changed, and although this will change the graph (like<br />
flipping it around), the same essential information is there.<br />
● The vertical axis is labeled as energy.<br />
○ If we're in the positive values, we're basically looking at the kinetic energy the electron has<br />
as it zips around.<br />
○ A negative energy value is how much energy it is lacking to be able to break off the metal it<br />
starts on.<br />
● The horizontal axis is the frequency of the light striking the metal.<br />
Energy as a function of<br />
Frequency<br />
energy<br />
(J)<br />
Δy<br />
Δx<br />
slope = Planck's Constant<br />
work<br />
function<br />
threshold<br />
frequency<br />
frequency<br />
(Hz)<br />
Illustration 1: Energy as a function of Frequency<br />
Threshold Frequency<br />
The x-intercept is the threshold frequency of the material. This makes sense, since the electron will<br />
have zero kinetic energy when it has received a photon at the threshold frequency. The electron has just<br />
enough energy to be knocked off the surface, but that’s it!<br />
Work Function<br />
The y-intercept is the work function of the material. For any frequency less than the threshold<br />
11/24/2012 © studyphysics.ca Page 1 of 3 / Section 14.2
frequency, it’s like the electron is in a deep hole. As the frequency goes from zero to higher values, the<br />
electron is lifted higher out of the hole, until finally at its threshold frequency it’s out. When there are<br />
no photons hitting it (frequency = 0 Hz), it is completely attached to the material. This is why they<br />
appear as negative values on the graph.<br />
Planck’s Constant<br />
If you look at the values you would use to calculate the slope of the line (Δx and Δy), you’ll notice that<br />
the “rise over run” would be a change in energy over a change in frequency. Look at the formula E = hf<br />
and solve for energy over frequency… what do you get<br />
E=hf slope= y<br />
h= E x =rise run<br />
and<br />
f<br />
slope= E f<br />
So the slope of the graph will always be Planck’s constant.<br />
Example 1: The following graph shows the effect of shining different frequencies of light on three<br />
different metals. The metals and their work functions are copper (4.70eV), calcium (2.90eV), and<br />
selenium (5.11eV). Identify which line represents each metal.<br />
Energy as a function of<br />
Frequency<br />
energy<br />
(J)<br />
frequency<br />
(Hz)<br />
From the formula for work function (W = hf o ) we know that the bigger the work function, the<br />
bigger the threshold frequency. Therefore, the lines are...<br />
calcium (2.90eV)<br />
copper (4.70eV)<br />
selenium (5.11eV)<br />
11/24/2012 © studyphysics.ca Page 2 of 3 / Section 14.2
You can even relate the photoelectric effect formula to the formula for a straight line graph if it helps<br />
you remember what the three parts of the graph represent.<br />
hf = E kmax + W<br />
E kmax = hf – W<br />
y = mx + b<br />
●<br />
●<br />
●<br />
●<br />
The y axis is E kmax<br />
The slope (m) is Planck's Constant (h)<br />
The x axis is the frequency<br />
The y intercept is the work function (W)<br />
Homework<br />
p720 #8-10<br />
11/24/2012 © studyphysics.ca Page 3 of 3 / Section 14.2