Diamond Detectors for Ionizing Radiation - HEPHY
Diamond Detectors for Ionizing Radiation - HEPHY
Diamond Detectors for Ionizing Radiation - HEPHY

You also want an ePaper? Increase the reach of your titles
YUMPU automatically turns print PDFs into web optimized ePapers that Google loves.
CHAPTER 7. RADIATION HARDNESS 42<br />
d c<br />
Summary @ 1V/µm<br />
Mean Charge per β - [e - ]<br />
6000<br />
5000<br />
4000<br />
A1<br />
A2<br />
B1<br />
B2<br />
C1<br />
C2<br />
D1<br />
D2<br />
E1<br />
180<br />
160<br />
140<br />
120<br />
Collection Distance [µm]<br />
100<br />
3000<br />
80<br />
2000<br />
60<br />
40<br />
1000<br />
20<br />
0<br />
0 20 40 60 80 100 120 140 160 180<br />
0<br />
Total Fluence [E13 π + /cm 2 ]<br />
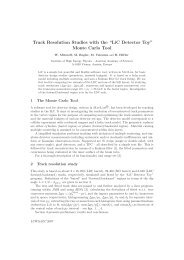
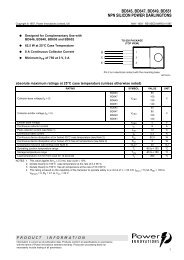
Figure 7.4: The charge collection distance of various samples vs. pion uence.<br />
By simple calculation, we can obtain the charge observed at the electrodes <strong>for</strong> a single<br />
traversing pion if we know the beam induced current (I ind ), the pion ux ( ) and the<br />
active area of the sample, which is bigger than the contact pad due to the fringe eld<br />
(this will be discussed in detail in section 8.1). For the beam induced charge calculation,<br />
we will refer to this equivalent area (A e ), obtaining the equation<br />
Q c = I ind<br />
A e<br />
: (7.1)<br />
Using eq. 7.1, we can correlate the measured current of each sample with the number<br />
of electrons generated by a single traversing pion. It is very interesting to compare the<br />
beam induced charge with the collection distance measured with the 90 Sr source at the<br />
same bias voltage of 300 V. These two values should be identical <strong>for</strong> all uences, but<br />
in fact they aren't. It turns out that the pion induced charge (pic) always exceeds the<br />
electron induced charge (eic).<br />
We dene the excess factor as the ratio pic=eic. Considering all samples, we observed<br />
excess factor curves within the shaded area of g. 7.6. There are two components in<br />
the development of the excess factor vs. uence. Easily seen at low uences, there is