Diamond Detectors for Ionizing Radiation - HEPHY
Diamond Detectors for Ionizing Radiation - HEPHY
Diamond Detectors for Ionizing Radiation - HEPHY

You also want an ePaper? Increase the reach of your titles
YUMPU automatically turns print PDFs into web optimized ePapers that Google loves.
CHAPTER 6. CHARACTERIZATION 32<br />
90 -<br />
Collimated Sr β Source<br />
<strong>Diamond</strong><br />
+HV<br />
8.2MΩ<br />
Si Trigger Diode<br />
+45V<br />
Collimator<br />
3.3pF<br />
10nF<br />
100MΩ<br />
VA2<br />
Repeater<br />
To<br />
CAMAC<br />
Module<br />
100kΩ<br />
100nF<br />
50Ω line<br />
50Ω<br />
line<br />
39Ω<br />
10kΩ<br />
50Ω<br />
Calibration<br />
Pulse<br />
11Ω<br />
Trigger<br />
Amplifier<br />
To<br />
CAMAC<br />
Module<br />
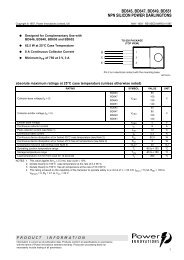
Figure 6.5: Schematics of the Vienna characterization station.<br />
6.2 Calibration and Noise Measurements<br />
With a pedestal measurement, the overall noise per<strong>for</strong>mance of the characterization setup<br />
can be determined. However, this is only given in ADC counts, as long as there is no<br />
absolute calibration, which can be done through the injection of a known step pulse into<br />
the VA2 input as described above.<br />
To obtain an accurate calibration, it is essential to know the involved parameters,<br />
in particular the exact capacitance value (C) and the voltage step size at the capacitor.<br />
The capacitor has been measured with a Hewlett Packard 4285A precision LCR meter,<br />
while the small voltage step cannot be measured directly with required precision. Thus,<br />
the attenuation of the voltage dividers (r) has been measured with DC voltages much<br />
higher than used in the calibration. The step pulse output of the CAMAC module can<br />
be switched alternatively to both DC levels to precisely measure the voltage dierence<br />
be<strong>for</strong>e attenuation (V ). The number of electrons injected into the VA2 is given by<br />
N = Q e = CV : (6.4)<br />
re<br />
The rise time of the step pulse is indierent, as long as it is substantially shorter than the<br />
integration time of the VA2, which is also the minimum length of the pulse.<br />
Fig. 6.7 shows a measurement of both pedestal and calibration peaks in the pulse<br />
height spectrum, tted with Gaussian distributions. In this case, the parameters were<br />
C =3:37 pF, V = 227:6mV (terminated) and r = 1022, yielding an injected charge of<br />
4691 e. From the histogram t parameters, a pedestal RMS of 3:192 ADC counts and a<br />
peak location dierence of 70:9 ADC counts are obtained.