ClifdenClara - Geological Survey of Ireland
ClifdenClara - Geological Survey of Ireland
ClifdenClara - Geological Survey of Ireland

Create successful ePaper yourself
Turn your PDF publications into a flip-book with our unique Google optimized e-Paper software.
Environmental Protection Agency<br />
Establishment <strong>of</strong> Groundwater Source Protection Zones<br />
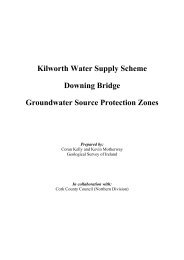
Clifden Clara Water Supply Scheme<br />
Clifden Clara borehole<br />
Groundwater Source Protection Zones<br />
May 2010<br />
Prepared by:<br />
John Dillon and Coran Kelly TOBIN<br />
With contributions from:<br />
Dr. Robert Meehan, Consultant Geologist; Jenny Deakin TCD<br />
And with assistance from:<br />
Kilkenny County Council & EPS
Environmental Protection Agency<br />
Clifden Clara SPZ<br />
PROJECT DESCRIPTION<br />
Since the 1980‟s, the <strong>Geological</strong> <strong>Survey</strong> <strong>of</strong> <strong>Ireland</strong> (GSI) has undertaken a considerable amount <strong>of</strong> work<br />
developing Groundwater Protection Schemes throughout the country. Groundwater Source Protection<br />
Zones are the surface and subsurface areas surrounding a groundwater source, i.e. a well, wellfield or<br />
spring, in which water and contaminants may enter groundwater and move towards the source.<br />
Knowledge <strong>of</strong> where the water is coming from is critical when trying to interpret water quality data at<br />
the groundwater source. The Source Protection Zone also provides an area in which to focus further<br />
investigation and is an area where protective measures can be introduced to maintain or improve the<br />
quality <strong>of</strong> groundwater.<br />
The project “Establishment <strong>of</strong> Groundwater Source Protection Zones”, led by the Environmental<br />
Protection Agency (EPA), represents a continuation <strong>of</strong> the GSI‟s work. A CDM/TOBIN/OCM project<br />
team has been retained by the EPA to establish Groundwater Source Protection Zones at monitoring<br />
points in the EPA‟s National Groundwater Quality Network.<br />
A suite <strong>of</strong> maps and digital GIS layers accompany this report and the reports and maps are hosted on<br />
the EPA and GSI websites (www.epa.ie; www.gsi.ie).<br />
i
Environmental Protection Agency<br />
Clifden Clara SPZ<br />
TABLE OF CONTENTS<br />
1 INTRODUCTION ........................................................................................................... 1<br />
2 LOCATION, SITE DESCRIPTION AND WELL HEAD PROTECTION ......................... 1<br />
3 SUMMARY OF BOREHOLE DETAILS......................................................................... 3<br />
4 METHODOLOGY .......................................................................................................... 4<br />
5 TOPOGRAPHY, SURFACE HYDROLOGY AND LANDUSE ....................................... 4<br />
6 GEOLOGY .................................................................................................................... 6<br />
6.1 BEDROCK GEOLOGY ............................................................................................ 6<br />
6.2 SUBSOILS GEOLOGY ......................................................................................... 11<br />
6.3 DEPTH TO BEDROCK ......................................................................................... 12<br />
7 GROUNDWATER VULNERABILITY .......................................................................... 13<br />
8 HYDROGEOLOGY ..................................................................................................... 15<br />
8.1 GROUNDWATER BODY AND STATUS ............................................................... 15<br />
8.2 METEOROLOGY .................................................................................................. 15<br />
8.3 GROUNDWATER LEVELS, FLOW DIRECTIONS AND GRADIENTS ................. 15<br />
8.4 HYDROCHEMISTRY AND WATER QUALITY...................................................... 16<br />
8.5 AQUIFER CHARACTERISTICS ............................................................................ 18<br />
8.6 RECHARGE .......................................................................................................... 19<br />
8.7 CONCEPTUAL MODEL ........................................................................................ 19<br />
9 DELINEATION OF SOURCE PROTECTION AREAS ................................................ 20<br />
9.1 OUTER PROTECTION AREA ............................................................................... 20<br />
9.2 INNER PROTECTION AREA ................................................................................ 21<br />
10 GROUNDWATER PROTECTION ZONES ............................................................... 22<br />
11 POTENTIAL POLLUTION SOURCES ..................................................................... 22<br />
12 CONCLUSIONS ....................................................................................................... 22<br />
13 RECOMMENDATIONS ............................................................................................ 24<br />
14 REFERENCES ......................................................................................................... 24<br />
ii
Environmental Protection Agency<br />
Clifden Clara SPZ<br />
TABLES & APPENDICES<br />
TABLES<br />
Table 3-1 Summary Details ........................................................................................................................ 4<br />
Table 6-1 Karst features within a 5 km radius <strong>of</strong> the Clifden Clara Boreholes Source (GSI Karst<br />
Database) ................................................................................................................................................... 8<br />
Table 8-1 Field measurements <strong>of</strong> surface water features ....................................................................... 16<br />
Table 10-1 Source Protection Zones ....................................................................................................... 22<br />
FIGURES<br />
Figure 1 Location Map ................................................................................................................................ 2<br />
Figure 2 Geology Map ................................................................................................................................ 7<br />
Figure 3 Aquifer Map in the vicinity <strong>of</strong> Clifden Clara .................................................................................. 9<br />
Figure 4 Cross Section ............................................................................................................................. 10<br />
Figure 5 Subsoil Map ............................................................................................................................... 12<br />
Figure 6 Revised Groundwater Vulnerability around Clifden Clara source ............................................. 14<br />
Figure 7 Water Quality Graphs ................................................................................................................ 18<br />
Figure 8 Source Protection Zones around Clifden Clara borehole .......................................................... 23<br />
iii
Environmental Protection Agency<br />
Clifden Clara SPZ<br />
1 INTRODUCTION<br />
Groundwater Source Protection Zones are delineated for the Clifden Clara source according to the<br />
principles and methodologies set out in „Groundwater Protection Schemes‟ (DELG/EPA/GSI, 1999)<br />
and in the GSI/EPA/IGI Training course on Groundwater Source Protection Zone Delineation.<br />
The Clifden Clara borehole is the main source for the Clifden Clara Group Water Scheme. The borehole<br />
supplies approximately 50 m 3 /day to the townlands <strong>of</strong> Clifden and Churchclara.<br />
The objectives <strong>of</strong> the report are as follows:<br />
To outline the principal hydrogeological characteristics <strong>of</strong> the Clifden and Churchclara<br />
area.<br />
To delineate source protection zones for the Clifden Clara borehole.<br />
To assist the Environmental Protection Agency and Kilkenny County Council in<br />
protecting the water supply from contamination.<br />
The maps produced are based largely on the readily available information in the area and on mapping<br />
techniques which use inferences and judgements based on experience at other sites. As such, the maps<br />
cannot claim to be definitively accurate across the whole area covered, and should not be used as the<br />
sole basis for site-specific decisions, which will usually require the collection <strong>of</strong> additional site-specific<br />
data.<br />
The borehole was drilled in July 1970 by Fogarty Drilling Ltd., Gowran, Co. Kilkenny. The borehole<br />
supplies approximately 20 houses, church, school, local farms and small businesses. It operated as a<br />
group water scheme until 2007. Operational control <strong>of</strong> the GWS has since ceded to EPS as part <strong>of</strong> the<br />
South Leinster design-build-operate (DBO) scheme.<br />
Kilkenny County Council in partnership with Kildare, Carlow, Laois, Wexford and Wicklow County<br />
Councils have grouped together 32 previously individual rural group water schemes, spread across six<br />
counties into the South Leinster DBO.<br />
T.J. O‟Connor & Associates were appointed as Client‟s Representative. EPS Pumping and Treatment<br />
Systems (the DBO operators) have commenced work on the Clifden Clara scheme since 2007. Since<br />
taking over the scheme, additional treatment and security measures have been implemented at the<br />
Clifden Clara borehole. The scheme is monitored remotely using an eSCADA scheme. The eSCADA<br />
system remotely monitors flow and chlorine levels at the Cuffesgrange scheme and sends updates to<br />
EPS staff.<br />
2 LOCATION, SITE DESCRIPTION AND WELL HEAD PROTECTION<br />
The Clifden Clara borehole, which is operated by the EPS on behalf <strong>of</strong> Kilkenny County Council since<br />
2007, is located approximately 5 km to the east <strong>of</strong> Kilkenny City, adjacent to the N10 national road (See<br />
Figure 1). The source is located within the Nore River catchment.<br />
1
Environmental Protection Agency<br />
Clifden Clara SPZ<br />
Figure 1 Location Map<br />
2
Environmental Protection Agency<br />
Clifden Clara SPZ<br />
The Clifden Clara source, in the townland <strong>of</strong> Clifden, has operated as a group water scheme since 1970.<br />
The borehole is securely located within a compound. A borehole pump brings the water to the pump<br />
house where the untreated water is chlorinated and passed through a UV system. Water is pumped<br />
directly into the distribution network from the chlorine contact tank.<br />
The annulus around the borehole is not grouted. The borehole cover and surrounding area is securely<br />
covered and the site is fenced <strong>of</strong>f (Photograph 1).<br />
3 SUMMARY OF BOREHOLE DETAILS<br />
The Clifden Clara borehole was drilled to a depth <strong>of</strong> approximately 38 m in July 1970 with an 8” steel<br />
casing into bedrock. Drilling encountered 12 m <strong>of</strong> till (clay) material, overlying buff coloured dolomite<br />
with large water inflows from 12 m bgl to 31 m bgl. Below 31 m, the bedrock became more competent<br />
and comprised grey to dark grey limestone. An initial pumping test was completed on the borehole by<br />
the driller, with a 2.5 m drawdown achieved at a pumping rate <strong>of</strong> 34.5 m 3 /hour (pers comm. Tom<br />
Fogarty).<br />
Photograph 1 Borehole housing and treatment works<br />
3
Environmental Protection Agency<br />
Clifden Clara SPZ<br />
Table 3-1 Summary Details<br />
EU Reporting Code<br />
Grid reference<br />
IE_EA_G_078_10_006<br />
E258220 N135391<br />
Townland<br />
Clifden<br />
Source type<br />
Borehole<br />
Drilled July 1970<br />
Owner<br />
Kilkenny County Council<br />
Elevation (Ground Level)<br />
c. 76 mOD<br />
Depth<br />
38 m<br />
Depth <strong>of</strong> casing<br />
Outer casing 14 m<br />
Diameter<br />
0.2 m<br />
Depth to rock<br />
12 m<br />
Static water level<br />
4.04 m bgl<br />
Consumption (Co. Co. records) 50 m 3 /d<br />
GSI Productivity Class<br />
Class I<br />
Specific capacity<br />
331 m 3 /day/m<br />
Transmissivity (pump test data,<br />
400 m 2 /day<br />
1970)<br />
4 METHODOLOGY<br />
The methodology consisted <strong>of</strong> data collection, desk studies, site visits and field mapping. Analysis <strong>of</strong><br />
the information collected during the studies was used to delineate the Groundwater Source Protection<br />
Zones.<br />
The initial site visit and interview with the EPS staff took place on 23/11/2009. Site walk-overs and<br />
field mapping (including measuring the electrical conductivity and temperature <strong>of</strong> streams in the area)<br />
<strong>of</strong> the study area were conducted on 28/11/2009, 01/12/2009 and 02/12/2009.<br />
5 TOPOGRAPHY, SURFACE HYDROLOGY AND LANDUSE<br />
The Clifden-Clara borehole is located along the N10 Kilkenny to Carlow road. The borehole is located<br />
within the River Nore catchment (Hydrometric Area 15) with Freestone Hill (183 m OD) forming the<br />
topographic boundary with the River Barrow catchment, 1 km to the east. The topography in the<br />
vicinity <strong>of</strong> the well is flat to gently undulating, with a general gentle slope towards the south. Further to<br />
the north, the land rises steeply towards Freestone Hill, and the Castlecomer Plateau 2 km further to the<br />
north. A number <strong>of</strong> unnamed streams rise on the Castlecomer Plateau and flow towards the River<br />
Nore to the west and to the River Barrow to the east.<br />
According to the six inch maps <strong>of</strong> the area, a low drainage density exists to the northeast <strong>of</strong> the source,<br />
with a high artificial drain density located 1 km to the south. Two unnamed streams are located<br />
approximately 1 km from the source. For the purposes <strong>of</strong> this report these streams with be named the<br />
Rathcash Stream (to the south <strong>of</strong> the borehole) and the Churchclara Stream (to the west), (refer to<br />
Figure 1)<br />
4
Environmental Protection Agency<br />
Clifden Clara SPZ<br />
South <strong>of</strong> the borehole, a series <strong>of</strong> springs rise in the townland <strong>of</strong> Clifden and flow towards the Rathcash<br />
Stream. The nearest spring is located 150 m southwest <strong>of</strong> the borehole, with two smaller springs noted<br />
further to the south (300 m to 500 m).<br />
Photograph 2. Small spring (SW4) 300 m south <strong>of</strong> source.<br />
Land use in the area is primarily agricultural, with lands set to pasture or used for tillage. A number <strong>of</strong><br />
farmyards have been noted in the area, though no farmyards were identified within 100 m <strong>of</strong> the<br />
borehole. One farmyard was noted 150 m southwest <strong>of</strong> the source adjacent to a spring (SW5). Three<br />
farmyards occur within 400–500 m <strong>of</strong> the source. The Clifden/Churchclara area has a moderate<br />
housing density (approx 15 dwellings/km 2 ). A number <strong>of</strong> one-<strong>of</strong>f houses have been built since 2002<br />
(less than 10). The area is under „strong urban influence‟ according to the county development plan. A<br />
number <strong>of</strong> small businesses are located along the N10 national road.<br />
5
Environmental Protection Agency<br />
Clifden Clara SPZ<br />
6 GEOLOGY<br />
6.1 BEDROCK GEOLOGY<br />
This section briefly describes the relevant characteristics <strong>of</strong> the geological materials that underlie the<br />
Clifden Clara source. It provides a framework for the assessment <strong>of</strong> groundwater flow and source<br />
protection zones that will follow in later sections. The geological information is based the Bedrock<br />
<strong>Geological</strong> Map <strong>of</strong> Carlow-Wexford Sheet 19, 1:100,000 Series (Tietzsch-Tyler et al, 1994) and the GSI<br />
Karst Database.<br />
The Bedrock <strong>Geological</strong> Map indicates that this area is principally underlain by Dinantian Pure Bedded<br />
Limestones <strong>of</strong> the Ballyadams Limestone Formation and the Clogrenan Formation (Figure 2). The Pure<br />
Bedded Limestones are underlain by Dinantian Upper Impure Limestones (Butlersgrove Formation)<br />
0.7 km to the southwest and are unconformably overlain by Namurian Shales 1.5 km to the northeast.<br />
The Dinantian Pure Bedded Limestones (Ballyadams Limestone Formation) are comprised <strong>of</strong> relatively<br />
clean, thick bedded limestones with intermittent clay wayboards. The presence <strong>of</strong> cherts and absence <strong>of</strong><br />
clay wayboards distinguishes the Clogrenan Formation from the Ballyadams Formation. Extensive<br />
dolomitisation <strong>of</strong> the Ballyadams has been identified 1.2 km to the south <strong>of</strong> the source by the GSI, and is<br />
shown on the Geology Map. Dolomite was identified within the borehole and 0.8 km to the south (S1)<br />
where the new M9/M10 spur to Kilkenny is under construction (refer to Figure 2 and Photo 1).<br />
Dolomite at S1 comprised <strong>of</strong> vuggy, coarsely crystalline pink/buff dolomite. Local information<br />
suggests the dolomite extends up to the base <strong>of</strong> Freestone Hill. Bedrock exposures on Freestone Hill are<br />
comprised <strong>of</strong> pure bedded limestones. Approximately 1 km to the north <strong>of</strong> the source, borehole drilling<br />
at S2 encountered pure bedded limestones indicating the dolomite is limited in extent to the north.<br />
A proposed extension <strong>of</strong> the dolotimised limestone area, based on field mapping is included on Figure<br />
2. See cross section on Figure 4 for diagrammatic view across the study area.<br />
Photograph 1 Pink/buff coloured dolomite (centre) contrasting with grey limestone imported<br />
construction material.<br />
6
Environmental Protection Agency<br />
Clifden Clara SPZ<br />
Namurian<br />
Shales<br />
Impure<br />
Lsts<br />
Figure 2 Geology Map<br />
7
Environmental Protection Agency<br />
Clifden Clara SPZ<br />
6.1.1 Karst Geology<br />
Hydrogeological mapping (December 2009) included checking existing, known karst features around<br />
the source and searching for possible new features. The karst features listed in Table 6-1 are those<br />
recorded in the GSI Karst Feature Database within a 2 km radius <strong>of</strong> the borehole, and are shown in<br />
Figure 3.<br />
To the west (1 km) <strong>of</strong> the source, Tobernaleabe Spring rises approximately 200 m to the south <strong>of</strong> a<br />
sinking stream. Due to the high water levels it was not possible to investigate this spring in detail. At<br />
Rathcash to the southeast, two karstic springs are located near the M10 motorway currently under<br />
construction.<br />
The springs mapped during the current study to the south <strong>of</strong> the borehole (Clifden springs SW3–SW5)<br />
are potential karst springs, but bedrock exposures were not evident at these locations. These were the<br />
only karst features identified during the site walkover.<br />
Table 6-1 Karst features within a 5 km radius <strong>of</strong> the Clifden Clara Boreholes Source (GSI Karst Database)<br />
Number Feature type Feature name Easting Northing Distance to source Townland<br />
K1 Spring Tobernaleabe 257030 155540 1.1 km west Churchclara<br />
K2 Spring Rathcash East Spring 255900 154900 1.6 km southeast Rathcash<br />
K3 Spring Rathcash East Spring 255920 154810 1.6 km northwest Rathcash<br />
8
Environmental Protection Agency<br />
Clifden Clara SPZ<br />
Figure 3 Aquifer Map in the vicinity <strong>of</strong> Clifden Clara<br />
9
Environmental Protection Agency<br />
Clifden Clara SPZ<br />
Figure 4 Cross Section<br />
10
Environmental Protection Agency<br />
Clifden Clara SPZ<br />
6.2 SUBSOILS GEOLOGY<br />
According to GSI and EPA web mapping, the study area is dominated by till derived from Namurian<br />
Shale and Sandstones (TNSSs). However, this map depicts till at and just below the surface only, and<br />
from an examination <strong>of</strong> historical mapping data from the EPA Soil and Subsoil Mapping Project, in<br />
areas adjacent to Clifden Clara two till units occur, stacked on top <strong>of</strong> each other. These areas host till<br />
derived from limestone at depth, capped by the till derived from Namurian rocks just below the<br />
surface, which has been carried from the area <strong>of</strong> Namurian rock-outcrop 3 km to the north. The Clifden<br />
Clara locality seems to have a similar scenario occurring from secondary indicator data gathered in the<br />
current project (see below).<br />
According to GSI and EPA web mapping, the study area is dominated by till and sand and gravel<br />
deposits derived from Namurian shales and sandstones, TNSSs and GNSSs respectively (Figure 4) with<br />
till and sands and gravels derived from limestone (TLs) occurring 0.5 km to the south. Based on<br />
information from the borehole, the underlying subsoil is comprised <strong>of</strong> „gravelly till‟ to 12 m.<br />
The number <strong>of</strong> soil and subsoil exposures is limited within the Clifden-Clara borehole study area.<br />
However, there were some exposures evident along the M9/M10 under construction 0.9 km to the<br />
south <strong>of</strong> the borehole but they were typically limited to 1–1.5 m depth. Subsoil cuttings 1 km southeast<br />
<strong>of</strong> the source were described using BS5930 as brown/red, moderately stiff, slightly sandy, very gravelly<br />
SILT with frequent cobbles and were presumed to be the TLs. Alluvial subsoil along the Rathcash<br />
stream bank is comprised <strong>of</strong> grey/light brown, laminated, slightly sandy SILT.<br />
The soils surrounding the borehole and towards the north are mapped as „dry‟ soil types: typically well<br />
drained deep mineral soils (AminDW & BminDW). Approximately 300 m south <strong>of</strong> the source and<br />
surrounding the Rathcash Stream, soils are mapped as poorly drained, deep mineral soils (BminPD).<br />
The subsoils across County Kilkenny have been classified according to British Standards 5930 in the<br />
preparation <strong>of</strong> the Groundwater Vulnerability map for Kilkenny County Council, by the GSI. The<br />
subsoil permeability <strong>of</strong> the till unit around the source has been classed as „Low Permeability‟ in this<br />
scheme.<br />
However, based on the moderate drainage density, presence <strong>of</strong> intensive agriculture/tillage,<br />
dominance <strong>of</strong> dry soil types, absence <strong>of</strong> rushes or other wetland indicators found during field mapping<br />
for this study, and description <strong>of</strong> the subsoils as SILT, the permeability <strong>of</strong> the subsoil in the area around<br />
the source, as well as further to the north, is felt to be towards the low end <strong>of</strong> „Moderate permeability’<br />
material.<br />
11
Environmental Protection Agency<br />
Clifden Clara SPZ<br />
Figure 5 Subsoil Map<br />
6.3 DEPTH TO BEDROCK<br />
During a site walkover on the 23 rd November 2009, Doran‟s Well Drilling was completing a well, 1 km<br />
north <strong>of</strong> the source towards the crest <strong>of</strong> a small hill. Depth to bedrock at this location (S2) was 2.2 m bgl.<br />
Along the flanks <strong>of</strong> Freestone Hill, a number <strong>of</strong> small historical quarries are located on the OSI<br />
historical maps, which also indicate a shallow depth to bedrock. Numerous bedrock exposures are<br />
evident on Freestone Hill.<br />
12
Environmental Protection Agency<br />
Clifden Clara SPZ<br />
Depth to bedrock at the source is 12 m. Based on the geological information acquired from the local<br />
drilling contractors, Tom Fogarty Well Drilling & Doran Well Drilling, depth to bedrock is variable, but<br />
generally approximately 10m. This together with field mapping has enabled a greater than 10m zone to<br />
be delimited about the source. Further east <strong>of</strong> the source, a number <strong>of</strong> wells identified on the GSI well<br />
database, indicate that depth to bedrock along the N10 is between 3 and 10 m.<br />
7 GROUNDWATER VULNERABILITY<br />
Groundwater vulnerability is dictated by the nature and thickness <strong>of</strong> the material overlying the<br />
uppermost groundwater „target‟. This means that vulnerability relates to the thickness <strong>of</strong> the<br />
unsaturated zone in the sand/gravel aquifer, and the permeability and thickness <strong>of</strong> the subsoil in areas<br />
where the sand/gravel aquifer is absent. A detailed description <strong>of</strong> the vulnerability categories can be<br />
found in the Groundwater Protection Schemes document (DoEHLG/EPA/GSI, 1999) and in the draft<br />
GSI Guidelines for Assessment and Mapping <strong>of</strong> Groundwater Vulnerability to Contamination<br />
(Fitzsimons et al, 2003).<br />
The subsoil permeability <strong>of</strong> the till dominated by Namurian rocks around the source has been classed<br />
as „Low Permeability‟ within the County Kilkenny Groundwater Protection Scheme. However following<br />
fieldwork for the current study, including analysis <strong>of</strong> subsoil exposures, the absence <strong>of</strong> drainage ditches<br />
and wetland indicators, the area around the source appears to be well drained. Based on this the<br />
subsoil permeability is mapped as „Moderate Permeability’ for the current scheme. Additional depth to<br />
bedrock data are available, thus, the vulnerability map (Figure 5) has been revised in this report;<br />
specifically a Moderate Vulnerability zone has been delimited around the source.<br />
13
Environmental Protection Agency<br />
Clifden Clara SPZ<br />
Figure 6 Proposed Groundwater Vulnerability around Clifden Clara source<br />
14
Environmental Protection Agency<br />
Clifden Clara SPZ<br />
8 HYDROGEOLOGY<br />
This section describes the current understanding <strong>of</strong> the hydrogeology in the vicinity <strong>of</strong> the source.<br />
Hydrogeological and hydrochemical information was obtained from the following sources:<br />
GSI Website and Well Database<br />
County Council Staff<br />
EPA website and Groundwater Monitoring database<br />
Local Authority Drinking Water returns<br />
Hydrogeological mapping by TOBIN Consulting Engineers and Robert Meehan in November<br />
2009 and December 2009.<br />
County Kilkenny Groundwater Protection Scheme (GSI, 2004).<br />
8.1 GROUNDWATER BODY AND STATUS<br />
The Clifton Clara source is located within the Kilkenny Groundwater Body which has been currently<br />
classified as being <strong>of</strong> Poor Status www.wfdireland.ie/maps.html. The groundwater body descriptions<br />
are available from the GSI website: www.gsi.ie and the „status‟ is obtained from the Water Framework<br />
Directive website: www.wfdireland.ie .<br />
8.2 METEOROLOGY<br />
Establishing groundwater source protection zones requires an understanding <strong>of</strong> general meteorological<br />
patterns across the area <strong>of</strong> interest. The data source is Met Eiréann.<br />
Annual rainfall: 823 mm. The closest meteorological station to Clifden Clara borehole is located at<br />
Kilkenny City. Data records exist for Kilkenny (823 mm) are based on Met Éireann data for annual<br />
average rainfall (Fitzgerald and Forrestal, 1996). Data from the Met Eireann website show that the<br />
source is located between the 800 mm and 1000 mm average annual rainfall isohyet.<br />
Annual evapotranspiration losses: 435 mm. Potential evapotranspiration (P.E.) is estimated to be<br />
458 mm/yr (based on data from the Met Éireann Kilkenny synoptic station). Actual evapotranspiration<br />
(A.E.) is then estimated as 95% <strong>of</strong> P.E., to allow for seasonal soil moisture deficits.<br />
Annual Effective Rainfall: 388 mm. The annual effective rainfall is calculated by subtracting actual<br />
evapotranspiration from rainfall. Potential recharge is therefore equivalent to this, or 388 mm/year.<br />
Section 8.6 following (Recharge) estimates the proportion <strong>of</strong> effective rainfall that enters the aquifer<br />
utilising other hydrogeological data for the area.<br />
8.3 GROUNDWATER LEVELS, FLOW DIRECTIONS AND GRADIENTS<br />
Groundwater levels within the Clifden Clara borehole are close to the surface: the static water level was<br />
recorded at 4.04 m bgl during the November 2009 site visit.<br />
Groundwater levels in the surrounding area are estimated to be lower than the topographical contours<br />
to account for the absence <strong>of</strong> surface water features to the north <strong>of</strong> the borehole source. Groundwater<br />
gradients are expected to be relatively flat because the bedrock aquifer is highly permeable and are<br />
estimated to be 0.01. Accurate level data in this area could provide more conclusive information on<br />
15
Environmental Protection Agency<br />
Clifden Clara SPZ<br />
flow directions. Groundwater flow is assumed to broadly focus towards the spring discharge areas and<br />
the Rathcash Stream, following topography. A surface water/groundwater divide is thought to<br />
correspond with a topographical divide on Freestone Hill 1 km to the northeast <strong>of</strong> the source, beyond<br />
which groundwater flows towards the River Barrow.<br />
8.4 HYDROCHEMISTRY AND WATER QUALITY<br />
To investigate the relationship <strong>of</strong> groundwater to surface water, field mapping <strong>of</strong> surface water features<br />
was carried out in December 2009 which provided information on selected parameters (Electrical<br />
conductivity and temperature) and a quantitative assessment <strong>of</strong> flow. Monitoring <strong>of</strong> stream flow in the<br />
Rathcash Stream was conducted to investigate the potential groundwater discharges to the stream.<br />
Table 8-1 provides the field data from 1 st December 2009. Refer to Figure 7 for locations.<br />
SW<br />
stream<br />
ID<br />
Table 8-1 Field measurements <strong>of</strong> surface water features<br />
Conductivity pH Dissolved<br />
Oxygen<br />
Temperature<br />
SW 1 342 7.4 80 6.7<br />
SW 2 402 7.6 66 7.1<br />
SW 3 513 7.5 67 9.5<br />
SW 4 528 7.5 61 9.9<br />
SW 5 531 7.6 54 10<br />
Notes<br />
Rathcash Stream<br />
Est. Flow 0.14 m 3 /s<br />
Spring Est.<br />
Flow 0.015 m 3 /s (1,300 m 3 /day)<br />
A series <strong>of</strong> springs rise 150–500 m south/southwest <strong>of</strong> the borehole source and flow towards the<br />
Rathcash stream via a series <strong>of</strong> drainage ditches. This connection is reflected in the hydrochemistry <strong>of</strong><br />
the springs and stream which suggests that Rathcash stream is a combination <strong>of</strong> surface water and<br />
groundwater.<br />
Twenty five samples were available from the EPA Groundwater Monitoring Network between 1993<br />
and 2008. The water quality varies from moderately hard to very hard, (177 to 460 mg/l CaCO 3).<br />
Alkalinity ranges from 240 to 380 mg/l CaCO 3. The pH ranges between 7.1 and 8.3, which is alkaline.<br />
The field electrical conductivity ranges from 520 to 715 µS/cm @25 o C. The hydrochemical signature is<br />
calcium/magnesium bicarbonate.<br />
The concentration <strong>of</strong> nitrate ranges from 25.1 mg/l to 38.5 mg/l with an average 31 mg/l (as NO 3).<br />
There is no reported exceedance above the EU Drinking Water Directive maximum admissible<br />
concentration <strong>of</strong> 50 mg/l, but concentrations were occasionally above the groundwater threshold value<br />
<strong>of</strong> 37.5 mg/l (Groundwater Regulations S.I. 9 <strong>of</strong> 2010). The area around the borehole is moderately<br />
populated, and is served by septic tank systems. Some recent one <strong>of</strong>f development is evident in the<br />
area. Beef, tillage and sheep farming are the main land uses in the surrounding area, with a number <strong>of</strong><br />
farmyards noted to the north and east.<br />
Chloride concentrations range from 16 to 22.3 mg/l, with a mean <strong>of</strong> 19.9 mg/l which is considered to<br />
be slightly above the mean natural background level <strong>of</strong> 18 mg/l (Groundwater newsletter 46,<br />
O‟Callaghan Moran 2007) but is below the groundwater threshold value for saline intrusion test <strong>of</strong><br />
24 mg/l (Groundwater Regulations, S.I. 9 <strong>of</strong> 2010). Iron and manganese concentrations are below their<br />
respective parametric value limits in all samples.<br />
16
May-96<br />
Nov-96<br />
May-97<br />
Nov-97<br />
May-98<br />
Nov-98<br />
May-99<br />
Nov-99<br />
May-00<br />
Nov-00<br />
May-01<br />
Nov-01<br />
May-02<br />
Nov-02<br />
May-03<br />
Nov-03<br />
May-04<br />
Nov-04<br />
May-05<br />
Nov-05<br />
May-06<br />
Nov-06<br />
May-07<br />
Oct-07<br />
Apr-08<br />
Oct-08<br />
Ammonium<br />
(as N) Concentration (mg/l))<br />
Bacteria Count (per 100 ml)<br />
Aug-96<br />
Feb-97<br />
Aug-97<br />
Feb-98<br />
Aug-98<br />
Feb-99<br />
Aug-99<br />
Feb-00<br />
Aug-00<br />
Feb-01<br />
Aug-01<br />
Feb-02<br />
Aug-02<br />
Feb-03<br />
Aug-03<br />
Feb-04<br />
Aug-04<br />
Feb-05<br />
Aug-05<br />
Feb-06<br />
Aug-06<br />
Feb-07<br />
Aug-07<br />
Feb-08<br />
Aug-08<br />
Feb-09<br />
Nitrate Concentrations (mg/l)<br />
Chloride Concentrations (mg/l)<br />
Environmental Protection Agency<br />
Clifden Clara SPZ<br />
Faecal coliforms were present in the water in 60% <strong>of</strong> samples, with gross contamination on two<br />
occasions (greater than 10 faecal coliforms per 100 ml). Potential sources include agriculture and septic<br />
tank systems. Although the concentrations are variable, numbers <strong>of</strong> faecal coliforms since 2007 are<br />
lower than previous years. No gross contamination has occurred since 2007. The large proportion <strong>of</strong><br />
extreme groundwater vulnerability, the rapid travel times in the karstified dolomite bedrock and the<br />
land use indicates the likelihood <strong>of</strong> faecal contamination occurring.<br />
The concentration <strong>of</strong> Sulphate, Potassium, Sodium, Magnesium and Calcium are within normal ranges.<br />
The Potassium: Sodium (K:Na) ratio is low at less than 0.25.<br />
Nitrate and Chloride<br />
Nitrate (as NO3) NO3 Threshold Valuel NO3 MAC Level<br />
Chloride mg/l.<br />
Chloride Threshold Value<br />
60<br />
25<br />
50<br />
20<br />
40<br />
30<br />
20<br />
10<br />
0<br />
15<br />
10<br />
5<br />
0<br />
Bacteria and Ammonium (as N)<br />
Ammonium<br />
Ammonium Threshold Value (Mean Concentration) - Drinking Water Status Assessment (0.175mg/l N)<br />
faecal coliforms (untreated, counts)<br />
0.2<br />
25<br />
20<br />
18<br />
0.1<br />
11<br />
15<br />
10<br />
8<br />
8<br />
5<br />
0<br />
2<br />
0<br />
1<br />
0 0 0<br />
3<br />
0 0<br />
1<br />
1<br />
1<br />
0000 0 0<br />
0<br />
17
Aug-96<br />
Feb-97<br />
Aug-97<br />
Feb-98<br />
Aug-98<br />
Feb-99<br />
Aug-99<br />
Feb-00<br />
Aug-00<br />
Feb-01<br />
Aug-01<br />
Feb-02<br />
Aug-02<br />
Feb-03<br />
Aug-03<br />
Feb-04<br />
Aug-04<br />
Feb-05<br />
Aug-05<br />
Feb-06<br />
Aug-06<br />
Feb-07<br />
Aug-07<br />
Feb-08<br />
Aug-08<br />
Feb-09<br />
Potassium Concentration<br />
(mg/l)<br />
K:Na Ratio and Mn<br />
Concentration (mg/l)<br />
Environmental Protection Agency<br />
Clifden Clara SPZ<br />
Manganese, Potassium and Potassium: Sodium Ratio<br />
Potassium (K) Potassium MAC Level K:Na Threshold Level<br />
Potassium:Sodium Ratio Manganese (Mn) Manganese MAC Level<br />
14<br />
12<br />
10<br />
8<br />
6<br />
4<br />
2<br />
0<br />
0.5<br />
0.4<br />
0.3<br />
0.2<br />
0.1<br />
0<br />
Figure 7 Water Quality Graphs<br />
The concentrations <strong>of</strong> all other trace metals are low and/or below the detection limit <strong>of</strong> the laboratory.<br />
Slightly elevated concentrations <strong>of</strong> MCPA and Mecoprop were recorded on one occasion in December<br />
2007. These herbicides are typically used in the control <strong>of</strong> perennial weeds in arable lands and in<br />
horticultural practices. Both herbicides are highly mobile in groundwater. Possible sources include<br />
arable land to the north <strong>of</strong> the source.<br />
8.5 AQUIFER CHARACTERISTICS<br />
The groundwater source is located in the Kilkenny Groundwater Body. The GSI bedrock aquifer map <strong>of</strong><br />
the area indicates that the Dinantian Pure Bedded Limestone (Balladams Limestones) is classified as a<br />
Regionally Important Diffuse Karst Aquifer (RKd) which is highly productive. Groundwater velocities<br />
through fissures/conduits may be high with aquifer storage enhanced by the presence <strong>of</strong> dolomite.<br />
From the drillers pumping test information in 1970, water levels dropped by 2.5 m while pumping at a<br />
rate <strong>of</strong> 34.5 m 3 /hour (828 m 3 /d). The yield <strong>of</strong> Clifden Clara borehole is „excellent‟ according to GSI<br />
classification and the GSI productivity is Class I.<br />
Using the Logan transformation (Misstear, 1998) and a calculated specific capacity <strong>of</strong> 330 m 3 /m/day<br />
(based on yield tests and pumping test), the transmissivity is estimated to be 400 m 2 /day.<br />
Transmissivity values throughout the aquifer are likely to vary depending on the degree <strong>of</strong><br />
fractures/fissures and the degree <strong>of</strong> dolomitisation present.<br />
Permeability is in the order <strong>of</strong> 21 m/day based on a saturated thickness <strong>of</strong> 19 m (the thickness <strong>of</strong> the<br />
dolomitised limestone), and porosity <strong>of</strong> the dolomite is conservatively estimated to be in the order <strong>of</strong><br />
2%. Groundwater velocity, assuming a gradient <strong>of</strong> 0.01 is in the order <strong>of</strong> 10.5 m/day.<br />
The 19 m thick dolomite is considered to provide the main groundwater contribution to borehole.<br />
However, it is considered that it may be limited in areal extent towards the north. Recent drilling at S2<br />
encountered competent pure bedded limestones to 50 mbgl (refer to Figure 2). Dolomite is mapped<br />
within the Ballyadams to the south and was encountered in the Clifden Clara borehole, S1 and the<br />
M9/M10 road cutting to the south.<br />
18
Environmental Protection Agency<br />
Clifden Clara SPZ<br />
8.6 RECHARGE<br />
The term „recharge‟ refers to the amount <strong>of</strong> water replenishing the groundwater flow system. The<br />
recharge rate is generally estimated on an annual basis, and assumed to consist <strong>of</strong> input (i.e. annual<br />
rainfall) less water loss prior to entry into the groundwater system (i.e. annual evapotranspiration and<br />
run<strong>of</strong>f). The estimation <strong>of</strong> a realistic recharge rate is critical in source protection delineation, as it will<br />
dictate the size <strong>of</strong> the zone <strong>of</strong> contribution to the source (i.e. the Outer Source Protection Area).<br />
At Clifden Clara, the main parameters involved in the estimation <strong>of</strong> recharge are: annual rainfall;<br />
annual evapotranspiration; and a recharge coefficient.<br />
Run<strong>of</strong>f losses: 116 mm. Run<strong>of</strong>f losses are assumed to be 30% <strong>of</strong> potential recharge. This value is based<br />
on an assumption <strong>of</strong> c. 10% run<strong>of</strong>f for 50% <strong>of</strong> the area (extreme vulnerability); 40% run<strong>of</strong>f over 30% <strong>of</strong><br />
the area due to high vulnerability/moderate permeability subsoil; and, 60% run<strong>of</strong>f over 20% <strong>of</strong> the area<br />
(moderate vulnerability).<br />
The bulk recharge coefficient for the area is therefore estimated to be 70%. Due to the bedrock type<br />
there is no recharge cap applied. (Guidance Document GW5, Groundwater Working Group 2005).<br />
These calculations are summarised as follows:<br />
Average annual rainfall (R)<br />
823 mm<br />
estimated P.E.<br />
458 mm<br />
estimated A.E. (95% <strong>of</strong> P.E.)<br />
435mm<br />
effective rainfall<br />
388 mm<br />
potential recharge<br />
388 mm<br />
run<strong>of</strong>f losses 30%<br />
bulk recharge coefficient 70%<br />
Recharge<br />
272 mm<br />
8.7 CONCEPTUAL MODEL<br />
The current understanding <strong>of</strong> the geological and hydrogeological setting is given as follows:<br />
The source under consideration in this report comprises a 37 m borehole at Clifden, Co.<br />
Kilkenny. The abstraction rate from the source is 50 m 3 /day.<br />
GSI maps and mineral exploration indicate a varying degree <strong>of</strong> karstified dolomitised<br />
limestones in the area. The borehole source is completed within dolomitised bedrock. These<br />
features support the aquifer classification <strong>of</strong> Regionally important karstified diffuse aquifer (Rk d).<br />
In general, the depth to bedrock is 0–3 m on elevated areas, increasing in depth towards the<br />
low-lying parts <strong>of</strong> the study area. Depth to bedrock away from the hilltops is greater than 5 m.<br />
The subsoils are reclassified (based on site specific information) for this report as being <strong>of</strong><br />
„moderate permeability‟. Drilling encountered 12 m <strong>of</strong> overburden at the borehole source<br />
described by the driller as gravelly till.<br />
Groundwater flow is expected to be from the higher ground to the north and northeast,<br />
towards the borehole and spring discharge zone, following topography. The natural hydraulic<br />
gradients in the aquifer are likely to be low, approximately 0.01 (Dec 2009), reflecting the<br />
generally high transmissivity <strong>of</strong> the dolomitic limestones. At present, minimal drawdown is<br />
19
Environmental Protection Agency<br />
Clifden Clara SPZ<br />
induced within the well from pumping. Drawdown during pumping (at 50 m 3 /d) was<br />
measured at just 0.04 m during a site visit in Dec 2009.<br />
Over the region, an average recharge rate <strong>of</strong> 272 mm/year is used, which is approximately 70%<br />
<strong>of</strong> the total potential recharge. The remaining 30% <strong>of</strong> potential recharge is rejected and<br />
discharge may be via land overflow during the winter months.<br />
The delineation <strong>of</strong> the ZOC is difficult due to shallow groundwater gradients and without<br />
accuracy level data over an extended period.<br />
The groundwater is <strong>of</strong> calcium/magnesium bicarbonate signature and hard. Nitrate and<br />
ammonia concentrations are below their respective PVL. The microbial analysis <strong>of</strong> the water<br />
samples indicates that the groundwater is impacted by contamination from human or<br />
agricultural sources. Herbicides typically used in arable farming were detected in the borehole<br />
on one occasion. This reflects the large proportion <strong>of</strong> the area that is extremely vulnerable.<br />
Limitations to the conceptual model mainly lie with a lack <strong>of</strong> information on the following:<br />
<br />
<br />
<br />
Site specific depth to bedrock and localized differences in the subsoil permeability.<br />
Further information on the depth to bedrock would provide greater detail and<br />
confidence in the level <strong>of</strong> protection afforded by the subsoils and also a greater<br />
understanding <strong>of</strong> the 3D visualization and interaction <strong>of</strong> the borehole, till and bedrock.<br />
<strong>Survey</strong>ed levels <strong>of</strong> groundwater levels would give a greater level <strong>of</strong> confidence to<br />
groundwater contours, flow directions and gradients.<br />
Further borehole data may help define the extent <strong>of</strong> dolomitization within the<br />
Ballyadams Formation.<br />
9 DELINEATION OF SOURCE PROTECTION AREAS<br />
This section describes the delineation <strong>of</strong> the areas around the source that are believed to contribute<br />
groundwater to it, and that therefore require protection. The areas are delineated based on the<br />
conceptualisation <strong>of</strong> the groundwater flow to the source, as described in Section 8.7 Conceptual Model.<br />
Two source areas are delineated:<br />
Inner Protection Area (SI), designed to give protection from microbial pollution.<br />
Outer Protection Area (SO), encompassing the zone <strong>of</strong> contribution to the source.<br />
9.1 OUTER PROTECTION AREA<br />
The Outer Protection Area (SO) is bounded by the complete catchment area to the source, i.e. the zone<br />
<strong>of</strong> contribution (ZOC), which is defined as the area required to support an abstraction from long-term<br />
recharge. The ZOC is controlled primarily by (a) the total discharge, (b) the groundwater flow direction<br />
and gradient, (c) the subsoil and rock permeability and (d) the recharge in the area. The shape and<br />
boundaries <strong>of</strong> the ZOC were determined using hydrogeological mapping, water balance estimations,<br />
and conceptual understanding <strong>of</strong> groundwater flow. The boundaries are described below along with<br />
associated uncertainties and limitations.<br />
The Southern Boundary is based on a combination <strong>of</strong> hydrogeological mapping, the uniform flow<br />
equation and an assumption that in general the nearby spring is in hydraulic connection with<br />
groundwater.<br />
20
Environmental Protection Agency<br />
Clifden Clara SPZ<br />
The uniform flow equation (Todd, 1980) is:<br />
Q is the daily pumping rate<br />
T is Transmissivity (taken from aquifer characteristics)<br />
I is background non pumping gradient.<br />
The uniform flow equation suggests the influence <strong>of</strong> the well on the downgradient side is less than<br />
10 m from the bore (based on an approximate transmissivity <strong>of</strong> 400 m 2 /day, a natural groundwater<br />
gradient <strong>of</strong> 0.01, and a discharge <strong>of</strong> 50 m 3 /d, even when an allowance is made for a 100% increase in<br />
demand). However this is uncertain and it is considered that a precautionary arbitrary distance <strong>of</strong> 30 m<br />
is used to allow for errors and variability in the aquifer parameters.<br />
The Northern Boundary is based on the south-westerly groundwater flow directions from the higher<br />
ground towards the spring. The Zone <strong>of</strong> Contribution is extended to the topographic divide to allow for<br />
the high permeability in the karstified dolomitic limestones.<br />
The Eastern Boundary is based on the presence <strong>of</strong> the topographical high <strong>of</strong> Freestone Hill. Freestone<br />
Hill is considered to form the boundary between the Barrow and Nore River catchments. Groundwater<br />
at Freestone Hill is considered to flow towards the borehole and springs to the south.<br />
The Western Boundary is based on the presence <strong>of</strong> the Churchclara stream to the west. A groundwater<br />
divide is likely to occur between the Churchclara stream/Tobernaleabe springs to the west and<br />
borehole/Clifden springs to the south. The slight mound in this area marked with a high point <strong>of</strong> 84 m<br />
on the base map is not considered to have a significant effect on the flow directions within the<br />
underlying bedrock. However, given the relatively flat topography and low hydraulic gradients, some<br />
uncertainty exists in relation to the exact boundary. Further site investigation and water level<br />
monitoring would be required to confirm the boundary.<br />
Water balance: Based on an abstraction <strong>of</strong> 50 m 3 /day on average and the estimated recharge <strong>of</strong> 272<br />
mm/year, a zone <strong>of</strong> contribution <strong>of</strong> 0.06 km 2 in area is calculated. Hydrogeological field mapping and<br />
the conceptual model determined an area <strong>of</strong> 0.56 km 2 . Current GSI guidance states that ZOC<br />
delineation should conservatively account for 150% <strong>of</strong> the abstraction volume. The ZOC presented is<br />
therefore conservative, allowing for the groundwater discharge to the Clifden springs to the south and<br />
uncertainty in flow directions. The borehole is intercepting a small proportion <strong>of</strong> the flow in the<br />
catchment that is flowing south to the springs, so any part <strong>of</strong> the ZOC could be contributing to the<br />
borehole at any time. Further refinement <strong>of</strong> the zone <strong>of</strong> contribution will require further investigation.<br />
9.2 INNER PROTECTION AREA<br />
The Inner Source Protection Area is the area defined by the horizontal 100 day time <strong>of</strong> travel from any<br />
point below the watertable to the source (DoELG, EPA, GSI, 1999). The 100-day horizontal time <strong>of</strong><br />
travel to the source is calculated from the velocity <strong>of</strong> groundwater flow in the bedrock. The velocities<br />
are normally based on the results <strong>of</strong> the hydraulic test programme, however, in this instance, the<br />
aquifer category <strong>of</strong> Rk c , suggests that very rapid groundwater velocities are likely in this area due to<br />
karstification <strong>of</strong> the limestones. Groundwater flow can be focused and travel very fast. Results from<br />
tracing programmes in similar rock types indicate velocities in the order <strong>of</strong> hundreds <strong>of</strong> metres/day.<br />
On this basis, all <strong>of</strong> the ZOC is designated as part <strong>of</strong> the inner protection area to the source.<br />
21
Environmental Protection Agency<br />
Clifden Clara SPZ<br />
10 GROUNDWATER PROTECTION ZONES<br />
Groundwater protection zones are shown in Table 10-1, and are based on an overlay <strong>of</strong> the source<br />
protection areas on the groundwater vulnerability. Therefore the groundwater protection zones are<br />
SI/E, SI/H, SI/M and SI/X. The majority <strong>of</strong> the area is designated SI/E.<br />
Table 10-1 Source Protection Zones<br />
Source Protection Zone % <strong>of</strong> total area (0.56 km 2 )<br />
SI/ Moderate 24.2<br />
SI/High 26.1<br />
SI/ Extreme 31.6<br />
SI/Extreme (Rock close) 18.6<br />
11 POTENTIAL POLLUTION SOURCES<br />
The main potential sources <strong>of</strong> contamination within the ZOC are:<br />
Private residences within the ZOC are serviced by onsite wastewater treatment systems. The<br />
main potential contaminants are ammonia, nitrates, phosphates, chloride, potassium, BOD,<br />
COD, TOC, faecal bacteria, viruses and cryptosporidium.<br />
The majority <strong>of</strong> land within the zone <strong>of</strong> contribution is primarily grassland with substantial<br />
areas <strong>of</strong> tillage land. A number <strong>of</strong> farming operations are located within the source protection<br />
zone. The main potential contaminants from these sources are ammonia, nitrates, phosphates,<br />
chloride, potassium, BOD, COD, TOC, pesticides, herbicides, faecal bacteria, viruses and<br />
cryptosporidium.<br />
Private home heating fuel tanks are located within the catchment area. The main potential<br />
contaminants from this source are hydrocarbons.<br />
Roadways including the current N10, are present within the ZOC. The main potential contaminants<br />
from this source are hydrocarbons and metals.<br />
12 CONCLUSIONS<br />
The untreated groundwater at the borehole source at Clifden is currently impacted by microbial<br />
contamination. Available data suggests that there is contamination <strong>of</strong> the source occurring probably<br />
from organic waste sources; such as untreated wastewater from unsewered areas. The SPZ delineated<br />
is based on the current understanding <strong>of</strong> groundwater conditions and bedrock geology; and on the<br />
available data. The conclusions should not be used as the sole basis for site-specific decisions. The Inner<br />
Source Protection Area and the Zone <strong>of</strong> Contribution is calculated to extend to 0.56 km 2 .<br />
22
Environmental Protection Agency<br />
Clifden Clara SPZ<br />
Figure 4 Source Protection Zones around Clifden Clara borehole<br />
23
Environmental Protection Agency<br />
Clifden Clara SPZ<br />
13 RECOMMENDATIONS<br />
Continued monitoring water levels during the operation <strong>of</strong> the scheme should be gathered to develop a<br />
real-time database <strong>of</strong> hydrogeological information.<br />
The source site is the area immediately around the groundwater abstraction borehole. Protection in this<br />
area is paramount to ensure that direct intentional or accidental interference is not caused to the<br />
borehole. The protection <strong>of</strong> the source site involves prevention <strong>of</strong> access and prevention <strong>of</strong> activities in<br />
the immediate proximity <strong>of</strong> the abstraction boreholes.<br />
A cordon around the source is recommended in order to ensure that potentially polluting materials are<br />
not stored or deposited in the immediate vicinity <strong>of</strong> the source.<br />
The ZOC <strong>of</strong> the source includes an extensive area <strong>of</strong> Extreme Vulnerability with a significant<br />
proportion <strong>of</strong> it comprising shallow rock. It is recommended therefore that an adequate barrier to<br />
Cryptosporidium must be installed as part <strong>of</strong> the water treatment system for the supply. A hazard<br />
survey is also recommended.<br />
14 REFERENCES<br />
An Foras Talúntais and <strong>Geological</strong> <strong>Survey</strong> <strong>of</strong> <strong>Ireland</strong>, 1981. Soil map <strong>of</strong> <strong>Ireland</strong><br />
Baker, G., Crean, D. and Moran, S. (2007) Establishing Natural Background Levels for Groundwater<br />
Quality in <strong>Ireland</strong>. GSI Groundwater Newsletter No. 46.<br />
Collins, J.F. and Cummins, T. (1996) Agroclimatic Atlas <strong>of</strong> <strong>Ireland</strong>. AGMET – Joint working group on<br />
Applied Agricultural Meteorology, Dublin.<br />
Fitzgerald D., and Forrestal, F. (1996) Climatological Note No. 10. Monthly and Annual Averages <strong>of</strong><br />
Rainfall 1961-1990. Meteorological Service<br />
Fitzsimons, V., Daly, D. and Deakin, J. (2003) GSI Guidelines for Assessment and Mapping <strong>of</strong><br />
Groundwater Vulnerability to Contamination. <strong>Geological</strong> <strong>Survey</strong> <strong>of</strong> <strong>Ireland</strong>.<br />
<strong>Geological</strong> <strong>Survey</strong> <strong>of</strong> <strong>Ireland</strong> (2004). County Kilkenny Groundwater Protection Scheme 2004. Report to<br />
Kilkenny County Council.<br />
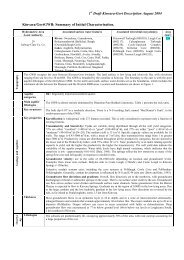
Kilkenny GWB: Summary <strong>of</strong> Initial Characterisation. www.gsi.ie<br />
Misstear, B. (1998) The Logan Method for analyzing pumping test data. The GSI Groundwater<br />
Newsletter, No. 34, pp 9–11.<br />
Todd, D.K., (1980) Groundwater Hydrology. Wiley and Sons 535pp<br />
Tietzsch-Tyler, D., Sleeman, A., McConnell, B., Daly, E., Flegg, A., O‟Connor, P., Warren, W., (1994)<br />
Geology <strong>of</strong> Carlow - Wexford. <strong>Geological</strong> <strong>Survey</strong> <strong>of</strong> <strong>Ireland</strong>. 1:100,000<br />
www.wfdireland.ie/maps.html (2008) Kilkenny GWB status<br />
Groundwater Working Group 2005. Guidance on the Assessment <strong>of</strong> the Impact <strong>of</strong> Groundwater<br />
Abstractions. Guidance Document No.GW5. Intergovernmental Working Group on Groundwater.<br />
24