njit-etd2003-081 - New Jersey Institute of Technology
njit-etd2003-081 - New Jersey Institute of Technology njit-etd2003-081 - New Jersey Institute of Technology
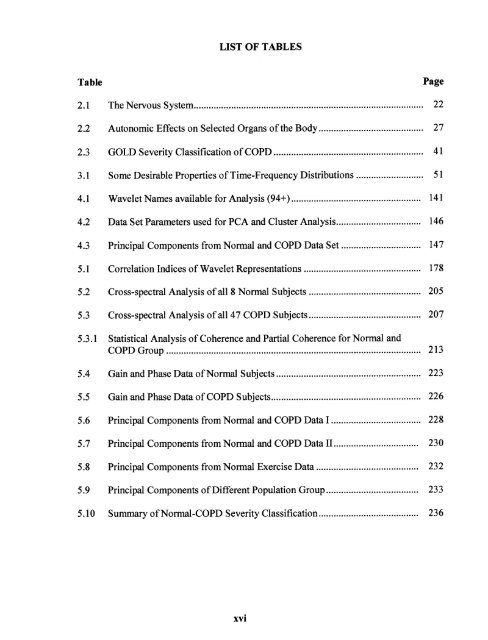
LIST OF TABLES Table Page 2.1 The Nervous System 22 2.2 Autonomic Effects on Selected Organs of the Body 27 2.3 GOLD Severity Classification of COPD 41 3.1 Some Desirable Properties of Time-Frequency Distributions 51 4.1 Wavelet Names available for Analysis (94+) 141 4.2 Data Set Parameters used for PCA and Cluster Analysis 146 4.3 Principal Components from Normal and COPD Data Set 147 5.1 Correlation Indices of Wavelet Representations 178 5.2 Cross-spectral Analysis of all 8 Normal Subjects 205 5.3 Cross-spectral Analysis of all 47 COPD Subjects 207 5.3.1 Statistical Analysis of Coherence and Partial Coherence for Normal and COPD Group 213 5.4 Gain and Phase Data of Normal Subjects 223 5.5 Gain and Phase Data of COPD Subjects 226 5.6 Principal Components from Normal and COPD Data I 228 5.7 Principal Components from Normal and COPD Data II 230 5.8 Principal Components from Normal Exercise Data 232 5.9 Principal Components of Different Population Group 233 5.10 Summary of Normal-COPD Severity Classification 236 xvi
LIST OF FIGURES Figure Page 2.1 The heart 15 2.2 The systemic and pulmonary circulations 16 2.3 The intrinsic conduction system of the heart 17 2.4 The sequence of cardiac excitation 19 2.5 The sympathetic nervous system and parasympathetic nervous system 26 2.6 Autonomic innervation of the heart 30 2.7 Effect of autonomic stimulation on the slope of the pacemaker potential 31 2.8 An electrocardiogram tracing (lead I) 34 2.9 The ECG placement of the positive and negative electrodes 36 3.1 Classes of time-frequency distributions 46 3.2 The Wigner distribution of the sum of two finite duration sine waves 60 3.3 The Performance of the Choi-William distribution 64 3.4 Division of the frequency domain for the STFT and the Wavelet Transform 70 3.5 The time-frequency plane resolution cells of the STFT vs. WT 72 3.6 Figure depicting the construction of the MI signal 78 3.7 MI and IIBI signals of heart rate 79 3.8 Power spectrum of the heart rate IIBI signal 81 3.9 Plot of the split cosine bell taper used as a window in the FFT calculation 82 3.10 Example of power spectral density of HRV 83 3.11 One minute plot of raw blood pressure and its IBM signal 85 xvii
- Page 1 and 2: Copyright Warning & Restrictions Th
- Page 3 and 4: ABSTRACT TIME-FREQUENCY INVESTIGATI
- Page 5 and 6: TIME-FREQUENCY INVESTIGATION OF HEA
- Page 7 and 8: APPROVAL PAGE TIME-FREQUENCY INVEST
- Page 9 and 10: BIOGRAPHICAL SKETCH (Continued) D.A
- Page 11 and 12: ACKNOWLEDGMENT The author wishes to
- Page 13 and 14: TABLE OF CONTENTS Chapter Page 1 IN
- Page 15 and 16: TABLE OF CONTENTS (Continued) Chapt
- Page 17 and 18: TABLE OF CONTENTS (Continued) Chapt
- Page 19: TABLE OF CONTENTS (Continued) Chapt
- Page 23 and 24: LIST OF FIGURES (Continued) Figure
- Page 25 and 26: LIST OF FIGURES (Continued) Figure
- Page 27 and 28: ABBREVIATIONS A ABP Arterial Blood
- Page 29 and 30: ABBREVIATIONS (Continued) P PID Pro
- Page 31 and 32: 2 mortality and sudden death. [2] B
- Page 33 and 34: 4 1) Patients with severe pulmonary
- Page 35 and 36: 6 examined for determining the inte
- Page 37 and 38: 8 identified using principal compon
- Page 39 and 40: 1 0 1. Present the application of t
- Page 41 and 42: 12 1.3 Outline of the Dissertation
- Page 43 and 44: CHAPTER 2 PHYSIOLOGY BACKGROUND Bio
- Page 45 and 46: 16 Figure 2.2 The systemic and pulm
- Page 47 and 48: 18 illustrated in Figure 2.3. The i
- Page 49 and 50: 20 2.2 Blood Pressure The force tha
- Page 51 and 52: 22 2.4 The Nervous System Human beh
- Page 53 and 54: 24 The sympathetic nerve fibers lea
- Page 55 and 56: 26 Without these sympathetic and pa
- Page 57 and 58: 28 center in the medulla, which con
- Page 59 and 60: 30 Figure 2.6 Autonomic innervation
- Page 61 and 62: 32 average heart rate was measured
- Page 63 and 64: 34 However, they do note that there
- Page 65 and 66: Figure 2.9 The placement of the pos
- Page 67 and 68: 38 female. While more men suffer fr
- Page 69 and 70: 40 Stage II: Moderate COPD - Worsen
LIST OF TABLES<br />
Table<br />
Page<br />
2.1 The Nervous System 22<br />
2.2 Autonomic Effects on Selected Organs <strong>of</strong> the Body 27<br />
2.3 GOLD Severity Classification <strong>of</strong> COPD 41<br />
3.1 Some Desirable Properties <strong>of</strong> Time-Frequency Distributions 51<br />
4.1 Wavelet Names available for Analysis (94+) 141<br />
4.2 Data Set Parameters used for PCA and Cluster Analysis 146<br />
4.3 Principal Components from Normal and COPD Data Set 147<br />
5.1 Correlation Indices <strong>of</strong> Wavelet Representations 178<br />
5.2 Cross-spectral Analysis <strong>of</strong> all 8 Normal Subjects 205<br />
5.3 Cross-spectral Analysis <strong>of</strong> all 47 COPD Subjects 207<br />
5.3.1 Statistical Analysis <strong>of</strong> Coherence and Partial Coherence for Normal and<br />
COPD Group 213<br />
5.4 Gain and Phase Data <strong>of</strong> Normal Subjects 223<br />
5.5 Gain and Phase Data <strong>of</strong> COPD Subjects 226<br />
5.6 Principal Components from Normal and COPD Data I 228<br />
5.7 Principal Components from Normal and COPD Data II 230<br />
5.8 Principal Components from Normal Exercise Data 232<br />
5.9 Principal Components <strong>of</strong> Different Population Group 233<br />
5.10 Summary <strong>of</strong> Normal-COPD Severity Classification 236<br />
xvi


