njit-etd2003-081 - New Jersey Institute of Technology
njit-etd2003-081 - New Jersey Institute of Technology njit-etd2003-081 - New Jersey Institute of Technology
81 length of the IBI signal depends on the number of heartbeats. Now, in order to take an 8192-point FFT of a signal that has only 6,000 samples, a technique called zero padding must be used. Essentially all samples from 6001 to 8192 are given the value of zero. The only effect this has on the spectrum is that it increases the frequency resolution. When the FFT is calculated, the spectrum is limited from 0 Hz up to 10 Hz. The frequency resolution is now 20/8192=0.00244 Hz. Once the power spectrum is obtained, it is smoothed twice by applying a modified Daniel Rectangular smoothing algorithm. Figure 3.8 illustrates the power spectrum of the IIBI signal in Figure 3.7. Figure 3.8 Power spectrum of the heart rate IIBI signal in Figure 3.7. It should also be noted that when performing the FFT, the IIBI signal is windowed by applying a split cosine bell taper. The taper begins at 20 percent from each end of the time signal. The application of the split cosine bell taper is done before the zero padding takes place so as to provide a smooth transition to zero rather than the window's abrupt changes from one to zero.
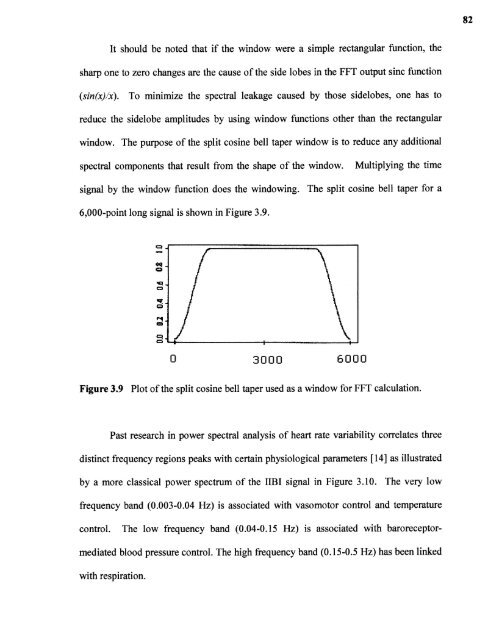
82 It should be noted that if the window were a simple rectangular function, the sharp one to zero changes are the cause of the side lobes in the FFT output sinc function (sin(x)/x). To minimize the spectral leakage caused by those sidelobes, one has to reduce the sidelobe amplitudes by using window functions other than the rectangular window. The purpose of the split cosine bell taper window is to reduce any additional spectral components that result from the shape of the window. Multiplying the time signal by the window function does the windowing. The split cosine bell taper for a 6,000-point long signal is shown in Figure 3.9. Figure 3.9 Plot of the split cosine bell taper used as a window for FFT calculation. Past research in power spectral analysis of heart rate variability correlates three distinct frequency regions peaks with certain physiological parameters [14] as illustrated by a more classical power spectrum of the IIBI signal in Figure 3.10. The very low frequency band (0.003-0.04 Hz) is associated with vasomotor control and temperature control. The low frequency band (0.04-0.15 Hz) is associated with baroreceptormediated blood pressure control. The high frequency band (0.15-0.5 Hz) has been linked with respiration.
- Page 59 and 60: 30 Figure 2.6 Autonomic innervation
- Page 61 and 62: 32 average heart rate was measured
- Page 63 and 64: 34 However, they do note that there
- Page 65 and 66: Figure 2.9 The placement of the pos
- Page 67 and 68: 38 female. While more men suffer fr
- Page 69 and 70: 40 Stage II: Moderate COPD - Worsen
- Page 71 and 72: CHAPTER 3 ENGINEERING BACKGROUND Th
- Page 73 and 74: 44 Two common types of time-frequen
- Page 75 and 76: 46 STFT: Short-Time Fourier Transfo
- Page 77 and 78: 48 3.3 The Analytic Signal and Inst
- Page 79 and 80: 50 The advantage of using equation
- Page 81 and 82: 52 3.5 Covariance and Invariance Th
- Page 83 and 84: where H(f), S(f) are Fourier transf
- Page 85 and 86: 56 Another shortcoming of the spect
- Page 87 and 88: 58 should take the kernel of the WD
- Page 89 and 90: 60 called the cross Wigner distribu
- Page 91 and 92: 62 3.6.3 The Choi-Williams (Exponen
- Page 93 and 94: 64 Figure 3.3 Performance of the Ch
- Page 95 and 96: 66 [-Ω,Ω ], then its STFT will be
- Page 97 and 98: 68 This condition forces that the w
- Page 99 and 100: 70 where c is a constant. Thus, the
- Page 101 and 102: Figure 3.5 The time-frequency plane
- Page 103 and 104: 74 The measure dadb used in the tra
- Page 105 and 106: 76 and the wavelet transform repres
- Page 107 and 108: 78 Figure 3.6 Figure depicting the
- Page 109: 80 The final step to obtain the pow
- Page 113 and 114: 84 The normal respiration rate can
- Page 115 and 116: Figure 3.12 Power spectrum of BP II
- Page 117 and 118: RR similar manner to give: When com
- Page 119 and 120: 90 when there is significant correl
- Page 121 and 122: 92 3.12 Partial Coherence Analysis
- Page 123 and 124: 94 after removal of the effects of
- Page 125 and 126: 96 The bulk of the theory and appli
- Page 127 and 128: 98 technique is measurement time. T
- Page 129 and 130: 100 usually attainable. The key poi
- Page 131 and 132: 102 variability exists in the propa
- Page 133 and 134: 104 eXogenous input (ARX) was used
- Page 135 and 136: 106 The baroreflex, an autonomic re
- Page 137 and 138: 108 the principal components are no
- Page 139 and 140: 110 The mathematical solution for t
- Page 141 and 142: 112 3.15 Cluster Analysis The term
- Page 143 and 144: 114 formed) one can read off the cr
- Page 145 and 146: 116 3.15.5 Squared Euclidian Distan
- Page 147 and 148: 118 Alternatively, one may use the
- Page 149 and 150: 120 Sneath and Sokal used the abbre
- Page 151 and 152: 122 may seem a bit confusing at fir
- Page 153 and 154: CHAPTER 4 METHODS The purpose of th
- Page 155 and 156: 126 4.1.2.1 Autonomic Testing. HR V
- Page 157 and 158: 128 of heart rate, blood pressure,
- Page 159 and 160: 130 The patients who underwent LVRS
82<br />
It should be noted that if the window were a simple rectangular function, the<br />
sharp one to zero changes are the cause <strong>of</strong> the side lobes in the FFT output sinc function<br />
(sin(x)/x). To minimize the spectral leakage caused by those sidelobes, one has to<br />
reduce the sidelobe amplitudes by using window functions other than the rectangular<br />
window. The purpose <strong>of</strong> the split cosine bell taper window is to reduce any additional<br />
spectral components that result from the shape <strong>of</strong> the window. Multiplying the time<br />
signal by the window function does the windowing. The split cosine bell taper for a<br />
6,000-point long signal is shown in Figure 3.9.<br />
Figure 3.9 Plot <strong>of</strong> the split cosine bell taper used as a window for FFT calculation.<br />
Past research in power spectral analysis <strong>of</strong> heart rate variability correlates three<br />
distinct frequency regions peaks with certain physiological parameters [14] as illustrated<br />
by a more classical power spectrum <strong>of</strong> the IIBI signal in Figure 3.10. The very low<br />
frequency band (0.003-0.04 Hz) is associated with vasomotor control and temperature<br />
control. The low frequency band (0.04-0.15 Hz) is associated with baroreceptormediated<br />
blood pressure control. The high frequency band (0.15-0.5 Hz) has been linked<br />
with respiration.


