prediction of nigerian crude oil viscosity using artificial neural network
prediction of nigerian crude oil viscosity using artificial neural network
prediction of nigerian crude oil viscosity using artificial neural network

You also want an ePaper? Increase the reach of your titles
YUMPU automatically turns print PDFs into web optimized ePapers that Google loves.
186<br />
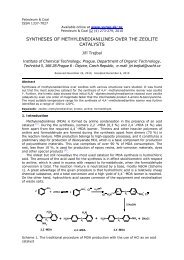
highest correlation coefficient <strong>of</strong> 0.9989 as compared to those obtained <strong>using</strong> other<br />
correlations, clearly demonstrated that the ANN µ ob model were better predictors <strong>of</strong><br />
<strong>viscosity</strong> than all the empirical correlations as graphically illustrated in Figures 1, 2, 3 and 4.<br />
Table 1: The results for the data used for the testing phase <strong>of</strong> μ<br />
ob<br />
mModel<br />
R<br />
s<br />
1042<br />
1119<br />
977<br />
1237<br />
210<br />
3100<br />
1232<br />
1137<br />
1053<br />
950<br />
R Gasgra<br />
s<br />
API P μ μ μ<br />
ob<br />
obnn<br />
obchew − connally<br />
μobbeg−<br />
robinson<br />
219<br />
183<br />
188<br />
180<br />
154<br />
215<br />
216<br />
212<br />
216<br />
214<br />
1.118<br />
0.920<br />
0.870<br />
0.940<br />
0.73<br />
1.048<br />
0.78<br />
0.78<br />
0.91<br />
0.77<br />
19<br />
40.6<br />
39.4<br />
43.4<br />
23.3<br />
45.4<br />
43.8<br />
44.1<br />
38.2<br />
39.8<br />
2951<br />
2736<br />
2858<br />
2655<br />
1680<br />
4340<br />
3963<br />
3710<br />
2965<br />
3614<br />
0.28<br />
0.3<br />
0.3<br />
0.3<br />
3.84<br />
0.15<br />
0.22<br />
0.23<br />
0.29<br />
0.25<br />
1.2<br />
0.28<br />
0.32<br />
0.24<br />
4.71<br />
0.54<br />
0.21<br />
0.22<br />
0.29<br />
0.28<br />
1.03<br />
0.28<br />
0.3<br />
0.24<br />
3.5<br />
0.14<br />
0.21<br />
0.22<br />
0.28<br />
0.27<br />
Table 2: The Statistical Analysis for μ<br />
ob<br />
Model<br />
Correlation Chew-Connally Begg-Robinson Neutral Network<br />
Ave. absolute relative error (E ave ) 0,45852 0,1741 0,06781<br />
Minimum absolute relative error (E min ) 3,8 3,12 0,12532<br />
Maximum absolute relative error<br />
0,225806 0,391304 0,347826<br />
(E max ) correlation coefficient (R 2 )<br />
Fig. 3 Comparison <strong>of</strong> the estimated <strong>crude</strong> <strong>oil</strong><br />
<strong>viscosity</strong> versus experimental <strong>crude</strong> <strong>oil</strong> <strong>viscosity</strong><br />
(µ ob ANN model).<br />
Fig. 4 Comparison <strong>of</strong> the estimated <strong>crude</strong> <strong>oil</strong><br />
<strong>viscosity</strong> versus experimental <strong>crude</strong> <strong>oil</strong> <strong>viscosity</strong><br />
(Chew-Connally correlation).<br />
Fig. 5 Comparison <strong>of</strong> the estimated <strong>crude</strong> <strong>oil</strong><br />
<strong>viscosity</strong> versus experimental <strong>crude</strong> <strong>oil</strong> <strong>viscosity</strong><br />
(Beggs-Robinson correlation).<br />
Fig.6 Comparison <strong>of</strong> different correlation<br />
coefficients for different correlations <strong>of</strong> µ ob