Counting and measuring using image analysis software
Counting and measuring using image analysis software
Counting and measuring using image analysis software

Create successful ePaper yourself
Turn your PDF publications into a flip-book with our unique Google optimized e-Paper software.
<strong>Counting</strong> <strong>and</strong> <strong>measuring</strong> <strong>using</strong> <strong>image</strong> <strong>analysis</strong> <strong>software</strong><br />
<strong>Counting</strong> <strong>and</strong> <strong>measuring</strong><br />
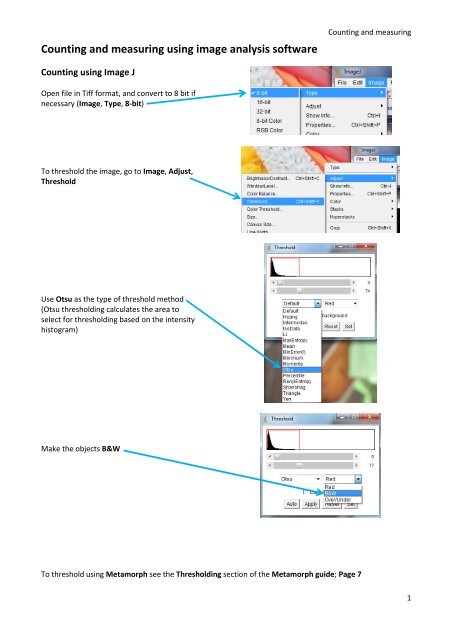
<strong>Counting</strong> <strong>using</strong> Image J<br />
Open file in Tiff format, <strong>and</strong> convert to 8 bit if<br />
necessary (Image, Type, 8-bit)<br />
To threshold the <strong>image</strong>, go to Image, Adjust,<br />
Threshold<br />
Use Otsu as the type of threshold method<br />
(Otsu thresholding calculates the area to<br />
select for thresholding based on the intensity<br />
histogram)<br />
Make the objects B&W<br />
To threshold <strong>using</strong> Metamorph see the Thresholding section of the Metamorph guide; Page 7<br />
1
<strong>Counting</strong> <strong>and</strong> <strong>measuring</strong><br />
If some of your objects are touching each other, go<br />
to Process, Binary, Make Binary<br />
Ok<br />
Then go to Process, Binary, Watershed<br />
You can also separate objects manually<br />
Make sure the Draw Tools are visible by clicking the<br />
>> icon <strong>and</strong> selecting Draw Tools<br />
Use the colour picker tool <strong>and</strong> click on the<br />
background<br />
2
Select the pencil tool, <strong>and</strong> double click the icon to<br />
adjust the line width<br />
<strong>Counting</strong> <strong>and</strong> <strong>measuring</strong><br />
Draw lines through adjacent objects to separate<br />
them<br />
NB. You can also use the draw tools to colour in, or<br />
erase objects you don’t want to count, just make<br />
them the same colour as the background<br />
When you are finished, make sure the background is<br />
black <strong>and</strong> the objects are white.<br />
If this is not the case you can select tick the Dark<br />
Background option in the Threshold box<br />
To count the number of objects, click on Analyse,<br />
Analyse Particles<br />
Adjust the parameters of the objects you want to<br />
count. Make sure the Summarize box is ticked<br />
A summary window will appear. The Count column<br />
tells you the number of objects<br />
3
Measuring <strong>using</strong> Image J<br />
<strong>Counting</strong> <strong>and</strong> <strong>measuring</strong><br />
Start by opening the Region of Interest Manager by<br />
going to Analyse, Tools, ROI Manager<br />
Or click the ROI Manager icon<br />
Then you need to select something to measure, so<br />
pick one of the selection tools <strong>and</strong> draw a region of<br />
interest<br />
In the ROI Manager window click Add, <strong>and</strong> your<br />
selection will appear in the list<br />
NB. You can rename your selections to help you<br />
identify them<br />
When <strong>measuring</strong> intensity it is best to use 16-bit <strong>image</strong>s, <strong>and</strong> make sure your channels are split, otherwise<br />
you will just record an average intensity across all the different channels.<br />
If you are <strong>measuring</strong> area or length you may want to set the scale of your <strong>image</strong>, so your measurements are<br />
in microns instead of pixels. See Set the Scale section.<br />
4
<strong>Counting</strong> <strong>and</strong> <strong>measuring</strong><br />
You can draw multiple regions of interest <strong>using</strong> the different drawing tools, just remember to Add each one<br />
to the ROI Manager. To delete a selection click Delete<br />
You then need to decide what measurements you<br />
want to record.<br />
Go to Analyse, Set Measurements<br />
And pick what you want in the Set Measurements<br />
window<br />
This is the average<br />
intensity within the<br />
region selected<br />
5
<strong>Counting</strong> <strong>and</strong> <strong>measuring</strong><br />
In the ROI Manager window, select one of your<br />
regions of interest <strong>and</strong> click Measure<br />
A Results window will appear. This contains the measurements you requested.<br />
The Label column displays the name of the <strong>image</strong> <strong>and</strong> the name of the region of interest<br />
The Area <strong>and</strong> Perimeter are<br />
measured in pixels, unless you<br />
have set the scale of your <strong>image</strong><br />
The Mean column is the average<br />
intensity within the region<br />
selected (Mean Gray Value)<br />
Min <strong>and</strong> Max are the minimum<br />
<strong>and</strong> maximum intensity values<br />
within the region selected<br />
To save these results you will need to copy <strong>and</strong> paste them into Excel<br />
To transfer a region of interest to another <strong>image</strong>, select the <strong>image</strong> you want to transfer to, <strong>and</strong> then select<br />
the region from the ROI Manager. You can then make the same measurements on this <strong>image</strong> by clicking<br />
Measure<br />
6
<strong>Counting</strong> <strong>and</strong> <strong>measuring</strong><br />
The measurements from this new <strong>image</strong> are distinguishable from your previous ones, as the Label tells you<br />
which <strong>image</strong> has been used<br />
To select multiple areas <strong>and</strong> group them as one region of interest, hold down the shift key when making<br />
selections. Once you have finished selecting things, add the selection to the ROI Manager as a single item<br />
Now when you hit Measure, the area will be a sum of all the selections, <strong>and</strong> the Mean will be the average<br />
intensity across all the selections<br />
7
<strong>Counting</strong> <strong>and</strong> <strong>measuring</strong><br />
Quick measurements<br />
To make a quick measurement on just one <strong>image</strong><br />
you don’t have to use the ROI Manager. You can just<br />
use the selection tools, draw your selection, <strong>and</strong><br />
click Analyse, Measure<br />
See instructions above on how to change what measurements are displayed (Analyse, Set Measurements)<br />
To remove a selection go to Edit, Selection, Select<br />
None<br />
<strong>Counting</strong> <strong>and</strong> <strong>measuring</strong> <strong>using</strong> Metamorph<br />
• To count the number of cells see the Cell Scoring section of the Metamorph guide; Page 12<br />
Cell scoring uses a maximum of 2 colours, one of which needs to be DAPI nuclei staining.<br />
See also the Nuclei counting section of the Metamorph guide; Page 15, to count just nuclei.<br />
• To count <strong>using</strong> two or more wavelengths, see the Multi-Wavelength cell scoring section of the<br />
Metamorph guide; Page 13<br />
• To measure distance or area in Metamorph you will need to calibrate your <strong>image</strong>s. See the<br />
Calibrating Images section of the Metamorph guide; Page 7<br />
• To make measurements from different regions of interest see the Region Measurements section of<br />
the Metamorph guide; Page 8<br />
8