Oxidation/Diffusion/Ion Implantation
Oxidation/Diffusion/Ion Implantation
Oxidation/Diffusion/Ion Implantation

Create successful ePaper yourself
Turn your PDF publications into a flip-book with our unique Google optimized e-Paper software.
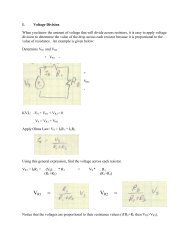
Thermal <strong>Oxidation</strong><br />
Formation of SiO 2
Silicon <strong>Oxidation</strong><br />
• Silicon easily forms an oxide<br />
– Native oxide present upon exposure to air at R.T. (1.5-2.0 nm)<br />
• Thermal Deposition or Chemical Vapor Deposition (CVD)<br />
• Thermal: Dry (O 2 ) or Wet (O 2 /H 2 O)<br />
• Dry <strong>Oxidation</strong> described by Deal-Grove Model<br />
Dry <strong>Oxidation</strong>: Si + O 2 → SiO 2<br />
Wet <strong>Oxidation</strong>: Si + 2H 2 O → SiO 2 + 2H 2<br />
*Notice Silicon is required for the reaction so once an oxide starts to<br />
form, oxygen has to move towards the Si-SiO 2 interface to<br />
combine with silicon – Silicon is consumed in this reaction (44%<br />
of the thickness of the oxide is consumed). The interface has not<br />
seen the atmosphere.
Oxide thickness and Rate Coefficients<br />
t 2 + At = B(t +! )<br />
ox ox<br />
Approx. for<br />
Thin Oxides<br />
Approx. for<br />
Thick Oxides<br />
t ox<br />
! B A<br />
(t +! )<br />
t 2 ! B(t +! )<br />
ox<br />
• B/A is the linear rate<br />
coefficient<br />
• B is the parabolic rate<br />
coefficient<br />
Note:<br />
• <strong>Oxidation</strong> rate slows as the oxide thickens.<br />
• τ is a factor that accounts for any oxide present when<br />
another oxidation begins.<br />
! = t o<br />
2 + At o<br />
B
B and B/A coefficients for wet/dry oxidation as a function of<br />
HCl concentration for (111) and (100) surfaces<br />
Chlorine cleans the gas ambient of impurities
Model is not good at predicting oxidation rate in<br />
the initial oxidation regime<br />
<strong>Oxidation</strong> rate is<br />
slightly higher than<br />
the model predicts
SiO 2 is amorphous but has some short range order<br />
A Si atom is located at the center of a tetrahedron<br />
Randomly oriented<br />
network joined by<br />
combination of bridging<br />
(oxygen atoms shared in<br />
tetrahedra) & nonbridging<br />
oxygen atoms
Oxide Characterization<br />
Primary metric of importance is t ox<br />
Color Chart - colors due to interference between incident and<br />
reflected light. Colors repeat so need to have some idea of t ox<br />
Surface profilometry – mechanical scan with sharp stylus;<br />
you do need a step in the film for reference or baseline<br />
Ellipsometry – polarized light is used to illuminate wafer at<br />
an angle to surface; beam is reflected from both oxide and silicon<br />
surface, difference in polarization leads to calculated t ox ; need n f<br />
Nanospec – interference technique that uses light at nearly<br />
normal incidence; reflected light is measured as a function of λ and<br />
t ox can be calculated.<br />
Electrical techniques – Form MOS capacitor and obtain C-V<br />
curves to find: breakdown voltage, mobile/trapped charge, t ox from<br />
C ox (know Area (A) and ε ox ). Used to determine quality of oxides as<br />
well as t ox .
Ellipsometer<br />
Nanospec<br />
Profilometer<br />
C-V measurements
Shifting and Slope of C-V Curve<br />
Fixed charge shifts the<br />
curve while the<br />
presence of Si/SiO 2<br />
interface states affects<br />
slope of C-V curve<br />
Post oxidation Anneal (POA) in an inert (N 2 or Argon) will lower<br />
fixed charge density at the Si-SiO 2 interface.
<strong>Oxidation</strong> Furnaces
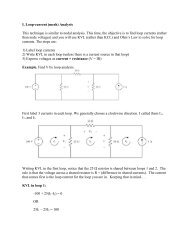
<strong>Diffusion</strong><br />
<strong>Diffusion</strong> - the movement of a<br />
chemical species from an area<br />
of high concentration to an area<br />
of lower concentration. The<br />
controlled diffusion of dopants<br />
into silicon is the foundation of<br />
forming a p-n junction to<br />
fabricate devices.
The purpose of diffusion is to introduce dopants<br />
(substitutional point defects or intentional impurities)<br />
into a silicon wafer in a controlled manner. A designer<br />
will dictate a concentration level – lightly doped wafers<br />
may be just a few ppm (10 17 atoms/cm 3 ).<br />
Fick’s <strong>Diffusion</strong> Law – basic equation to describe a<br />
movement of particles from a high concentration region.<br />
J = !D "C(x,t)<br />
"x<br />
Leads to an equation where 2 boundary<br />
conditions are needed to solve.<br />
J is net flux of material (units are number per<br />
unit time per unit area);<br />
D is the diffusion coefficient,<br />
C is the impurity concentration<br />
(-) indicates movement in direction of<br />
decreasing concentration
Solid Solubility<br />
Maximum concentration of a material that can be dissolved in<br />
another material.<br />
Solid solubility of common silicon impurities: note that concentration increases to<br />
the left (all rights reserved, reprinted with permission, © 1960 AT & T).
Impurity Profile
Analytic Solutions of Fick’s Law<br />
Two Sets of Boundary Conditions<br />
1) Predeposition diffusion: dopant source is fixed at the surface for all times > 0<br />
2) Drive-in diffusion: an initial amount of dopant is introduced and then diffused<br />
into the wafer
Predeposition and Drive-In<br />
Predep – constant source<br />
Drive-in – limited source<br />
C(z, 0) = 0<br />
C(z, 0) = 0<br />
C(0,t) = C S<br />
C(!,t) = 0<br />
C(!,t) = 0<br />
Q = constant<br />
! z $<br />
C(z,t) =<br />
C(z,t) = C S<br />
erfc#<br />
&, t > 0<br />
" 2 Dt %<br />
C S is the fixed surface concentration, erfc is<br />
tabulated;<br />
Dt is the characteristic diffusion length.<br />
The dose, Q, (atoms/cm 2 ) from predep is given<br />
by:<br />
Q T<br />
(t) = 2 ! C(0,t) Dt<br />
C S<br />
= C(0,t) =<br />
z ! 0<br />
Q T<br />
!Dt e"z2 4Dt ,t > 0<br />
Q T<br />
!Dt
Junction depth equations<br />
When diffusing a dopant into a wafer of the opposite type, the<br />
junction depth will be the distance from the wafer surface where<br />
the surface concentration, C S , is equal to the background<br />
concentration, C B<br />
Predep – constant source<br />
"<br />
x j<br />
= 2 Dterfc !1<br />
$<br />
#<br />
C B<br />
C S<br />
%<br />
'<br />
&<br />
Drive-in<br />
x j<br />
=<br />
"<br />
4Dt ln$<br />
#<br />
C B<br />
Q T<br />
!Dt<br />
%<br />
'<br />
&
Calculation example<br />
A wafer is heated to 1100°C and exposed to phosphorus. After 5<br />
minutes, the dopant source is removed. The furnace temperature is<br />
raised to 1200°C and diffusion is carried out for 2 hours.<br />
Assume:<br />
• <strong>Diffusion</strong> coefficients for P (determined from the Arrhenius<br />
equation: temp dependence of the reaction rate)<br />
D P = 1.43 × 10 -13 cm 2 /sec at 1100°C<br />
D P = 1.17 × 10 -12 cm 2 /sec at 1200°C<br />
• Wafer is p-type with a substrate concentration of 10 16 cm -3<br />
Find:<br />
a) The dose, Q<br />
b) The junction depth, x j , after predep<br />
c) The junction depth, x j , after drive-in
Analysis of Diffused Profiles<br />
After diffusion, sheet resistance is measured in units of Ω/square by<br />
either a 4 point probe or by the Van der Pauw method.
<strong>Diffusion</strong> Systems<br />
Components:<br />
• High T Furnaces, multi-zone<br />
• Gas/liquid lines or Solid sources fit into quartz boat<br />
• Quartz boats, slotted to hold wafer<br />
• Mechanism for pushing/pulling boats<br />
Slotted boats
<strong>Ion</strong> <strong>Implantation</strong>
<strong>Ion</strong> <strong>Implantation</strong><br />
An alternative to diffusion as a way to introduce dopants: ionized<br />
impurity atoms accelerated through an electrostatic field strike the<br />
surface of the wafer.<br />
The dose is controlled by the ion current.<br />
Typical ion energies 1-200 keV.<br />
Advantages: Low temperature, tailor dopant profile<br />
Disadvantages: Expensive process, low throughput, damage to the<br />
lattice
Three components: Source, acceleration tube, and end station<br />
• Starts with feed gas<br />
containing implant<br />
species: BF 3 , AsH 3 , PH 3 ;<br />
gas is ionized<br />
• <strong>Ion</strong> stream is accelerated<br />
in high vacuum tube<br />
(
Both horizontal and vertical<br />
pairs of deflection plates are<br />
used; beam is rastered back and<br />
forth and up and down,<br />
writing uniformly across the<br />
wafer<br />
Or beam is rastered in only one<br />
direction; wafers are placed on<br />
the perimeter of a spinning disc<br />
for higher throughput<br />
Dose (Q or ϕ) determined by<br />
measurement of current:<br />
Q = tI<br />
qA<br />
Where t is time, q is<br />
electronic charge, I is<br />
current, and A is wafer area<br />
Units (ions/cm 2 )
Vertical Projected Range (R p ) and Straggle (ΔR p )<br />
When an energetic ion enters a solid, it will begin to lose energy. The<br />
distance that the ion travels in the semiconductor is its range, R. For a<br />
uniform beam, the quantity of interest is not the total distance traveled, but the<br />
average depth, the projected range, R p .<br />
Model the range of depths:<br />
N(x) =<br />
!<br />
2!"R p<br />
e #(x#R p ) 2 /2"R p<br />
2<br />
Where R p is the projected<br />
range, ΔR p is the standard<br />
deviation (or straggle), ϕ is the<br />
dose
Calculation example<br />
A 30-keV implant of Boron is performed into n-type silicon. The<br />
dose is 10 12 cm -2 .<br />
Find:<br />
a) The depth of the peak of the implanted profile (R p ).<br />
b) The concentration at that depth.<br />
c) The concentration at a depth of 3000 Å (0.3 µm).
Channeling can occur<br />
when ion velocity is<br />
parallel to a major crystal<br />
orientation. Some ions<br />
may travel considerable<br />
distances with little<br />
energy loss.<br />
<strong>Ion</strong> implantation causes lattice damage that<br />
can be repaired by high temperature<br />
annealing to recrystallize; there is a threshold<br />
dose above which the damage is complete (no<br />
evidence of long range order, surface is<br />
amorphous).<br />
(A) Models of the diamond structure<br />
along a major crystal axis 〈110〉 and<br />
along a random direction. (reprinted<br />
by permission, Academic Press, after<br />
Mayer et al.).