annual report - Pumpkin Patch investor relations
annual report - Pumpkin Patch investor relations
annual report - Pumpkin Patch investor relations

You also want an ePaper? Increase the reach of your titles
YUMPU automatically turns print PDFs into web optimized ePapers that Google loves.
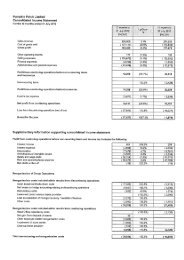
PUMPKIN PATCH LIMITED & SUBSIDIARIES NOTES TO THE FINANCIAL STATEMENTS 31 JULY 2010<br />
PUMPKIN PATCH LIMITED & SUBSIDIARIES NOTES TO THE FINANCIAL STATEMENTS 31 JULY 2010<br />
25 FINANCIAL RISK MANAGEMENT continued<br />
The Group enters into forward exchange contracts to manage the risks associated with<br />
foreign currency denominated sales and also manage the purchase of foreign currency<br />
denominated products.<br />
The table below analyses the GroupÕs derivative financial instruments that will be settled on<br />
a gross or net basis into relevant maturity groupings based on the remaining period at the<br />
balance sheet to the contractual maturity date. The amounts disclosed in the table are the<br />
contractual undiscounted cash flows. They are expected to occur and affect profit or loss<br />
at various dates between balance date and the following five years.<br />
Less than<br />
1 year<br />
Between 1<br />
& 2 years<br />
Between 2<br />
& 5 years<br />
Over<br />
5 years<br />
Consolidated $Õ000 $Õ000 $Õ000 $Õ000<br />
At 31 July 2010<br />
Forward foreign exchange contracts -<br />
cash flow hedges<br />
inflow 137,567 88,329 63,426 -<br />
outflow (108,732) (71,041) (30,061) -<br />
At 31 July 2009<br />
Forward foreign exchange contracts -<br />
cash flow hedges<br />
inflow 86,805 75,157 43,828 -<br />
outflow (66,782) (66,683) (41,238) -<br />
Net settled derivatives -<br />
interest rate swaps<br />
net outflow (476) - - -<br />
(D) FAIR VALUE ESTIMATION<br />
Effective for <strong>annual</strong> periods beginning on or after 1 January 2009, the group adopted the<br />
amendment to NZ IFRS 7 for financial instruments that are measured in the balance sheet<br />
at fair value, this requires disclosure of fair value measurements by level of the following fair<br />
value measurement hierarchy:<br />
Level 1<br />
Quoted prices (unadjusted) in active markets for identical assets or liabilities.<br />
Level 2<br />
Inputs other than quoted prices included within level 1 that are observable for the asset or<br />
liability, either directly (that is, as prices) or indirectly (that is, derived from prices) (level 2).<br />
Level 3<br />
Inputs for the asset or liability that are not based on observable market data (that is,<br />
unobservable inputs) (level 3).<br />
The following table presents the groupÕs assets and liabilities that are measured at fair<br />
value. The parent company did not have any assets or liabilities measured at fair value<br />
(2009: nil)<br />
Level 1 Level 2 Level 3 Total balance<br />
Consolidated $Õ000 $Õ000 $Õ000 $Õ000<br />
At 31 July 2010<br />
Assets<br />
Derivatives used for hedging - 7,485 - 7,485<br />
- 7,485 - 7,485<br />
Liabilities<br />
Derivatives used for hedging - 25,550 - 25,550<br />
- 25,550 - 25,550<br />
At 31 July 2009<br />
Assets<br />
Derivatives used for hedging - 6,785 - 6,785<br />
- 6,785 - 6,785<br />
Liabilities<br />
Derivatives used for hedging - 23,722 - 23,722<br />
- 23,722 - 23,722<br />
Level 2<br />
The fair value of financial instruments that are not traded in an active market (for example,<br />
over-the-counter derivatives) is determined by using valuation techniques. These valuation<br />
techniques maximise the use of observable market data where it is available and rely as<br />
little as possible on entity specific estimates. If all significant inputs required to fair value an<br />
instrument are observable, the instrument is included in level 2.<br />
20<br />
years<br />
young<br />
93