annual report - Pumpkin Patch investor relations
annual report - Pumpkin Patch investor relations
annual report - Pumpkin Patch investor relations

Create successful ePaper yourself
Turn your PDF publications into a flip-book with our unique Google optimized e-Paper software.
PUMPKIN PATCH LIMITED & SUBSIDIARIES NOTES TO THE FINANCIAL STATEMENTS 31 JULY 2010<br />
PUMPKIN PATCH LIMITED & SUBSIDIARIES NOTES TO THE FINANCIAL STATEMENTS 31 JULY 2010<br />
23 RELATED PARTY TRANSACTIONS continued<br />
(C) KEY MANAGEMENT AND DIRECTOR COMPENSATION<br />
Key management personnel compensation for the years ended 31 July 2010 and 31 July<br />
2009 is set out below. The key management personnel comprise certain members of<br />
the executive team (including both executive and non-executive directors) who have the<br />
greatest authority for the strategic direction and management of the company.<br />
The amount paid by the Group and the Parent were consistent for both 2010 and 2009.<br />
Directors<br />
fees<br />
Salaries and<br />
other short<br />
term employee<br />
benefits<br />
Cash<br />
based<br />
incentive<br />
issued<br />
Fair Value<br />
of share<br />
instruments<br />
issued<br />
Total<br />
$Õ000 $Õ000 $Õ000 $Õ000 $Õ000<br />
2010 381 1,789 1,010 248 3,428<br />
2009 321 1,842 - 214 2,377<br />
During the 2009 financial year, no cash based incentive payments were made.<br />
(D) BALANCES OUTSTANDING BETWEEN THE COMPANY AND ITS SUBSIDIARIES<br />
Parent at<br />
31 July 2010 31 July 2009<br />
$Õ000 $Õ000<br />
Amounts due from subsidiaries 165,450 126,780<br />
Amounts due to subsidiaries (207,221) (179,867)<br />
(41,771) (53,087)<br />
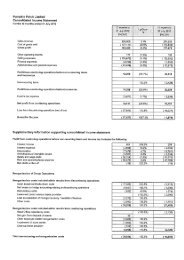
24 RECONCILIATION OF PROFIT AFTER INCOME TAX TO NET<br />
CASH INFLOW FROM OPERATING ACTIVITIES<br />
Consolidated - Year ended Parent - Year ended<br />
31 July<br />
2010<br />
31 July<br />
2009<br />
31 July<br />
2010<br />
31 July<br />
2009<br />
$Õ000 $Õ000 $Õ000 $Õ000<br />
Profit/(loss) after tax for the year 25,502 (26,739) 21,818 (21,060)<br />
Add (deduct) non-cash items:<br />
Depreciation 8,793 15,143 1,735 1,631<br />
Amortisation of intangibles 2,617 1,696 2,408 1,475<br />
Share based payments expense 431 1,576 431 1,290<br />
Revaluation of derivative financial<br />
instruments 108 (1,255) - -<br />
Fit out contributions amortised (2,205) (3,159) - (100)<br />
(Increase)/decrease in deferred taxation 342 8,895 425 (7,269)<br />
Writedown of investment in subsidiary<br />
company - - - 20,307<br />
Impairment of continuing stores - 16,787 - -<br />
Non-cash items discontinuing operations - 17,345 - -<br />
Foreign currency portfolio restructure<br />
reserve amortisation (11,972) - - -<br />
Add/(less) movements in working<br />
capital items:<br />
(Increase)/decrease in receivables and<br />
prepayments (2,548) 894 (34,140) 275<br />
(Increase)/decrease in inventories 2,722 25,804 - -<br />
Increase/(decrease) in payables and<br />
provisions (2,989) 3,590 27,439 1,580<br />
(Increase)/decrease in related party<br />
balances - - - 17,672<br />
Net cash inflow from operating activities 20,801 60,577 20,116 15,801<br />
20<br />
years<br />
young<br />
85