annual report - Pumpkin Patch investor relations
annual report - Pumpkin Patch investor relations
annual report - Pumpkin Patch investor relations

You also want an ePaper? Increase the reach of your titles
YUMPU automatically turns print PDFs into web optimized ePapers that Google loves.
PUMPKIN PATCH LIMITED & SUBSIDIARIES STATEMENTS OF CHANGES IN EQUITY FOR THE YEAR ENDED 31 JULY 2010<br />
PUMPKIN PATCH LIMITED & SUBSIDIARIES STATEMENTS OF CASH FLOWS FOR THE YEAR ENDED 31 JULY 2010<br />
STATEMENTS OF CHANGES IN EQUITY continued<br />
Attributable to equity holders of the Company<br />
Share<br />
capital<br />
Reserves<br />
Retained<br />
earnings/<br />
(deficit)<br />
Total<br />
equity<br />
Parent Notes $Õ000 $Õ000 $Õ000 $Õ000<br />
Balance at 01 August 2008 58,802 3,823 (3,650) 58,975<br />
Comprehensive income<br />
Profit/(loss) - - (21,060) (21,060)<br />
Other comprehensive income - - - -<br />
Total comprehensive income - - (21,060) (21,060)<br />
Movement in share based payments reserve 20 - 1,576 - 1,576<br />
Shares issued 18 752 - - 752<br />
Shares repurchased 18 (1,123) - - (1,123)<br />
Dividends paid 21 - - (10,848) (10,848)<br />
Balance at 31 July 2009 58,431 5,399 (35,558) 28,272<br />
Balance at 01 August 2009 58,431 5,399 (35,558) 28,272<br />
Comprehensive income<br />
Profit/(loss) - - 21,818 21,818<br />
Other comprehensive income - - - -<br />
Total comprehensive income - - 21,818 21,818<br />
Movement in share based payments reserve 20 - 431 - 431<br />
Dividends paid 21 - - (15,040) (15,040)<br />
Balance at 31 July 2010 58,431 5,830 (28,780) 35,481<br />
The above statements of changes in equity should be read in conjunction with the accompanying notes.<br />
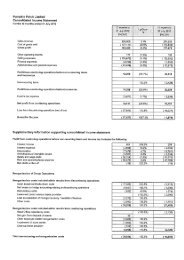
STATEMENTS OF CASH FLOWS For the year ended 31 July 2010<br />
Consolidated - Year ended Parent - Year ended<br />
31 July 31 July 31 July 31 July<br />
2010 2009 2010 2009<br />
Notes $Õ000 $Õ000 $Õ000 $Õ000<br />
Cash flows from operating activities<br />
Cash was provided from:<br />
Receipts from customers 380,765 429,535 9,583 41,364<br />
Sales tax received 763 - - 1<br />
Dividends received 3 4 1 25,161 -<br />
Interest received 3 192 309 7,402 871<br />
Cash was applied to:<br />
Payments to suppliers and employees (343,395) (352,765) (14,679) (16,409)<br />
Interest paid 3 (2,549) (5,144) (12,739) (448)<br />
Sales tax paid - (691) (14) (165)<br />
Income taxes paid (14,979) (10,668) 5,402 (9,413)<br />
Net cash operating inflows/(outflows) 24 20,801 60,577 20,116 15,801<br />
Cash flows from investing activities<br />
Cash applied to:<br />
Purchase of property, plant and equipment (9,593) (8,152) (1,168) (1,598)<br />
Purchase of intangibles (3,786) (3,644) (3,624) (3,475)<br />
Net investing cash inflows/(outflows) (13,379) (11,796) (4,792) (5,073)<br />
Cash flows from financing activities<br />
Cash was provided from:<br />
Proceeds from issue of share capital 18 - 752 - 752<br />
Repayment of borrowings - (66,000) (291) -<br />
Proceeds of borrowings 2,000 - - 319<br />
Cash was applied to:<br />
Payments for shares bought back 18 - (1,123) - (1,123)<br />
Proceeds from restructure of foreign<br />
currency portfolio 20 - 25,339 - -<br />
Dividends paid 21 (15,040) (10,848) (15,040) (10,848)<br />
Net financing cash (outflows)/inflows (13,040) (51,880) (15,331) (10,900)<br />
Net (decrease)/ increase in cash and<br />
cash equivalents (5,618) (3,099) (7) (172)<br />
Cash and cash equivalents at the<br />
beginning of the financial year 12,563 15,662 38 210<br />
Cash and cash equivalents at end of year 7 6,945 12,563 31 38<br />
The above statements of cash flows should be read in conjunction with the accompanying notes.<br />
20<br />
years<br />
young<br />
43