annual report - Pumpkin Patch investor relations
annual report - Pumpkin Patch investor relations
annual report - Pumpkin Patch investor relations

Create successful ePaper yourself
Turn your PDF publications into a flip-book with our unique Google optimized e-Paper software.
PUMPKIN PATCH LIMITED & SUBSIDIARIES BALANCE SHEETS AS AT 31 JULY 2010<br />
PUMPKIN PATCH LIMITED & SUBSIDIARIES STATEMENTS OF CHANGES IN EQUITY FOR THE YEAR ENDED 31 JULY 2010<br />
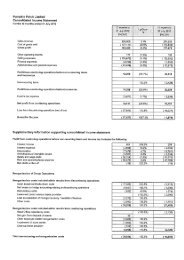
BALANCE SHEETS As at 31 July 2010<br />
Consolidated at Parent at<br />
31 July 2010 31 July 2009 31 July 2010 31 July 2009<br />
Notes $Õ000 $Õ000 $Õ000 $Õ000<br />
ASSETS<br />
Current assets<br />
Cash and cash equivalents 7 6,945 12,563 31 38<br />
Trade and other receivables 8 20,727 19,559 166,836 128,633<br />
Derivative financial instruments 10 4,930 4,123 - -<br />
Inventories 9 71,355 80,210 - -<br />
Current tax receivables 1,381 - 4,328 8,391<br />
Total current assets 105,338 116,455 171,195 137,062<br />
Non-current assets<br />
Property, plant and equipment 11 53,096 52,299 12,026 12,593<br />
Intangible assets 12 8,435 7,266 7,869 6,653<br />
Other financial assets 14 - - 58,189 58,189<br />
Trade and other receivables 4 4 4 4<br />
Derivative financial instruments 10 2,555 2,662 - -<br />
Deferred tax assets 13 9,161 9,502 - -<br />
Total non-current assets 73,251 71,733 78,088 77,439<br />
Total assets 178,589 188,188 249,283 214,501<br />
LIABILITIES<br />
Current liabilities<br />
Trade and other payables 15 31,653 34,055 212,970 185,531<br />
Interest bearing liabilities 16 25,000 10,000 28 319<br />
Current tax liabilities - 1,826 - -<br />
Derivative financial instruments 10 15,696 10,409 - -<br />
Deferred landlord contributions 2,058 2,326 - -<br />
Total current liabilities 74,407 58,616 212,998 185,850<br />
Non-current liabilities<br />
Interest bearing liabilities 16 8,000 21,000 - -<br />
Deferred landlord contributions 5,461 6,581 - -<br />
Derivative financial instruments 10 9,854 13,313 - -<br />
Deferred tax liabilities 13 - - 804 379<br />
Total non-current liabilities 23,315 40,894 804 379<br />
Total liabilities 97,722 99,510 213,802 186,229<br />
Net assets 80,867 88,678 35,481 28,272<br />
EQUITY<br />
Share capital 18 58,398 57,978 58,431 58,431<br />
Reserves 20 (1,544) 17,149 5,830 5,399<br />
Retained earnings / (deficit) 20 24,013 13,551 (28,780) (35,558)<br />
Total equity 80,867 88,678 35,481 28,272<br />
The above statements of financial position should be read in conjunction with the accompanying notes.<br />
STATEMENTS OF CHANGES IN EQUITY For the year ended 31 July 2010<br />
Attributable to equity holders of the Company<br />
Share<br />
capital Reserves<br />
Treasury<br />
stock<br />
Retained<br />
earnings<br />
Total<br />
equity<br />
Consolidated Notes $Õ000 $Õ000 $Õ000 $Õ000 $Õ000<br />
Balance at 01 August 2008 58,802 (12,420) (790) 51,138 96,730<br />
Comprehensive income<br />
Profit/(loss) - - - (26,739) (26,739)<br />
Other comprehensive income - 27,993 - - 27,993<br />
Total comprehensive income - 27,993 - (26,739) 1,254<br />
Movement in treasury stock - - 337 - 337<br />
Movement in share based<br />
payments reserve 20 - 1,576 - - 1,576<br />
Shares issued 18 752 - - - 752<br />
Shares repurchased 18 (1,123) - - - (1,123)<br />
Dividends paid 21 - - - (10,848) (10,848)<br />
Balance at 31 July 2009 58,431 17,149 (453) 13,551 88,678<br />
Balance at 01 August 2009 58,431 17,149 (453) 13,551 88,678<br />
Comprehensive income<br />
Profit/(loss) - - - 25,502 25,502<br />
Other comprehensive income - (19,124) - - (19,124)<br />
Total comprehensive income - (19,124) - 25,502 6,378<br />
Movement in treasury stock 18 - - 420 - 420<br />
Movement in share based<br />
payments reserve 20 - 431 - - 431<br />
Dividends paid 21 - - - (15,040) (15,040)<br />
Balance at 31 July 2010 58,431 (1,544) (33) 24,013 80,867<br />
The above statements of changes in equity should be read in conjunction with the accompanying notes.<br />
20<br />
years<br />
young<br />
41