annual report - Pumpkin Patch investor relations
annual report - Pumpkin Patch investor relations
annual report - Pumpkin Patch investor relations

Create successful ePaper yourself
Turn your PDF publications into a flip-book with our unique Google optimized e-Paper software.
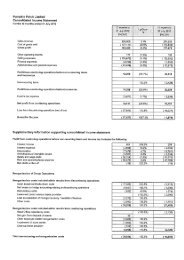
NEW ZEALAND RETAIL<br />
2010 2009<br />
Turnover NZ $Õ000 58,908 64,357 (8.5%)<br />
EBIT (1) NZ $Õ000 11,310 11,125 1.7%<br />
19.2% 17.3%<br />
Stores<br />
<strong>Pumpkin</strong> <strong>Patch</strong> 34 33<br />
Outlet 12 12<br />
Urban Angel 3 6<br />
49 51<br />
(1) Operating EBIT before non-recurring costs.<br />
The New Zealand retail environment remained subdued for much of the year<br />
with total sales down 8.5% or 6.3% when excluding temporary clearance stores<br />
operating in 2009 but not in 2010.<br />
Total EBIT was up 1.7% to $11.3m and EBIT as a percentage of sales was up a strong<br />
1.8% reflecting the focus on margin and inventory management across the year.<br />
At year end we had 49 stores open across New Zealand. Two new <strong>Pumpkin</strong> <strong>Patch</strong><br />
stores are expected to open in the 2011 year.<br />
WHOLESALE AND DIRECT<br />
2010 2009<br />
Turnover NZ $Õ000 53,217 62,540 (14.9%)<br />
EBIT NZ $Õ000 13,708 16,583 (17.3%)<br />
25.8% 26.5%<br />
With soft retail environments in their home markets our wholesale partners lowered their<br />
product orders in 2010. As a result of this and the continued strength of the NZD against<br />
most export currencies total sales were down 14.9% to $53.2m.<br />
The lower sales result led to EBIT being down 17.3% to $13.7m however EBIT margins<br />
remained at levels similar to 2009.<br />
During the year we established new wholesale partnerships in China, Lebanon, Malta,<br />
and Thailand taking the total number of wholesale markets to 20. We are in the process<br />
of finalising a number of <strong>relations</strong>hips in new markets for the 2011 year.<br />
The continued softness in global retail markets mean wholesale partners are only slowly<br />
returning to more normal buying patterns. The full impact of this and the impact of the<br />
new markets we are adding will not be seen until the 2012 financial year.<br />
UNITED KINGDOM RETAIL<br />
2010 2009<br />
Turnover GB £Õ000 23,636 22,520 5.0%<br />
Turnover NZ $Õ000 52,455 59,200 (11.4%)<br />
EBIT (1) NZ $Õ000 (885) (4,962) 82.2%<br />
Stores<br />
<strong>Pumpkin</strong> <strong>Patch</strong> 35 33<br />
Outlet 4 3<br />
39 36<br />
(1) Operating EBIT before non-recurring costs.<br />
While general retail conditions in the United Kingdom remained volatile throughout the<br />
year total sales in GBP terms were up 5.0%. However in NZD terms sales were down<br />
11.4% due to the significantly higher exchange rates experienced across the year.<br />
The EBIT loss for the year was $0.9m, a significant improvement on $5.0m loss<br />
last year. Improved margins and a focus on reducing overheads particularly at<br />
underperforming stores have all benefited the United Kingdom this year.<br />
Trading conditions are expected to remain soft in the short term but steadily improve<br />
later in the year and into 2012.<br />
During the year we opened 3 new stores (2009: 1) taking the total number of stores<br />
to 39. We expect to open 3 new stores in 2011.<br />
UNITED STATES RETAIL<br />
2010 2009<br />
Turnover US $Õ000 13,586 13,585 0.0%<br />
Turnover NZ $Õ000 19,138 22,825 (16.1%)<br />
EBIT (2) NZ $Õ000 (2,685) (9,289) 71.1%<br />
Stores<br />
<strong>Pumpkin</strong> <strong>Patch</strong> 20 20<br />
(2) EBIT excluding discontinued stores and before non-recurring costs.<br />
While retail conditions remained soft across the year trading patterns became more<br />
stable as the year progressed. Total USD sales from the 20 stores trading during the<br />
year were at similar levels as 2009. Sales in NZD terms were impacted by higher<br />
exchange rates and ended the year down 16%.<br />
The segment EBIT loss was $2.7m, a 71.1% improvement on last year (2009: $9.3m<br />
loss). Improved margins and the benefits of the 2009 reorganisation plan, mainly lower<br />
rental and depreciation charges, contributed to the much improved result.<br />
Conditions are expected to remain soft until the United States economy as a whole<br />
shows significant improvement.<br />
20<br />
years<br />
young<br />
15