

CalCOFI Reports, Vol. 30, 1989 - California Cooperative Oceanic ...
CalCOFI Reports, Vol. 30, 1989 - California Cooperative Oceanic ...
CalCOFI Reports, Vol. 30, 1989 - California Cooperative Oceanic ...

You also want an ePaper? Increase the reach of your titles
YUMPU automatically turns print PDFs into web optimized ePapers that Google loves.
SMITH ET AL.: ZOOPLANKTON PATTERN ANALYSIS<br />
CalCOFl Rep., <strong>Vol</strong>. <strong>30</strong>,<strong>1989</strong><br />
dard deviation. Note that a smaller segment of the<br />
M. pucijcu population occurred at 400-<strong>30</strong>0-rn depth<br />
both day and night.<br />
Euphasiid furciliae and adults, as well as other<br />
macrozooplankton taxa, also appeared in these<br />
samples.<br />
General Appearance of Aggregations<br />
There were no pronounced differences in the<br />
general appearance of aggregations between day<br />
and night. Both seem characterized by the appearance<br />
of shattered layers, shattered patches, and relatively<br />
smooth-edged patches. The physical size of<br />
the patches ranged from the threshold of detectabil-<br />
ity to relatively large at all depths at all times of day.<br />
The largest and most coherent aggregations were<br />
detected during the vertical migrations at dawn and<br />
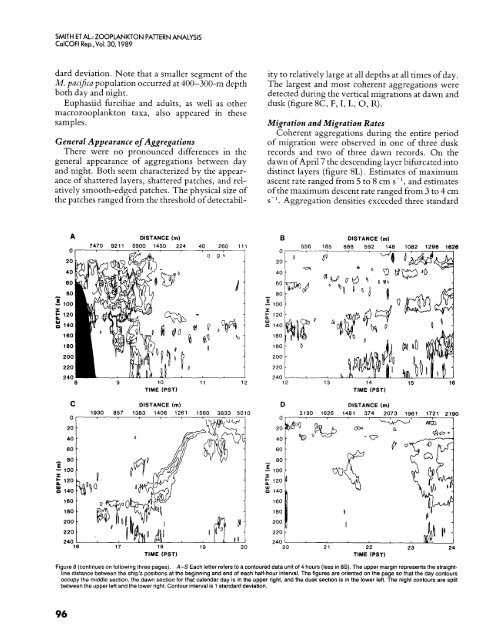
dusk (figure 8C, F, I, L, 0, R).<br />
Migration and Migration Rates<br />
Coherent aggregations during the entire period<br />
of migration were observed in one of three dusk<br />
records and two of three dawn records. On the<br />
dawn of April 7 the descending layer bifurcated into<br />
distinct layers (figure 8L). Estimates of maximum<br />
ascent rate ranged from 5 to 8 cm s-', and estimates<br />
of the maximum descent rate ranged from 3 to 4 cm<br />
s- '. Aggregation densities exceeded three standard<br />
A DISTANCE (rn) B DISTANCE (rn)<br />
0<br />
20<br />
40<br />
60<br />
80<br />
E too<br />
x<br />
t 120<br />
140<br />
160<br />
180<br />
200<br />
220<br />
7470 9211 5900 1450 224 40 260 111 556 185 888 592 148 1082 1296 1628<br />
240<br />
8 9 10 11 12 12 13 14 15 16<br />
TIME (PST)<br />
TIME (PST)<br />
C<br />
DISTANCE (rn)<br />
19<strong>30</strong> 857 1383 1406 1261 1560 3833 5010<br />
D<br />
0<br />
DISTANCE (rn)<br />
3190 1626 1481 374 2073 1961 1721 2190<br />
80<br />
-<br />
- E 100 -<br />
I<br />
120<br />
0<br />
140<br />
220 -<br />
16 17 18 19 20<br />
TIME (PST)<br />
Figure 8 (continues on following three pages). A-S Each letter refers to a contoured data unit of 4 hours (less in 8s). The upper margin represents the straightline<br />
distance between the ship's positions at the beginning and end of each half-hour interval. The figures are oriented on the page so that the day contours<br />
occupy the middle section, the dawn section for that calendar day is in the upper right, and the dusk section is in the lower left. The night contours are split<br />
between the upper left and the lower right. Contour interval is 1 standard deviation.<br />
96


