

CalCOFI Reports, Vol. 30, 1989 - California Cooperative Oceanic ...
CalCOFI Reports, Vol. 30, 1989 - California Cooperative Oceanic ...
CalCOFI Reports, Vol. 30, 1989 - California Cooperative Oceanic ...

Create successful ePaper yourself
Turn your PDF publications into a flip-book with our unique Google optimized e-Paper software.
SMITH ET AL.: ZOOPLANKTON PATTERN ANALYSIS<br />
CalCOFl Rep., <strong>Vol</strong>. <strong>30</strong>,<strong>1989</strong><br />
gation persisted for 10 minutes and the distance<br />
traveled in that half hour was 3200 m, the aggregation<br />
was said to extend 1070 m. The vertical plane<br />
area of each aggregation was estimated as the product<br />
of the vertical and horizontal dimensions. The<br />
sum of the vertical plane aggregation areas was estimated<br />
for each 4-hour period. The vertical plane<br />
area insonified was calculated by adding the ship’s<br />
meters of progress in 8 half-hour intervals and multiplying<br />
by the depth of observation or 240 m.<br />
Comparison of the two values yielded an estimate<br />
of “coverage. ” Since there were no perfectly rectangular<br />
aggregations, the aggregation areas represent<br />
an overestimate varying from about 25% for inscribed<br />
circles to a factor of two or more for diagonally<br />
extended aggregations. Data exist for<br />
correcting this bias and for improving precision by<br />
more frequent evaluation of ship’s speed.<br />
RESULTS<br />
Environmental Description<br />
Vertical profiles of temperature, dissolved oxygen,<br />
and chlorophyll a can be characterized as exhibiting<br />
similarity in shapes and values among<br />
repetitions. Five temperature profiles taken between<br />
April 6 and 7 showed temperatures declining<br />
evenly, with some structure from 17°C at the surface<br />
to 5°C at 800 m (figure 6A). Deep oxygen profiles<br />
made near the beginning of the cruise (1433,<br />
April 5) and the end of the cruise (0639, April 8)<br />
showed similar gradients, with a subsurface shallow<br />
maximum and a deep minimum at about 600<br />
m (figure 6B). Vertical profiles of pheopigments<br />
showed maxima of about 0.5 pg 1-’ at or near the<br />
depth of the chlorophyll maximum layer (figure<br />
6C). Six chlorophyll casts had distinct subsurface<br />
maxima of 1-2 pg 1-’ between 35 and 45 m (figure<br />
6D).<br />
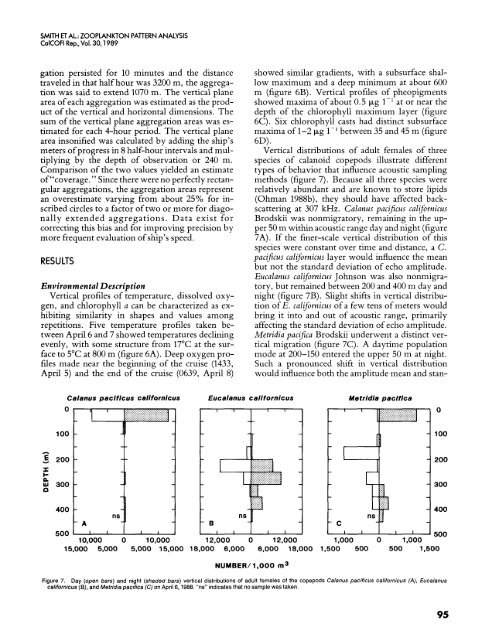
Vertical distributions of adult females of three<br />
species of calanoid copepods illustrate different<br />
types of behavior that influence acoustic sampling<br />
methods (figure 7). Because all three species were<br />
relatively abundant and are known to store lipids<br />
(Ohman 1988b), they should have affected backscattering<br />
at <strong>30</strong>7 kHz. Calanus pacificus californicus<br />
Brodskii was nonmigratory, remaining in the upper<br />
50 m within acoustic range day and night (figure<br />
7A). If the finer-scale vertical distribution of this<br />
species were constant over time and distance, a C.<br />
paci_fcus calijornicus layer would influence the mean<br />
but not the standard deviation of echo amplitude.<br />
Eucalanus californicus Johnson was also nonmigratory,<br />
but remained between 200 and 400 m day and<br />
night (figure 7B). Slight shifts in vertical distribution<br />
of E. calijornicus of a few tens of meters would<br />
bring it into and out of acoustic range, primarily<br />
affecting the standard deviation of echo amplitude.<br />
Metridia pacijka Brodskii underwent a distinct vertical<br />
migration (figure 7C). A daytime population<br />
mode at 200-150 entered the upper 50 m at night.<br />
Such a pronounced shift in vertical distribution<br />
would influence both the amplitude mean and stan-<br />
-<br />
Calanus pacificus californicus Eucalanus californicus Metridia pacifica<br />
0<br />
100<br />
5 200<br />
r<br />
c<br />
<strong>30</strong>0<br />
0<br />
100<br />
200<br />
<strong>30</strong>0<br />
400<br />
400<br />
500<br />
500<br />
10,000 0 10,000 12,000 0 12.000 1,000 0 1,000<br />
15,000 5,000 5,000 15,000 18,000 6,000 6,000 18,000 1,500 500 500 1,500<br />
NUMBER/ 1,000 m3<br />
Figure 7. Day (open bars) and night (shaded bars) vertical distributions of adult females of the copepods Calanus pacificus californicus (A), Eucalanus<br />
californicus (S), and Metridia pacifica (C) on April 6,1988. “ns” indicates that no sample was taken.<br />
95


