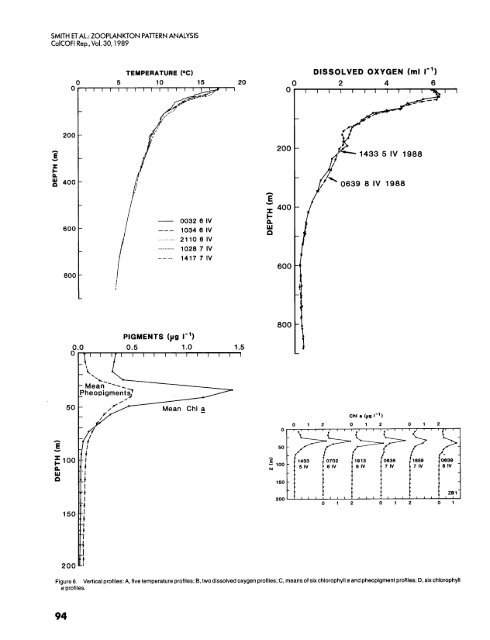
SMITH ET AL.: ZOOPLANKTON PAllERN ANALYSIS ColCOFl Rep., <strong>Vol</strong>. <strong>30</strong>,<strong>1989</strong> 0 TEMPERATURE ("C) DISSOLVED OXYGEN (ml I-') 0 2 4 6 0 - Y E I c n 200 400 600 800 I - 0032 6 IV ___ 1034 6 IV .- ----. __- 2110 6 IV 1028 7 IV 1417 7 IV 200 h E 'I 400 + n w n 600 & 1433 5 IV 1988 / 0639 8 IV 1988 800 Chl a (pg 1-l) 0 1 2 0 1 2 0 1 2 Figure 6. Vertical profiles: A, five temperature profiles; B, two dissolved oxygen profiles; C, means of six chlorophyll a and pheopigment profiles; D, six chlorophyll a profiles. 94
SMITH ET AL.: ZOOPLANKTON PATTERN ANALYSIS CalCOFl Rep., <strong>Vol</strong>. <strong>30</strong>,<strong>1989</strong> gation persisted for 10 minutes and the distance traveled in that half hour was 3200 m, the aggregation was said to extend 1070 m. The vertical plane area of each aggregation was estimated as the product of the vertical and horizontal dimensions. The sum of the vertical plane aggregation areas was estimated for each 4-hour period. The vertical plane area insonified was calculated by adding the ship’s meters of progress in 8 half-hour intervals and multiplying by the depth of observation or 240 m. Comparison of the two values yielded an estimate of “coverage. ” Since there were no perfectly rectangular aggregations, the aggregation areas represent an overestimate varying from about 25% for inscribed circles to a factor of two or more for diagonally extended aggregations. Data exist for correcting this bias and for improving precision by more frequent evaluation of ship’s speed. RESULTS Environmental Description Vertical profiles of temperature, dissolved oxygen, and chlorophyll a can be characterized as exhibiting similarity in shapes and values among repetitions. Five temperature profiles taken between April 6 and 7 showed temperatures declining evenly, with some structure from 17°C at the surface to 5°C at 800 m (figure 6A). Deep oxygen profiles made near the beginning of the cruise (1433, April 5) and the end of the cruise (0639, April 8) showed similar gradients, with a subsurface shallow maximum and a deep minimum at about 600 m (figure 6B). Vertical profiles of pheopigments showed maxima of about 0.5 pg 1-’ at or near the depth of the chlorophyll maximum layer (figure 6C). Six chlorophyll casts had distinct subsurface maxima of 1-2 pg 1-’ between 35 and 45 m (figure 6D). Vertical distributions of adult females of three species of calanoid copepods illustrate different types of behavior that influence acoustic sampling methods (figure 7). Because all three species were relatively abundant and are known to store lipids (Ohman 1988b), they should have affected backscattering at <strong>30</strong>7 kHz. Calanus pacificus californicus Brodskii was nonmigratory, remaining in the upper 50 m within acoustic range day and night (figure 7A). If the finer-scale vertical distribution of this species were constant over time and distance, a C. paci_fcus calijornicus layer would influence the mean but not the standard deviation of echo amplitude. Eucalanus californicus Johnson was also nonmigratory, but remained between 200 and 400 m day and night (figure 7B). Slight shifts in vertical distribution of E. calijornicus of a few tens of meters would bring it into and out of acoustic range, primarily affecting the standard deviation of echo amplitude. Metridia pacijka Brodskii underwent a distinct vertical migration (figure 7C). A daytime population mode at 200-150 entered the upper 50 m at night. Such a pronounced shift in vertical distribution would influence both the amplitude mean and stan- - Calanus pacificus californicus Eucalanus californicus Metridia pacifica 0 100 5 200 r c <strong>30</strong>0 0 100 200 <strong>30</strong>0 400 400 500 500 10,000 0 10,000 12,000 0 12.000 1,000 0 1,000 15,000 5,000 5,000 15,000 18,000 6,000 6,000 18,000 1,500 500 500 1,500 NUMBER/ 1,000 m3 Figure 7. Day (open bars) and night (shaded bars) vertical distributions of adult females of the copepods Calanus pacificus californicus (A), Eucalanus californicus (S), and Metridia pacifica (C) on April 6,1988. “ns” indicates that no sample was taken. 95