DOCUMENTS FOR THE ANNUAL GENERAL MEETING
DOCUMENTS FOR THE ANNUAL GENERAL MEETING
DOCUMENTS FOR THE ANNUAL GENERAL MEETING

Create successful ePaper yourself
Turn your PDF publications into a flip-book with our unique Google optimized e-Paper software.
MOL Plc. Annual General Meeting 2013 Documents<br />
APPENDIX II<br />
Notes<br />
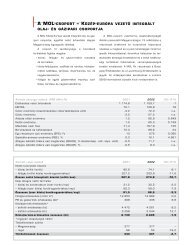
1 Net external sales revenues and operating profits include profits arising both from sales to third<br />
parties and transfers to the other Business Units. Upstream transfers domestically-produced crude oil,<br />
condensates and LPG to Downstream and natural gas to Gas Midstream. Internal transfer prices are<br />
based on prevailing market prices. Gas transfer prices equal average import prices. Segmental figures<br />
include the results of fully-consolidated subsidiaries engaged in their respective segments.<br />
2 This line shows the effect on operating profits of the change in the amount of unrealised profit in<br />
respect of intersegment transfers. Unrealised profits arise where the item transferred is held in<br />
inventory by the receiving segment and a third-party sale takes place but only in a subsequent<br />
quarter. For segmental reporting purposes, the transferor segment records a profit immediately at<br />
point of transfer. However, at the Company level, profits are only reported when a related third-party<br />
sale has taken place. In previous years, this unrealised profit effect was not shown separately, but was<br />
included in the reported segmental result of the receiving segment. Unrealised profits arise principally<br />
in respect of transfers from Upstream to Gas Midstream.<br />
3 Special items affected operating profits and EBITDA is detailed in Appendix I.<br />
4 Estimated Current Cost of Supply-based EBITDA and operating profit/(loss) excluding special items.<br />
FX gain or loss on debtors and creditors and impairment on inventories in Refining & Marketing<br />
5<br />
In converting HUF financial data into USD, the following average NBH rates were used: for FY 2011:<br />
200.9 HUF/USD, for FY 2012: 225.4 HUF/USD.<br />
35/94