DOCUMENTS FOR THE ANNUAL GENERAL MEETING
DOCUMENTS FOR THE ANNUAL GENERAL MEETING
DOCUMENTS FOR THE ANNUAL GENERAL MEETING

You also want an ePaper? Increase the reach of your titles
YUMPU automatically turns print PDFs into web optimized ePapers that Google loves.
MOL Plc. Annual General Meeting 2013 Documents<br />
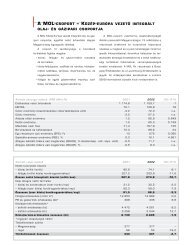
Refinery processing (kt) FY 2011 FY 2012 Ch. %<br />
Own produced crude oil 1,027 1,117 9<br />
Imported crude oil 17,168 15,597 (9)<br />
Condensates 276 275 0<br />
Other feedstock 3,331 3,248 (2)<br />
Total refinery throughput 21,802 20,237 (7)<br />
Purchased and sold products 1,193 955 (20)<br />
...while Petrochemicals<br />
went further into the red<br />
Total sales volumes<br />
decreased...<br />
The Petrochemicals segment’s contribution deteriorated<br />
dramatically in 2012, reaching a HUF 30bn operating loss, excluding<br />
special items. Besides further decreased petrochemicals margins - by<br />
6% to 262 EUR/t - high energy prices, lower demand for polymer<br />
products and the general turnaround were the main reasons for this<br />
weak performance.<br />
External refined and petrochemicals<br />
product sales by product (kt)<br />
FY 2011 FY 2012 Ch. %<br />
Total refined products 19,011 17,781 (6)<br />
o/w Motor gasoline 4,211 4,036 (4)<br />
o/w Diesel 9,392 9,065 (3)<br />
o/w Fuel oil 740 332 (55)<br />
o/w Bitumen 1,275 1,015 (20)<br />
o/w Retail segment sales 3,507 3,375 (4)<br />
o/w Motor gasoline 1,183 1,099 (7)<br />
o/w Gas and heating oils 2,231 2,186 (2)<br />
Total Petrochemicals product sales 1,504 1,229 (18)<br />
o/w Olefin products 341 318 (7)<br />
o/w Polymer products 1,163 911 (22)<br />
Total refined and Petrochemicals<br />
product sales 20,515 19,010 (7)<br />
The consumption of motor fuels in the CEE region decreased<br />
further due to the worsening economic outlook which negatively<br />
affected diesel consumption and high price levels which negatively<br />
impacted gasoline consumption in particular.<br />
Changes in regional motor fuel demand<br />
Market *<br />
MOL Group sales**<br />
FY 2012 vs. FY 2011 in %<br />
Gasoline Diesel Motor fuels Gasoline Diesel Motor fuels<br />
Hungary (8.0) (6.1) (6.7) (7.7) (7.3) (7.4)<br />
Slovakia (0.9) (3.6) (2.9) (2.4) 1.0 (0.0)<br />
Croatia (7.2) (5.5) (6.0) (2.0) 4.7 2.6<br />
Other (4.9) (4.2) (4.4) (8.5) (0.9) (3.0)<br />
CEE 10 countries (5.2) (4.4) (4.6) (6.6) (2.0) (3.4)<br />
* Company estimates<br />
** Sales from own refinery production and purchased from external sources<br />
...but Group’s motor fuel<br />
sales performed better than<br />
the market average<br />
Total refined product and petrochemicals sales decreased by 7%<br />
year-on-year partly due to depressed market demand. However the<br />
Group’s motor fuel sales performed better than the market average<br />
driven by increasing sales in Croatia as a result of continuous efforts<br />
in wholesale. Our diesel sales only eroded mildly across the CEE<br />
region. The latter also reflected our yield improvement efforts:<br />
21/94