full issue - Association of Biotechnology and Pharmacy
full issue - Association of Biotechnology and Pharmacy
full issue - Association of Biotechnology and Pharmacy

Create successful ePaper yourself
Turn your PDF publications into a flip-book with our unique Google optimized e-Paper software.
Current Trends in <strong>Biotechnology</strong> <strong>and</strong> <strong>Pharmacy</strong><br />
Vol. 5 (3) 1298 -1308 July 2011, ISSN 0973-8916 (Print), 2230-7303 (Online)<br />
1301<br />
Analysis: All T-flask samples were cultivated in<br />
a humidified incubator at 37 o C <strong>and</strong> 5% CO 2<br />
. After<br />
proliferation <strong>and</strong> cell growth, the medium was<br />
removed from the flasks <strong>and</strong> eluted with<br />
phosphate buffer solution (PBS). The cells were<br />
removed from the surface <strong>of</strong> the flasks by trypsin-<br />
EDTA solution (0.25%). After the incubation<br />
period (ca. 5 min), trypsin was inhibited by<br />
adding FBS. The cell suspensions were<br />
centrifuged at 1000 rpm for 5 min at 4 o C. The<br />
supernatants were then removed <strong>and</strong> the cell<br />
pellets were resuspended in 1 ml <strong>of</strong> medium <strong>and</strong><br />
used for subsequent counting <strong>of</strong> cells. Cell<br />
viability was determined by the trypan blue<br />
exclusion method.<br />
Deficient human coagulation factor VIII<br />
plasma was purchased from Diagnostica<br />
Stago,France. Biological activity <strong>of</strong> rhFVIII was<br />
determined using a one-stage activated partial<br />
thromboplastein time (aPTT) assay. Briefly, the<br />
samples were mixed with deficient plasma as<br />
substrate. The clotting time was measured,<br />
following addition <strong>of</strong> CaCl 2<br />
(0.025 M). The<br />
activity <strong>of</strong> rhFVIII was determined from a<br />
st<strong>and</strong>ard curve constructed by the pooled plasma.<br />
Data was presented as relative specific activity,<br />
<strong>and</strong> computed as the specific activity <strong>of</strong> samples<br />
against the specific activity <strong>of</strong> the pooled plasma.<br />
Glucose, ammonium <strong>and</strong> lactate<br />
concentrations were enzymatically measured by<br />
glucose, ammonium <strong>and</strong> lactate assay kits<br />
(ChemEnzyme co., Iran)<br />
Results <strong>and</strong> Discussion<br />
Effect <strong>of</strong> glucose on cell density <strong>and</strong> protein<br />
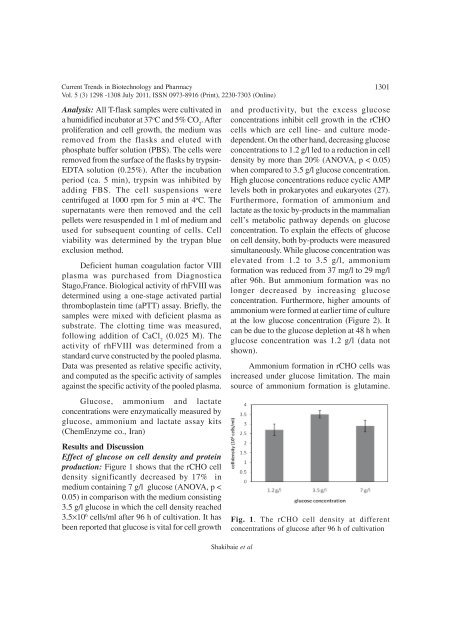
production: Figure 1 shows that the rCHO cell<br />
density significantly decreased by 17% in<br />
medium containing 7 g/l glucose (ANOVA, p <<br />
0.05) in comparison with the medium consisting<br />
3.5 g/l glucose in which the cell density reached<br />
3.5×10 6 cells/ml after 96 h <strong>of</strong> cultivation. It has<br />
been reported that glucose is vital for cell growth<br />
<strong>and</strong> productivity, but the excess glucose<br />
concentrations inhibit cell growth in the rCHO<br />
cells which are cell line- <strong>and</strong> culture modedependent.<br />
On the other h<strong>and</strong>, decreasing glucose<br />
concentrations to 1.2 g/l led to a reduction in cell<br />
density by more than 20% (ANOVA, p < 0.05)<br />
when compared to 3.5 g/l glucose concentration.<br />
High glucose concentrations reduce cyclic AMP<br />
levels both in prokaryotes <strong>and</strong> eukaryotes (27).<br />
Furthermore, formation <strong>of</strong> ammonium <strong>and</strong><br />
lactate as the toxic by-products in the mammalian<br />
cell’s metabolic pathway depends on glucose<br />
concentration. To explain the effects <strong>of</strong> glucose<br />
on cell density, both by-products were measured<br />
simultaneously. While glucose concentration was<br />
elevated from 1.2 to 3.5 g/l, ammonium<br />
formation was reduced from 37 mg/l to 29 mg/l<br />
after 96h. But ammonium formation was no<br />
longer decreased by increasing glucose<br />
concentration. Furthermore, higher amounts <strong>of</strong><br />
ammonium were formed at earlier time <strong>of</strong> culture<br />
at the low glucose concentration (Figure 2). It<br />
can be due to the glucose depletion at 48 h when<br />
glucose concentration was 1.2 g/l (data not<br />
shown).<br />
Ammonium formation in rCHO cells was<br />
increased under glucose limitation. The main<br />
source <strong>of</strong> ammonium formation is glutamine.<br />
Fig. 1. The rCHO cell density at different<br />
concentrations <strong>of</strong> glucose after 96 h <strong>of</strong> cultivation<br />
Shakibaie et al