Ecorestoration of Banni Grassland - Global Restoration Network
Ecorestoration of Banni Grassland - Global Restoration Network
Ecorestoration of Banni Grassland - Global Restoration Network

You also want an ePaper? Increase the reach of your titles
YUMPU automatically turns print PDFs into web optimized ePapers that Google loves.
<strong>Ecorestoration</strong> <strong>of</strong><br />
<strong>Banni</strong> <strong>Grassland</strong><br />
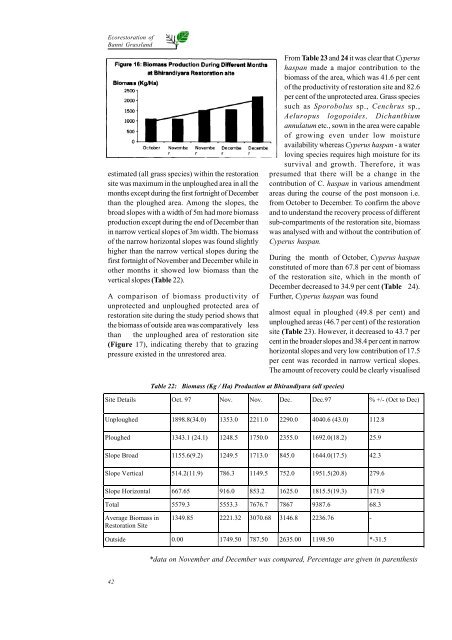
estimated (all grass species) within the restoration<br />
site was maximum in the unploughed area in all the<br />
months except during the first fortnight <strong>of</strong> December<br />
than the ploughed area. Among the slopes, the<br />
broad slopes with a width <strong>of</strong> 5m had more biomass<br />
production except during the end <strong>of</strong> December than<br />
in narrow vertical slopes <strong>of</strong> 3m width. The biomass<br />
<strong>of</strong> the narrow horizontal slopes was found slightly<br />
higher than the narrow vertical slopes during the<br />
first fortnight <strong>of</strong> November and December while in<br />
other months it showed low biomass than the<br />
vertical slopes (Table 22).<br />
A comparison <strong>of</strong> biomass productivity <strong>of</strong><br />
unprotected and unploughed protected area <strong>of</strong><br />
restoration site during the study period shows that<br />
the biomass <strong>of</strong> outside area was comparatively less<br />
than the unploughed area <strong>of</strong> restoration site<br />
(Figure 17), indicating thereby that to grazing<br />
pressure existed in the unrestored area.<br />
42<br />
Table 22: Biomass (Kg / Ha) Production at Bhirandiyara (all species)<br />
Site Details Oct. 97 Nov. Nov. Dec. Dec.97 % +/- (Oct to Dec)<br />
Unploughed 1898.8(34.0) 1353.0 2211.0 2290.0 4040.6 (43.0) 112.8<br />
Ploughed 1343.1 (24.1) 1248.5 1750.0 2355.0 1692.0(18.2) 25.9<br />
Slope Broad 1155.6(9.2) 1249.5 1713.0 845.0 1644.0(17.5) 42.3<br />
Slope Vertical 514.2(11.9) 786.3 1149.5 752.0 1951.5(20.8) 279.6<br />
Slope Horizontal 667.65 916.0 853.2 1625.0 1815.5(19.3) 171.9<br />
Total 5579.3 5553.3 7676.7 7867 9387.6 68.3<br />
Average Biomass in<br />
<strong>Restoration</strong> Site<br />
From Table 23 and 24 it was clear that Cyperus<br />
haspan made a major contribution to the<br />
biomass <strong>of</strong> the area, which was 41.6 per cent<br />
<strong>of</strong> the productivity <strong>of</strong> restoration site and 82.6<br />
per cent <strong>of</strong> the unprotected area. Grass species<br />
such as Sporobolus sp., Cenchrus sp.,<br />
Aeluropus logopoides, Dichanthium<br />
annulatum etc., sown in the area were capable<br />
<strong>of</strong> growing even under low moisture<br />
availability whereas Cyperus haspan - a water<br />
loving species requires high moisture for its<br />
survival and growth. Therefore, it was<br />
presumed that there will be a change in the<br />
contribution <strong>of</strong> C. haspan in various amendment<br />
areas during the course <strong>of</strong> the post monsoon i.e.<br />
from October to December. To confirm the above<br />
and to understand the recovery process <strong>of</strong> different<br />
sub-compartments <strong>of</strong> the restoration site, biomass<br />
was analysed with and without the contribution <strong>of</strong><br />
Cyperus haspan.<br />
During the month <strong>of</strong> October, Cyperus haspan<br />
constituted <strong>of</strong> more than 67.8 per cent <strong>of</strong> biomass<br />
<strong>of</strong> the restoration site, which in the month <strong>of</strong><br />
December decreased to 34.9 per cent (Table 24).<br />
Further, Cyperus haspan was found<br />
almost equal in ploughed (49.8 per cent) and<br />
unploughed areas (46.7 per cent) <strong>of</strong> the restoration<br />
site (Table 23). However, it decreased to 43.7 per<br />
cent in the broader slopes and 38.4 per cent in narrow<br />
horizontal slopes and very low contribution <strong>of</strong> 17.5<br />
per cent was recorded in narrow vertical slopes.<br />
The amount <strong>of</strong> recovery could be clearly visualised<br />
1349.85 2221.32 3070.68 3146.8 2236.76 -<br />
Outside 0.00 1749.50 787.50 2635.00 1198.50 *-31.5<br />
*data on November and December was compared, Percentage are given in parenthesis