Ecorestoration of Banni Grassland - Global Restoration Network
Ecorestoration of Banni Grassland - Global Restoration Network
Ecorestoration of Banni Grassland - Global Restoration Network

You also want an ePaper? Increase the reach of your titles
YUMPU automatically turns print PDFs into web optimized ePapers that Google loves.
<strong>Ecorestoration</strong> <strong>of</strong><br />
<strong>Banni</strong> <strong>Grassland</strong><br />
First Annual Technical Report<br />
Published by<br />
Gujarat Ecology Commission<br />
GERI Campus, Race Course Road, Vadodara - 390 007. INDIA<br />
December, 1998
<strong>Ecorestoration</strong> <strong>of</strong><br />
<strong>Banni</strong> <strong>Grassland</strong><br />
2<br />
<strong>Ecorestoration</strong> <strong>of</strong><br />
<strong>Banni</strong> <strong>Grassland</strong><br />
First Annual Technical Report<br />
PROJECT TEAM<br />
PROJECT COORDINATOR<br />
Pr<strong>of</strong>. Y. D. Singh<br />
PRINCIPAL INVESTIGATOR<br />
Dr. V. Vijay Kumar<br />
RESEARCH BIOLOGISTS<br />
Ishwar Lal Patel<br />
Yogesh K. Sharma<br />
Suresh V. Dangar<br />
Dr. S.V. Subba Rao<br />
Gujarat Institute <strong>of</strong> Desert Ecology<br />
PATWADI NAKA BHUJ, KACHCHH, GUJARAT, 370 001, INDIA<br />
December, 1998
PREFACE<br />
<strong>Ecorestoration</strong> <strong>of</strong><br />
<strong>Banni</strong> <strong>Grassland</strong><br />
<strong>Banni</strong>, a vast stretch <strong>of</strong> 3847 Km 2 area, located along the northern border <strong>of</strong> Kachchh<br />
district <strong>of</strong> Gujarat state supports a good number <strong>of</strong> livestock from Kachchh and other<br />
districts <strong>of</strong> the state and also neighbouring states like Maharashtra and Rajasthan. Today<br />
this area is severely degraded due to increasing salinity, overgrazing, climatic abnormalities<br />
and alarming invasion <strong>of</strong> Prosopis juliflora. This situation is evident from the fact that the<br />
human and livestock population <strong>of</strong> the area decreased by 25 and 47 per cent respectively.<br />
To over come the existing issues, many developmental projects have been implemented in<br />
the area with a view to improve the socio-economic conditions <strong>of</strong> the people. However,<br />
results were not very satisfactory, because these efforts did not ensure the involvement <strong>of</strong><br />
people and had ignored the ecological fragility <strong>of</strong> the region. Gujarat Ecology Commission<br />
(GEC), therefore, decided to make a novel and eco-friendly intervention to improve the<br />
living standards <strong>of</strong> <strong>Banni</strong> people under the Border Area Development Programme (BADP)<br />
<strong>of</strong> the Government <strong>of</strong> Gujarat.<br />
GEC, after a series <strong>of</strong> interactions with the <strong>Banni</strong> people, laid out the plan for the development<br />
<strong>of</strong> <strong>Banni</strong>, while the implementation <strong>of</strong> that plan was carried out through Gujarat Institute <strong>of</strong><br />
Desert Ecology (GUIDE) and Vivekananda Research and Training Institute (VRTI). Though<br />
the project activities commenced since late 1995, due to severe drought in 1995 and 1996,<br />
the actual results <strong>of</strong> the restoration work were visualised only in 1997. The present report<br />
deals with the one year recovery <strong>of</strong> the restoration sites located at Bhirandiyara and Dhordo<br />
and the comparative productive status <strong>of</strong> unprotected and Prosopis juliflora infested<br />
grassland areas <strong>of</strong> <strong>Banni</strong>. It also describes the pilot restoration activities carried at<br />
Bhirandiyara (reclamation <strong>of</strong> saline land by GUIDE) and Dhordo (development <strong>of</strong> degraded<br />
land by VRTI) villages <strong>of</strong> <strong>Banni</strong> to demonstrate the ways to improve the saline and degraded<br />
lands. The restoration activities are in progress, however, the results obtained after the<br />
1997 monsoon is summarised in the present report. The results <strong>of</strong> the study enhance our<br />
hope <strong>of</strong> improving such areas. I hope the present report will help the researchers, planners<br />
and development agencies to understand the effects <strong>of</strong> proper management in puts on the<br />
development <strong>of</strong> degraded and saline lands.<br />
Y.D.Singh<br />
Director<br />
3
<strong>Ecorestoration</strong> <strong>of</strong><br />
<strong>Banni</strong> <strong>Grassland</strong><br />
4<br />
ACKNOWLEDGEMENT<br />
The Gujarat Institute <strong>of</strong> Desert Ecology, Bhuj, has prepared this First Annual Technical<br />
Report on the “<strong>Ecorestoration</strong> <strong>of</strong> <strong>Banni</strong> grassland” under the guidance <strong>of</strong> the Chairman and<br />
other Officials <strong>of</strong> the Gujarat Ecology Commission, Vadodara.<br />
We are grateful to the <strong>of</strong>ficials <strong>of</strong> the Animal Husbandry Department <strong>of</strong> the Gujarat Government<br />
for the entire study support.<br />
The present study has been made possible through the valuable help and co-operation <strong>of</strong><br />
<strong>of</strong>ficials from Vivekananda Research and Training Institute - Mandvi, <strong>Banni</strong> Development<br />
Agency - Bhuj, Gujarat State Forest Development Corporation - Bhuj and local <strong>Banni</strong><br />
villagers from Dhordo and Bhirandiyara.<br />
We acknowledge with gratitude help extended by Mr. A. B. Lowelakar, Former Director <strong>of</strong><br />
GEC and Mr. H.L.Lalka, Former Project Co-ordinator, <strong>Banni</strong> <strong>Restoration</strong> Project for providing<br />
various supports and suggestions.<br />
We appreciate the help given by the Scientists and Staffs <strong>of</strong> GUIDE, with special referance<br />
to Dr. Justus Joshua and Dr. G. A. Thivakaran for editing the manuscript. Dr. A. M. Dixit for<br />
planning the methods, Miss Rashmi Dinesan for helping in analytical work and Mr.<br />
S.F.Wesley Sunderraj for taking photographs.<br />
We also appreciate the secretarial assistance provided by Mr. N.K. Maheswari.<br />
Project Team<br />
Gujarat Institute <strong>of</strong> Desert Ecology
CONTENTS<br />
<strong>Ecorestoration</strong> <strong>of</strong><br />
<strong>Banni</strong> <strong>Grassland</strong><br />
1. INTRODUCTION 11<br />
1.1 <strong>Grassland</strong> / Savanna 11<br />
1.2 Importance <strong>of</strong> <strong>Grassland</strong>s 11<br />
1.3 <strong>Grassland</strong>s <strong>of</strong> India 12<br />
1.4 <strong>Grassland</strong>s <strong>of</strong> Gujarat 12<br />
1.5 Arid Region, <strong>Grassland</strong> and Livestock 12<br />
1.6 Causes for <strong>Banni</strong> Degradation and Current Status 13<br />
1.7 Actions Taken and Lacuna 14<br />
1.8 Need for <strong>Grassland</strong> <strong>Restoration</strong> and Management in Kachchh 14<br />
1.9 <strong>Restoration</strong> 14<br />
1.10 Approach <strong>of</strong> Gujarat Ecology Commission in <strong>Banni</strong> <strong>Restoration</strong> 15<br />
1.11 Objectives 15<br />
2. STUDY AREA 16<br />
2.1 Location 16<br />
2.2 Climate 16<br />
2.3 <strong>Banni</strong> Soil 16<br />
2.4 Vegetation 16<br />
2.5 Fauna 18<br />
2.6 People and Livestock 18<br />
2.7 Land Ownership and Grazing Regulations 18<br />
3. RESTORATION APPROACH 19<br />
3.1 Protection 19<br />
3.2 Removal <strong>of</strong> Prosopis juliflora and other Weeds 19<br />
3.3 Reseeding <strong>of</strong> Grass Species 21<br />
3.4 Fertiliser Application 21<br />
3.5 Legume Introduction 22<br />
3.6 Soil Amendments in Bhirandiyara <strong>Restoration</strong> Site 22<br />
3.7 Soil Amendments in Dhordo <strong>Restoration</strong> Site 22<br />
5
<strong>Ecorestoration</strong> <strong>of</strong><br />
<strong>Banni</strong> <strong>Grassland</strong><br />
6<br />
4. METHODOLOGY 23<br />
4.1 Field Data Collection Method 23<br />
5. RESULTS 25<br />
5.1 COVER 25<br />
5.1.1 Dhordo <strong>Restoration</strong> Site 25<br />
5.1.2 Bhirandiyara <strong>Restoration</strong> Site 26<br />
5.2 SPECIES DIVERSITY 27<br />
5.2.1 Species Recorded at Dhordo 28<br />
5.2.2 Species Recorded at Bhirandiyara 28<br />
5.3 SPECIES DISTRIBUTION PATTERN 29<br />
5.3.1 Species Distribution Pattern at Dhordo 30<br />
5.3.2 Species Distribution Pattern at Bhirandiyarad 33<br />
5.4 SPECIES DOMINANCE 35<br />
5.4.1 Species Dominance at Dhordo 35<br />
5.4.2 Species Dominance at Bhirandiyara 35<br />
5.5 SPECIES ASSOCIATION 36<br />
5.6 BIOMASS 37<br />
5.6.1 Biomass Production in Dhordo Site 37<br />
5.6.1.1 Biomass Under Different Soil Amendments at Site A 37<br />
5.6.1.2 Productivity <strong>of</strong> Different Grass Species in Dhordo 38<br />
5.6.2 Biomass Production at Bhirandiyara Site 41<br />
5.6.2.1 Biomass <strong>of</strong> Different Grass Species 44<br />
5.7 BIOMASS OF HERBACEOUS SPECIES - Cressa cretica 46<br />
5.8 SALINITY Vs GRASS BIOMASS PRODUCTIVITY 47<br />
6. DISSCUSSION 49<br />
7. CONSTRAINTS 53<br />
8. MAJOR ACHIEVEMENTS 54<br />
9. REFERENCES 55
S N Title<br />
LIST OF TABLES<br />
<strong>Ecorestoration</strong> <strong>of</strong><br />
<strong>Banni</strong> <strong>Grassland</strong><br />
Table 1 Soil texture <strong>of</strong> <strong>Banni</strong><br />
Table 1 Changes in Monthly Cover at Dhordo <strong>Restoration</strong> Site<br />
Table 2 Per cent Grass Cover Recorded in Different Sites at Dhordo<br />
Table 3 Difference in Grass Cover in and outside the Bhirandiyara Site<br />
Table 4 General Species Diversity Index at Dhordo Site<br />
Table 5 General Species Diversity Index at Bhirandiyara Site<br />
Table 6 Grass and Herbaceous Species in and around Dhordo <strong>Restoration</strong> Site<br />
Table 7 Grass and Herbaceous Species at Bhirandiyara Site<br />
Table 8 Frequency Occurrence / Distribution Pattern <strong>of</strong> Plant Species at Dhordo<br />
Table 9 Frequency Occurrence / Distribution Pattern <strong>of</strong> Plant Species in Ploughed and<br />
Unploughed area <strong>of</strong> Dhordo <strong>Restoration</strong> Site<br />
Table 10 Frequency Occurrence / Distribution Pattern <strong>of</strong> Plant Species in Unprotected and<br />
Prosopis juHflora infested Areas <strong>of</strong> Dhordo<br />
Table 11 Frequency and Relative Frequency <strong>of</strong> Species in Bhirandiyara<br />
Table 12 Relative Frequency <strong>of</strong> Species in Different Amendments at Bhirandiyara<br />
Table 13 Dominance Index <strong>of</strong> Plant Species at Dhordo<br />
Table 14 Dominance Index <strong>of</strong> Plant Species at Bhirandiyara<br />
Table 15 Association Index <strong>of</strong> Dhordo <strong>Restoration</strong> Site<br />
Table 16 Association Index <strong>of</strong> Bhirandiyara <strong>Restoration</strong> Site<br />
Table 17 Biomass Production (kg/ha) in and around Dhordo <strong>Restoration</strong> Site<br />
Table 18 Biomass Production (kg/ha) in Dhordo (Ploughed and Unploughed) <strong>Restoration</strong> Site<br />
Table 19 Average Biomass (kg/ha) <strong>of</strong> Selected Species at three Sites <strong>of</strong> Dhordo<br />
Table 20 Biomass (kg/ha) Productivity <strong>of</strong> Different Species at Three Sites <strong>of</strong> Dhordo<br />
Table 21 Productivity (kg/ha) <strong>of</strong> Few Grass Species at Dhordo (under various amendments)<br />
Table 22 Biomass Production (kg/ha) at Bhirandiyara (all species)<br />
Table 23 Percentage Contribution <strong>of</strong> Cyperus haspan in sub-Compartments <strong>of</strong> Bhirandiyara<br />
<strong>Restoration</strong> Site<br />
Table 24 Biomass Production at Bhirandiyara - % availability <strong>of</strong> Cyperus haspan in Different Months<br />
Table 25 Average Total Biomass (kg/ha) Recorded for Few Species at Bhirandiyara<br />
Table 26 Average Biomass (kg/ha) in Five Sub-Compartments at Bhirandiyara<br />
Table 27 Biomass <strong>of</strong> Few Selected Species at Bhirandiyara<br />
Table 28 Percentage Contribution <strong>of</strong> Cressa cretica at Dhordo<br />
Table 29 Percentage Contribution <strong>of</strong> Cressa cretica at Bhirandiyara<br />
7
<strong>Ecorestoration</strong> <strong>of</strong><br />
<strong>Banni</strong> <strong>Grassland</strong><br />
S N Title<br />
8<br />
LIST OF FIGURES<br />
Figure 1 Map Showing Location <strong>of</strong> <strong>Banni</strong><br />
Figure 2 <strong>Restoration</strong> Approaches: Slope making, Trench, Reseeding Etc.<br />
Figure 3 Species Area Curve Method<br />
Figure 4 Monthly Variation <strong>of</strong> Cover in Unploughed and Ploughed area <strong>of</strong> Dhordo <strong>Restoration</strong> Site<br />
Figure 5 Monthly Variation <strong>of</strong> Cover in Unploughed area <strong>of</strong> <strong>Restoration</strong> Site and Unprotected Area<br />
<strong>of</strong> Dhordo<br />
Figure 6 Monthly Variation <strong>of</strong> Cover in Unploughed Area <strong>of</strong> <strong>Restoration</strong> Site and Unprotected Area<br />
<strong>of</strong> Bhirandiyara<br />
Figure 7 Percentage Cover at Ploughed and Unploughed Area <strong>of</strong> Bhirandiyara <strong>Restoration</strong> Site<br />
Figure 8 Cover Availability on Different Slopes <strong>of</strong> Bhirandiyara <strong>Restoration</strong> Site<br />
Figure 9 Diversity Index at Dhordo and Bhirandiyara <strong>Restoration</strong> Sites<br />
Figure 10 Few Important Grass Species Recorded in the <strong>Restoration</strong> Sites<br />
Figure 11 Biomass Production at Three Sites <strong>of</strong> Dhordo<br />
Figure 12 Trend in Biomass at Three Sites <strong>of</strong> Dhordo<br />
Figure 13 Biomass Production under Different Soil Amendments in Dhordo <strong>Restoration</strong> Site<br />
Figure 14 Average Biomass <strong>of</strong> Few Selected Species at Dhordo<br />
Figure 15 Biomass <strong>of</strong> Different Species in Unploughed and Ploughed Area <strong>of</strong> Dhordo<br />
<strong>Restoration</strong> Site<br />
Figure 16 Biomass Production During Different Months at Bhirandiyara <strong>Restoration</strong> Site<br />
Figure 17 Comparison <strong>of</strong> Biomass With and Without Cyperus haspan<br />
Figure 18 Aeluropus sp. - Biomass Vs Salinity (Bhirandiyara)<br />
Figure 19 Cyperus sp. - Biomass Vs Salinity (Dhordo)<br />
Figure 20 Sporobolus sp. - Biomass Vs Salinity (Dhordo)<br />
Figure 21 Scirpus sp. - Biomass Vs Salinity (Bhirandiyara)<br />
Figure 22 Cenchrus sp. - Biomass Vs Salinity (Dhordo)<br />
Figure 23 Dichanthium sp. - Biomass Vs Salinity (Dhordo)<br />
Figure 24 Aeluropus sp. - Biomass Vs Salinity (Dhordo)<br />
Figure 25 Chloris barbata - Biomass Vs Salinity (Dhordo)<br />
Figure 26 Cressa cretica - Biomass Vs Salinity (Bhirandiyara)<br />
Figure 27 Cyperus haspan - Biomass Vs Salinity (Bhirandiyara)<br />
Figure 28 Eragrostis sp. - Biomass Vs Salinity (Dhordo)
EXECUTIVE SUMMARY<br />
Gujarat Ecology Commission, a body set up by the<br />
Forest and Environment Department <strong>of</strong> Government<br />
<strong>of</strong> Gujarat initiated the <strong>Restoration</strong> programme in<br />
<strong>Banni</strong> during the year 1995 to enhance the<br />
sustainability <strong>of</strong> the degraded and saline area and<br />
thereby improve the socio-economic status <strong>of</strong> the<br />
local inhabitants, whose livelihood entirely depends<br />
on the livestock based economy. The<br />
implementation <strong>of</strong> the restoration programme was<br />
carried out through Gujarat Institute <strong>of</strong> Desert<br />
Ecology (GUIDE), Bhuj and Vivekananda Research<br />
and Training Institute (VRTI), Mandvi, while at the<br />
commencement <strong>of</strong> the programme, Gujarat Forest<br />
Development Corporation (GFDC), Bhuj helped in<br />
the eradication <strong>of</strong> Prosopis juliflora in the<br />
restoration sites. In the current project, the<br />
approach <strong>of</strong>GEC was entirely different from earlier<br />
interventions under taken in the <strong>Banni</strong> by various<br />
agencies. As a first measure <strong>of</strong> this programme,<br />
GEC has identified and critically analysed the<br />
existing problems <strong>of</strong> <strong>Banni</strong> area through GUIDE,<br />
and based on which a work plan was designed to<br />
nullify the deteriorating factors. Further, GEC tried<br />
to involve people’s participation in all the stages <strong>of</strong><br />
its restoration activities.<br />
<strong>Banni</strong> restoration was initially aimed to cover an<br />
area <strong>of</strong> 500 ha at 5 different sites. Latter on it was<br />
planned to extend the area in successive years.<br />
However, the administrative and local issues made<br />
it possible to initiate the programme only at two<br />
sites; 15 ha <strong>of</strong> high saline area at Bhirandiyara and<br />
200 ha <strong>of</strong> degraded area at Dhordo. The<br />
implementing agencies have taken steps to hasten<br />
up the process <strong>of</strong> recovery <strong>of</strong> the saline and<br />
degraded areas since natural recovery <strong>of</strong> a degraded<br />
site is a slow process. The activities undertaken<br />
include; protection from grazing by a trench and or<br />
barbed wire fencing, removal <strong>of</strong> weeds (Prosopis<br />
juliflora) to reduce the competition, soil working<br />
such as shallow ploughing, slope making etc.,<br />
farmyard manure application to improve the soil<br />
characteristics and reseeding to improve the seed<br />
bank <strong>of</strong> the sites. Though the activities commenced<br />
during the early 1996, the severe consecutive<br />
<strong>Ecorestoration</strong> <strong>of</strong><br />
<strong>Banni</strong> <strong>Grassland</strong><br />
droughts which, prevailed during 1996 made it<br />
possible to see the recovery <strong>of</strong> the restoration sites<br />
only after 1997 monsoon, during which period <strong>Banni</strong><br />
received over 700 mm rainfall.<br />
The GEC’s restoration activities are successful and<br />
is seen through the improvement <strong>of</strong> grass cover,<br />
species diversity and biomass <strong>of</strong> the restoration<br />
sites, which are far higher than the unprotected<br />
and Prosopis juliflora infested areas. Total 25<br />
species belonging to 20 genus were recorded at<br />
Dhordo restoration site, which in turn decreased to<br />
18 species in unprotected and 17 species in<br />
Prosopis juliflora infested areas <strong>of</strong> Dhordo. In the<br />
high saline area <strong>of</strong> Bhirandiyara, 12 species were<br />
recorded in the restoration site whereas it decreased<br />
to 6 species in the unprotected area located adjacent<br />
to it. Looking at the distribution, all the species<br />
recorded in the Prosopis juliflora area showed only<br />
aggregation while random to uniform distribution<br />
<strong>of</strong> certain species was recorded in restoration and<br />
unprotected areas at Bhirandiyara and Dhordo. This<br />
clearly highlights that Prosopis juliflora inhibits<br />
the growth <strong>of</strong> grass species under its canopy.<br />
Among the species, Sporobolus helvolus forms the<br />
dominant in both the ploughed and unploughed<br />
area <strong>of</strong> the Dhordo restoration site while Cyperus<br />
rotundus was dominant in unprotected and<br />
Prosopis juliflora infested area <strong>of</strong> Dhordo. Cyperus<br />
haspan was dominant in all the amendments <strong>of</strong><br />
Bhirandiyara restoration site and unprotected area<br />
except on the narrow vertical slopes where<br />
Aeluropus logopoides was the dominant species.<br />
In Dhordo, the biomass increased by 73 per cent in<br />
the restoration site and 18 per cent in the Prosopis<br />
juliflora infested area while it decreased to 32 per<br />
cent in the unprotected area. Similarly, in<br />
Bhirandiyara, the biomass increased to 100 per cent<br />
in the restoration site while it decreased to 32 per<br />
cent in the unprotected area. The decrease in<br />
biomass, especially <strong>of</strong> palatable species registered<br />
a high grazing pressure in unprotected areas.<br />
Interestingly, the biomass <strong>of</strong> the unploughed area<br />
was slightly higher than the ploughed area <strong>of</strong> both<br />
9
<strong>Ecorestoration</strong> <strong>of</strong><br />
<strong>Banni</strong> <strong>Grassland</strong><br />
the restoration sites and it may be due to the<br />
germination <strong>of</strong> existing tillers and rhizome in the<br />
unploughed area while the same was disturbed in<br />
ploughed area and the germination occurred<br />
through the seeds sown in that area. This made<br />
slight decrease <strong>of</strong> biomass in the ploughed area in<br />
the initial stage (1997) and the situation may change<br />
in the successive years. It was also noted that, soil<br />
salinity plays a major role in governing the<br />
distribution <strong>of</strong> the grass species in an area. The<br />
productivity <strong>of</strong> species like Cyperus rotundus,<br />
Eragrostis sp., Cressa cretica, Aeluropus<br />
logopoides was not much affected by salinity,<br />
however their distribution was mostly restricted<br />
within 1.5 EC level. The productivity <strong>of</strong> species like<br />
Sporobolus helvolus, Dichanthium annulatum and<br />
Cenchrus sp. has decreased with increasing salinity.<br />
An interesting observation noted in the<br />
Bhirandiyara restoration site was that, the surface<br />
10<br />
soil salinity reduced from 13 EC which was recorded<br />
before the initiation <strong>of</strong> the programme to less than<br />
4 EC as on today. At Dhordo restoration site, total<br />
1,75,100 kg grass fodder was harvested in December<br />
1998 for the distribution to the local villagers, while<br />
harvesting was not undertaken at Bhirandiyara with<br />
a view to improve the soil organic matter. The<br />
increased grass cover <strong>of</strong> this area curtailed the soil<br />
water evaporation to a greater extent and thereby<br />
reduced salinity <strong>of</strong> the area. This situation further<br />
improved the soil condition <strong>of</strong> Bhirandiyara<br />
restoration site and thereby made it suitable for<br />
growing productive grasses like Cenchrus<br />
setigerus, Sporobolus helvolus, Dichanthium<br />
annulatum etc. Overall, the current efforts certainly<br />
enhances the scope and utilisation <strong>of</strong> vast stretch<br />
<strong>of</strong> saline and degraded area <strong>of</strong> <strong>Banni</strong> and this would<br />
reduce the pressure on other available land<br />
resources.
1. INTRODUCTION<br />
Man’s relationship with his environment is a complex<br />
one. Primitive man managed to live as part <strong>of</strong><br />
the natural ecosystem without altering its major<br />
characteristics. However, with the beginning <strong>of</strong><br />
agriculture, man became increasingly sophisticated<br />
in his knowledge to modify an ecosystem in order<br />
to obtain the food, fodder or other eco-services he<br />
needed. In achieving this end, man has modified<br />
ecosystems by directing energy and materials from<br />
the system to serve his personnel needs without<br />
due considerations to the overall sustainability <strong>of</strong><br />
the ecosystem. As a result, in many managed ecosystems<br />
signs <strong>of</strong> severe degradation and declining<br />
potentialities in supporting the life forms are becoming<br />
prominent.<br />
Amongst the many ecosystems, grassland is one<br />
<strong>of</strong> the most affected system, which is clearly evident<br />
by sharp decline in its productivity and species<br />
diversity. The preeminent causes, which induce<br />
the grassland degradation include; overgrazing,<br />
soil erosion, nutrient depletion, salinization,<br />
pollution, disruption <strong>of</strong> hydrological systems, conversion<br />
<strong>of</strong> natural areas into croplands, monoculture<br />
plantations and ill-planned developmental<br />
activities. The environmental problems <strong>of</strong> grassland<br />
ecosystem are so enmeshed that it is very difficult<br />
to resolve which component, is threatening<br />
the sustainability <strong>of</strong> human life dependent on this<br />
ecosystem. To check the cycle <strong>of</strong> environmental<br />
decline, non-sustainable land use and socio-economic<br />
instability <strong>of</strong> the area must be regulated and<br />
efforts to restore the areas <strong>of</strong> acute degradation’as<br />
well as partially damaged grassland ecosystems are<br />
very essential. Therefore, it is an urgent prerequisite<br />
to develop an over-arching policy to conserve<br />
and manage the grassland resources in a sustainable<br />
manner. This would help in arresting the loss<br />
<strong>of</strong> biological diversity.<br />
1.1 <strong>Grassland</strong> / Savanna<br />
<strong>Grassland</strong> vegetation differs from forests in that<br />
the aboveground vegetation is completely renewed<br />
each year. <strong>Grassland</strong> is a landscape unit dominated<br />
<strong>Ecorestoration</strong> <strong>of</strong><br />
<strong>Banni</strong> <strong>Grassland</strong><br />
by grasses (Coupland 1978, Yadava and Singh 1986).<br />
These grasses, belong to the family Poaceae<br />
(Graminae), which forms fourth-largest family<br />
amongst the flowering plant, and constitutes over<br />
10,000 species belonging to 700 genera. On the other<br />
hand, Savanna are tropical or near tropical seasonal<br />
ecosystems with a continuous herbaceous layer,<br />
usually dominated by grasses / sedges and a<br />
discontinuous layer <strong>of</strong> trees and / or shrubs (Frost<br />
et al. 1986).Since the vegetative productivity <strong>of</strong><br />
grasses is very high, herbivorous animals,<br />
especially large mammals, are favoured in the<br />
grassland community (Renner 1938). The best<br />
pastures are those in which grazing animals do not<br />
consume more than 70 to 80 per cent total herbage<br />
productivity <strong>of</strong> the grasses (Stoddart and Smith<br />
1943). Looking at the physiology <strong>of</strong> grasses, the<br />
meristematic tissue <strong>of</strong> a grass leaf lies at its base,<br />
when the terminal portion is eaten <strong>of</strong>f, it keeps on<br />
growing. Actually, grazing stimulates lateral<br />
branching at the base <strong>of</strong> the stem. Therefore, light<br />
to moderate grazing is always good for maintaining<br />
the grassland. However, heavy grazing should not<br />
be permitted, which in turn destroys seed stocks<br />
prior to dropping <strong>of</strong> the seeds or weaken the plant<br />
physiologically and inhibiting the seed production.<br />
Further, overgrazing produces a change in the kind<br />
and number <strong>of</strong> animals present. Increased<br />
populations <strong>of</strong> insects and rodents are a result, not<br />
a cause, <strong>of</strong> overgrazing.<br />
Savanna is highly dynamic on temporal and spatial<br />
scales, and varies with changes in climate, primarily<br />
rainfall, soil nutrient content, fire regime and<br />
herbivory (Walker 1987 and Skarpe 1991). <strong>Grassland</strong>s<br />
are evolved under a system <strong>of</strong> grazing,<br />
drought and periodic fire (Anderson 1982). Either<br />
<strong>of</strong> these or a combination <strong>of</strong> all these factors maintain<br />
all the existing grasslands.<br />
1.2 Importance <strong>of</strong> <strong>Grassland</strong>s<br />
Mankind is sustained more by grasses than by any<br />
other group <strong>of</strong> plants. The relationship between<br />
man and grasses dates back to Paleolithic time<br />
11
<strong>Ecorestoration</strong> <strong>of</strong><br />
<strong>Banni</strong> <strong>Grassland</strong><br />
(Leafe 1988) and the existence <strong>of</strong> human life and<br />
quality would be impossible without grasses. In<br />
arid areas, rearing <strong>of</strong> livestock mainly depends on<br />
the extent and condition <strong>of</strong> the available grasslands.<br />
The importance <strong>of</strong> livestock in pastoral systems<br />
exceeds their value as sources <strong>of</strong> milk, meat and<br />
hides. Livestock <strong>of</strong>ten represent a means <strong>of</strong> accumulating<br />
capital and, in some societies, are associated<br />
with social status. They are assets that can<br />
reproduce and can be liquidated should cash be<br />
required. In addition to supporting livestock, grassland<br />
serves as sources <strong>of</strong> other significant economic<br />
products: leaves, seeds, tubers as food for<br />
human population, as well as medicinal plants, building<br />
materials, thatch, fencing, gums and other products<br />
important to the economics <strong>of</strong> rural populations<br />
(Sale 1981 and NRC 1983).<br />
<strong>Grassland</strong>s, compared to the forests, support the<br />
highest densities <strong>of</strong> mammalian zoomass <strong>of</strong> the<br />
planet, and are still the basis <strong>of</strong> subsistence for<br />
millions <strong>of</strong> pastoralists and protect many vulnerable<br />
soil from rapid erosion. A large number <strong>of</strong> wild fauna<br />
which include 477 species <strong>of</strong> birds and 245 species<br />
<strong>of</strong> mammals reported are solely dependent on<br />
grasslands for their survival (Groombridge 1992).<br />
The biodiversity <strong>of</strong> grasslands is usually enhanced<br />
by moderate land uses such as grazing and periodic<br />
fire. In spite <strong>of</strong> all this, the grassland ecosystem<br />
has received much less importance and has been<br />
neglected in terms <strong>of</strong> conservation and proper<br />
management.<br />
1.3 <strong>Grassland</strong>s <strong>of</strong> India<br />
<strong>Grassland</strong>s extend over 24 per cent <strong>of</strong> the world’s<br />
vegetation (Shantz 1954), however, prior to the impact<br />
<strong>of</strong> man and domesticated animals, its extension<br />
was approximately 40 per cent. In Asia the<br />
grassland accounts for 20 per cent <strong>of</strong> land cover<br />
(Premadasa 1990).<br />
In India, grasslands constitute one <strong>of</strong> the major<br />
biomes. All the natural and semi-natural grasslands<br />
maintained by livestock / wildlife are collectively<br />
known as Rangelands. In India, 13,813 km 2 area <strong>of</strong><br />
the land falls under this category (Singh, 1988).<br />
Between 1954 and 1962, the Indian Council <strong>of</strong><br />
Agriculture Research (ICAR) conducted grassland<br />
surveys and classified the grass cover <strong>of</strong> India into<br />
five major types (Dabadghao and Shankarnaryanan<br />
1973); Sehima-Dichanthium, Dichanthium -<br />
Cenchrus - Lasiurus, Phragmites - Saccharum -<br />
Imperata, Themeda - Arundinella and Temperate -<br />
12<br />
Alpine cover. The physiognomy, phenology and<br />
diversity <strong>of</strong> grasses vary with rainfall, topography<br />
and type <strong>of</strong> soil. Therefore, depending upon the<br />
biotic influences and local variations in topography<br />
and soil structure, these five broad categories can<br />
still be subdivided into several grassland<br />
associations (Singh and Joshi 1979). The climax<br />
grasslands are supposed to be absent in India<br />
(Whyte 1964, Blasco 1983), but grasslands as<br />
secondary serai stage are common (Champion and<br />
Seth 1968). Therefore, they have been called as disclimax<br />
(Misra 1946), or pre-climax (Champion and<br />
Seth 1968) or sub-climax (Singh et al 1985). However,<br />
Rodgers (1986) has named the grassland <strong>of</strong> India<br />
as anthropogenic or Savanna.<br />
1.4 <strong>Grassland</strong>s <strong>of</strong> Gujarat<br />
In India, grasslands are mainly found in Gujarat,<br />
Rajasthan, Maharashtra, Western Madhya Pradesh,<br />
Uttar Pradesh and Brahmaputra valley. In Gujarat,<br />
the grazing requirements <strong>of</strong> the livestock are met<br />
from grasslands, forests, gauchers (village grazing<br />
land) and fallow lands. The grasslands, wastelands<br />
and gauchers are known as Common Property Resources<br />
(CPRs). Interestingly, the CPRs, which have<br />
an access for grazing, are gradually declining. They<br />
were 61.4 per cent <strong>of</strong> the land area in Gujarat during<br />
1961-62 and decreased to 50 per cent in 1992-93<br />
(Parikh and Reddy 1997). About 1400 km 2 area <strong>of</strong><br />
Gujarat is maintained by the Forest Department as<br />
grasslands, <strong>of</strong> which 1295 km 2 is located in Kachchh<br />
and Saurashtra region <strong>of</strong> the State (Rahmani 1997).<br />
In Kachchh district, 800 km 2 is located in <strong>Banni</strong> and<br />
approximately 100 km 2 is in Naliya region. The grasslands<br />
are called as ‘vidis’ in Saurashtra and ‘rakhals’<br />
in Kachchh. There are two kinds <strong>of</strong> ‘vidis’; reserved<br />
and non-reserved vidis. The former is better-protected<br />
grassland, where, the grasses are harvested<br />
only after monsoon while the non-reserved vidis<br />
are less protected. In all, there are 166 reserve vidis<br />
in the state covering an area <strong>of</strong> about 759 km 2 . Of<br />
these, 159 vidis covering a total area <strong>of</strong> 709 km 2 are<br />
located in Kachchh and Saurashtra regions while<br />
the remaining are in Panchmahal district <strong>of</strong> the state.<br />
The non-reserved vidis extend to an area <strong>of</strong> about<br />
635 km 2 (Rahmani 1997). Besides these, there are a<br />
number <strong>of</strong> ‘gauchar lands’ (village grazing lands)<br />
available in the State.<br />
1.5 Arid Region, <strong>Grassland</strong> and Livestock<br />
The entire Kachchh district, which encompasses<br />
an area <strong>of</strong> 45,652 km 2 falls under the arid tract <strong>of</strong> the
Gujarat State. Due to scanty and high temporal and<br />
spatial variations in monsoonal rains, the region is<br />
more suitable for livestock based economy than<br />
the arable farming. Indeed a large single stretch <strong>of</strong><br />
natural grassland, known as “<strong>Banni</strong>” is located in<br />
Kachchh district. <strong>Banni</strong> grassland encompasses an<br />
area <strong>of</strong> 3,847 km 2 . This grassland, once referred as<br />
Asia’s finest grassland, accounts for approximately<br />
45 per cent <strong>of</strong> the permanent pasture and 10 per<br />
cent <strong>of</strong> the grazing ground available in the state<br />
(Parikh and Reddy 1997). In spite <strong>of</strong> all its<br />
importance, the <strong>Banni</strong> grassland has been under<br />
severe pressure due to many factors, which have<br />
gradually degraded most part <strong>of</strong> it.<br />
1.6 Causes for <strong>Banni</strong> Degradation and Current<br />
Status<br />
The structure and dynamics <strong>of</strong> grassland is the<br />
outcome <strong>of</strong> large number <strong>of</strong> environmental factors<br />
or determinants (constraints to the system). Vegetation<br />
changes in a system are the responses to<br />
and effects upon their environment by individual<br />
plants (Goodall 1963, Roberts 1987, Acker 1990).<br />
However, sudden changes in the constraints lead<br />
to modifications in the mechanisms, which generally<br />
disturb the system. The major natural and anthropogenic<br />
causes responsible for degradation <strong>of</strong><br />
<strong>Banni</strong> are as follows:<br />
Even though grassland species <strong>of</strong> <strong>Banni</strong> have developed<br />
a variety <strong>of</strong> drought adaptations, a severe<br />
drought, perhaps, is the most important natural factor<br />
responsible for its degradation. It is also important<br />
to note that, severe consecutive droughts,<br />
which were a very rare incidents (occurred twice;<br />
1904 -1905 and 1968 -1969) during the period between<br />
1901 and 1980 have increased abruptly during<br />
the recent years (1981-1996). Three consecutive<br />
severe droughts, the first <strong>of</strong> its kind in this<br />
century, occurred from 1985 to 1987 and another<br />
two consecutive droughts occurred in 1995 and<br />
1996. This situation has predominantly affected the<br />
soil moisture and thereby hastened the process <strong>of</strong><br />
grassland degradation.<br />
Although, the inherent salinity was existing even<br />
during the early days in <strong>Banni</strong>, the rivers, which<br />
were flowing from the Kachchh mainland to <strong>Banni</strong><br />
were not only depositing the detritus and<br />
maintaining the soil moisture but also leached the<br />
salinity <strong>of</strong> the area during good rainfall years. The<br />
construction <strong>of</strong> 6 medium dams namely Rudramata,<br />
Niruna, Nara, Kaila, Kaswati and Gajansar has nearly<br />
<strong>Ecorestoration</strong> <strong>of</strong><br />
<strong>Banni</strong> <strong>Grassland</strong><br />
stopped the collection <strong>of</strong> water from 1603 km 2<br />
catchment area except during the heavy monsoon<br />
years. Thus, natural leaching <strong>of</strong> the salinity <strong>of</strong><br />
different parts <strong>of</strong> <strong>Banni</strong> is totally interrupted. In<br />
addition to this, seawater from the Kori creek entered<br />
the northern part <strong>of</strong> <strong>Banni</strong> due to the construction<br />
<strong>of</strong> Punjabi-road during the year 1965. Further, low<br />
or absence <strong>of</strong> vegetative cover in high saline areas<br />
encourages the wind to transport salt particles from<br />
the Rann to fertile <strong>Banni</strong> areas resulting further<br />
increase in salinity. The cumulative effect <strong>of</strong> all<br />
these factors is the increased salinity in nearly 90<br />
per cent <strong>of</strong> the <strong>Banni</strong> grassland.<br />
In addition to these, the Gujarat State Forest<br />
Department, as a measure to check the advancement<br />
<strong>of</strong> the Rann, has planted initially about 31,550 ha<br />
exclusively <strong>of</strong> Prosopis juliflora. The circumstances<br />
<strong>of</strong> <strong>Banni</strong> such as; successive droughts and<br />
increasing salinity provided more suitable condition<br />
for the growth and extension <strong>of</strong> this species, which<br />
has today become the most dominant species and<br />
is spreading at the rate <strong>of</strong> about 25 km 2 per year.<br />
Grazing is another major problem in <strong>Banni</strong> grassland.<br />
Large herbivores are known to speed up the<br />
nutrient turnover rate in savanna (Ruess 1987,<br />
Ruess and McNaughton 1987). However, excessive<br />
or over grazing leads to massive degradation. During<br />
the normal rainfall years, livestock from<br />
neighbouring talukas and districts <strong>of</strong> Kachchh and<br />
even from other states, totalling to over 2 lakhs<br />
immigrate into <strong>Banni</strong> for grazing.<br />
It is important to note that, high grazing pressure<br />
combined with stochastic events (temporary<br />
droughts, changes in soil conditions) may convert<br />
perennial vegetation into one dominated by ephemerals,<br />
but continuous heavy grazing prevents renewed<br />
change from ephemeral to perennial vegetation<br />
when weather conditions change (Christina,<br />
1992). This situation leads to loss <strong>of</strong> soil cover,<br />
which further aggravates the degradation <strong>of</strong> the<br />
area.<br />
The aforesaid issues brought a severe<br />
unsustainability in <strong>Banni</strong> grassland, which<br />
decreased the human population from 14,389 in 1981<br />
to 10,949 in 1991 (24 per cent) and livestock<br />
population from 49,240 in 1982 to 26,084 in 1992 (47<br />
per cent). Among the three regions (east, west and<br />
central) <strong>of</strong> <strong>Banni</strong>, the eastern <strong>Banni</strong> has already<br />
lost its capacity and the western <strong>Banni</strong> is slowly<br />
loosing its capacity to sustain both human and<br />
13
<strong>Ecorestoration</strong> <strong>of</strong><br />
<strong>Banni</strong> <strong>Grassland</strong><br />
livestock populations. As a result, a maximum<br />
concentration <strong>of</strong> 55 per cent <strong>of</strong> the human (4149)<br />
and 65 per cent <strong>of</strong> the livestock population (7333)<br />
is located at central <strong>Banni</strong> region (GUIDE, 1998),<br />
exerting excessive pressures in this area which may<br />
lead to massive degradation due to over exploitation<br />
<strong>of</strong> resources. (For more details see “Status <strong>of</strong> <strong>Banni</strong><br />
<strong>Grassland</strong> and Exigency <strong>of</strong> <strong>Restoration</strong> Efforts,<br />
1998, by Gujarat Institute <strong>of</strong> Desert Ecology, Bhuj).<br />
1.7 Actions Taken and Lacuna<br />
Considering the seriousness <strong>of</strong> the grassland problem,<br />
many government and nongovernment agencies<br />
carried out investigations and suggested some<br />
remedial measures to improve the overall range<br />
condition <strong>of</strong> <strong>Banni</strong>. As a follow-up, many developmental<br />
projects have been implemented but with<br />
few perceivable results, as these projects lacked a<br />
basic ecological approach. Rejuvenation <strong>of</strong> <strong>Banni</strong><br />
and restoring it into a sustainable productive ecosystem<br />
calls for a holistic ecological approach. Further,<br />
in the past, the major drawback <strong>of</strong> these development<br />
alternatives was that the development had<br />
become capital centred as opposed to people<br />
centred; it had even bypassed or marginalized<br />
people in its concern to build and construct.<br />
1.8 Need for <strong>Grassland</strong> <strong>Restoration</strong> and<br />
Management in Kachchh<br />
In the arid rangelands the grazing pressure ranges<br />
from 1 to 4 ACU (Adult Cattle Unit) per ha per year<br />
against the carrying capacity <strong>of</strong> 0.2 to 0.5 ACU per<br />
ha per year (Raheja 1966). As per these estimations<br />
one ACU <strong>of</strong> arid area requires 2 to 5 ha <strong>of</strong> grazing<br />
ground. However, the available grazing land, which<br />
includes all categories; i.e. good, fair, medium and<br />
poor condition grasslands, in the Kachchh district,<br />
is less than 2 ha per ACU. Therefore, the grazing<br />
requirement <strong>of</strong> the entire livestock in the district<br />
cannot be met from the existing grassland<br />
resources. The frequent droughts cause further loss<br />
<strong>of</strong> livestock owing to the shortage <strong>of</strong> fodder<br />
resources. Further, the process <strong>of</strong> urbanisation,<br />
agricultural expansion, industrial developments and<br />
mining are putting increasing pressure on the<br />
existing grassland resources. Under these<br />
circumstances, it is necessary that improvement<br />
programme in the existing rangelands be<br />
implemented and if necessary, complemented by<br />
raising fodder tree species (Paroda etal. 1980).<br />
For the advancement <strong>of</strong> the backward tract in <strong>Banni</strong><br />
grassland, an enlightened interest, sympathetic<br />
14<br />
approach and effective implementation <strong>of</strong> restoration<br />
and management activities are essential to shake<br />
<strong>of</strong>f the local people’s inertia and awaken the people<br />
to the needs <strong>of</strong> improving the level <strong>of</strong> living. To<br />
achieve the aforesaid, it is essential to take appropriate<br />
measures to restore / repair and manage the<br />
degraded areas <strong>of</strong> <strong>Banni</strong> - the life supporting system<br />
<strong>of</strong> the pastoralists, so that, it can be sustained<br />
for the future generations.<br />
1.9 <strong>Restoration</strong><br />
Range management has been defined as “ the science<br />
and art <strong>of</strong> planning and directing range use so<br />
as to obtain maximum livestock production consistent<br />
with conservation <strong>of</strong> range resources”. The<br />
range plants are broadly classified into three categories;<br />
decreasers (highly nutritious and palatable members<br />
<strong>of</strong> the community that generally decrease with<br />
grazing pressure), increasers (less palatable species<br />
which increase due to over grazing) and invaders<br />
(under excessive grazing pressure the increasers<br />
will decrease and are replaced by unwanted<br />
weeds). Therefore, restoration activity is aimed to<br />
improve the quality and quantity <strong>of</strong> decreasers <strong>of</strong><br />
an area into an optimum level (Owen 1980).<br />
<strong>Restoration</strong> is the only way to improve the<br />
sustainability <strong>of</strong> <strong>Banni</strong> grassland, where degraded<br />
grassland currently support few people and where<br />
restoration would directly involve the preservation<br />
and encouragement <strong>of</strong> sustainable uses.<br />
<strong>Restoration</strong> research though practised on a small<br />
scale for a number <strong>of</strong> years in some developed<br />
nations, is relatively new field <strong>of</strong> investigation in<br />
developing countries (Jordan et al. 1979, NRC 1989)<br />
like India. <strong>Restoration</strong> <strong>of</strong> degraded lands is a<br />
challenging problem, and requires a thorough<br />
understanding <strong>of</strong> ecological principles. Therefore,<br />
Bradshaw (1987) called restoration as “acid test<br />
for ecology”, thus highlighting the difficulties<br />
involved in such tasks.<br />
The restoration processes are affected directly by<br />
the level and types <strong>of</strong> degradation. Over utilisation<br />
by man beyond the carrying capacity results into<br />
fragile situation, which along with drastic disturbances<br />
makes it extremely vulnerable to future anthropogenic<br />
changes (Peters 1985; Peters and Darling<br />
1985). For a successful restoration programme,<br />
it is essential to recognise the potential detrimental<br />
factors influencing the area. GUIDE has carried out
a study to assess and understand the causes, its<br />
effects and magnitude <strong>of</strong> problems existing in <strong>Banni</strong><br />
(GUIDE, 1998), so that appropriate steps can be<br />
taken in time to keep these disturbances at a minimum,<br />
and the ecological balance may be re-established<br />
at the earliest. Once symptoms <strong>of</strong> ecosystem<br />
deterioration become apparent, the only option<br />
left is to react to the situation and try to cure<br />
the problem by corrective measures (Singh 1988).<br />
1.10 Approach <strong>of</strong> Gujarat Ecology Commission in<br />
<strong>Banni</strong> <strong>Restoration</strong><br />
Keeping the above in view, to overcome the identified<br />
problems <strong>of</strong> <strong>Banni</strong> grassland, the Gujarat Ecology<br />
Commission (GEC), a body set up by Government<br />
<strong>of</strong> Gujarat, initiated a research project on “<strong>Restoration</strong><br />
<strong>of</strong> <strong>Banni</strong> grassland” during the year 1995.<br />
GEC has adopted a holistic approach in the design<br />
and implementation <strong>of</strong> the restoration <strong>of</strong> <strong>Banni</strong> by<br />
considering inter-linkages between ecological parameters.<br />
The Commission has proposed innovative<br />
demonstration schemes considering the ecology<br />
<strong>of</strong> <strong>Banni</strong> ecosystem, and by trying to work<br />
with nature rather than against it.<br />
The approach differed from the earlier grassland<br />
development programme wherein only protection<br />
from the livestock grazing was provided by a trench<br />
fencing and the area was left under natural condition.<br />
However, GEC initiated eco-friendly approach<br />
by undertaking proper management inputs to nullify<br />
the effects <strong>of</strong> the detrimental factors, which<br />
caused the degradation, through people participation.<br />
1.11 Objectives<br />
The objectives set for the restoration <strong>of</strong> <strong>Banni</strong><br />
grassland include:<br />
• Development <strong>of</strong> grassland at suitable sites<br />
• Development <strong>of</strong> the degraded, Prosopis infested<br />
and high saline areas into productive<br />
grassland<br />
<strong>Ecorestoration</strong> <strong>of</strong><br />
<strong>Banni</strong> <strong>Grassland</strong><br />
• Development <strong>of</strong> indigenous tree cover.<br />
• Evaluate appropriate guidelines for sustainable<br />
management <strong>of</strong> <strong>Banni</strong> grassland.<br />
The GEC has implemented the aforesaid activities<br />
through two institutes and a corporation:<br />
1. Gujarat Institute <strong>of</strong> Desert Ecology<br />
(GUIDE), Bhuj - involved in the development<br />
<strong>of</strong> saline tracts <strong>of</strong> <strong>Banni</strong> with the following<br />
objectives:<br />
• To demonstrate appropriate techniques (using<br />
different soil amendments) for saline land<br />
reclamation.<br />
• To identify suitable grass species for saline<br />
areas and find ways to improve their productivity<br />
• To assess the effects <strong>of</strong> restoration on the species<br />
diversity and biomass production in saline<br />
areas.<br />
• To assess the changes in species diversity<br />
and biomass production in the restored, nonrestored<br />
and Prosopis juliflora infested areas<br />
mainly to assess the effect <strong>of</strong> grazing and<br />
Prosopis juliflora on the distribution, abundance<br />
and productivity <strong>of</strong> different grass species.<br />
• To demonstrate appropriate grassland (range)<br />
management techniques.<br />
2. Vivekanand Research and Training Institute<br />
(VRTI), Mandvi - involved in the development<br />
<strong>of</strong> degraded lands with the following objectives;<br />
• Development and reclamation <strong>of</strong> grassland areas<br />
affected by heavy grazing and infestation<br />
<strong>of</strong> Prosopis juliflora.<br />
• Development <strong>of</strong> water harvesting structures<br />
to enhance the soil moisture <strong>of</strong> the area.<br />
• Development <strong>of</strong> indigenous tree cover in the<br />
restoration plot.<br />
15
<strong>Ecorestoration</strong> <strong>of</strong><br />
<strong>Banni</strong> <strong>Grassland</strong><br />
2. STUDY AREA<br />
2.1 Location<br />
<strong>Banni</strong>, the largest single stretch <strong>of</strong> grassland in<br />
India, is located on the northern border <strong>of</strong> Bhuj<br />
taluka (23° 19' 23° 52' N latitude and 68° 56' to 70° 32'<br />
E longitude) <strong>of</strong> Kachchh district in the Gujarat State.<br />
It encompasses an area <strong>of</strong> 3,847 sq. km and forms a<br />
low alluvial tableland. The entire area is more or<br />
less flat and without any gradient. <strong>Banni</strong> has 52<br />
villages, which are under 17 panchayats (Census<br />
1991). The plains <strong>of</strong> <strong>Banni</strong> geomorphologically<br />
resemble an embayment, which is bounded by the<br />
Kachchh mainland upliftment in the south, the<br />
Pachchham upliftment in the north and the Wagad,<br />
and Bela upliftment in the east. In the southern part<br />
<strong>of</strong> <strong>Banni</strong> there is an intervening stretch <strong>of</strong> salty<br />
waste known as Little Rann <strong>of</strong> <strong>Banni</strong>, which<br />
separates the <strong>Banni</strong> from the mainland <strong>of</strong> Kachchh<br />
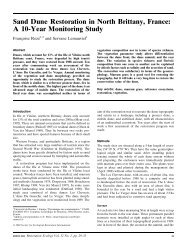
(Figure 1).<br />
The name <strong>Banni</strong> was derived from a Kachchhi word<br />
‘Banna/’, which means “<strong>Banni</strong> hui” in Gujarati<br />
(made up); signifying that the land has been formed<br />
by detritus. There are views that <strong>Banni</strong> was formed<br />
by the sediments brought down by the rivers such<br />
as Indus, Luni, Banas and Saraswati which, in the<br />
recent geological past, flowed through this area<br />
from the north and east (Kadikar, 1994).<br />
2.2 Climate<br />
The climate <strong>of</strong> <strong>Banni</strong> is arid. There are three predominant<br />
seasons; monsoon extends between end<br />
<strong>of</strong> June to September, October and November being<br />
the transition months, winter lasts from December<br />
to March and summer spreads between April<br />
to June. The temperature <strong>of</strong> <strong>Banni</strong> is high during<br />
most <strong>of</strong> the time and it reaches a maximum <strong>of</strong> 48-<br />
49°C during May-June (the hottest months). The<br />
winter temperature goes down to 10° C with January<br />
and February being the coldest months. The<br />
total annual rainfall, occurring through south-west<br />
monsoon between June and September, is very low<br />
with an average <strong>of</strong> 317 mm per year with a coefficient<br />
<strong>of</strong> variation <strong>of</strong> 65 per cent (GAU, 1989). The<br />
16<br />
rainfall is extremely erratic and variable in distribution,<br />
therefore, droughts are a recurring phenomenon.<br />
2.3 <strong>Banni</strong> Soil<br />
The soils <strong>of</strong> <strong>Banni</strong> are inherently saline and consist<br />
<strong>of</strong> recent alluvium mixed at places with aeolian<br />
sandy deposit and the entire area has deep to very<br />
deep clayey and coarse textured soils in<br />
discontinuous patches. In <strong>Banni</strong>, soil material<br />
containing clay loam to silty clay loam is termed as<br />
moderately fine textured soils, which ranks first in<br />
distribution and covers 59 per cent <strong>of</strong> the total area.<br />
The salinity <strong>of</strong> the soil is highly variable from 1.0<br />
(very low) to over 15.0 Mmhos/cm (very high).<br />
About 90 per cent <strong>of</strong> the <strong>Banni</strong> area falls under<br />
moderate to very high salinity and the pH ranges<br />
between 6.5 and 8.5. The soil salinity also changes<br />
with the depth <strong>of</strong> the soil horizon. Though, the<br />
subsurface water in <strong>Banni</strong> exists at shallow depth<br />
<strong>of</strong> about 3m, it is highly saline, thus not suitable for<br />
drinking or irrigation purposes. Further, the<br />
presence <strong>of</strong> high silt and clay content lessens the<br />
vertical and lateral movement <strong>of</strong> surface and<br />
subsurface water. About 70 per cent <strong>of</strong> the <strong>Banni</strong><br />
area fall under very slow to slow permeability range<br />
(0.00 to 0.13 cm/hr) which subsequently leads to<br />
waterlogging in the low-lying areas during good<br />
rainfall years.<br />
2.4 Vegetation<br />
<strong>Banni</strong> supports the growth <strong>of</strong> perennial and<br />
palatable grasses <strong>of</strong> high productivity, which grow<br />
in low to moderate saline areas. They are<br />
Sporobolus pallidus, Sporobolus helvolus,<br />
Dichanthium annulatum, Cenchrus ciliaris,<br />
Cenchrus setigerus, Desmostachya bipinata etc.<br />
High saline areas are colonised by perennial grasses<br />
<strong>of</strong> low productivity and palatability such as<br />
Aeluropus logopoides, Eurochondra sp. etc.<br />
Among the tree species Acacia nilotica was once<br />
distributed all over <strong>Banni</strong>. The shrub and tree strata<br />
were mainly composed <strong>of</strong> Prosopis cineraria.
Fig. 1 : Map showing location <strong>of</strong> <strong>Banni</strong><br />
<strong>Ecorestoration</strong> <strong>of</strong><br />
<strong>Banni</strong> <strong>Grassland</strong><br />
17
<strong>Ecorestoration</strong> <strong>of</strong><br />
<strong>Banni</strong> <strong>Grassland</strong><br />
Acacia nilotica, Acacia leucophloea, Acacia<br />
Senegal, Salvadora persica, Salvadora oleodes,<br />
Capparis decidua, Tamarix sp. and Prosopis<br />
juliflora. Today, palatable grass and tree species<br />
like Acacia and Salvadora sp. though present, their<br />
abundance has decreased very significantly due<br />
to the massive invasion and dominance <strong>of</strong> Prosopis<br />
juliflora.<br />
2.5 Fauna<br />
The wild animals <strong>of</strong> <strong>Banni</strong> include: Blue bull,<br />
Chinkara, Black buck, Blacknaped hare, Wild boar,<br />
Jackal, Grey wolf, Caracal, Hyena, Fox, Jungle cat,<br />
etc. It also supports a rich diversity <strong>of</strong> Avifauna,<br />
Herpat<strong>of</strong>auna, and Invertebrates. Further, the water<br />
bodies <strong>of</strong> <strong>Banni</strong>, during good rainfall year forms<br />
important staging ground for thousands <strong>of</strong> migratory<br />
cranes and also support over 150 species <strong>of</strong><br />
migratory and resident birds.<br />
2.6 People and Livestock<br />
<strong>Banni</strong> has a very low population density, 3.6 person<br />
/ km 2 (as per 1991 census) and, this very much<br />
resembles the density <strong>of</strong> human population in most<br />
<strong>of</strong> the other arid regions <strong>of</strong> the world. The residents<br />
<strong>of</strong> <strong>Banni</strong> are called Maldharies. Muslims, Hindus<br />
and Vadhas are the three major communities<br />
inhabiting the area. There are 15-20 Maldhari muslim<br />
castes in <strong>Banni</strong> and they speak Kachchhi, a dialect<br />
close to Sindhi language.<br />
Livestock is the mainstay <strong>of</strong> the inhabitants <strong>of</strong><br />
<strong>Banni</strong>, which constitutes the major bulk <strong>of</strong> their<br />
assets. Out <strong>of</strong> 10,949 people in <strong>Banni</strong> (1991 census),<br />
2443 people are entirely engaged in livestock rearing<br />
and other allied activities. Their interest mainly<br />
centres on livestock breeding and the area is a wellknown<br />
cattle-breeding tract <strong>of</strong> Gujarat. However,<br />
due to establishment <strong>of</strong> milk co-operative societies<br />
in early 1980’s, the people <strong>of</strong> <strong>Banni</strong> are slowly<br />
getting inclined towards selling <strong>of</strong> animal products<br />
such as milk, ghee etc. A rough estimate shows<br />
that the total milk transported from <strong>Banni</strong> villages<br />
to Bhuj via Bhirandiyara alone amounts to 14,240<br />
litres per day, which gives an income <strong>of</strong> Rs 1,538 /<br />
household / month.<br />
2.7 Land Ownership and Grazing Regulations<br />
During the period <strong>of</strong> princely rule, the then Maharao<br />
declared <strong>Banni</strong>, with an area <strong>of</strong> 2,144 km 2 as a reserve<br />
grassland (Rakhal), where only grazing by milching<br />
18<br />
cattle and buffalo was permitted while sheep and<br />
goats were strictly prohibited. Further, Maldharies<br />
were not permitted to permanently settle in <strong>Banni</strong>.<br />
Hence, nomadism had prevailed for many years.<br />
After independence, Maldharies <strong>of</strong> <strong>Banni</strong> have<br />
turned to pastoralistic mode <strong>of</strong> life.<br />
In <strong>Banni</strong>, human settlements / villages are located<br />
approximately at a distance <strong>of</strong> 5 to 15 km and all the<br />
settlements are established in or around water tanks<br />
or jheels mainly to ensure drinking water for themselves<br />
and their livestock. Unlike many other parts<br />
<strong>of</strong> Kachchh, the ground water in <strong>Banni</strong> is highly<br />
saline. The sweet water, stored in “tanks” or “jheels”<br />
after monsoon, is utilised for a few months before it<br />
disappears through infiltration and evaporation.<br />
During the rest <strong>of</strong> the year the infiltrated water,<br />
trapped in shallow depths in a layer “floating” above<br />
the saline ground water is utilised by digging shallow<br />
wells locally called “virda”. Generally it takes<br />
20 days to 2 months for a “virda” to become saline,<br />
depending up on the withdrawal, then a new “virda”<br />
is dug few meters away. Virdas are owned by families<br />
and a single family may own 5 to 15 virdas in a<br />
village. Though drinking water can be obtained from<br />
any “virda” if required, water for cattle has to be<br />
used only from one’s own virdas.<br />
In older times, these virdas played an important<br />
role in regulating the livestock grazing. Since no<br />
sweet water was available in <strong>Banni</strong>, the livestock<br />
grazing was restricted only in the vicinity <strong>of</strong> one’s<br />
own village. However, today with the installation<br />
<strong>of</strong> pipelines, which supply water from Rudramata,<br />
Mamuara and Lakhond tubewells to <strong>Banni</strong>, the<br />
scenario has changed and the water is no longer a<br />
factor, which governs the livestock grazing. The<br />
600 km long network <strong>of</strong> <strong>Banni</strong> pipeline is damaged<br />
by the maldharis at places for providing drinking<br />
water to their livestock. This has also encouraged<br />
the massive immigration <strong>of</strong> livestock from other<br />
areas, thus, leading to overgrazing and degradation<br />
<strong>of</strong> the area.
3. RESTORATION APPROACH<br />
As a pilot measure, the restoration <strong>of</strong> <strong>Banni</strong><br />
grassland was initially (for the year 1996) aimed to<br />
cover a total area <strong>of</strong> 500 ha at 5 different sites <strong>of</strong><br />
<strong>Banni</strong>. During the successive years it was planned<br />
to gradually extend it into several other areas <strong>of</strong><br />
<strong>Banni</strong>. However, due to administrative and local<br />
issues in acquiring the land, the restoration<br />
programme could be successfully launched only at<br />
two sites; one located at 11 km before Bhirandiyara<br />
and the other at Dhordo village covering an area <strong>of</strong><br />
15 and 200 ha respectively. The requirements and<br />
implementation activities carried out to improve the<br />
status <strong>of</strong> the restoration sites and to develop the<br />
grass and indigenous tree cover in the area are<br />
explained in the successive paragraphs (Figure 2).<br />
However, it is important to state here that the natural<br />
recovery following degradation is a slow process;<br />
it depends on time and space, and is influenced<br />
by geographical and climatic factors and<br />
ecological conditions <strong>of</strong> the site. Therefore, a successful<br />
restoration programme attempts to accelerate<br />
the natural recovery process artificially in order<br />
to achieve the goal in a short time. In order to rebegin<br />
performing the productive and protective<br />
functions, a degraded land needs human assistance,<br />
i.e. protection, pre-treatment for habitat rectification<br />
such as; slope modification, nutrient and organic<br />
matter amendments, etc. (Singh and Jha,<br />
1992).<br />
3.1 Protection<br />
The <strong>Banni</strong> grassland could be improved only in the<br />
good rainfall years. Since good years are generally<br />
followed by droughts in a cycle <strong>of</strong> every 3 years or<br />
sometimes alternative years, the best method to<br />
improve grasslands are based on the fact that an<br />
overgrazed land is protected from frequent grazing,<br />
the productive perennials, quality grasses replace<br />
the undesirable annual grasses. Protection from<br />
grazing allows the perennials to produce large<br />
quantities <strong>of</strong> seeds. Thus depending on the<br />
condition <strong>of</strong> a site, a continuous protection from<br />
grazing develops the ground layer principally made<br />
<strong>Ecorestoration</strong> <strong>of</strong><br />
<strong>Banni</strong> <strong>Grassland</strong><br />
up <strong>of</strong> perennial grasses (Kanodia and Patil, 1983).<br />
The same improvement can be achieved but at a<br />
slower rate, with either deferred or rotational grazing<br />
system where the grasses are protected up to seed<br />
dispersal or as under pasture management systems.<br />
Therefore, the first step in any restoration strategy,<br />
<strong>of</strong> course, is to protect the disturbed habitats and<br />
communities from being further wasted, and from<br />
losing the extant genes (Singh and Jha, 1993).<br />
As a measure to protect the Bhirandiyara restoration<br />
site from livestock grazing, a trench fence consisting<br />
<strong>of</strong> 1.2 m width and 1 m deep was laid along<br />
the periphery <strong>of</strong> the site. There are views that trench<br />
fencing is not a foolpro<strong>of</strong> method to protect the<br />
grass plot from cattle. However, its effectiveness in<br />
the protection, depends upon the width and depth<br />
<strong>of</strong> the trench. Therefore, a barbed wire fence around<br />
the site was also raised to ensure double protection<br />
from any kind <strong>of</strong> grazing. It has been reported<br />
that the protection <strong>of</strong> grasslands with the help <strong>of</strong><br />
barbed wire fencing increased forage production<br />
<strong>of</strong> better grasses (Bhimaya et. al. 1967, Ahuja 1977,<br />
Kanodia et. al. 1978). At Dhordo restoration site,<br />
due to the coverage <strong>of</strong> vast area <strong>of</strong> 200 ha, it was<br />
decided to have only trench fencing. But, to ensure<br />
full protection from cattle, a 2 m wide and 1.5 m<br />
deep trench was dug along the periphery <strong>of</strong> the<br />
plot, which covers a length <strong>of</strong> 6000 m. The mud<br />
removed from the trench was also used to raise a<br />
1.5 m high mud wall on the inner fringe <strong>of</strong> the trench.<br />
This ensured a complete protection from cattle. This<br />
method <strong>of</strong> fencing though less expensive as compared<br />
to barbed wire fencing, requires maintenance<br />
every year. This trench, apart from its cattle pro<strong>of</strong><br />
function, also helps in harvesting the rainwater due<br />
to its vast length, depth and width.<br />
3.2 Removal <strong>of</strong> Prosopis juliflora and Other Weeds<br />
Prosopis juliflora infestation is believed to be the<br />
major cause in reducing the productivity <strong>of</strong><br />
pastureland and hinder the growth <strong>of</strong> grasses.<br />
Unwanted thorny bushes need to be removed out<br />
mechanically or manually to eliminate the<br />
19
<strong>Ecorestoration</strong> <strong>of</strong><br />
<strong>Banni</strong> <strong>Grassland</strong><br />
20
competition. Even useful fodder bushes such as<br />
Zizyphus nummularia should not be allowed to<br />
grow more than 4 per cent in a grazing area, so as to<br />
maintain the forage production from the pasture<br />
(Ganguli et. al. 1964).<br />
With the above view, Prosopis juliflora and other<br />
unwanted bushes growing inside the restoration<br />
site were totally uprooted with the help <strong>of</strong> Gujarat<br />
Forest Development Corporation.<br />
3.3 Reseeding <strong>of</strong> Grass Species<br />
Succession <strong>of</strong> vegetation in a natural sequence is a<br />
time consuming process and can be expected to<br />
succeed in the desired direction only if the nucleus<br />
<strong>of</strong> the plant material is available in productive stage<br />
on a given site. Plantation <strong>of</strong> seed slightly below<br />
the surface after scratching it or in strips with<br />
appropriate species <strong>of</strong> grasses is the quickest and<br />
most ensured method <strong>of</strong> improvement <strong>of</strong> degraded<br />
grassland (Kanodia and Patil, 1983).<br />
For reseeding, first preference was given for<br />
indigenous grass varieties, which normally grow<br />
under arid climatic and soil conditions <strong>of</strong> <strong>Banni</strong>.<br />
Therefore, indigenous seeds were obtained from<br />
<strong>Banni</strong> Development Agency, Bhuj. Apart from this,<br />
seeds were also obtained from Indian <strong>Grassland</strong><br />
and Fodder Research Institute, Jhansi. The<br />
indigenous species such as; Cenchrus setigerus,<br />
Sporobolus sp., Eurochondra sp., Dichanthium<br />
annulatum, Chloris barbata and Cenchrus ciliaris,<br />
were selected for sowing in the restoration site.<br />
The selection <strong>of</strong> indigenous species was based on<br />
the fact that they have genetically acquired several<br />
adaptations to survive in the harsh climatic and<br />
soil conditions. Therefore, they were expected to<br />
thrive well in the restoration sites where more<br />
suitable conditions for grass growth were already<br />
created. Apart from this, species such as;<br />
Chrysopogan fulvus and Pennisetum pedicellatum<br />
were also sown in small quantities. The later species<br />
was not reported from <strong>Banni</strong> area. The performance<br />
such as growth and productivity <strong>of</strong> this species in<br />
the restoration site would help in planning for future<br />
large-scale introduction <strong>of</strong> such species in entire<br />
<strong>Banni</strong> area. The reseeding activity, it is hoped,<br />
would increase the seed bank <strong>of</strong> the area and<br />
thereby enrich the grass density and diversity <strong>of</strong><br />
the restoration site.<br />
In arid area, under rainfed conditions, the sowing<br />
<strong>of</strong> grass seeds is normally done in the months <strong>of</strong><br />
June / July with the onset <strong>of</strong> monsoon. To enhance<br />
<strong>Ecorestoration</strong> <strong>of</strong><br />
<strong>Banni</strong> <strong>Grassland</strong><br />
the germination and uniform distribution <strong>of</strong> seeds,<br />
the seeds were mixed with soil and farmyard manure.<br />
Then they were thoroughly mixed by sprinkling<br />
water. This reduce the transport <strong>of</strong> seeds through<br />
wind and the moisture in the seed mixture hastens<br />
the process <strong>of</strong> germination. Care was taken that,<br />
the seed sown was covered by 1 to 2 cm soil layer.<br />
Since, the grass seeds are too small, the stored<br />
germplasm is insufficient to support the<br />
germination and growth <strong>of</strong> seedlings from deeper<br />
soil layers. The stocking rate <strong>of</strong> seeds varied with<br />
the species. Normal stocking rate <strong>of</strong> seed reported<br />
is; 2.5 kg/ha for Dichanthium annulatum, 5 kg/ha<br />
for Cenchrus ciliaris and Cenchrus setigerus, 5<br />
kg/ha for Sporobolus sp. etc. to 75 kg/ha for<br />
Lasiurus species. However, keeping the view <strong>of</strong><br />
the near absence <strong>of</strong> seed bank in the restoration<br />
sites, nearly 3-4 times higher seed rate than the<br />
normal were stocked.<br />
The Bhirandiyara restoration site was divided into<br />
four sub-compartments, each covering an area <strong>of</strong><br />
approximately 3.4 ha. The first compartment,<br />
covering an area <strong>of</strong> 3.4 ha was kept under natural<br />
condition (Compartment 1), where the fencing<br />
(trench and barbed wire) ensured complete<br />
protection from livestock grazing. Pure as well as<br />
mixed combination (for Eg. Cenchrus sp. with<br />
Sporobolus sp.) <strong>of</strong> grass seeds were sown within<br />
the compartment, however, a strip (10m width and<br />
250 m length) covering an area <strong>of</strong> 3750 m 2 was kept<br />
completely under natural condition where no<br />
sowing <strong>of</strong> grass seed was undertaken. The basic<br />
view was that, the area devoid <strong>of</strong> seed sowing<br />
resembled very much to that <strong>of</strong> the area out side<br />
the fenced area <strong>of</strong> the site. The only difference<br />
between these two was that the former received<br />
protection from grazing while the later was<br />
subjected to grazing pressures. Hence, a<br />
comparison <strong>of</strong> the productivity <strong>of</strong> grass species <strong>of</strong><br />
the said area with that <strong>of</strong> outside the fenced site<br />
would provide the effect <strong>of</strong> grazing pressure that<br />
existed in the area. The mixed combinations <strong>of</strong> seeds<br />
were used to understand the better species<br />
association in terms <strong>of</strong> productivity.<br />
At Dhordo restoration site, the whole area was divided<br />
into 30 m wide strips. Ploughing, broadcasting<br />
<strong>of</strong> grass seeds and adding <strong>of</strong> farmyard manure<br />
was carried out at alternative strips.<br />
3.4 Fertiliser Application<br />
In the natural pastures <strong>of</strong> arid regions, scope <strong>of</strong><br />
fertilisation is limited mainly due to uncertainty <strong>of</strong><br />
21
<strong>Ecorestoration</strong> <strong>of</strong><br />
<strong>Banni</strong> <strong>Grassland</strong><br />
rainfall. Further, due to selling <strong>of</strong> cow dung from<br />
<strong>Banni</strong>, the natural supply <strong>of</strong> manure has been considerably<br />
reduced. It has been reported that, about<br />
a ton <strong>of</strong> cow dung consists <strong>of</strong> 75 per cent water and<br />
remaining consists <strong>of</strong> 4.5 kg nitrogen, 2.3 kg phosphoric<br />
acid and 4.5 kg potash and that the cattle<br />
returns nearly 75 per cent nitrogen, 80 per cent phosphoric<br />
acid and 90 per cent potash obtained from<br />
her feed (Owen 1980). The two-way system; intake<br />
<strong>of</strong> nutrients through grass feed and its release<br />
through dung facilitate almost no loss or negligible<br />
loss <strong>of</strong> nutrients from the grassland area. However,<br />
the disruption <strong>of</strong> this cycle, through selling <strong>of</strong> cow<br />
dung, in <strong>Banni</strong>, has gradually affected the soil nutrients<br />
<strong>of</strong> the area, which in turn has affected plant<br />
growth. Therefore, to increase the soil nutrients <strong>of</strong><br />
the restoration site, farmyard manure was added at<br />
the rate <strong>of</strong> 2 tonnes per ha. This, apart from improving<br />
the nutrient status <strong>of</strong> the degraded land would<br />
improve the physical properties <strong>of</strong> the soil such as<br />
permeability, soil structure etc. Also, the chemical<br />
binding <strong>of</strong> dung with that <strong>of</strong> soil is known to reduce<br />
the soil salinity to some extent.<br />
3.5 Legume Introduction<br />
Grass-legume mixtures are always desirable because<br />
<strong>of</strong> their complementary functions in providing nutritive<br />
and palatable forage for livestock. Legumes<br />
usually maintain their quality better than non-legumes<br />
even at maturity and being rich in protein<br />
they enhance the forage value and also add substantially<br />
the needed nitrogen to the soil. Thus,<br />
grasses are directly or indirectly benefited by the<br />
use <strong>of</strong> nitrogen components manufactured by the<br />
legumes. Legumes are considered as useful and<br />
the cheapest source <strong>of</strong> nitrogen in pastures. On<br />
death and decay <strong>of</strong> the legume plant, their roots<br />
and root nodules break down in the soil and release<br />
their stored nitrogen, which then becomes<br />
available to the associated crops.<br />
Therefore, legume species like Afylosia sp.,<br />
Sesbania sp. and Stylo hamata were sown in the<br />
restoration sites. Further, species such as Sesbania<br />
produces high quality fodder, that can also be used<br />
as cattle feed.<br />
3.6 Soil Amendments in Bhirandiyara <strong>Restoration</strong><br />
Site<br />
The restoration site selected at Bhirandiyara was<br />
located in a highly saline track <strong>of</strong> <strong>Banni</strong>. In this site<br />
experimentation on salinity reduction and control<br />
22<br />
was undertaken to improve the grass diversity and<br />
productivity. This site was divided into four equal<br />
compartments, <strong>of</strong> which, compartment 1 is left under<br />
natural condition where no soil modifications<br />
were carried out. Compartment 2 was ploughed to a<br />
depth <strong>of</strong> 50 cm to improve the soil permeability,<br />
water infiltration and to break up-surface crust. In<br />
this compartment, organic manure was also added<br />
at the rate <strong>of</strong> 2 tons/ ha.<br />
To leach the salinity <strong>of</strong> the research site, a 5 m wide<br />
gentle slopes with a height <strong>of</strong> 30 cm and with 50 cm<br />
deep and 50 cm wide drainage channels were dug<br />
in the compartment 3. Similar activities, with<br />
changes in the width <strong>of</strong> the slopes to 3 m and height<br />
<strong>of</strong> the slopes to 50 cm were made in compartment 4<br />
to study the effects <strong>of</strong> increasing the slope height<br />
on the grass species diversity and productivity.<br />
The compartment 4 was further sub-divided into;<br />
half the slopes and the trench facing northwest<br />
direction and the other half facing east-west direction.<br />
The basic view <strong>of</strong> this amendment was to<br />
study the effects <strong>of</strong> wind borne salt deposition on<br />
the diversity and productivity <strong>of</strong> grass species<br />
growing on the slopes facing towards and against<br />
wind direction. It is hoped that this will help in generating<br />
an additional information on the deposition<br />
<strong>of</strong> salt particles through wind action and its impacts<br />
on the productivity <strong>of</strong> different grass species<br />
growing in the area.<br />
3.7 Soil Amendments in Dhordo <strong>Restoration</strong> Site<br />
The Dhordo restoration plot encompasses an area<br />
<strong>of</strong> 200 ha (width 1km x length 2km), located near<br />
village Dhordo. The whole area <strong>of</strong> the site was<br />
divided into 30m wide strips. Ploughing, adding <strong>of</strong><br />
farmyard manure and sowing <strong>of</strong> grass seeds were<br />
carried out in every alternative strips. Prosopis<br />
juliflora grown inside the fenced site was removed,<br />
except for few Prosopis juliflora, in which the side<br />
branches were removed with a view to change the<br />
architecture <strong>of</strong> the plant. There is a common view<br />
that the spreading cover <strong>of</strong> Prosopis juliflora<br />
reduces the underneath ground cover and that the<br />
changed architecture would help in supporting the<br />
underground vegetation. Further, the tree may also<br />
act as a windbreaker.
4. METHODOLOGY<br />
The vegetation data was collected from two<br />
restoration sites; Bhirandiyara and Dhordo and it’s<br />
adjoining areas located outside the restoration<br />
sites. Further, to understand the effects <strong>of</strong> Prosopis<br />
juliflora on grass plant diversity and productivity,<br />
data was collected from such infested areas also.<br />
Even though several management inputs such as<br />
protection, reseeding, fertiliser application and soil<br />
amendments were carried out to hasten the recovery<br />
process <strong>of</strong> the restoration sites, all these<br />
efforts would not be successful with out<br />
appropriate rainfall. Therefore, the severe<br />
droughts, which prevailed during the year<br />
1995 and 1996, created a serious hurdle on<br />
the recovery <strong>of</strong> restoration sites. During this<br />
period, the total rainfall recorded in Bhuj<br />
taluka was 152 and 87 mm respectively and<br />
this rainfall was 56 and 75 per cent less than<br />
the normal rainfall recorded (328 mm) for the<br />
taluka. Therefore, the efforts <strong>of</strong> the<br />
restoration activities at the two sites could<br />
be seen only after the 1997 monsoon i.e.<br />
from September 1997 to December 1997 (see<br />
limitation <strong>of</strong> data).<br />
4.1 Field Data Collection Method<br />
Quadrate method was used to collect the data on<br />
vegetation (species diversity and biomass) in the<br />
restoration and adjoining sites <strong>of</strong> Bhirandiyara and<br />
Dhordo. The size <strong>of</strong> the sampling quadrate was fixed<br />
to 0.5 x 0.5 m (square) based on the nested plot<br />
method (Figure 3).<br />
The nature <strong>of</strong> plants causes a clear and a slowchanging<br />
spatial pattern in the distribution <strong>of</strong> species.<br />
Often patchiness in the environmental variables,<br />
restrict the dispersal <strong>of</strong> propagules and clonal<br />
growth, bring about a patchy distribution <strong>of</strong> plants<br />
<strong>of</strong> a species. The increase in the sampling number<br />
or replication <strong>of</strong> sampling than the minimum required<br />
number allows the precision <strong>of</strong> the generalisation<br />
to the whole study area to be measured. Therefore,<br />
a sampling strategy was designed to compensate<br />
for this patchiness and to give an accurate repre-<br />
<strong>Ecorestoration</strong> <strong>of</strong><br />
<strong>Banni</strong> <strong>Grassland</strong><br />
sentation <strong>of</strong> the species in the whole study area. In<br />
total 35 sampling sites, covering an area <strong>of</strong> 25 x 25<br />
m were fixed within the Dhordo restoration plot. In<br />
all the 35 sampling sites, three sampling quadrates<br />
(0.25 m 2 ) were laid starting from September 1997,<br />
and thereafter, every fortnightly for the rest <strong>of</strong> the<br />
study period. The data collection ended during late<br />
November 1997 at Dhordo (due to harvest <strong>of</strong> grass)<br />
and in December 1997 at Bhirandiyara site. During<br />
the study period, a total <strong>of</strong> 428 sampling were carried<br />
out at Dhordo restoration site, which includes<br />
258 samples in the unploughed area and 170 in the<br />
ploughed area <strong>of</strong> the restoration site. In the degraded<br />
and Prosopis juliflora infested areas <strong>of</strong><br />
Dhordo, 48 samples were carried out at each site.<br />
At Bhirandiyara, 4 sampling sites covering an area<br />
<strong>of</strong> 25 x 25 m (625 m 2 ) was fixed in unploughed and<br />
ploughed area where two samples at each sampling<br />
sites were carried out at fortnightly intervals. In the<br />
three slope areas, i.e. broad, vertical and horizontal,<br />
8 samplings were carried out in each slope category.<br />
Thus, during the study period, a total <strong>of</strong> 200<br />
samples which encompasses 40 samples in each<br />
amendment were carried out within the restoration<br />
site and 36 in the unprotected area in the nearby<br />
vicinity <strong>of</strong> Bhirandiyara restoration site.<br />
In each sampling quadrate, data on plant species,<br />
its cover, frequency and biomass were recorded.<br />
Braun-Blanquet scale was used to estimate the<br />
cover <strong>of</strong> the grass species. The sampling area was<br />
divided into 5 cover classes;
<strong>Ecorestoration</strong> <strong>of</strong><br />
<strong>Banni</strong> <strong>Grassland</strong><br />
26-50, 51-75 and 76-100 per cent. The great advantage<br />
<strong>of</strong> this scale method as compared to more complicated<br />
surveying, is that it is less time consuming.<br />
This method however, is not accurate mainly<br />
due to subjectivity in the estimate. To avoid such<br />
inaccuracy, the designated classes <strong>of</strong> the cover in<br />
the area were defined initially through orientation<br />
training <strong>of</strong> the field research staff.<br />
Data on aboveground biomass was collected using<br />
harvesting method. Care was taken to harvest<br />
the aboveground biomass at similar height, i.e.<br />
close to ground level. The harvesting <strong>of</strong><br />
aboveground biomass was carried out between<br />
September 1997 to November 1997 (in Dhordo) or<br />
December 1997 (in Bhirandiyara) at a periodic interval<br />
<strong>of</strong> 15 days. The aboveground biomass was<br />
packed in polythene bags and site details were labelled<br />
on the bags. Then it was sorted into species<br />
at the laboratory and was dried under natural sun<br />
light for several days. After complete drying, the<br />
dry weight <strong>of</strong> each species in each sample area was<br />
taken by using Mettler precision balance.<br />
24<br />
The fresh weight was not considered because it is<br />
not an appropriate measure (Bullock 1996). It varies<br />
with the moisture content <strong>of</strong> the plant and the<br />
moisture loss during transportation to the<br />
laboratory.<br />
Within the quadrate, soil samples were also collected<br />
to assess the microhabitat condition and to<br />
understand the effects <strong>of</strong> soil parameters such as<br />
salinity and pH on the distribution and production<br />
<strong>of</strong> plant species. The sampling was done at two<br />
depths, i.e. the top soil and at a depth <strong>of</strong> 30-40 cm.<br />
The reason for restricting up to a depth <strong>of</strong> 30-40 cm<br />
was due to the fact that the grass root system generally<br />
utilises only 30 cm <strong>of</strong> soil depth. Singh and<br />
Yadav, (1993) reported that 93 per cent <strong>of</strong> the grass<br />
root materials were found up to 0-30 cm soil depth.<br />
The samples were analysed through soil testing<br />
laboratory <strong>of</strong> Agricultural Department, Bhuj.
5. RESULTS<br />
5.1 COVER<br />
The phenology <strong>of</strong> grass species occurring in<br />
grassland change immediately after a few showers.<br />
After receiving sufficient moisture, the seedlings<br />
<strong>of</strong> annuals and perennials start emerging from the<br />
seeds and sprouting <strong>of</strong> perennating buds, and are<br />
followed by vigorous vegetative growth, which<br />
gradually converts the area into lush green. The<br />
grass cover protects the soil from erosion and<br />
reduces the soil moisture loss due to evaporation.<br />
In the present study, the grass cover recorded in<br />
the restoration site showed a gradual increase<br />
while, it was maximum soon after the rainfall<br />
(September and October) in the unprotected<br />
and Prosopis juliflora infested areas and it<br />
decreased during the subsequent post monsoon<br />
season.<br />
5.1.1 Dhordo <strong>Restoration</strong> Site<br />
At Dhordo, there was a marked<br />
variation in grass cover at three<br />
study sites, i.e., restoration site (site<br />
A), outside unprotected area (site<br />
B) and Prosopis juliflora infested<br />
areas (site C). The restoration site<br />
was broadly classified into two<br />
categories; unploughed area where<br />
<strong>Ecorestoration</strong> <strong>of</strong><br />
<strong>Banni</strong> <strong>Grassland</strong><br />
no soil working was carried out and ploughed area<br />
where soil working such as ploughing, adding <strong>of</strong><br />
farmyard manure and reseeding <strong>of</strong> grass species<br />
were undertaken. The grass cover estimated in the<br />
ploughed and unploughed area <strong>of</strong> site A gradually<br />
increased from 56.7 and 54.7 per cent in September<br />
to 67.4 and 72.1 per cent respectively at the end <strong>of</strong><br />
November, with a slight fall (57 and 65 per cent) in<br />
the first fortnight <strong>of</strong> November (Table 1). Further,<br />
the unploughed and ploughed area did not record<br />
any significant variation in<br />
grass cover between the<br />
initiation and the end <strong>of</strong> the<br />
study period. Nevertheless,<br />
the grass cover was slightly<br />
higher in unploughed areas<br />
since October when<br />
compared to ploughed area<br />
(Figure 4 and Table 1).<br />
Contrary to this, unprotected<br />
and Prosopis juliflora<br />
infested areas showed very<br />
low availability <strong>of</strong> cover,<br />
which during the study period decreased from 15.4<br />
to 10.7 per cent and 30.7 to 8.3 per cent respectively.<br />
However, site C showed a higher cover than site B<br />
during the initiation <strong>of</strong> the study (Table 1).<br />
A comparison between unploughed protected area<br />
(restoration site) and unprotected area (site B),<br />
which have similar climo-edaphic conditions,<br />
25
<strong>Ecorestoration</strong> <strong>of</strong><br />
<strong>Banni</strong> <strong>Grassland</strong><br />
26<br />
Table 1: Changes in Monthly Cover at Dhordo <strong>Restoration</strong> Site<br />
Site Details Sep. '97 Oct'97 Oct'97 Nov.'97 Nov.'97<br />
<strong>Restoration</strong> site - Ploughed Area (site A) 56.7 61.2 65.0 57.4 67.4<br />
<strong>Restoration</strong> site - Unploughed Area (site A) 54.7 70.5 73.6 64.8 72.1<br />
Unprotected Area (site B) 15.4 18.8 9.4 12.5 10.7<br />
Prosopis Area (site C) 30.7 11.1 14.2 17.5 8.3<br />
showed significant variation in grass<br />
cover. The grass cover <strong>of</strong> the former was<br />
3.6 to 6.7 times higher than the latter<br />
during the entire period <strong>of</strong> study (Figure<br />
5). This clearly demonstrated that<br />
grazing pressure in the unprotected area<br />
was significant. The Table 2 shows the<br />
increase in cover by 10.7 and 17.4 per<br />
cent in the ploughed and unploughed<br />
area <strong>of</strong> site A while, it has decreased to<br />
6.1 per cent at site B and 22.4 per cent at<br />
site C.<br />
5.1.2 Bhirandiyara <strong>Restoration</strong> Site<br />
Table 2: Per cent Grass Cover Recorded in Different Sites at Dhordo<br />
Site Details Grass cover in Grass cover in Difference Remarks<br />
September "97 November '97<br />
<strong>Restoration</strong> site - Ploughed 56.7 67.4 10.7 Increase<br />
<strong>Restoration</strong> site - Unploughed 54.7 72.1 17.4 Increase<br />
Unprotected Area 16.7 10.6 -6.1 Decrease<br />
Prosopis Area 30.7 8.3 -22.4 Decrease<br />
At Bhirandiyara, the monthly mean cover in the<br />
restoration site was 49 per cent at the initiation <strong>of</strong><br />
the study in October and thereafter it showed a<br />
slight increase in November and remained almost<br />
stable up to the first fortnight <strong>of</strong> December, except<br />
that, it showed a slight fall in the second fortnight<br />
<strong>of</strong> December (Table 3). In the unprotected (outside)<br />
area, maximum cover was recorded in the first fortnight<br />
<strong>of</strong> November (69.4 per cent) which gradually<br />
decreased during the post monsoon period and<br />
attained a minimum <strong>of</strong> 19.4 per cent at the end <strong>of</strong><br />
December. Thus, initially (first fortnight <strong>of</strong> November)<br />
the unprotected area showed a higher cover<br />
than the restoration site which then decreased significantly<br />
by the end <strong>of</strong> the study, indicating clearly<br />
the effects <strong>of</strong> grazing pressure on the unprotected<br />
area (Table 3 and Figure 6).<br />
The grass cover recorded under various<br />
amendments <strong>of</strong> the restoration site showed<br />
similarities in certain areas and variation in others.<br />
The cover estimated was very high (76.9 per cent)<br />
in the unploughed area and drastically low (17.5<br />
per cent) in the narrow horizontal slopes.<br />
Interestingly, looking at the various amendments<br />
<strong>of</strong> the restoration site, the cover showed a decrease<br />
during the study period in the unploughed,<br />
ploughed and broad slopes whereas it showed an<br />
increase in the narrow vertical and horizontal slopes.<br />
The unploughed area in the restoration site had<br />
higher cover availability during the initial and end<br />
<strong>of</strong> the study period while, ploughed area exhibited<br />
a slightly higher cover during the middle period<br />
(Figure 7), i.e. first fortnight <strong>of</strong> November to<br />
first fortnight <strong>of</strong> December. Among the three types<br />
<strong>of</strong> slopes in the restoration site, almost similar cover
Table 3: Difference in the Grass Cover in and outside the Bhirandiyara Site.<br />
<strong>Ecorestoration</strong> <strong>of</strong><br />
<strong>Banni</strong> <strong>Grassland</strong><br />
Details <strong>of</strong> Plot Oct.'97 Nov.'97 Nov.'97 Dec.'97 Dec.'97<br />
<strong>Restoration</strong> site - Unploughed 76.9 60.0 63.1 55.6 65.0<br />
<strong>Restoration</strong> site -Ploughed 55.6 68.1 61.9 64.4 51.9<br />
<strong>Restoration</strong> site-Broad Slope (5x150) 50.0 35.0 50.0 46.3 38.8<br />
<strong>Restoration</strong> site -Vertical Slope (3x150) 46.3 56.3 50.0 49.4 50.6<br />
<strong>Restoration</strong> site -Horizontal Slope (3x150) 17.5 50 40.6 51.3 45.6<br />
Monthly Mean Cover in the <strong>Restoration</strong> Site 49.26 53.88 53.12 53.4 50.38<br />
Unprotected Area * 69.4 46.9 43.8 19.4<br />
% Difference Between <strong>Restoration</strong> and<br />
Unprotected site<br />
availability was recorded at broad (50 per cent) and<br />
narrow vertical slopes (46.3 per cent) while on the<br />
narrow horizontal slopes it was low (17.5 per cent)<br />
during October. However, at the end <strong>of</strong> December<br />
the narrow vertical (50.6 per cent) and horizontal<br />
slopes (45.6 per cent) had the maximum cover which<br />
in turn decreased to 38.8 per cent on the broad<br />
slopes. Overall, narrow vertical slopes showed a<br />
higher cover than other two slopes except in<br />
October and first fortnight <strong>of</strong> December (Figure 8).<br />
5.2 SPECIES DIVERSITY<br />
Diversity is the central theme in ecology. Species<br />
diversity is a very useful parameter for comparison<br />
<strong>of</strong> two or more communities especially to study the<br />
influence <strong>of</strong> biotic disturbances or to know the state<br />
<strong>of</strong> succession and stability in the community. Shannon<br />
index <strong>of</strong> general diversity was estimated for<br />
the study sites (in and around Dhordo and<br />
Bhirandiyara restoration sites) using the biomass<br />
values <strong>of</strong> different species.<br />
Table 4 and 5 highlight the species diversity<br />
recorded in the Dhordo and Bhirandiyara<br />
restoration site. Maximum diversity was recorded<br />
28.7 -11.7 -17.9 -61.5<br />
* data not obtained<br />
in the Dhordo restoration site while it was low at<br />
Bhirandiyara restoration site and the surrounding<br />
areas. Interestingly, the diversity <strong>of</strong> the<br />
Bhirandiyara restoration site was even far lower<br />
than the unprotected (site B) and Prosopis juliflora<br />
infested areas (site C) <strong>of</strong> Dhordo. Further, in<br />
Dhordo, the species diversity was not affected by<br />
the soil amendments, where the diversity index<br />
estimated for unploughed (H’= 1.02) and ploughed<br />
areas (H’=1.03) remained same. However, a slight<br />
variation in diversity was registered between the<br />
restoration site and the unprotected area (site B) as<br />
well as the Prosopis juliflora infested areas, which<br />
are located adjacent to the restoration site. The<br />
diversity <strong>of</strong> Prosopis juliflora infested area (H’=<br />
0.95) was slightly higher than unprotected area<br />
(H’=0.88) (Table 4).<br />
At Bhirandiyara, the diversity <strong>of</strong> the restoration<br />
site was far higher (H’=0.6) than the unprotected<br />
area (H’= 0.24), which is located adjacent to it. A<br />
little variation in diversity was recorded under<br />
various amendments in the Bhirandiyara restoration<br />
site. Among the different amendments, ploughed<br />
(H’= 0.66) area showed a higher diversity than the<br />
27
<strong>Ecorestoration</strong> <strong>of</strong><br />
<strong>Banni</strong> <strong>Grassland</strong><br />
28<br />
Table 4: General Species Diversity Index at Dhordo Site<br />
Site Details General Diversity Index Rank<br />
Ploughed Area (<strong>Restoration</strong> site) 1.02 2<br />
Unploughed Area (<strong>Restoration</strong> site) 1.03 1<br />
Unprotected Area (site B) 0.88 4<br />
Prosopis juliflora infested Areas (site C) 0.95 3<br />
Shannon index (H) = -E [(ni/N) log (ni/N)], “ni”is the biomass <strong>of</strong>ith species, “N”<br />
is biomass <strong>of</strong> all the species<br />
Table 5: General Species Diversity Index at Bhirandiyara Site<br />
Amendments Details General Diversity Index Rank<br />
Ploughed Area (<strong>Restoration</strong> site) 0.66 2<br />
Unploughed Area (<strong>Restoration</strong> site) 0.52 5<br />
Broad Slopes (<strong>Restoration</strong> site) 0.54 4<br />
Vertical Slopes (<strong>Restoration</strong> site) 0.68 1<br />
Horizontal Slopes (<strong>Restoration</strong> site) 0.60 3<br />
Mean diversity in the Bhirandiyara Site 0.60<br />
Unprotected Area 0.24 6<br />
unploughed area (H’=0.52). However, maximum<br />
diversity <strong>of</strong> the Bhirandiyara restoration site was<br />
recorded in the narrow vertical slopes (H’= 0.68).<br />
All the three categories <strong>of</strong> slopes reflect higher<br />
diversity than the unploughed area (Table 5 and<br />
Figure 9).<br />
5.2.1. Species Recorded at Dhordo<br />
In Dhordo, total 25 species belonging to 20 genus<br />
were recorded in the restoration site, which in turn<br />
decreased to 18 species (72 per cent) in the unprotected<br />
area (site B) and 17 species (68 per cent) in<br />
the Prosopis juliflora infested area (site C).<br />
The occurrence <strong>of</strong> species such as Cenchrus ciliaris,<br />
Cyperus haspan, Chrysopogan fulvus, Scirpus sp.,<br />
Setaria pallide, Themeda triandra, Tragus sp. and<br />
Sporobolus pallidus was restricted only at the restoration<br />
site whereas Sporobolus helvolus,<br />
Aeluropus logopoides, Dichanthium annulatum,<br />
Tetrapogan tenellus, Tragus sp., Chloris barbata,<br />
Cyperus rotundas, Echinocloa sp., Cenchrus<br />
setigerus, Eragrostis sp., Dinebra rotr<strong>of</strong>lexa,<br />
Gandhiro, Digera rnuiicata, Aristida funiculata and<br />
Cressa erotica are some <strong>of</strong> the species found common<br />
in all the three sites (A, B and C) at Dhordo<br />
(Table 6 and Figure 10).<br />
5.2.2. Species Recorded at Bhirandiyara<br />
At Bhirandiyara, in total 12 plant species belonging<br />
to 11 genus were recorded, which in turn decreased<br />
to 6 species (50 per cent) in the unrestored area.<br />
Further, within the restoration site, the number <strong>of</strong><br />
individuals <strong>of</strong> the species fluctuates under different<br />
soil amendments. The species occurrence was high<br />
at unploughed area (91.7 per cent) followed by<br />
vertical slopes (75 per cent). In other areas, about<br />
66.7 per cent <strong>of</strong> the species were recorded. Cyperus<br />
haspan, Cyperus rotundus, Scirpus sp., Sporobolus<br />
helvolus, Aeluropus logopoides and Cressa erotica<br />
are the common species, which were recorded in all<br />
the amendment areas <strong>of</strong> the restoration site as well<br />
as unprotected site. Dichanthium annulatum was
Table 6: Grass and Herbaceous Species in and around Dhordo <strong>Restoration</strong> site<br />
<strong>Ecorestoration</strong> <strong>of</strong><br />
<strong>Banni</strong> <strong>Grassland</strong><br />
S. No Species<br />
Species Recorded in<br />
<strong>Restoration</strong> <strong>Restoration</strong> Site Out side Prosopis<br />
Site Unploughed Ploughed Area area<br />
1 Ahstida funiculata + + + + +<br />
2 Aeluropus logopoides + + + + +<br />
3 Cenchrus ciliaris + + + - -<br />
4 Cenchrus setigerus + + + + +<br />
5 Chlohs barbata + + + + +<br />
6 Cyperus rotundus + + + + +<br />
7 Cyperus haspan + + + - -<br />
8 Chrysopogan fulvus + + + - -<br />
9 Dactyloctenium aegyptium + + + + +<br />
10 Dichanthium annulatum + + + + +<br />
11 Digera muricata + + + + +<br />
12 Dinebra retr<strong>of</strong>lexa + + + + +<br />
13 Eragrostis tenella + + + + +<br />
14 Eragrostis sp. + + + + -<br />
15 Echinocloa sp. + + + + +<br />
16 Gandhiro* + + + + +<br />
17 Setaha pallide + + + - -<br />
18 Setaha sp. + + + + +<br />
19 Sporobolus helvolus + + + + +<br />
20 Sporobolus pallidus + + + - -<br />
21 Scirpus sp. + + - - -<br />
22 Tetrapogan tenellus + + + + +<br />
23 Tragus sp. + + + + +<br />
24 Themeda triandra + + - - -<br />
25 Cressa cretica + + + + +<br />
Total species 25 25 23 18 17<br />
% Occurrence 100.0 100.0 92.0 72.0 68.0<br />
* Unidentified species<br />
The list details the occurrence <strong>of</strong> species in the three sites. Some <strong>of</strong> the above mentioned species were<br />
not recorded in the sampling quadrates.<br />
seen only on vertical slopes while the occurrence<br />
<strong>of</strong> Chrysopogan fulvus and Setaria sp. were<br />
restricted only to the unploughed area (Table 7) <strong>of</strong><br />
the restoration site.<br />
5.3. SPECIES DISTRIBUTION PATTERN<br />
Plant distribution in an area is not homogenous. In<br />
nature, species that produce large number <strong>of</strong> wind<br />
dispersed seeds get scattered uniformly all over<br />
the area and on germination the plants grow<br />
throughout, while seeds <strong>of</strong> those species which do<br />
not have such dispersal mechanism, are generally<br />
shed near the plants or they are dispersed by animals<br />
or by other means. Such species are not scattered<br />
uniformly all over the area and their occur-<br />
rence is restricted to aggregation or in patches. The<br />
distribution pattern <strong>of</strong> species in an area can be<br />
obtained through percentage frequency estimation.<br />
Raunkaier (1934) classified five broad categories <strong>of</strong><br />
distribution based on the percentage frequency <strong>of</strong><br />
species. This classification was used to evaluate<br />
the distribution pattern <strong>of</strong> different grass species<br />
present in and around the study sites. Raunkaier’s<br />
frequency classes are as follows:<br />
Class A: Species with frequency from 1-20 per cent<br />
Class B: Species with frequency from 21- 40 per<br />
cent Class C: Species with frequency from 41- 60<br />
per cent Class D: Species with frequency from 61-<br />
80 per cent Class E: Species with frequency from<br />
81-100 per cent.<br />
29
<strong>Ecorestoration</strong> <strong>of</strong><br />
<strong>Banni</strong> <strong>Grassland</strong><br />
S.<br />
No<br />
30<br />
Species<br />
Table 7: Grass and Herbaceous Species at Bhirandiyara Site<br />
<strong>Restoration</strong><br />
Site<br />
Species Recorded in<br />
Under Different Amendment*<br />
Unploughed Ploughed Broad<br />
Slope*<br />
Vertical<br />
Slopes<br />
Horizontal<br />
Slopes<br />
1 Cyperus haspan 1 + + + + + +<br />
2 Sporobolus helvolus 1 + + + + + +<br />
3 Dichanthium annulatum 1 - - - + - -<br />
4 Aeluropus logopoides 1 + + + + + +<br />
5 Echinocloa sp. 1 + + + - - -<br />
6 Cenchrus setigerus 1 + + + + + -<br />
7 Chrysopogon fulvus 1 + - - - - -<br />
8 Cyperus rotundus 1 + + + + + +<br />
9 Scirpus sp. 1 + + + + + +<br />
10 Pennisetum pedicellatum 1 + - - + + -<br />
11 Setaria sp. 1 + - - - - -<br />
12 Cressa cretica 1 + + + + + +<br />
Total species 12 11 8 8 9 8 6<br />
% Occurrence 100.0 91.7 66.7 66.7 75.0 66.7 50.0<br />
In this classification it is presumed that the class E<br />
and D reflects high to moderate uniform distribution,<br />
class C and B showed high to moderate random<br />
distribution while class A reflects aggregation<br />
<strong>of</strong> species.<br />
5.3.1. Species Distribution Pattern at Dhordo<br />
At Dhordo restoration site, <strong>of</strong> the 12 important<br />
selected species (Table 8), Cyperus rotundas and<br />
Cressa cretica fall under class D and surprisingly<br />
no species were recorded under Class E. The species<br />
such as Chloris barbata, Sporobolus sp. and<br />
Eragrostis sp. fall under class B while a maximum<br />
<strong>of</strong> 8 species (67 per cent); Setaria sp., Aeluropus<br />
logopoides; Gandhiro, Echinocloa sp., Cenchrus<br />
sp., Dactyloctenium aegyptium, Tetrapogan<br />
tenellus and Dichanthium annulatum were<br />
registered under class A.<br />
Table 8 also highlights that, there was a slight<br />
variation in the distribution <strong>of</strong> certain species<br />
during the period between September (beginning<br />
<strong>of</strong> study) and November (end <strong>of</strong> study). During the<br />
course <strong>of</strong> the post monsoon, the distribution <strong>of</strong><br />
species such as Chloris barbata shifted from class<br />
A to B, Sporobolus sp. from A to C, Cressa cretica<br />
from C to D, Aeluropus logopoides from A to B<br />
and Cenchrus sp. from A to B while only one<br />
Unidentified species<br />
Unprotected<br />
Area<br />
species, Cyperus rotundas showed a reverse trend<br />
from D to C (Table 8). However, among all,<br />
Sporobolus sp. showed a maximum increase in its<br />
distribution range during the study period while<br />
there was not much variation in the distribution <strong>of</strong><br />
other species. The relationship between different<br />
frequency classes (class A- 9, B-1, C-1, D-1 and E-<br />
0) enunciated during September are A>B=C=D>E<br />
and, in November the trend was (class A-6, B-4, C-<br />
2, D-1 and E-0) A>B>C>D>E. Thus, at the beginning<br />
and at the end <strong>of</strong> the study period, the value <strong>of</strong> E<br />
was lower than D in the Dhordo restoration site.<br />
From the Table 9 it is clear that, certain species<br />
have distributional variation under different soil<br />
amendments in Dhordo. The species such as<br />
Cyperus rotundus, Chloris barbata, Cressa erotica<br />
and Cenchrus sp. showed more distribution in the<br />
ploughed area than in unploughed area. Eragrostis<br />
sp. is the only species which had healthier distribution<br />
in unploughed area while species like<br />
Sporobolus sp., Setaria sp., Aeluropus logopoides,<br />
Gandhiro, Echinocloa sp., Dichanthium<br />
annulatum, Dactyloctenium aegyptium and<br />
Tetrapogan tenellus registered no changes in their<br />
distribution class under ploughed and unploughed<br />
conditions. The frequency relationship established<br />
shows that, (class A-9, B-2, C-1, D-1 and E-0)
<strong>Ecorestoration</strong> <strong>of</strong><br />
<strong>Banni</strong> <strong>Grassland</strong><br />
31
<strong>Ecorestoration</strong> <strong>of</strong><br />
<strong>Banni</strong> <strong>Grassland</strong><br />
32<br />
Table 8: Frequency Occurrence / Distribution Pattern <strong>of</strong> Plant Species at Dhordo<br />
Species<br />
September (n= 108) November (n =70) Over All i n = 428)<br />
No / % Distributio N /% Distribution No / % Distribution<br />
Frequency nClass Frequency Class frequency Class<br />
Cyperus rotundus 84 (77.7) D 41(58.6) C 315(73.6) D<br />
Chloris barbate 12(11.1) A 20 (28.6) B 98 (22.9) B<br />
Sporobolus sp. 19(17.6) A 31 (44.3) C 155(36.2) B<br />
Setaria sp. 14(12.9) A 8(11.4) A 71 (16.6) A<br />
Cressa erotica 51 (47.2) C 48 (68.6) D 259 (60.5) D<br />
Aeluropus logopoides 5 (4.6) A 17(24.3) B 67(15.6) A<br />
Eragrostis sp. 23(21.3) B 22 (31.4) B 108(25.2) B<br />
Gandhiro* 0 6 (8.6) A 21 (4.9) A<br />
Echinoctoa sp. 15(13.9) A 4 (5.7) A 29 (6.7) A<br />
Cenchrus sp. 8 (7.4) A 16(22.9) B 85(19.9) A<br />
Dactyloctenium<br />
aegyptium<br />
13(12.0) A 4 (5.7) A 20 (4.7) A<br />
Tetrapogan tenellus 5 (4.6) A 3 (4.3) A 16(3.7) A<br />
Dichanthium annulatum 4 (3.7) A 11 (15.7) A 45(10.5) A<br />
Species<br />
• Frequency is given in parenthesis, * Unidentified.<br />
Table 9: Frequency Occurrence / Distribution Pattern <strong>of</strong> Plant Species in Ploughed and<br />
Unploughed Area <strong>of</strong> Dhordo <strong>Restoration</strong> Site<br />
Un ploughed (n =258) Ploughed(n =170)<br />
N % Frequency Distribution<br />
class<br />
N %<br />
Frequency<br />
Cyperus rotundus 166 64.3 D 149 87.6 E<br />
Chloris barbata 50 19.4 A 48 28.2 B<br />
Sporobolus sp. 90 34.9 B 65 38.4 B<br />
Setaria sp. 48 18.6 A 23 13.5 A<br />
Cressa erotica 149 57.7 C 110 64.7 D<br />
Aeluropus logopoides 35 13.6 A 32 18.8 A<br />
Eragrostis sp. 81 31.4 B 27 15.9 A<br />
Gandhiro* 15 4.8 A 6 3.5 A<br />
Echinocloa sp. 17 6.6 A 12 7.1 A<br />
Cenchrus sp. 30 11.7 A 55 32.4 B<br />
Dactyloctenium aegyptium 16 6.2 A 4 2.4 A<br />
Tetrapogan tenellus 10 3.9 A 6 3.5 A<br />
Dichanthium annulatum 27 10.5 A 18 10.6 A<br />
Distribution<br />
class<br />
Unidentified
Species<br />
Table 10: Frequency Occurrence / Distribution Pattern <strong>of</strong> Plant Species in<br />
Unprotected and Prosopis juli flora Infested Areas <strong>of</strong> Dhordo<br />
A>B>C=D>E in the unploughed area while (class<br />
A-8, B-3, C-0, D-1 and E-1) it was A>B>CCE in the unprotected area (site B) while<br />
(class A-6, B-3, C-0, D-0 and E-0) it was<br />
A>B>C=D=E in Prosopis juliflora infested areas.<br />
5.3.2. Species Distribution Pattern at<br />
Bhirandiyara<br />
The percentage frequency <strong>of</strong> various plant species<br />
indicated that Cyperus haspan (81.5 per cent) and<br />
Cressa cretica fall under class E and thus showed<br />
a more uniform distribution while Aeluropus<br />
logopoides and Scirpus sp. exercised a random<br />
distribution (class B). The rest <strong>of</strong> the species fall<br />
under class A and thereby showed aggregation in<br />
nature. Looking at the variation in the distribution<br />
Unprotected Area Prosopis juli flora Infested Area<br />
N Frequency Distribution<br />
Class<br />
<strong>Ecorestoration</strong> <strong>of</strong><br />
<strong>Banni</strong> <strong>Grassland</strong><br />
N Frequency Distribution<br />
Class<br />
Cyperus rotundus 34 70.8 D 15 38.5 B<br />
Chloris barbata 20 41.7 C 14 35.9 B<br />
Sporobolus sp. 10 20.8 B 3 7.7 A<br />
Setaria sp. 0 0.0 4 10.3 A<br />
Cressa cretica 36 75.0 D 14 35.9 B<br />
Aeluropus logopoides 19 39.6 B 5 12.8 A<br />
Eragrostis sp. 6 12.5 A 7 17.9 A<br />
Gandhiro 0 0.0 - 4 10.3 A<br />
Echinocloa sp. 0 0.0 - 1 2.6 A<br />
Cenchrus sp. 0 0.0 - 0 0.0 -<br />
Dactyloctenium aegyptium 0 0.0 - 0 0.0 -<br />
Tetrapogan tenellus 0 0.0 - 0 0.0 -<br />
Dichanthium annulatum 1 2.1 A 0 0.0 -<br />
pattern between October and December, species<br />
like Cyperus haspan and Scirpus sp. showed a<br />
reverse trend. The former had shifted from E to D<br />
and the latter from C to A. Thus the distribution <strong>of</strong><br />
the latter was very much narrowed during the course<br />
<strong>of</strong> the post monsoon while Cressa cretica is the<br />
only species which showed a positive trend from<br />
high random (class C) to high uniform (class E)<br />
distribution.<br />
The species such as Cenchrus sp., Eragrostis sp.<br />
and Dichanthium annulatum were totally absent<br />
during the initiation <strong>of</strong> the study (October).<br />
However, they appeared in the restoration site<br />
during the course <strong>of</strong> post monsoon while<br />
Sporobolus sp. and Echinocloa sp., showed no<br />
changes in their distribution pattern during the<br />
study period (Table 11). The frequency relationship<br />
showed that, (class A-3, B-0, C-1.D-0 and E-1)<br />
A>BDB>C
<strong>Ecorestoration</strong> <strong>of</strong><br />
<strong>Banni</strong> <strong>Grassland</strong><br />
Species October<br />
(n = 40)<br />
34<br />
Table 11: Frequency and Relative Frequency <strong>of</strong> Species in Bhirandiyara<br />
% Frequency /<br />
Distribution<br />
Class<br />
December<br />
(n = 40)<br />
% Frequency/ Overall Average<br />
Distribution<br />
class N=200 % Frequency /<br />
Distribution Class<br />
C. haspan 36 90.0 / E 27 67.5 / D 163 81.5/E<br />
Sporobolus sp. 4 10.0 /A 6 15.0/A 34 17.0/A<br />
Cressa sp. 24 60.0 / C 39 97.5 / E 164 82.0 / E<br />
Aeluropus sp. 6 15.0/A 12 30.0 / B 62 31.0/B<br />
Eragrostis sp. 0 0.0 1 2.5 /A 1 0.5/A<br />
Echinocloa sp. 4 10.0/A 6 15.0/A 27 13.5/A<br />
Cenchrus sp. 0 0.0 1 2.5/A 3 1.5/A<br />
Dichanthium sp. 0 0.0 0 0.0 3 1.5/A<br />
Scirpus sp. 18 45.0 / C 8 20.0 / A 55 22.5 / B<br />
Species<br />
in all the three categories <strong>of</strong> slopes and unploughed<br />
area, while it showed aggregation in other areas.<br />
Sporobolus sp. aggregations were found in all the<br />
amendments and outside except in vertical slopes<br />
where it showed class B while Cenchrus sp. showed<br />
aggregation in all the slopes (Table 12).<br />
The frequency relationship established for<br />
unploughed area was (class A-2, B-2, C-0, D-0 and<br />
E-2) A=B>C=DB>C=DB>CE in narrow<br />
vertical slopes and (class A-3, B-1, C-1, D-2 and E-<br />
0) A>B=CE in narrow horizontal slopes. The<br />
former three amendments highlight higher values<br />
<strong>of</strong> E than D while the latter two amendments showed<br />
a reverse trend, lower E value than D. The unprotected<br />
area showed (class A-2, B-0, C-0, D-0 and E-<br />
2) A>B=C=D
S. No Species<br />
5.4 SPECIES DOMINANCE<br />
The species, which exert major controlling influence<br />
on the community by virtue <strong>of</strong> their size, numbers,<br />
production are called dominant. Simpson (1949) has<br />
devised a formula for estimating the Index <strong>of</strong><br />
Dominance (C = E (ni / N) 2 ) based on the biomass<br />
value <strong>of</strong> species, that highlights the importance <strong>of</strong><br />
each species in relation to the community as a whole.<br />
5.4.1 Species Dominance at Dhordo<br />
Table 13: Dominance Index <strong>of</strong> Plant Species at Dhordo<br />
<strong>Restoration</strong> Site<br />
Unploughed Ploughed<br />
Area<br />
1 Cyperus rotundus 0.004 0.01 0.08 0.05<br />
Sporobolus sp. forms the dominant species in both<br />
ploughed and unploughed areas <strong>of</strong> the Dhordo<br />
restoration site while at site B and C, Cyperus<br />
rotundus was the dominant. The dominance index<br />
<strong>of</strong> seven species; Cyperus rotundus, Chloris<br />
barbata, Aeluropus logopoides, Gandhiro,<br />
Echinocloa sp., Cenchrus sp. and Tetrapogan<br />
tenellus was comparatively higher in the ploughed<br />
<strong>Ecorestoration</strong> <strong>of</strong><br />
<strong>Banni</strong> <strong>Grassland</strong><br />
Unprotected Area Prosopis juliflora<br />
2 Chloris barbata 0.006 0.04 0.03 0.04<br />
3 Sporobolus sp. 0.114 0.07 0.02 0.001<br />
4 Setaria sp. 0.006 0.003 0.004 0.02<br />
5 Aeluropus logopoides 0.001 0.002 0.05 0.02<br />
6 Eragrostis sp. 0.008 0.002 0.003 0.02<br />
7 Gandhiro* 0.001 0.0007 0.0004 0.01<br />
8 Echinocloa sp. 0.002 0.0009 0.0003 0<br />
9 Cenchrus sp. 0.009 0.02 0 0.00002<br />
10 Dactyloctenium aegyptium 0.0002 0.0001 0 0.000985<br />
11 Tetrapogan tenellus 0.0002 0.0003 0 0.00013<br />
12 Dichanthium annulatum 0.013 0.005 0.002 0.00001<br />
Unidentified<br />
area than the unploughed area. At site B, Aeluropus<br />
logopoides forms the second dominant and was<br />
followed by Chloris barbata and Sporobolus sp.<br />
At site C, the second dominant species was Chloris<br />
barbata while Sporobolus sp. and Cenchrus sp.<br />
forms the less and least dominant’ species<br />
respectively (Table 13).<br />
5.4.2 Species Dominance at Bhirandiyara<br />
Table 14: Dominance Index <strong>of</strong> Plant Species at Bhirandiyara<br />
S. No Species Unploughed Ploughed Slope<br />
Broad<br />
In Bhirandiyara, Cyperus haspan forms the<br />
dominant species in all the amendments and<br />
unprotected area except in narrow vertical slopes<br />
where Aeluropus logopoides exerted domination.<br />
Sporobolus sp. was found to be second dominant<br />
in ploughed and broad slopes whereas it was third<br />
dominant in narrow vertical and horizontal slopes<br />
(Table 14). Cenchrus sp. was least dominant in<br />
unploughed and narrow horizontal slopes but,<br />
totally absent in ploughed and unprotected area.<br />
Slope<br />
Vertical<br />
Slope<br />
Horizontal<br />
Outside<br />
1 Cyperus haspan 0.38 0.5 0.49 0.08 0.38 0.97<br />
2 Sporobolus sp. 0.005 0.01 0.008 0.05 0.007 0<br />
3 Aeluropus logopoides 0.038 0.004 0.008 0.14 0.04 0.0001<br />
4 Echinocloa sp. 0.003 0.0005 0.0001 0.002 0.0006 0<br />
5 Cenchrus sp. 0.0006 0 0.003 0.004 0.0004 0<br />
6 Scirpus sp. 0.001 0.007 0.003 0.0002 0.003 1.93E-06<br />
35
<strong>Ecorestoration</strong> <strong>of</strong><br />
<strong>Banni</strong> <strong>Grassland</strong><br />
5.5 SPECIES ASSOCIATION<br />
In a community <strong>of</strong> plants several species grow near<br />
each other. Interspecific association between two<br />
species was evaluated through association index.<br />
The association index estimated for different species<br />
was broadly classified into four classes; low (0<br />
- 0.25), moderate (0.26 - 0.50), high (0.51 - 0.75) and<br />
very high (above 0.76) associations.<br />
At Dhordo, totally six important species; Cyperus<br />
rotundas, Sporobolus sp., Aeluropus logopoides,<br />
Dichanthium annulatum, Cenchrus sp. and Cressa<br />
cretica were selected for evaluating the association<br />
index. Of which, Cyperus rotundus showed a<br />
higher association with Cressa cretica and<br />
moderate association with Sporobolus sp. and low<br />
association with all other species. Sporobolus sp.<br />
exercised very high association with Cyperus<br />
36<br />
Table 15: Association Index <strong>of</strong> Dhordo <strong>Restoration</strong> Site<br />
Species Association Index Species Association Index Species Association Index<br />
Cyperus – Cressa 0.54 Cressa - Cyperus 0.65 Cenchrus - Cyperus 0.66<br />
Cyperus – Sporobolus 0.34 Cressa - Sporobolus 0.37 Cenchrus - Cressa 0.52<br />
Cyperus – Chloris 0.22 Cressa - Chloris 0.25 Cenchrus - Sporobolus 0.44<br />
Cyperus – Aeluropus 0.16 Cressa - Aeluropus 0.17 Cenchrus - Chloris 0.39<br />
Cyperus – Cenchrus 0.18 Cressa - Cenchrus 0.17 Cenchrus - Aeluropus 0.24<br />
Cyperus – Dichanthium 0.09 Cressa - Dichanthium 0.12 Cenchrus - Dichanthium 0.11<br />
Sporobolus – Cyperus 0.92 Dichanthium - Cressa 0.67 Chloris – Cyperus 0.70<br />
Sporobolus – Cressa<br />
0.84<br />
Dichanthium - Cyperus<br />
0.62 Chloris – Cressa 0.66<br />
Sporobolus – Chloris 0.36 Dichanthium - 0.60 Chloris – Sporobolus 0.41<br />
Sporobolus – Cenchrus 0.32 Dichanthium - Chloris 0.33 Chloris – Cenchrus 0.34<br />
0.30 Dichanthium - Cenchrus 0.20 Chloris – Aeluropus 0.27<br />
Sporobolus – Dichanthium 0.23 Dichanthium - Aeluropus 0.18 Chloris – Dichanthium 0.15<br />
Aeluropus – Cyperus<br />
Aeluropus – Cressa<br />
0.75<br />
0.66<br />
rotundus and Cressa cretica whereas Chloris<br />
barbata, Aeluropus logopoides, Cressa cretica and<br />
Cenchrus sp. also showed moderate association.<br />
Interestingly, except Chloris barbata, all these<br />
species have low association with Dichanthium<br />
annulatum. Apart from this, Dichanthium<br />
annulatum and Aeluropus logopoides exerted high<br />
association with Sporobolus sp. (Table 15).<br />
In Bhirandiyara, due to low species diversity, totally<br />
four common species were selected for evaluating<br />
the association index. These species includes;<br />
Cyperus haspan, Sporobolus sp., Cressa cretica<br />
and Aeluropus logopoides. Of which, Cyperus<br />
haspan and Cressa cretica showed low association<br />
whereas Sporobolus sp. reflects high association<br />
with all these species and Aeluropus<br />
logopoides exercised high association with Cyperus<br />
haspan and Cressa erotica (Table 16).<br />
Association Index Range<br />
Aeluropus – Sporobolus 0.52 Low 0-0.25<br />
Aeluropus – Chloris 0.39 Moderate 0.26-0.5.<br />
Aeluropus – Cenchrus 0.29 High 0.51-0.75<br />
Aeluropus – Dichanthium 0.11 Very High Above 0.76
Table 16: Association Index <strong>of</strong> Bhirandiyara <strong>Restoration</strong> Site<br />
<strong>Ecorestoration</strong> <strong>of</strong><br />
<strong>Banni</strong> <strong>Grassland</strong><br />
Species Association Index Species Association Index Species Association Index<br />
Cyperus – Cressa 0.24 Cressa - Cyperus 0.24 Sporobolus -Cressa 0.62<br />
Cyperus- Sporobolus 0.12 Cressa - Sporobolus 0.13 Sporobolus - Cyperus 0.59<br />
Cyperus- Aeluropus 0.19 Cressa - Aeluropus 0.20 Sporobolus - Aeluropus 0.53<br />
Aeluropus - Cyperus 0.52<br />
Aeluropus - Cressa 0.53<br />
Aeluropus - Sporobolus 0.29<br />
5.6 BIOMASS<br />
Association Index<br />
Along with the grassland restoration<br />
programme in the <strong>Banni</strong> area, GUIDE has<br />
also carried out a monitoring study on the<br />
biomass production <strong>of</strong> different grass species<br />
under restored and unprotected conditions.<br />
The results obtained during the<br />
course <strong>of</strong> this study are expected.<br />
to provide suitable strategies for bringing<br />
out the scope <strong>of</strong> sustainable utilisation <strong>of</strong><br />
<strong>Banni</strong> grassland resources. The results obtained<br />
from Dhordo and Bhirandiyara during the year 1996-<br />
1997 are summarised as below.<br />
5.6.1 Biomass Production in Dhordo site<br />
At Dhordo, data on biomass was collected from<br />
three sites; site A, site B and site C. It is presumed<br />
that, collection <strong>of</strong> biomass data on grass species at<br />
these three sites would help in evaluating the<br />
biomass generation under different situations, i.e.<br />
grassland restoration, grazing and shrub / tree cover<br />
<strong>of</strong> Prosopisjuli flora.<br />
During the month <strong>of</strong> September 1997 (mid<br />
monsoon), there was sufficient moisture availability<br />
and a concurrent reduction in surface soil salinity<br />
which favoured vegetative growth <strong>of</strong> grasses in<br />
many areas <strong>of</strong> <strong>Banni</strong>. The biomass obtained even<br />
during this month at site C was 43.8 and 81.7 per cent<br />
lower than site B and site A respectively (Table 17).<br />
Among the five sampling carried out between<br />
September and November 1997, maximum biomass<br />
obtained at site A, B and C was 3546.9 kg/ha in<br />
second fortnight <strong>of</strong> October (mid study period),<br />
618.3 kg/ha in September (beginning <strong>of</strong> study) and<br />
410 kg/ha during end <strong>of</strong> November (end <strong>of</strong> study)<br />
respectively (Figure 11).<br />
Very High above 0.76, High 0.51-0.75, Moderate 0.26 - 0.50, Low Up to<br />
0.25.<br />
During the study period, the biomass increased by<br />
73.3 per cent at site A and 17.9 per cent at site C<br />
whereas it decreased by 32.1 per cent at site B (Table<br />
17 and Figure 12).<br />
Further, Table 17 also revealed that, removal <strong>of</strong> grazing<br />
pressure (by trench fencing) and competition<br />
(uprooting <strong>of</strong> weed trees / shrubs) in the restoration<br />
site enabled the grass to grow more vigorously.<br />
The biomass data at the restoration site in the beginning<br />
(September 1997) and at the end <strong>of</strong> the study<br />
period (November 1997) highlights that, the production<br />
was 3 to 7.8 times higher than site B and 5.5<br />
to 8 times higher than site C respectively (Table<br />
17).<br />
5.6.1.1 Biomass under Different Soil<br />
Amendments at Site A<br />
It was also noted that, unploughed and ploughed<br />
area showed variation in the productivity <strong>of</strong> grass<br />
species. Interestingly, the biomass recorded was<br />
higher in the unploughed areas than in ploughed<br />
areas (Table 18 and Figure 13). However, the<br />
monthly increase in the productivity recorded was<br />
high in the ploughed area. Between September<br />
(1511.9 kg/ha) and November (2736.9 kg/ha) the<br />
biomass increased by 81 per cent in the ploughed<br />
area while it increased by 67 per cent (2177.8 to<br />
37
<strong>Ecorestoration</strong> <strong>of</strong><br />
<strong>Banni</strong> <strong>Grassland</strong><br />
38<br />
S.<br />
No<br />
Table 17: Biomass production (Kg / Ha) in and around Dhordo <strong>Restoration</strong> Site<br />
Site details Sep. '97 Oct. '97 Oct. '97 Nov. '97 Nov. '97 Between Sep. &<br />
Nov. (%+/-)<br />
1 <strong>Restoration</strong> Site<br />
(Site A)<br />
2 Unrestored Area<br />
(Site B)<br />
3 Prosopis Area<br />
(Site C)<br />
1899.3 3120.5 3546.9 2504.1 3291.5 73.3<br />
618.3 347.0 83.5 241.5 420.0 -32.1<br />
347.6 276.9 215.7 324.7 410.0 17.9<br />
Table 18: Biomass (Kg / Ha) in Dhordo (ploughed and unploughed) <strong>Restoration</strong> Site<br />
Months Dhordo <strong>Restoration</strong> Plot<br />
(ploughed)<br />
Dhordo <strong>Restoration</strong> Plot<br />
(unploughed)<br />
% Difference<br />
(Between ploughed<br />
and unploughed)<br />
September 1511.9 2177.8 44.0<br />
October 2764.4 3298.5 19.3'<br />
October 3590.4 3519.7 -1.9<br />
November 1965.3 2932.3 49.2<br />
November 2736.9 3639.8 32.9<br />
3639.8 kg/ha) in unploughed area.<br />
5.6.1.2 Productivity <strong>of</strong> Different Grass<br />
Species in Dhordo<br />
There was a considerable variation in the<br />
productivity <strong>of</strong> different grass species in<br />
the three sites <strong>of</strong> Dhordo. In total 12<br />
important as well as commonly available<br />
grass species (Cyperus rotundus, Chlohs<br />
barbata, Sporobolus sp., Setaria sp.,<br />
Aeluropus logopoides, Eragrostis sp.,<br />
Gandhiro, Echinocloa sp., Cenchrus sp.,<br />
Dactyloctenium aegyptium, Tetrapogan<br />
tenellus and Dichanthium annulatum)<br />
were selected for the analysis (Table 19<br />
and Figure 14). The total biomass<br />
estimated for these 12 species at three<br />
sites varied from 2505 kg/ha at site A,<br />
which decreased to 230.3 kg/ha at site B<br />
and 201.9 kg/ha at site C. The biomass<br />
recorded at site C was 12.3 per cent lesser<br />
than site B. The 12 species encompasses<br />
87.2 per cent <strong>of</strong> the biomass estimated at<br />
site A, 67.3 per cent at site B and 64.1 per<br />
cent at site C. The biomass <strong>of</strong> few highly<br />
palatable species such as Sporobolus sp.,
Cenchrus sp. and Dichanthium annulatum<br />
encompasses 31.7,11.1 and 10.3 per cent<br />
respectively at site A, whereas it decreased to 14.5,<br />
0.0 and 1.3 per cent respectively at site B and 3.6,<br />
0.004 and 0.3 per cent respectively at site C.<br />
Contrary to this, the biomass contribution <strong>of</strong><br />
species like Cyperus rotundus, Aeluropus<br />
logopoides and Chloris barbata which are<br />
comparatively less palatable at matured stage, was<br />
least at site A; 7.6, 3.8 and 11.2 per cent respectively<br />
while it was 27.9, 23.3 and 16.7 at site B and 21.6,<br />
12.2 and 19.2 at site C.<br />
A comparison <strong>of</strong> grass species between site A and<br />
B shows that except Aeluropus logopoides, which<br />
showed a lesser decrease (-44.1 per cent) at site B,<br />
all other species decreased significantly (66.2 to<br />
100 per cent). Three highly palatable grass species<br />
such as Cenchrus, Dactyloctenium aegyptium and<br />
Tetrapogan tenellus were totally absent at site B,<br />
while only Echinocloa sp. was absent at site C.<br />
S.<br />
No<br />
Table 19: Average Biomass (kg/ha) <strong>of</strong> Selected Species at Three Sites <strong>of</strong> Dhordo<br />
Species Dhordo<br />
<strong>Restoration</strong><br />
plot<br />
Degraded<br />
Area<br />
% Difference<br />
(<strong>Restoration</strong><br />
Plot and<br />
Degraded Area)<br />
Prosopis jull<br />
flora Area<br />
% Difference<br />
(<strong>Restoration</strong><br />
Plot and<br />
Prosopis<br />
Area)<br />
1 Cyperus sp. 189.7(7.6) 64.2 (27.9) -66.2 43.6(21.6) -77.0 -32.5<br />
2 Chloris barbata 280.4(11.2) 38.5(16.7) -86.3 38.8(19.2) -86.2 -0.8<br />
3 Sporobolus sp. 794.9(31.7) 33.4(14.5) -95.8 7.2 (3.6) -99.0 -78.4<br />
4 Setaria sp. 172.9 15.3 -91.2 27.4 -84.2 ,79.1<br />
5 Aeluropus sp. 95.9 (3.8) 53.6 (23.3) -44.1 24.7(12.2) -74.2 -53.9<br />
6 Eragrostis sp. 184.5 13.2 -92.8 29.0 -92.8 119.7<br />
7 Gandhiro 86.3 4.6 -94.7 21.3 -75.3 363.0<br />
8 Echinocloa sp. 95.2 4.2 -95.6 0 -100.0 -100.0<br />
9 Cenchrus sp. 277.4(11.1) 0 -100.0 0.91 (0.004) -99.7 100.0<br />
10 Dactyloctenium<br />
sp.<br />
31.1 0 -100.0 5.9 -81.0 100.0<br />
11 Tetrapogan sp. 39.6 0 -100.0 2.4 -93.9 100.0<br />
12 Dichanthium 257.1 (10.3) 2.9(1.3) -98.9 0.7 (0.3) -99.7 -75.9<br />
Total Biomass 583.8 53.9 -90.8 9.606 -91.9 -12.3<br />
* Percentage are given in parenthesis<br />
<strong>Ecorestoration</strong> <strong>of</strong><br />
<strong>Banni</strong> <strong>Grassland</strong><br />
Further, a comparison between site B and C showed<br />
that the biomass <strong>of</strong> grass species such as Gandhiro<br />
(363 per cent), Eragrostis sp. (119.7 per cent), and<br />
Setaria sp. (79.1 per cent) were found more at site C<br />
than at B. Among the decreasers (highly palatable)<br />
<strong>of</strong> site C, maximum decrease was recorded in<br />
Sporobolus sp. (78.4 per cent) and Dichanthium<br />
annulatum (75.9 per cent) (Table 19).<br />
Between September and November, total biomass<br />
<strong>of</strong> these selected 12 species showed an increase <strong>of</strong><br />
75.6 per cent at site A, whereas it decreased to 44.7<br />
per cent at site B and 40.1 per cent at site C (Table<br />
20). The comparison <strong>of</strong> biomass <strong>of</strong> grass species<br />
between September and November at site A shows<br />
that, except three species; Cyperus rotundus,<br />
Setaria sp. and Dactyloctenium aegyptium, all other<br />
species showed an increase. Among the species at<br />
site A, maximum increase was recorded on<br />
Sporobolus sp., which alone encompasses 22 per<br />
cent <strong>of</strong> the biomass in September to 36 per cent in<br />
% Difference<br />
(Degraded Area<br />
and Prosopis<br />
Area)<br />
39
<strong>Ecorestoration</strong> <strong>of</strong><br />
<strong>Banni</strong> <strong>Grassland</strong><br />
s.<br />
No<br />
November and is followed by Cenchrus sp. (4.8 in<br />
September to 12.9 per cent in November) and<br />
Chloris barbata (5.9 in September to 9.8 per cent in<br />
November). These three species alone endowed<br />
nearly 32.7 per cent biomass in September, which<br />
increased to 58.8 per cent in November (Table 20).<br />
Though, Dichanthium annulatum recorded 37.5 per<br />
cent increase during the study period, its biomass<br />
contribution for the month <strong>of</strong> September was 8.2<br />
per cent which, decreased to 6.5 per cent in<br />
November. Further, the biomass production <strong>of</strong><br />
Dichanthium annulatum was found far lower than<br />
Sporobolus sp., which was 62.6 per cent lower in<br />
September and 82.1 per cent in November.<br />
At site B, except Eragrostis sp. and Aeluropus<br />
40<br />
Table 20: Biomass (kg/ha) Productivity <strong>of</strong> Different Species at Three sites <strong>of</strong> Dhordo<br />
Species<br />
1 CYPERUS SP. 250.0<br />
(15.2)<br />
Dhordo <strong>Restoration</strong> Site Degraded Area Prosopis juli flora Area<br />
Sep NOV %+/- SEP NOV %+/- SEP NOV %+/-<br />
188.9<br />
(6.5)<br />
2 C/I/ORIS BARBATA 97.8 (5.9) 283.0<br />
(9.8)<br />
3 SPOROBOLUS SP. 363.2<br />
(22.0)<br />
4 SETARIA SP. 225.0<br />
(13.7)<br />
1043.0<br />
(36.1)<br />
88.8<br />
(3.1)<br />
5 AELUROPUS SP. 22.1 (1.3) 192.6<br />
(6.7)<br />
6 ERAGROSTIS SP. 243.0<br />
(14.7)<br />
250.6<br />
(8.7)<br />
7 GANDHIRO 8.7 (0.5) 72.8<br />
(2.5)<br />
8 ECHINOCLOA SP. 54.5 (3.3) 174.0<br />
(6.0)<br />
9 CENCHRUS SP. 79.3 (4.8) 373.7<br />
(12.9)<br />
10 DACTYLOCTENIUM<br />
SP.<br />
-24.4 162.4<br />
(32.8)<br />
189.4 60.9<br />
(12.3)<br />
187.2 79.2<br />
(15.9)<br />
-60.5 76.2<br />
(15.4)<br />
771.1 88.8<br />
(17.9)<br />
8.1 1.6<br />
(0.3)<br />
27.0 -83.4 59.2<br />
(19.9)<br />
52.5<br />
(19.0)<br />
48.0<br />
(17.5)<br />
-13.8 32.6<br />
(10.9)<br />
62.0<br />
(34.8)<br />
40.67<br />
(22.8)<br />
4.7<br />
24.8<br />
-39.4 0.0 0.0 0.0<br />
0.0 -100.0 80.48<br />
(27.1)<br />
128.5<br />
(46.9)<br />
18.0<br />
(6.6)<br />
44.7 35.9<br />
(12.1)<br />
1025.0 36.4<br />
(12.2)<br />
736.8 22.8 0 0.0 ~ 18.4<br />
(6.2)<br />
12.0<br />
(6.7)<br />
24.7<br />
(13.9)<br />
38.7<br />
(21.7)<br />
-85.1<br />
-31.2<br />
6.3<br />
0.0 -100.0<br />
219.3 0.0 0.0 0.0 0.0 0.0 0.0<br />
371.2 0.0 0.0 0.0 4.6 0 0.0 -100.0<br />
135.7 (8.2) 2.0 0 -88.5 0.0 0.0 0.0 29.6 0 0.0 -100.0<br />
11 TETRAPOGAN SP. 32.5 36.9 13.5 0.0 0.0 0.0 0.0 0.0 0.0<br />
12 DICHANTHIUM SP. 135.9 (8.2) 186.8<br />
(6.5)<br />
37.5 3.4<br />
(0.7)<br />
0.0 ~ 0.0 0.0 0.0<br />
TOTAL BIOMASS 287.7 217.2 75.6 2.7 11.4.0 -44.7 0.0 17 -40.1<br />
AVERAGE 70.6 83.8 62.5 90.0 62.3 65.1<br />
percentage are given in parenthesis<br />
logopoides all other species showed a decrease,<br />
while at site C except Chloris barbata, Cyperus<br />
rotundas and Eragrostis sp. all other species<br />
showed increasing trend. At site B, the Aeluropus<br />
logopoides showed an increase <strong>of</strong> 44.7 per cent<br />
during the study period, and contributed 17.8 per<br />
cent <strong>of</strong> biomass in September, which further<br />
increased to 46.9 per cent in November. The<br />
biomass <strong>of</strong> highly palatable species such as<br />
Dichanthium annulatum, Gandhiro was totally<br />
grazed out and Sporobolus sp. was much reduced<br />
at site B and C.<br />
The comparison <strong>of</strong> biomass <strong>of</strong> different species<br />
between September and November showed that<br />
the productivity <strong>of</strong> species such as Cenchrus sp.,
Chloris barbata, Echinocloa sp., and<br />
Dichanthium annulatum increased tremendously<br />
in the ploughed area than the unploughed area<br />
(Table 21 and Figure 15).<br />
The increase in productivity <strong>of</strong> these species was;<br />
221 and 692 per cent for Cenchrus sp., 96 and 149<br />
per cent for Chloris barbata, 26.5 and 442 per cent<br />
for Echinocloa sp. and 23 and 60 per cent for<br />
Dichanthium annulatum. Contrary to this, increase<br />
in Sporobolus productivity was higher in<br />
unploughed area (216 per cent) than in ploughed<br />
area (104 percent). Table 21: Productivity (kg /<br />
<strong>Ecorestoration</strong> <strong>of</strong><br />
<strong>Banni</strong> <strong>Grassland</strong><br />
Table 21: Productivity (kg / ha) <strong>of</strong> Few Grass Species at Dhordo (under various amendments)<br />
S. No Species<br />
ha) <strong>of</strong> Few Grass Species at Dhordo (under<br />
various amendments)<br />
5.6.2 Biomass Productivity at Bhirandiyara<br />
Site<br />
The biomass in the restoration site gradually<br />
increased from October to December; 1115.9<br />
kg/ha in October to 2228.7 kg/ha in December<br />
(Figure 16) and thus, showed an increase <strong>of</strong><br />
99.7 per cent whereas it decreased to 31.5 per<br />
cent in the unprotected area (Table 22). Among<br />
the five sub-compartments (unploughed, ploughed,<br />
broad slope -0.3m height x 5m wide, narrow vertical<br />
slope-0.5m height x 3m wide and narrow horizontal<br />
slope - 0.5m height x 3m wide) <strong>of</strong> the restoration<br />
site, narrow slopes showed a maximum increase <strong>of</strong><br />
biomass between October and December; 279.6 per<br />
cent in vertical slopes and 171.9 per cent in<br />
horizontal slopes. This was followed by<br />
unploughed area (112.8 per cent), broad slopes (42.9<br />
per cent) and ploughed area (25.9 per cent). This<br />
indicating clearly that the recovery <strong>of</strong> saline area in<br />
narrow steep slopes was faster. The biomass<br />
Unploughed Ploughed<br />
% Difference<br />
Sep nov<br />
Sep nov<br />
% Difference<br />
1 Cyperus sp. 242.1 211.7 -12.6 261.1 152.7 -41.5<br />
2 Chloris barbata 109.2 213.8 95.8 81.9 215.9 149.0<br />
3 Sporobolus sp. 424.7 1341.9 216.0 277.8 567.1 104.1<br />
4 Setaria sp. 321.6 85.9 -73.3 90.8 93.5 2.9<br />
5 Aeluropus sp. 26.1 244.2 835.6 16.6 110.7 566.9<br />
6 Eragrostis sp. 333.3 352.4 5.7 117.5 88.6 -24.6<br />
7 Gandhiro 0.0 74.8 100.0 20.8 69.6 234.6<br />
8 Echinocloa sp. 86.9 109.9 26.5 51.0 276.2 441.6<br />
9 Cenchrus sp. 90.1 289.0 220.7 64.2 508.7 692.4<br />
10 Dactyloctenium sp. 153.5 3.3 -97.8 111.0 0.0 -100<br />
11 Tetrapogan sp. 19.8 50.4 154.5 50.2 15.3 -69.5<br />
12 Dichanthium sp. 130.1 159.6 22.7 144.0 230.2 59.9<br />
Total Biomass 1937.4 3136.9 61.9 1286.9 2328.5 80.9<br />
41
<strong>Ecorestoration</strong> <strong>of</strong><br />
<strong>Banni</strong> <strong>Grassland</strong><br />
estimated (all grass species) within the restoration<br />
site was maximum in the unploughed area in all the<br />
months except during the first fortnight <strong>of</strong> December<br />
than the ploughed area. Among the slopes, the<br />
broad slopes with a width <strong>of</strong> 5m had more biomass<br />
production except during the end <strong>of</strong> December than<br />
in narrow vertical slopes <strong>of</strong> 3m width. The biomass<br />
<strong>of</strong> the narrow horizontal slopes was found slightly<br />
higher than the narrow vertical slopes during the<br />
first fortnight <strong>of</strong> November and December while in<br />
other months it showed low biomass than the<br />
vertical slopes (Table 22).<br />
A comparison <strong>of</strong> biomass productivity <strong>of</strong><br />
unprotected and unploughed protected area <strong>of</strong><br />
restoration site during the study period shows that<br />
the biomass <strong>of</strong> outside area was comparatively less<br />
than the unploughed area <strong>of</strong> restoration site<br />
(Figure 17), indicating thereby that to grazing<br />
pressure existed in the unrestored area.<br />
42<br />
Table 22: Biomass (Kg / Ha) Production at Bhirandiyara (all species)<br />
Site Details Oct. 97 Nov. Nov. Dec. Dec.97 % +/- (Oct to Dec)<br />
Unploughed 1898.8(34.0) 1353.0 2211.0 2290.0 4040.6 (43.0) 112.8<br />
Ploughed 1343.1 (24.1) 1248.5 1750.0 2355.0 1692.0(18.2) 25.9<br />
Slope Broad 1155.6(9.2) 1249.5 1713.0 845.0 1644.0(17.5) 42.3<br />
Slope Vertical 514.2(11.9) 786.3 1149.5 752.0 1951.5(20.8) 279.6<br />
Slope Horizontal 667.65 916.0 853.2 1625.0 1815.5(19.3) 171.9<br />
Total 5579.3 5553.3 7676.7 7867 9387.6 68.3<br />
Average Biomass in<br />
<strong>Restoration</strong> Site<br />
From Table 23 and 24 it was clear that Cyperus<br />
haspan made a major contribution to the<br />
biomass <strong>of</strong> the area, which was 41.6 per cent<br />
<strong>of</strong> the productivity <strong>of</strong> restoration site and 82.6<br />
per cent <strong>of</strong> the unprotected area. Grass species<br />
such as Sporobolus sp., Cenchrus sp.,<br />
Aeluropus logopoides, Dichanthium<br />
annulatum etc., sown in the area were capable<br />
<strong>of</strong> growing even under low moisture<br />
availability whereas Cyperus haspan - a water<br />
loving species requires high moisture for its<br />
survival and growth. Therefore, it was<br />
presumed that there will be a change in the<br />
contribution <strong>of</strong> C. haspan in various amendment<br />
areas during the course <strong>of</strong> the post monsoon i.e.<br />
from October to December. To confirm the above<br />
and to understand the recovery process <strong>of</strong> different<br />
sub-compartments <strong>of</strong> the restoration site, biomass<br />
was analysed with and without the contribution <strong>of</strong><br />
Cyperus haspan.<br />
During the month <strong>of</strong> October, Cyperus haspan<br />
constituted <strong>of</strong> more than 67.8 per cent <strong>of</strong> biomass<br />
<strong>of</strong> the restoration site, which in the month <strong>of</strong><br />
December decreased to 34.9 per cent (Table 24).<br />
Further, Cyperus haspan was found<br />
almost equal in ploughed (49.8 per cent) and<br />
unploughed areas (46.7 per cent) <strong>of</strong> the restoration<br />
site (Table 23). However, it decreased to 43.7 per<br />
cent in the broader slopes and 38.4 per cent in narrow<br />
horizontal slopes and very low contribution <strong>of</strong> 17.5<br />
per cent was recorded in narrow vertical slopes.<br />
The amount <strong>of</strong> recovery could be clearly visualised<br />
1349.85 2221.32 3070.68 3146.8 2236.76 -<br />
Outside 0.00 1749.50 787.50 2635.00 1198.50 *-31.5<br />
*data on November and December was compared, Percentage are given in parenthesis
Table 23: Percentage Contribution <strong>of</strong> Cyperus haspan in Sub-Compartments <strong>of</strong> Bhirandiyara <strong>Restoration</strong><br />
Site<br />
Site Details All species<br />
(Including C. haspan}<br />
<strong>Ecorestoration</strong> <strong>of</strong><br />
<strong>Banni</strong> <strong>Grassland</strong><br />
Excluding C.haspan % Contribution <strong>of</strong> C.haspan<br />
Unploughed 2358.7 471.74 46.7<br />
Ploughed 1677.7 335.54 49.8<br />
Slope Broad 1321.4 264.28 43.7<br />
Slope Vertical 1030.7 206.14 17.5<br />
Slope Horizontal 1175.5 235.1 38.4<br />
Overall 1512.8 883.5 41.6<br />
Outside 1274.1 254.82 82.6<br />
Table 24: Biomass Production at Bhirandiyara Different Months % availability <strong>of</strong> Cyperus haspan in<br />
Site Details Oct. 97 %<strong>of</strong> C.<br />
haspan<br />
Nov.97 Nov. 97 Dec. 97 Dec.97 %<strong>of</strong> C.<br />
haspan<br />
% +/- (Oct<br />
to Dec)<br />
Unploughed 474.63 75.0 1176.00 1366.50 1070.00 2197.00 45.6 164.8<br />
Ploughed 513.55 61.8 689.50 747.33 1410.00 844.50 50.1 64.4<br />
Slope Broad 286.17 75.2 583.50 830.00 693.33 1325.50 19.4 363.2<br />
Slope Vertical 232.07 54.9 598.86 1064.50 642.67 1708.00 12.5 635.9<br />
Slope Horizontal 289.55 56.6 530.50 812.74 800.00 1185.00 34.7 309.3<br />
% <strong>of</strong> C. haspan 1795.9 67.8 7260.0 34.9 304.3<br />
Outside 0.00 290.50 223.43 290.00 300.57 -23.5*<br />
by comparing the occurrence <strong>of</strong> Cyperus haspan<br />
in various sub-compartments between October and<br />
December. The contribution <strong>of</strong> Cyperus haspan<br />
decreased from 75 per cent in October to 45.6 per<br />
cent in December in the unploughed area while in<br />
the unprotected area it decreased from 83.4 to 74.9<br />
*data <strong>of</strong> November and December was compared<br />
per cent. A comparison <strong>of</strong> data during the same<br />
period in other sub-compartments showed that the<br />
percentage contribution <strong>of</strong> Cyperus haspan<br />
changed from 61.8 to 50.1 at ploughed area, 75.2 to<br />
19.4 at broad slopes, 54.9 to 12.5 at narrow vertical<br />
slopes and 56.6 to 34.7 at narrow horizontal slopes<br />
(Table 24).<br />
% are given in parenthesis Increase<br />
in other grass species<br />
(excluding Cyperus haspan)<br />
was recorded maximum at narrow<br />
vertical slopes (635.9 per<br />
cent), followed by broad slopes<br />
(363.2 per cent), narrow horizontal<br />
slopes (309.3 per cent),<br />
unploughed (164.8 per cent) and<br />
ploughed areas (64.4). In contrast<br />
to this, the outside area<br />
showed a decrease <strong>of</strong> 23.5 per<br />
cent.<br />
43
<strong>Ecorestoration</strong> <strong>of</strong><br />
<strong>Banni</strong> <strong>Grassland</strong><br />
5.6.2.1 Biomass <strong>of</strong> Different Grass Species<br />
Apart from Cyperus haspan, the biomass <strong>of</strong> six<br />
common grass species <strong>of</strong> the site (Sporobolus sp.,<br />
Aeluropus logopoides, Echinocloa sp., Cenchrus<br />
sp., and Scirpus so.) was analysed. Excluding<br />
Cyperus haspan, the biomass contribution <strong>of</strong> other<br />
five species varied from 67.5 per cent <strong>of</strong> the mean<br />
biomass production <strong>of</strong> vertical slopes to 35.2 per<br />
44<br />
Table 25: Average Total Biomass (kg/Ha) Recorded for Few Species at Bhirandiyara<br />
Species Unploughed Ploughed Slopes Broad Slopes Vertical Slopes<br />
Horizontal<br />
Table 26: Average Biomass in Five Sub-Compartments at Bhirandiyara<br />
Species Unploughed Ploughed Slope Broad Slope Vertical<br />
Slope<br />
Horizontal ,'<br />
Sporobolus sp. 137.0 (22.7) 147.1 (24.4) 77.6(12.9) 175.1 (29.1) 65.6(10.9) 502.4<br />
Aeluropus sp. 372.9 (38.0) 79.4(8.1) 76.5 (7.8) 298.7 (30.4) 153.7 (15.7) 881.2<br />
Echinocloa sp. 103.1 (52.3) 27.9(14.2) 9.7 (4.9) 38.0(19.3) 18.3(9.3) 97<br />
Cenchrus sp. 46.0 (28.9) 0.0 46.3(29.1) 52.4 (32.9) 14.4(9.1) 42<br />
Outside<br />
C. haspan 1172.6(61.9) 874.1 (70.9) 619.5(70.3) 220.5 (27.7) 472.2(61.5) 1066.3 (98.8)<br />
Sporobolus sp. 137.0 (7.2) 147.1 (11.9) 77.6 (8.8) 175.1 (22.0) 65.6 (8.5) 0.0<br />
Aeluropus sp. 372.9 (19.7) 79.4 (6.4) 76.5 (8.7) 298.7 (37.6) 153.7 (20.0) 11.7(1.2)<br />
Echinocloa sp. 103.1 (5.4) 27.9 (2.3) 9.7(1.1) 38.0 (4.8) 18.3 (2.4) 0.0<br />
Cenchrus sp. 46.0 (2.4) 0.0 46.3 (5.3) 52.4 (6.6) 14.4(1.9) 0.0<br />
Scirpus sp. 63.5 (3.4) 105.1 (8.5) 52.0 (5.9) 9.9(1.2) 43.7 (5.7) 1.5<br />
Overall 1795.1 122.2 781.5 694.7 667.9 12<br />
Excluding C. haspan<br />
Sporobolus sp. 137.0 (18.9) 147.1 (40.9) 77.6 (29.6) 175.1 (30.5) 65.6 (22.2) 0.0<br />
Aeluropus sp. 372.9(51.6) 79.4 (22.1) 76.5 (29.2) 298.7 (52.0) 153.7(51.9) 11.7(88.6)<br />
Echinocloa sp. 103.1 (14.3) 27.9 (7.8) 9.7 (3.7) 38.0 (6.6) 18.3 (6.2) 0.0<br />
Cenchrus sp. 46.0 (6.4) 0.0 46.3 (17.7) 52.4(9.1) 14.4 (4.9) 0.0<br />
Scirpus sp. 63.5 (8.9) 105.1 (29.2) 52.0(19.8) 9.9(1.7) 43.7 (14.8) 1.5(11.4)<br />
Overall 2477.6 96 989.7 1177.6 901.6 (86.8)<br />
% contribution<br />
from Mean<br />
biomass<br />
57.5 42.7 35.2 67.5 40.8<br />
Scirpus sp. 63.5 (23.2) 105.1 (38.3) 52.0(18.9) 9.9 (3.6) 43.7(15.9) 174.3<br />
Total<br />
cent <strong>of</strong> broad slopes (Table 13). Among the five<br />
grass species, biomass <strong>of</strong> Aeluropus logopoides,<br />
a saline tolerant species was found maximum in all<br />
the sub-compartments except in ploughed and<br />
broad slope areas. Ploughing and addition <strong>of</strong><br />
farmyard manure favoured the growth <strong>of</strong><br />
Sporobolus sp., where it contributed 41 per cent <strong>of</strong><br />
the biomass amongst the five species. In the broad
Species<br />
C. haspan 1483.0<br />
Table 27: Biomass <strong>of</strong> Few Selected Species at Bhirandiyara<br />
Unploughed area Ploughed Area Outside Area<br />
<strong>Ecorestoration</strong> <strong>of</strong><br />
<strong>Banni</strong> <strong>Grassland</strong><br />
Oct. Dec. % +/- Oct. Dec. % +/- Oct. Dec. % +/-<br />
(85.5)<br />
Sporobolus sp. 44.0<br />
(2.5)<br />
Aeluropus sp. 68.1<br />
(3.9)<br />
1843.0<br />
(58.2)<br />
301.5<br />
(9.5)<br />
626.5<br />
(19.8)<br />
24.3 829.0<br />
(73.9)<br />
847.5<br />
(74.6)<br />
2.2 1459.0<br />
(100.0)<br />
935.5<br />
(99.6)<br />
585.2 69.3 (6.2) 68.5 -1.2 0.0 0.0, -<br />
-35.9<br />
819.9 47.8 (4.3) 99.0 (8.7) 107.1 0.0 3.5 (0.4) 100.0<br />
Echinocloa sp. 10.0 196.5 1865.0 45.8 0.0 -100.0 0.0 0.0 -<br />
Cenchrus sp. 0.0 230.0 100.0 0.0 0.0 - 0.0 0.0 -<br />
Scirpus sp. 129.0 26.0 -79.8 129.0 120.5 -6.6 0.0 0.0 -<br />
(11.5)<br />
(10.6)<br />
Overall 203.2 1059.2 86.2 206.8 200.2 -1.3 1359 3.1 -35.6<br />
Species<br />
C. haspan 905.0<br />
Broad Slope Vertical Slope Horizontal Slope<br />
Oct Dec % +/- Oct Dec % +/- Oct Dec % +/-<br />
(98.0)<br />
318.5<br />
(46.6)<br />
Sporobolus sp. 0.0 (0.0) 148.0<br />
Aeluropus sp. 12.4<br />
(1.3)<br />
(21.6)<br />
87.5<br />
(12.8)<br />
-64.8 340.0<br />
(75.1)<br />
243.5<br />
(16.2)<br />
100.0 0.0 (0.0) 645.0<br />
(42.9)<br />
605.6 21.5 (4.8) 393.5<br />
(26.2)<br />
-28.4 378.0<br />
(84.7)<br />
630.5<br />
(49.6)<br />
100.0 0.0 172.0<br />
(13.5)<br />
1730.2 19.6 (4.4) 439.5<br />
(34.6)<br />
Echinocloa sp. 5.7 0.0 -100.0 45.5 0.0 -100.0 26.8 28.5 6.3<br />
66.8<br />
100.0<br />
2142.3<br />
Cenchrus sp. 0.0 130.0 100.0 45.5 216.5 375.8 21.7 0.0 -100.0<br />
Scirpus sp. 168.0 19.5 -88.4 23.8 3.0 -87.4 147.0 6.5 -95.6<br />
slopes, both Sporobolus sp. and Aeluropus<br />
logopoides were found almost equal. In the<br />
unprotected (outside) area, (excluding Cyperus<br />
haspan) the dominance <strong>of</strong> Aeluropus logopoides<br />
was found to be maximum (88.6 per cent <strong>of</strong> the<br />
biomass).<br />
Amongst the five sub-compartments, contribution<br />
<strong>of</strong> Sporobolus sp. was maximum in the narrow<br />
vertical slopes (29.1 per cent) and was followed by<br />
unploughed (22.7 per cent) and ploughed (24.4 per<br />
cent) areas. Species like Aeluropus logopoides and<br />
Echinocloa sp. were dominant in unploughed area<br />
while Cenchrus sp. dominated (32.9 per cent) in the<br />
narrow vertical slopes and surprisingly this species<br />
was totally absent in the ploughed area. The species<br />
Scirpus sp. was more in the ploughed area (38.3 per<br />
cent) when compared to unploughed area (23.2 per<br />
cent).<br />
45
<strong>Ecorestoration</strong> <strong>of</strong><br />
<strong>Banni</strong> <strong>Grassland</strong><br />
Between October and December, amongst the six<br />
(including Cyperus haspan) selected species (Table<br />
27), except Scirpus sp. all other species showed an<br />
increase in the unploughed area. Sporobolus sp.<br />
was totally absent in the unprotected area while it<br />
showed an increasing trend in all the sub-compartments<br />
<strong>of</strong> the restoration site except in ploughed<br />
area, where it decreased slightly (1.2 per cent).<br />
Echinocloa sp. showed a decreasing trend in all<br />
the areas except in unploughed and horizontal slope<br />
<strong>of</strong> the restoration site and unprotected area where<br />
it was absent. The increase <strong>of</strong> Cyperus haspan<br />
during this period was high in narrow horizontal<br />
slopes (66.8 per cent) and was followed by<br />
unploughed (24.3 per cent) and ploughed (2.2 per<br />
cent) areas while it decreased tremendously in broad<br />
slopes (64.8 per cent), narrow vertical slopes (28.4<br />
per cent) and outside area (35.9 per cent).<br />
Aeluropus logopoides was the only species, which<br />
showed an increasing trend in all the sub-compartments<br />
<strong>of</strong> restoration site and outside area. The increase<br />
was high in horizontal slopes (2142.3 per<br />
cent), followed by vertical slope (1730.2 per cent),<br />
unploughed (819.9 per cent) and broad slopes (605.6<br />
per cent). Cenchrus sp. was another species, which<br />
showed an increasing trend in all the sub-compartments<br />
<strong>of</strong> the restoration site except in the ploughed<br />
area and unprotected area where it was totally absent.<br />
46<br />
Table 28: Percentage Contribution <strong>of</strong> Cressa cretica at Dhordo<br />
Details <strong>Restoration</strong> Site (A) Degraded Site (B) Prosopis Area (C) Total<br />
Biomass (kg/ha) 213.1 98.2 93.4 404.7<br />
Mean total Biomass (kg/ha) 2872.5 342.1 314.9 3529.5<br />
% Contribution <strong>of</strong> Cressa to the<br />
mean total Biomass<br />
Details Unploughed Ploughed Slope<br />
Broad<br />
5.7 BIOMASS OF HERBACEOUS SPECIES -<br />
Cressa cretica<br />
The herbaceous stratum <strong>of</strong> restoration site and<br />
surrounding area was dominated by Cressa cretica<br />
commonly known as o/’en. The species had a dense<br />
growth with an average height <strong>of</strong> 12 cm. It has<br />
ethnobotanical values such as; useful medicine for<br />
reducing cough, respiratory ailments and deworming<br />
agent for human as well as livestock<br />
(Indhrajee, 1998). This species also increases milk<br />
yield as well as the sweetness <strong>of</strong> milk. Buffalo<br />
generally prefers to feed on this herbaceous species.<br />
At Dhordo, percentage contribution <strong>of</strong> Cressa<br />
cretica to the mean biomass was very low in the<br />
restoration site (7.4 per cent) whereas it increased<br />
to 28.7 per cent at site B and 29.7 per cent at site C<br />
(Table 28). At Bhirandiyara restoration site, Cressa<br />
cretica contributed about 21.2 per cent <strong>of</strong> the<br />
biomass. Among the sub-compartments, the<br />
unploughed area had the lowest biomass<br />
contribution <strong>of</strong> Cressa cretica (4.4 per cent) and<br />
was followed by vertical slope (20.4). In the other<br />
sub-compartments, it contributed more than 25 per<br />
cent to the total biomass, with a maximum<br />
contribution <strong>of</strong> 34.7 per cent in horizontal slopes.<br />
In the unprotected area, it contributed about 15.2<br />
percentage <strong>of</strong> the biomass (Table 29).<br />
7.4 28.7 29.7 11.5<br />
Slope<br />
Vertical<br />
Slope<br />
Horizontal<br />
Total Outside<br />
Biomass 103.1 444.1 436.7 210.0 407.6 1601.5 193.4<br />
Mean Total Biomass<br />
(include C. haspan)<br />
% <strong>of</strong> Cressa to Mean<br />
Total Biomass<br />
Table 29: Percentage Contribution <strong>of</strong> Cressa cretica at Bhirandiyara<br />
2358.7 1677.7 1321.4 1030.7 1175.5 7564 1274.1<br />
4.4 26.5 33.0 20.4 34.7 21.2 15.2
5.8 SALINITY VS GRASS BIOMASS<br />
PRODUCTIVITY<br />
<strong>Ecorestoration</strong> <strong>of</strong><br />
<strong>Banni</strong> <strong>Grassland</strong><br />
47
<strong>Ecorestoration</strong> <strong>of</strong><br />
<strong>Banni</strong> <strong>Grassland</strong><br />
The variation in the productivity <strong>of</strong> different grass<br />
species under the same area lead to an assumption<br />
that, there were certain soil parameters, which may<br />
alter or govern the productivity <strong>of</strong> the species.<br />
Among many soil parameters, soil salinity was considered<br />
as a major factor. Many plants fail to grow<br />
in high saline areas because, various plant species<br />
have different level <strong>of</strong> salinity tolerance, and<br />
this may lead to changes in their productivity. Therefore,<br />
an analysis <strong>of</strong> soil factors with the productivity<br />
<strong>of</strong> different plant species was carried out to understand<br />
whether salinity has any effect on the<br />
plant production. Figures 18 to 28 clearly show that<br />
salinity has positive negative and neutral effects<br />
on the productivity <strong>of</strong> various species.<br />
At Dhordo restoration site, the distribution <strong>of</strong> all<br />
the selected species were restricted with in 2.5 EC<br />
48<br />
level whereas it increased up to 4 EC at Bhirandiyara<br />
site. The species such as Cyperus haspan,<br />
Cyperus sp., Dichanthium annulatum, Cenchrus<br />
sp., Chloris barbata, Sporobolus sp., and Scirpus<br />
sp., showed a declining trend with increasing<br />
salinity level. Interestingly, the distribution <strong>of</strong><br />
Dichanthium annulatum was restricted within EC<br />
level 1.0 while productivity Sporobolus sp., reached<br />
minimum at EC level 3.0. The productivity <strong>of</strong><br />
Aeluropus logopoides was not affected by salinity<br />
up to 2.5 EC (Figure 24) above which it showed a<br />
sharp decline (Figure 18). Cressa cretica is the only<br />
species, which showed no changes in the biomass<br />
productivity up to 4 EC level
6. DISCUSSION<br />
In <strong>Banni</strong>, animal husbandry plays a vital role in the<br />
economy <strong>of</strong> rural inhabitants and currently, the area<br />
supports 26,084 livestock population and provides<br />
livelihood to 10,949 human inhabitants <strong>of</strong> the area.<br />
<strong>Banni</strong> grassland also attracts over 2 lakhs <strong>of</strong><br />
immigrant livestock (sheep, goat, cattle and buffalo)<br />
during normal rainfall years. In addition to these,<br />
increase in the spread <strong>of</strong> Prosopis juliflora and<br />
saline area during the recent decades further<br />
intensified the degradation <strong>of</strong> grassland resources<br />
and thereby affects the life <strong>of</strong> the local people.<br />
To develop <strong>Banni</strong> as a self-sustained system, the<br />
Gujarat Ecology Commission has implemented<br />
restoration efforts in <strong>Banni</strong> area. Though, there are<br />
reports on the failure <strong>of</strong> artificial restoration <strong>of</strong><br />
degraded grasslands (Bronner 1990 and Westoby<br />
et al. 1989), GEC’s activities were fairly successful<br />
and recovery <strong>of</strong> the degraded and saline land could<br />
be clearly visualized from first year results. This<br />
includes higher species diversity, grass cover and<br />
biomass in the two restoration sites than the<br />
unprotected and Prosopis juliflora infested areas.<br />
The net above ground production estimated for<br />
nine USA grasslands by Sims and Singh (1971)<br />
ranged from 107 g/m 2 (1070 kg/ha) (ungrazed short<br />
prairie) to 512 g/m 2 (5120 kg/ha) (grazed tall grass<br />
prairie). The obtained biomass during the month <strong>of</strong><br />
November / December in high saline tract <strong>of</strong><br />
Bhirandiyara was 2 times and Dhordo was about 3<br />
times higher than the minimum biomass recorded<br />
by Sims and Singh (1971). Dense growth <strong>of</strong> grass<br />
cover developed in the restoration sites reduced<br />
the evaporation rate and thereby the surface soil<br />
salinity, which in turn reduced from 13 EC to less<br />
than 4 EC in the Bhirandiyara restoration site. This<br />
highlights the fact that, the productivity <strong>of</strong> any<br />
degraded and saline lands could be improved<br />
through proper management inputs.<br />
Higher availability <strong>of</strong> species and its biomass in<br />
the restoration site than the unprotected and<br />
Prosopis juliflora infested areas needs an explanation.<br />
Taking the protected and unprotected area<br />
into consideration, the barbed wire and trench fenc-<br />
<strong>Ecorestoration</strong> <strong>of</strong><br />
<strong>Banni</strong> <strong>Grassland</strong><br />
ing totally prevented livestock grazing in the former<br />
whereas grazing was prevalent in the latter. Grazing<br />
is complete and or partial removal <strong>of</strong> living or dead<br />
aboveground parts <strong>of</strong> plants (Hodgson 1979). The<br />
general effect <strong>of</strong> grazing is the reduction <strong>of</strong> perennial<br />
grasses, which are removed during the germination<br />
and recruitment stage. Overgrazing causes<br />
retrogression, moderate grazing decelerates the rate<br />
<strong>of</strong> succession whereas light grazing and complete<br />
protection accelerate the successional process<br />
(Penfound 1964).<br />
Apart from the climatic factors, and soil salinity,<br />
the grazing pressure would principally govern<br />
changes in grassland biomass <strong>of</strong> an area. Grazing<br />
influences competitive patterns, so that either<br />
preferentially grazed species lose competitive<br />
power to less grazed ones and subsequently<br />
decrease (Werger 1977, Walker 1987) or remain<br />
dominant in non grazed patches (McNaughton<br />
1979, Stuart-Hill and Tainton 1989). The first change<br />
was noticed in the unprotected areas where heavy<br />
livestock grazing recorded a noticeable reduction<br />
in palatable perennials like Sporobolus sp.,<br />
Dichanthium annulatum, Chloris barbata and<br />
complete absence <strong>of</strong> Cenchrus ciliaris. The latter<br />
was recorded mainly from the restoration sites<br />
where the above mentioned grass species recorded<br />
significant increase in biomass.<br />
Desert savannas are relatively less interactive as a<br />
result <strong>of</strong> low biomass (Khilmi 1962, Roberts 1987)<br />
and their dynamics are mainly event-driven<br />
(Westoby 1980). Changes in constraints, particularly<br />
rainfall, beyond the influence <strong>of</strong> the system<br />
cause stepwise, unpredictable changes in vegetation.<br />
It was believed that, nomadic livestock may<br />
have a comparatively little influence on the vegetation<br />
composition and production (Ellis and Swift<br />
1988) as most animals migrate in pursuit <strong>of</strong> water<br />
and fodder in dry season (Noy-Meir 1980) a condition<br />
common in <strong>Banni</strong> grassland. Natural events<br />
such as temporary droughts may change an area<br />
with perennials into one dominated by ephemeral,<br />
but grazing prevents renewed change from ephem-<br />
49
<strong>Ecorestoration</strong> <strong>of</strong><br />
<strong>Banni</strong> <strong>Grassland</strong><br />
eral to perennial vegetation when weather conditions<br />
change. The conclusion <strong>of</strong> Ellis and Swift<br />
(1988) that noma’dic herds cause no change in the<br />
vegetation may be true, their effect is rather to prevent<br />
change, locking the vegetation in a phase<br />
dominated by ephemeral. However, large continuous<br />
areas <strong>of</strong> such event-driven systems are kept in<br />
the same phase for a long time leading to exhaustion<br />
<strong>of</strong> seed sources, forming a further constraint<br />
on changes. Thus, herbivores act as a major instrument<br />
in modifying the grasslands (Sarmiento 1983,<br />
1992 and Medina 1987). This situation actually<br />
occurrs in many parts <strong>of</strong> <strong>Banni</strong>, therefore, to enrich<br />
the natural seed bank, reseeding was enforced in<br />
the restoration sites.<br />
Further, overgrazing not only degrade the land but<br />
also forms a major causative factor for the massive<br />
expansion <strong>of</strong> Prosopis juliflora. If grasses are destroyed<br />
by heavy grazing, more water becomes<br />
available for trees and shrubs (Knoop and Walker<br />
1985), leading to changes in the interactive pattern<br />
and to an increase in woody vegetation (Stuart Hill<br />
and Taintan 1989, Skarpe 1990). This is one <strong>of</strong> the<br />
main causes <strong>of</strong> widespread invasion <strong>of</strong> bush into<br />
heavily grazed dry rangelands (Walter 1954, Noy-<br />
Meir 1982, Archer 1989). Thus, overgrazing in <strong>Banni</strong><br />
helped Prosopis juliflora to expand in most areas.<br />
Decrease in herbaceous vegetation following<br />
heavy grazing may also lead to physical changes<br />
in soil properties, reducing water infiltration and<br />
water holding capacity (Ruess 1987). This situation<br />
leads to soil degradation in many parts <strong>of</strong> <strong>Banni</strong>.<br />
Tropical savannas are commonly defined as<br />
strongly seasonal plant communities with a continuous<br />
graminoid component and a discontinuous<br />
woody component (Walker and Gillisin 1982,<br />
Huntly 1982). Trees in semi arid regions are viewed<br />
as having the potential to increase forage production,<br />
reduce soil erosion, improve soil fertility and<br />
reverse Desertification (Nair 1984, Young 1987,<br />
Steppler and Nair 1987). However, reports on the<br />
effect <strong>of</strong> trees on savanna grasses and soil are inconsistent.<br />
Under some circumstances herbaceouslayer<br />
productivity is lower under tree canopies than<br />
in nearby open grasslands (Ward and Cleghorn<br />
1964, Grunow etal. 1980, Dye and Spear 1982, Walker<br />
and Noy-Meir 1982) whereas in other instances,<br />
the grassland productivity is higher under tree<br />
canopies than in nearby open grasslands (Singh<br />
and Lal 1969, Holland 1980, Maranga 1984). Further,<br />
it has been reported that, compared to open<br />
grassland, tree canopy reduces total solar radia-<br />
50<br />
tion, air temperature and wind velocity and thereby<br />
decreases the potential evapo-transpiration (PET)<br />
in the shaded area. Further, soil moisture and fertility<br />
was also high in the immediate surroundings <strong>of</strong><br />
tree canopy. These factors are extremely favourable<br />
to the development <strong>of</strong> herbaceous stratum under<br />
the tree canopy. Thus, production would be normally<br />
1.5 to ,’4 times higher in the shade than in<br />
open sunlight (Belsky et al. 1989, Le Houerou 1993<br />
and Grouzis et al. 1995). However, the positive effect<br />
<strong>of</strong> trees on the herbaceous layer production is<br />
generally associated with savanna with low tree<br />
density (Grouzis et al. 1997). Contrary to this, negative<br />
impact <strong>of</strong> trees on the production <strong>of</strong> herbaceous<br />
stratum in certain areas has also been reported<br />
(Cesar 1991 and Mordelet and Menaut 1995).<br />
Further, increase <strong>of</strong> soil fertility under canopy is<br />
largely due to precipitation (Kellman 1979), redistribution<br />
<strong>of</strong> nutrients from deep to superficial horizons<br />
(Bosch and Van Wyk 1970, Chariey and Cowling<br />
1986), nutrient transport through interspecific<br />
micorhiza (Grime et al. 1987) and excretions <strong>of</strong> domestic<br />
and wild animals (Akpo 1993). Drier and<br />
drought conditions limit these process (Hogberg<br />
1986) and thereby the availability <strong>of</strong> soil nutrients.<br />
This may be true in case <strong>of</strong> dense Prosopis juliflora<br />
growing under arid condition in the <strong>Banni</strong> area<br />
where severe drought prevails with highly erratic<br />
and scanty monsoon. Further, saline soils may adversely<br />
affect plant growth and microbial population.<br />
However, very little is known concerning the<br />
effect <strong>of</strong> salinity on soil micro-organisms. The nitrifying<br />
organisms are considered more sensitive to<br />
salts. Saline soils may constitute an unfavourable<br />
habitat for the growth and multiplication <strong>of</strong> rhizobia,<br />
which fix the nitrogen in the root nodules <strong>of</strong><br />
legumes. Due to high density <strong>of</strong> Prosopis juliflora<br />
and inherent soil salinity in Dhordo, only aggregation<br />
<strong>of</strong> grass species was seen in suitable areas<br />
under tree canopy and this led to very low productivity<br />
in the area than that <strong>of</strong> restoration and unprotected<br />
area. This suggest a competitive interactions<br />
between trees and herbs as reported earlier in<br />
other parts <strong>of</strong> the world (Ward and Cleghorn 1964,<br />
West 1969, Beale 1973, Clary and Jameson 1981,<br />
Dye and Spear 1982, Walker et al 1986).<br />
Soil moisture is one <strong>of</strong> a major factor, which governs<br />
the germination and growth <strong>of</strong> grass species. Soil<br />
moisture was reported high during the first half <strong>of</strong><br />
rainy season (June to September) in the open<br />
grassland while it was higher during second half<br />
(September to October) under tree cover (Bernhard-
Reversat 1982, J<strong>of</strong>fre 1987 and Grouzis et al. 1995).<br />
This could be one <strong>of</strong> the reason for obtaining peak<br />
biomass during September and October in the<br />
unprotected and restoration site where the tree<br />
cover is totally absent while it was in November in<br />
the Prosopis juliflora infested area where dense<br />
canopy <strong>of</strong> the plant exists. In addition to these, the<br />
grass growing inside shrubby dense thorny bushes<br />
<strong>of</strong> Prosopis juliflora were inaccessible to the<br />
livestock and this would enable a minimum change<br />
in the biomass between different months and also<br />
produce higher biomass than the unprotected area<br />
during the end <strong>of</strong> the study period.<br />
At Dhordo restoration site, with the complete absence<br />
<strong>of</strong> grazing pressure, there was fluctuation <strong>of</strong><br />
biomass productivity during different months. The<br />
decrease was due to death and shattering <strong>of</strong> annual<br />
plants and tillers <strong>of</strong> perennial grasses following<br />
maturity. The bulk <strong>of</strong> live vegetation is thus<br />
transferred to standing dead and litters compartments<br />
during the late post monsoon. The same was<br />
also reported by Heady (1960) and Rattiff and<br />
Heady (1962), and they attributed the decline in the<br />
total dry weight <strong>of</strong> the herbage to approaching dry<br />
season, normal decline following maturity, seed and<br />
leaf shattering, insect and rodent consumption. The<br />
variation in biomass obtained in Dhordo is mainly<br />
due to natural process <strong>of</strong> drying / dying and or<br />
germination <strong>of</strong> different grass species due to an<br />
unusual heavy rainfall, received during the month<br />
<strong>of</strong> September at Dhordo. This created waterlogging<br />
in many areas <strong>of</strong> restoration and surrounding sites.<br />
As a result, the newly germinated grass plants,<br />
which got submerged under water, died. However,<br />
thereafter, the high moisture availability helped the<br />
viable seeds to germinate and survived or established<br />
grass plant to grow vigorously. This helped<br />
in increasing the biomass during the end <strong>of</strong> November.<br />
This situation also prevailed in the unprotected<br />
area <strong>of</strong> Dhordo. As a result, the availability<br />
<strong>of</strong> grass cover in many parts <strong>of</strong> <strong>Banni</strong> distributed<br />
the grazing pressure, and thereby the productivity<br />
showed a slight upward trend in November in the<br />
unprotected area. Though, the recorded biomass<br />
was comparatively less (September and November)<br />
in the Prosopis juliffora area, minimum grazing access<br />
due to the dense coppicing thorny branches<br />
facilitate an overall increase <strong>of</strong> 17.9 per cent biomass<br />
between September and November.<br />
In the restoration sites, the productivity was found<br />
higher in the unploughed area than that <strong>of</strong> ploughed<br />
area. In the ploughed area the natural seed bank as<br />
<strong>Ecorestoration</strong> <strong>of</strong><br />
<strong>Banni</strong> <strong>Grassland</strong><br />
well as tillers and rhizome <strong>of</strong> grass plant were<br />
disturbed due to ploughing activities while in the<br />
unploughed area these were left undamaged.<br />
Therefore, in the unploughed area, few showers<br />
activated the vegetative growth <strong>of</strong> grass plant from<br />
the tillers or rhizome. In the ploughed area, grass<br />
has to develop from the germination <strong>of</strong> seeds <strong>of</strong><br />
different species sown in that area. The grass seeds<br />
have certain adaptations to survive in the harsh<br />
conditions. All the seeds <strong>of</strong> a grass plant will not<br />
grow after a single shower. In a single grass plant,<br />
seeds produced in the same spike have different<br />
levels <strong>of</strong> dormancy (an adaptive mechanism), which<br />
might germinate after it receives a single or multiple<br />
showers. For example, seeds <strong>of</strong> grass species such<br />
as Cenchrus sp. require certain amount <strong>of</strong> moisture<br />
to wash the inhibitors present in its seed coat before<br />
germination. This could be the possible reason for<br />
the late recruitment / germination <strong>of</strong> certain grass<br />
species like Cenchrus sp. in the ploughed area.<br />
Further, after the germination, the plant would take<br />
at least one full season to establish and this may be<br />
an important reason for obtaining more biomass<br />
from unploughed areas than the ploughed areas at<br />
both the restoration sites. However, the fast<br />
recovery due to soil working was evident through<br />
the increased productivity in the ploughed area <strong>of</strong><br />
Dhordo and different slopes <strong>of</strong> Bhirandiyara<br />
restoration sites.<br />
Except Cyperus rotundas and Cressa erotica, which<br />
showed a uniform distribution, other grass species<br />
exercised either random or aggregation. Plant community<br />
is the composition <strong>of</strong> spatially and temporally<br />
integrated species that retain their individuality<br />
in an area (Mishra, 1968; Mueller-Dombois and<br />
Ellenburg, 1974). Plant communities and associations<br />
characterise the “habitats” in which transformations,<br />
accumulations and flow <strong>of</strong> energy are involved.<br />
The variation in distribution <strong>of</strong> different<br />
grass species was caused by several factors like<br />
soil conditions, vegetative propagation, quantity<br />
and dispersal <strong>of</strong> seeds, grazing, predation by insects,<br />
biotic activities and diseases. In a uniform<br />
vegetation class E is always larger than class D.<br />
However, the situation where E is smaller than class<br />
D denotes eariy stages <strong>of</strong> succession or severe<br />
biotic influences on the community. Latter process<br />
was recorded on narrow vertical and horizontal<br />
slopes <strong>of</strong> Bhirandiyara restoration site, which indicates<br />
the successional process in that area.<br />
At Bhirandiyara site, waterlogging is a common<br />
feature during heavy rainfall years. This creates a<br />
51
<strong>Ecorestoration</strong> <strong>of</strong><br />
<strong>Banni</strong> <strong>Grassland</strong><br />
favorable environment for the growth <strong>of</strong> Cyperus<br />
haspan and Cyperus rotundus. Such a favourable<br />
situation prevailed during September 1997. Within<br />
36 hours, the area received about 458 mm rainfall,<br />
which resulted in waterlogging for more than a<br />
fortnight. This enabled the rhizome <strong>of</strong> C. haspan to<br />
grow enormously and vigorously in and outside<br />
the restoration site, which is less palatable due to<br />
its high fibrous nature. Further, the implementation<br />
<strong>of</strong> soil amendments carried out about 75 per cent <strong>of</strong><br />
the restoration site disturbed the rhizome <strong>of</strong> C.<br />
haspan. These brought out higher cover and<br />
biomass availability during the initial period in the<br />
unprotected area, which was slightly higher than<br />
the restoration site <strong>of</strong> Bhirandiyara as well as<br />
unprotected and Prosopis juliflora area <strong>of</strong> Dhordo<br />
site.<br />
As reported by Christina (1992), the establishment<br />
<strong>of</strong> quality perennials gradually eliminates the<br />
unwanted annuals like Cyperus haspan. Therefore,<br />
it is likely that the seeds <strong>of</strong> Sporobolus sp., Cenchrus<br />
sp., Dichanthium annulatum etc., sown in these<br />
areas would gradually replace or eliminate the<br />
Cyperus haspan after its establishment due to<br />
competition. Further, drier condition generally<br />
affects the survival <strong>of</strong> Cyperus haspan whereas<br />
the perennial species sown in this area are capable<br />
<strong>of</strong> surviving even under less or minimum moisture<br />
availability. This was found true on the narrow<br />
slopes and parts <strong>of</strong> other sub-compartments <strong>of</strong> the<br />
Bhirandiyara restoration site. Though the land<br />
condition existed under similar state, protection and<br />
reseeding alone made it possible to replace<br />
domination <strong>of</strong> Cyperus haspan by productive<br />
perennials in the restoration site.<br />
52<br />
In the unprotected area, the species like Aeluropus<br />
logopoides dominates during the latter part <strong>of</strong><br />
monsoon. As per locals, the cattle preference for<br />
the Aeluropus logopoides and Eragrostis sp. is<br />
less. Livestock exhibit preferences not only for<br />
certain plant species, but for the same species under<br />
different stages <strong>of</strong> growth and even for the various<br />
parts <strong>of</strong> an individual plant (Hafex etal. 1969 and<br />
Arnold etal. 1966).<br />
The species like Cyperus rotundus, Cyperus<br />
haspan and Scirpus sp. are the only species, which<br />
showed a tremendous decrease during the course<br />
<strong>of</strong> the post monsoon in the restoration site. These<br />
three species require high moisture, therefore, lack<br />
<strong>of</strong> moisture during November in open grassland<br />
leads to shrinkage and death.<br />
Salinity remains one <strong>of</strong> the world’s oldest and most<br />
serious problems for plant production. The adverse<br />
effect <strong>of</strong> salt stress on growth and dry matter production<br />
have been extensively studied (Meiri and<br />
Poljak<strong>of</strong>f-Mayber 1969, Tal 1971, Greenway et al.<br />
1983, Eumawat e/ al. 1991, Khan et al 1992, Smith et<br />
al. 1992, Rogers and West 1993 and Staley et al.<br />
1993). None <strong>of</strong> the plants are virtually salt tolerant<br />
to any high degree. (Gour and Kumar, 1993). It was<br />
reported that, salt tolerance increases with growth<br />
<strong>of</strong> the plant (Gill 1985, 1987 and 1988). Contrary to<br />
this, it was observed from the present study that,<br />
even saline tolerant species like Aeluropus<br />
logopoides and Sporobolus sp., showed decreasing<br />
productivity with the increasing salinity.
7. CONSTRAINTS<br />
A study Committee <strong>of</strong> the National Academy <strong>of</strong><br />
Science, U.S.A (1974) defined restoration as the<br />
replication <strong>of</strong> site conditions prior to disturbance.<br />
Jordan et al. (1988) cited that, restoration is the recreation<br />
<strong>of</strong> entire communities <strong>of</strong> organisms, closely<br />
modelled on those occurring naturally. Currently<br />
only a limited theoretical foundation can be applied<br />
in site restoration, and there are very few cases in<br />
which the theories have actually been tested<br />
(Janzen 1988, Uhl 1988, Uhl et al. 1990 and Nepstad<br />
et al. 1991). As knowledge builds up with<br />
experience, it will be possible to derive generalized<br />
principals <strong>of</strong> restoration ecology and management.<br />
The above view clearly highlights that restoration<br />
is highly challenging task and it takes a considerable<br />
time-scale than the normal political and national<br />
plan cycle (Singh and Jha 1992). For example, the<br />
natural recovery <strong>of</strong> total soil nitrogen in a 20 year<br />
age mine spoil would take a period <strong>of</strong> 200 years<br />
(Srivastava et al. 1989). The successful restoration<br />
<strong>of</strong> degraded lands will depend on the continued<br />
effectiveness <strong>of</strong> motivation, publicity amongst<br />
people and organization <strong>of</strong> societal infrastructure,<br />
in which Governmental and Non Governmental<br />
agencies may play a vital role.<br />
<strong>Ecorestoration</strong> <strong>of</strong><br />
<strong>Banni</strong> <strong>Grassland</strong><br />
This has been accomplished by the GEC through<br />
GUIDE and VRTI. The natural recovery in the<br />
restoration sites are promoted by the activities<br />
currently being employed by GUIDE and VRTI at<br />
two sites <strong>of</strong> <strong>Banni</strong>, namely Bhirandiyara and<br />
Dhordb. Since successional process would take<br />
considerable time, the current situation made it<br />
possible to obtain only moderate restoration that<br />
too after the 1997 monsoon. Under these<br />
circumstances, it would take at least two more years<br />
to bring out the management guidelines for this<br />
area. This technical report, however, highlights oneyear<br />
(1997) recovery <strong>of</strong> the restoration sites in<br />
relation to grazed / degraded and Prosopis infested<br />
areas. Further, the production and dispersal <strong>of</strong> large<br />
quantities <strong>of</strong> seeds produced by the established<br />
grass plants and their tillers would certainly<br />
increase the richness <strong>of</strong> species and change the<br />
trend in the successive years.<br />
53
<strong>Ecorestoration</strong> <strong>of</strong><br />
<strong>Banni</strong> <strong>Grassland</strong><br />
8. MAJOR ACHIEVEMENTS<br />
At Dhordo the biomass production estimated in<br />
September 1997 and November 1997 was 3 to 7.8<br />
times higher than the unprotected and 5.5 to 8 times<br />
higher than Prosopis juliflora infested areas.<br />
Over 1,75000 kg grass was harvested from this site<br />
during December 1997. As per local villagers, this<br />
fodder is sufficient to meet their livestock needs <strong>of</strong><br />
6 villages located around Dhordo for more than a<br />
year.<br />
At Bhirandiyara restoration site the biomass gradually<br />
increased from 1115.9 kg/ha in October to 2228.7<br />
kg/ha in December and thus, showed an increase<br />
<strong>of</strong> 99.7 per cent whereas it decreased to 31.5 per<br />
cent in the unprotected area located adjacent to<br />
the site.<br />
To reduce the salinity <strong>of</strong> the Bhirandiyara restoration<br />
site, several soil amendments were carried out.<br />
In which, narrow slopes <strong>of</strong> 0.5m height x 3m wide<br />
54<br />
were found more promising in the productivity <strong>of</strong><br />
palatable grass species. The dense growth <strong>of</strong> grass<br />
species in various amendment areas also helped in<br />
reducing the soil water evaporation and thereby<br />
decreased the surface soil salinity to a great extant<br />
(EC 1-4.5) inside the restoration site. Thus the restoration<br />
site is experiencing low salinity when compared<br />
to outside area where the land is exposed to<br />
high evaporation under the absence (due to excessive<br />
grazing) <strong>of</strong> grass cover.<br />
Highly palatable species like Sporobolus,<br />
Cenchrus, Chloris and Dichanthium are growing<br />
luxuriantly inside both the restoration sites. The<br />
results obtained during the first year (September<br />
1997 to December 1997) clearly enhances the scope<br />
that, eradication <strong>of</strong> Prosopis juliflora, protection<br />
from grazing and soil management along with<br />
reseeding could improve the productivity <strong>of</strong> any<br />
degraded grassland.
9. REFERENCES<br />
Acker, S. A, 1990. Vegetation as a component <strong>of</strong> a<br />
non-nested hierarchy: a conceptual model. J.<br />
Veg.Sci. 1:683-690.<br />
Akpo, L. E. 1993. Influence du couvert ligneux sur<br />
la structure et le fonctionnement de la strate<br />
herbacee en milieu sahelian. Les determinants<br />
ecologiques. Paris: TDM, ORSTOM. Pp 174.<br />
Arnold, G. W., J. Ball, W. R. McManus and I. G.<br />
Burn. 1966.Studies on the diet <strong>of</strong> grazing animal. 1.<br />
Seasonal changes on the diet <strong>of</strong> sheep grazing on<br />
pastures <strong>of</strong> different availability and composition.<br />
Australian Journal <strong>of</strong> Agriculture Research. 17: 543-<br />
556.<br />
Bawa, R. 1995. Biomass dynamics <strong>of</strong> Himalayan<br />
grassland. Int. J. <strong>of</strong> Ecology and Environmental<br />
Sciences.21: 25-36.<br />
Beale, I. F. 1973-Tree density effects on yields <strong>of</strong><br />
herbage and tree components in southwest<br />
Queensland mulga (Acacia aneura} scrub. Tropical<br />
grassland. 7. Pp 135-142. Belsky, A. J., R. G.<br />
Amundson, J.M. Duxbury, S. J. Riha, A. R. Ali and<br />
S. M. Mwonga. 1989.<br />
The effects <strong>of</strong> trees on their physical, chemical and<br />
biological environments in a semi-arid savanna in<br />
Kenya. J. Appl. Ecol. 26:1005-1024.<br />
Bemhard-Reversat, F. 1982. Biogeochemical cycle<br />
<strong>of</strong> nitrogen in a semi-arid savanna. Oikos,38: 312-<br />
332.<br />
Bhimaya, C. P. and L. D. Ahuja. 1969. Criteria for<br />
determining condition class <strong>of</strong> rangelands in western<br />
Rajasthan. Ann. Arid Zone. 8: 73-79.<br />
Bhimaya, C. P, R.N. Kaul and L.D. Ahuja. 1967. Forage<br />
production and utilization in arid-and semi arid<br />
rangelands <strong>of</strong> Rajasthan. Proc. Symp. Nat. Inst. Sci.<br />
India. Pp 215-223.<br />
Bosch, 0. J. and J. P. Van Wyk. 1970. The influence<br />
<strong>of</strong> bushweld trees on the productivity <strong>of</strong> Panicum<br />
maximum: a preliminary report. Hand<br />
Weidingsveren, South Africa, 5: 69-70.<br />
<strong>Ecorestoration</strong> <strong>of</strong><br />
<strong>Banni</strong> <strong>Grassland</strong><br />
Bradshaw, A. D. 1987. The reclamation <strong>of</strong> derelict<br />
land and the ecology <strong>of</strong> ecosystems. In: W.R. Jordanian,<br />
M.E. Gilpin and J.D. Aber (Eds.), <strong>Restoration</strong><br />
Ecology. Campridge University press,<br />
Campridge, England. Pp 53-74.<br />
Cesar, J. 1991. Les facteurs de production herbacee<br />
des savanes humides d’afrique tropicale. IV<br />
Congres International des Terres de Parcours,<br />
Montpellier, France. Pp 4.<br />
Champion, H. G. and S. K. Seth. 1968. Forests types<br />
<strong>of</strong> India. Manager <strong>of</strong> Publications.New Delhi. Pp<br />
404.<br />
Charley, J. L. and S. W. Cowling. 1986. Changes in<br />
soil nutrient status resulting from overgrazing and<br />
their consequences in plant communities <strong>of</strong> semiarid<br />
areas. Procedings <strong>of</strong> the Ecological Society <strong>of</strong><br />
Australia. 3: 28-38.<br />
Clary, W. P. and D. A. Jameson. 1981. Herbage production<br />
following tree and shrub removal in the<br />
ponyonjuniper type <strong>of</strong> Arizona. J. <strong>of</strong> Range Management.<br />
34. Pp 109-112.<br />
Coupland, R. T. 1978. <strong>Grassland</strong> ecosystem <strong>of</strong> the<br />
world. (Eds.). Cambridge University Press, London.<br />
Pp401.<br />
Christina, S. 1992. Dynamics <strong>of</strong> savanna ecosystems.<br />
J. Vegetation Science. 3. Pp 293-300.<br />
Dabadghao and Shankamarayanan. 1973. The grass<br />
cover <strong>of</strong> India. ICAR New Delhi. Pp.713.<br />
Dye, P. J. and P.T. Spear. 1982. The effects <strong>of</strong> bush<br />
clearing and rainfall variability on grass yield and<br />
composition in southwest Zimbabwae. Zimbabwae<br />
Journal <strong>of</strong> Agricultural Research. 20. Pp 103-118.<br />
Frost, P., E. Medina, J. C. Menaut, 0. Solbrig, 0.<br />
Swift and B. Walker. 1986. Responses <strong>of</strong> savannas<br />
to stress and distrubance. Biol. Int. 10:1-82.<br />
Gadgil, M and V. M. Meher-Homji. 1985. Landuse<br />
and productive potential <strong>of</strong> Indian savannas. In: J.<br />
C. Tothil and J. J. Mott (Eds.) Ecology and Man-<br />
55
<strong>Ecorestoration</strong> <strong>of</strong><br />
<strong>Banni</strong> <strong>Grassland</strong><br />
agement <strong>of</strong> the world’s savannas. The Australian<br />
Academy <strong>of</strong> Sciences, Canberra. Pp. 107-113.<br />
Ganguli, B. N., R. N. Kaul and K. T. N. Nambiar.<br />
1964. Preliminary studies on desert top feed species.<br />
Ann. Arid zone, 3: 33-37.<br />
GAU, 1989. Status report, Vol. 1. National Agriculture<br />
Research Project, North west agroclimatic zone,<br />
Gujarat agricultural University, Sardar Krushinagar.<br />
Gour, H.N. and A. Kumar, 1993. Soil salinity, plant<br />
growth and microbes. In: Management <strong>of</strong> salt affected<br />
soils and waters. (Eds. L.L. Somani and K.L.<br />
Totawat). Agrotech Pupl. Udaipur.<br />
Goodall, D.W. 1963. The continuum and the individualistic<br />
association. Vegetatio. 11. Pp 297-316.<br />
Grime, J. P., J. M. Mackey, S. H. Hillier and D. J.<br />
Read. 1987. Floristic diversity in a model system<br />
using experimental microcosms. Nature, 328: 420-<br />
422.<br />
Groombridge, B. 1992. 1994 IUCN Red list <strong>of</strong> Threatened<br />
Mammals. IUCN Gland, Switzerland and Cambridge,<br />
UK. Pp 39.<br />
Grunow, J.O., H. T. Groeneveld and S.H.C. Du Toil<br />
1980. Biomass cycles, accumulation rates and nutritional<br />
proceedings <strong>of</strong> the grassland society <strong>of</strong><br />
South Africa. 15. Pp 157-161.<br />
GUIDE, 1998. Status <strong>of</strong> <strong>Banni</strong> grassland and exigency<br />
<strong>of</strong> restoration efforts. Gujarat Institute <strong>of</strong><br />
Desert Ecology, Bhuj.<br />
Hafex, E. S. E., M. W. Schein and R. Ewbank. 1969.<br />
The behaviour <strong>of</strong> cattle. Pp 225-295. In: E. S. E.<br />
Hafez (eds). The behaviour <strong>of</strong> domestic animals.<br />
Bailliere. Tindall and Cassell ltd, London.<br />
Hodgson, J. 1979.Nomenclature and definition in<br />
grazing studies. Grass and forage science. 34: 11-<br />
18.<br />
Holland, V.L. 1980. Effect <strong>of</strong> blue oak on rangeland<br />
forage production in central California. Ecology,<br />
Management and Utilisation <strong>of</strong> California Oaks. (Ed<br />
by T.R. Plumb). Pacific southwest forest range experiment<br />
station, Berkeley. Pp 314-318.<br />
Huntly, B.J. 1982. Sauthem Affrican savannas. Ecology<br />
<strong>of</strong> tropical savannas (Ed by B.J. Huntley and<br />
B.H. Walker), Springer-Verlag, NewYark. Pp 101-119.<br />
Jadhav.R. N., M. M. Kimoti and A. K. Kandhya.<br />
1992. <strong>Grassland</strong> mapping / monitoring <strong>of</strong> <strong>Banni</strong>,<br />
56<br />
Kachchh (Gujarat) using remotely sensed data.<br />
Land Resources Division, Remote Sensing Application<br />
Group, Space Application Centre,<br />
Ahmedabad.<br />
Janzen, D.H. 1988. Tropical dry forests: The most<br />
endangered major tropical ecosystem. In<br />
Biodiversity (Eds. E.O. Wilson and F.M. Peter).<br />
Washington D.C. National Academy Press. Pp 130-<br />
177.<br />
Jordan, W.R., M.E. Gilpin and J.D. Aber. 1987. <strong>Restoration</strong><br />
Ecology. A synthetic approach to ecological<br />
research. New York. Cambridge University Press.<br />
J<strong>of</strong>fre, R. 1987. Contraintes du milieu et reponses<br />
de la vegetation herbacee dans les dehesas de la<br />
Sierra Norte (Andalousie, Espagne). Thesis USTL,<br />
Montpellier. Pp 201.<br />
Kadikar, P. 1994. Status <strong>of</strong> <strong>Banni</strong> (Kachchh, Gujarat)<br />
grassland by 2000 AD using multiple remote sensing<br />
satellite data. Dissertation. Gujarat University,<br />
Ahmedabad.<br />
Kanodia, K. C. and B. D. Patil. 1983. Pasture development.<br />
In: Desert resources and technology. Vol. I<br />
(Eds. A. Singh), Jodhpur.<br />
Kanodia, K.C., K.C. Velayudhan and P. Rai. 1978.<br />
Approaches and systems in augmentation <strong>of</strong> grasslands<br />
in semi arid zone with special reference to<br />
Bundelkhand tract. Intern. Symp. Arid Zone. Research<br />
and Development, CAZRI, Jodhpur, 6-8^ Feb.<br />
abstract. Pp 111.<br />
Kelman, M. 1979. Soil enrichment by neo-tropical<br />
savanna trees. Journal <strong>of</strong> ecology. 67: 565-577.<br />
Kent, M. and P. Coker. 1992. Vegetation description<br />
and analysis. A pratical approach. CRC and<br />
Belhaven press. Pp. 363.<br />
Le Houerou, H. N. 1993.Environmental aspects <strong>of</strong><br />
fodder trees and shrubs plantation in the Mediterranean<br />
basin. In : Papanastasis, V. (Ed.), Fodder<br />
trees and shrubs in the Mediterranean Production<br />
systems: Objectives and expected results <strong>of</strong> the EC<br />
research contact. Pp11-34. Brussels: Commission<br />
<strong>of</strong> the European Communities, EUR 1445, v-205.<br />
Leafe, E. L. 1988. The history <strong>of</strong> improved grasslands.<br />
In: The grass crops. (Eds.) M. B. Jones and<br />
A. Lazenby. Chapmann and Hall. Pp. 1-20.
Maranga, F. K. 1984. Influence <strong>of</strong> Acacia tortilis<br />
trees on the distribution <strong>of</strong> Panicum maximum and<br />
Digitaria macroblephara in south central Kenya.<br />
MS Thesis. Texas A and M University.<br />
McNaughton, S. J. 1967. Relationship among functional<br />
properties <strong>of</strong> Califomian grasslands. Nature.<br />
216: 168-169.<br />
McNaughton, S. J. 1979. Grazing as an optimisation<br />
process, grass-ungulate relationships in the<br />
Serangetti. Am. Nat. 113: 691-703.<br />
Medina, E. 1987. Requirements, conservation and<br />
cycle <strong>of</strong> nutrients in the herbaceous layer. In:<br />
Walker, B.H. (Eds) Determinants <strong>of</strong> tropical savannas.<br />
Pp.39-66. ICSU press, Miami.<br />
Mishra, R. 1968. Ecology work book. Oxford and<br />
IBH publishing co. New Delhi. Pp 244.<br />
Mordelet, P. and J. C. Menaut. 1995. Influence <strong>of</strong><br />
trees on above ground production<br />
dynamics <strong>of</strong> grasses in a humid savanna. Journal<br />
<strong>of</strong> vegetation science. 6: 223-228.<br />
Muller-Dombois and H. Ellensberg. 1974. The aims<br />
and methods <strong>of</strong> vegetation ecology. John Wiley<br />
and sons. New York. Pp. 547.<br />
National Research Council (NRC), 1983. Environmental<br />
change in the west African Sahel. Washington<br />
D.C. National Academy Press.<br />
National Research Council (NRC), 1989. Science and<br />
Technology Information Services and Systems in<br />
Africa. Washington D.C. National Academy Press.<br />
Nepstad, D.C., C. Uhl, A.S. Serrao. 1991. Recuperation<br />
<strong>of</strong> a degraded Amazonian land scape: Forest<br />
Management and Agricultural <strong>Restoration</strong>. Ambio.<br />
20 (6): 248-255.<br />
Noy-Meir, I. 1975. Stability <strong>of</strong> grazing systems: An<br />
application <strong>of</strong> predator prey graphs. J. Ecol. 63:<br />
459-481.<br />
Odum, E. P. 1960. Organic production and turnover<br />
in old-field succession. Ecology. 41: 34-49.<br />
Paliwal, K.V. 1977. Nutrient requirement <strong>of</strong> salt-affected<br />
soils. Proc. Indo-Hungarian Sem. Management<br />
<strong>of</strong> Salt Affected Soils, Kamal, Pp 202-218.<br />
<strong>Ecorestoration</strong> <strong>of</strong><br />
<strong>Banni</strong> <strong>Grassland</strong><br />
Pandeya, S. C. 1974. Ecology <strong>of</strong> grassland <strong>of</strong> Sagar,<br />
M.P. IIA. Composition <strong>of</strong> the fenced grassland association.<br />
J. Indian Bot. Soc. 43: 577-605.<br />
Pandya, S. M. and V. K. Siddha. 1982. Ecological<br />
studies <strong>of</strong> arid regions <strong>of</strong> Kutch (Gujarat state). Final<br />
progress report, Dept. <strong>of</strong> Biosciences,<br />
Saurashtra University, Rajkot.<br />
Parikh, J. and S. Reddy. 1997. Sustainable regeneration<br />
<strong>of</strong> degraded lands. Tata McGraw -Hill Publ.,<br />
New Delhi.<br />
Penfuund, W. T. 1964. The relation <strong>of</strong> grazing to<br />
plant succession in the tall grass praire. Journal <strong>of</strong><br />
Range Management. 17: 256-260.<br />
Peters, R. L. 1985. <strong>Global</strong> climate change: A challenge<br />
for restoration ecology. In: <strong>Restoration</strong> and<br />
management notes. 3: 62-67.<br />
Premadasa, M. A. 1990. Tropical grasslands <strong>of</strong> Sri<br />
Lanka and India. J. Biogeography. 17: 395-400.<br />
Peters, R.L. and J.D.S. Darling. 1985. The green<br />
house effect and nature reserves. Bioscience, 35:<br />
Pp. 707-717.<br />
Quadar A. 1994. Physiology <strong>of</strong> salt tolerance. In<br />
Salinity Management for Sustainable Agriculture<br />
(Eds. D.L.N. Rao et al.), Central Soil Salinity Research<br />
Institute, Karnal, India.<br />
Rahmani, A. R. 1989. <strong>Grassland</strong> birds <strong>of</strong> the Indian<br />
subcontinent: A review. ICBP Technical Publication<br />
No. 7:187-204.<br />
Rahmani, A. R. 1997. A study on the ecology <strong>of</strong><br />
grassland <strong>of</strong> Indian plains with particular referance<br />
to their endangered fauna. Bombay. Nat. Hist. Soc.,<br />
Bombay.<br />
Ram, J., J. S. Singh and S. P. Singh. 1989. Plant biomass,<br />
species diversity and net primary production<br />
in a central Himalayan high altitude grassland.<br />
J. <strong>of</strong> Ecology. 77:456-468.<br />
Raheja, P.C. 1966. Rajastan desert can bloom with<br />
forage. Indian Farming. 15. Pp 47. Raunkiaer, C. 1934.<br />
The life forms <strong>of</strong> plants and statistical plant geography.<br />
Oxford University Press, Oxford. Redmann,<br />
R. E. 1992. Primary productivity. In: R.T. Coupland<br />
(Eds.)Ecosystem <strong>of</strong> the world. Elsevier. Netherlands.<br />
Roberts, D. W. 1987. A dynamical systems perspective<br />
on vegetation theory. Vegetation. 69: 27-33.<br />
57
<strong>Ecorestoration</strong> <strong>of</strong><br />
<strong>Banni</strong> <strong>Grassland</strong><br />
Rodgers, W. A. 1986. The role <strong>of</strong> fire in the management<br />
<strong>of</strong> wildlife habitats - A review. Indian Forester.<br />
112 (10) 845-857.<br />
Ruess, R. W. and S. J. McNaughton. 1987. Grazing<br />
and the dynamics <strong>of</strong> nutrient and energy regulated<br />
microbial process <strong>of</strong> Serengeti grasslands. Oikos.<br />
49:101-110.<br />
Ruess, R. W. 1987. The role <strong>of</strong> large herbivores in<br />
nutrient cycling <strong>of</strong> tropical savannas. In: Walkar, B.<br />
H. (Eds.) Determinants <strong>of</strong> tropical savannas, pp 67-<br />
91. ICSU press, Miami. Sampson, A. W. 1952. Range<br />
management. New York, Wiley. Sankar, V. and K. C.<br />
Velayudan. 1979. Primary productivity, compartment<br />
transfer and system transfer functions in Iselima<br />
Laxum grassland. Annals <strong>of</strong> Arid zone. 18 (3): 143-<br />
152. Sarmieento, G. 1983. The savannas <strong>of</strong> tropical<br />
America. In: Bouriiere, F. (Eds). Ecosystems <strong>of</strong> the<br />
world 13. Tropical savannas. Pp 245-288. Elseveier.<br />
Amsterdam.<br />
Sarmieento, G. 1992. Adaptive strategies <strong>of</strong> perennial<br />
grasses in south American savannas. J. Veg.<br />
Sci. 3: 325-336.<br />
Saxena, S. K. 1992-<strong>Banni</strong> grasslands and halophytes.<br />
In: A dossier on Kachchh, Gujarat Ecology Commission,<br />
Vadodara.<br />
Sankamarayan, K. A.1977. Impact <strong>of</strong> over grazing<br />
on the grasslands. Ann. Arid Zone. 16: 349-359.<br />
Sale, J.P. 1981. The importance and values <strong>of</strong> wild<br />
plants and animals in Africa. Gland,<br />
Switzerland.IUCN.<br />
Sims, P. L and J. S. Singh. 1971. Herbage dynamics<br />
and net primary production in certain ungrazed and<br />
grazed grassland in north America. Pp 59-124. In:<br />
N. R. French (Eds). Preliminary analysis <strong>of</strong> structure<br />
and function in grasslands. Range Sci. Dep.<br />
Sci. Ser. No 10., Colorado State Univ., Fort Collins.<br />
Singh, J.S. 1988. The environmental problems: Issues<br />
and challenges. In: K.S. Valdiya (Eds.),<br />
Kumaun: Land and People. Gyanodaya Prakashan,<br />
Naini Tal. Pp 347-351. Singh, K.S and P. Lal. 1969.<br />
Effects <strong>of</strong> Kijari (Prosopis spicigera) and Babool<br />
(Acacia arabica) trees on the soil fertility and pr<strong>of</strong>ile<br />
characteristics. Annals <strong>of</strong> Arid Zones. 8. Pp 33-<br />
36. Singh, U. N. and R. S. Ampasht. 1975. Biotic<br />
stress and variability in structure and organic (net<br />
primary) production <strong>of</strong> grassland communities<br />
atVaranasi, India. Trop. Ecol. 16: 86-95.<br />
58<br />
Singh, J. S. and P. S. Yadava. 1974. Seasonal variation<br />
in composition, plant biomass and net primary<br />
productivity <strong>of</strong> a tropical grassland at Kurukshetra,<br />
India. Ecol. Monograph. 44: 351-376.<br />
Singh, J. S. and M. C. Joshi. 1979. Primary production.<br />
In: Coupland. R. T. (Eds.) <strong>Grassland</strong> ecosystems<br />
<strong>of</strong> the world. Analysis <strong>of</strong> grasslands and their<br />
uses. Pp 197-218. Cambridge University press, Cambridge.<br />
Singh, K.N and B. Mohan kumar, 1985. Interactive<br />
effects <strong>of</strong> soil moisture, fertilizers and salinity in<br />
crop production. Agric. Rev. 6:8-22.<br />
Singh, J. S. and A. K. Jha. 1992. <strong>Restoration</strong> <strong>of</strong> degraded<br />
land: An over view. Pp. 1-9. In: J. S. singh<br />
(Eds.). <strong>Restoration</strong> <strong>of</strong> degraded land: concepts and<br />
Stratigies. Rastogi publications, Meerut.<br />
Singh, J.S., Y. Hanxi and P.E. Saise. 1985. Structural<br />
and functional aspects <strong>of</strong> Indian and South East<br />
Asian savanna ecosystems. In: J.J. Thothil and J.J.<br />
Mott (Eds.). Ecology and Management <strong>of</strong> Worlds<br />
Savannas. The Australian Acad. Sci. Canbera. Pp<br />
34-51.<br />
Srivastava, S.C.,A.K. Jha and J.S. Singh. 1989.<br />
Changes with time in soil biomass C,N and P <strong>of</strong><br />
mine spiols in a dry tropical environment. Canadian<br />
J. <strong>of</strong> Soil Science. 69:Pp 849-855.<br />
Skarpe, C. 1991. Impact <strong>of</strong> grazing in savanna ecosystems.<br />
Ambio. 20: 351-356.<br />
Stuart-Hill, G. C. and N. M. Tainton. 1989. The competitive<br />
interaction between Acasia karrow and the<br />
herbaceous layer and how this is influenced by<br />
defoliation. J. Appl. Ecol. 26: 285-298.<br />
Stuart-Hill, G. C. and N. M. Tainton. 1989. The competitive<br />
interaction between Acasia karroo and the<br />
herbaceous layer and how this is influenced by<br />
defoliation. J. Appl. Ecol. 26: 285-298.<br />
Uhl, C. 1988. <strong>Restoration</strong> <strong>of</strong> degraded land in the<br />
Amazon basin. In Biodiversity (Eds. E.O. Wilson<br />
and F.M. Peter). Washington D.C. National Academy<br />
Press. Pp 326-332.<br />
Uhl, C., D. Nepstad, R. Buschbach, K. dark, B.<br />
Kauffman and S. Subler. 1990. Studies <strong>of</strong> ecosystem<br />
response to natural and anthropogenic<br />
distrubances provide guidelines for desinging sustainable<br />
land-use systems in Amazonia. In: Alternative<br />
to deforestation. Steps towards sustainable
use <strong>of</strong> the Amazon rain forest (Eds. A.B. Anderson).<br />
Pp 24-42.<br />
Walker, b. H. 1987. A general model <strong>of</strong> savanna<br />
structure and function. In: Walker, B.H. (Eds). Determinants<br />
<strong>of</strong> tropical savannas. Pp 1-12. ICSU<br />
Press, Miami. Walker, B. H. and I. Noy-Meir. 1982.<br />
Aspects <strong>of</strong> the stability and resiliance <strong>of</strong> savanna<br />
ecosystem. Ecology <strong>of</strong> tropical savannas (Ed by<br />
B.J. Huntley and B.H. Walker), Springer-Veriag, New<br />
Yark. Pp 556-990.<br />
Walker, J. and A. N. Gillison. 1982. Australian savannas.<br />
Ecology <strong>of</strong> tropical avannas (Eds. By B.J.<br />
Huntley and B.H. Walker). Springer-Veriag, New<br />
Yark. Pp 524.<br />
Ward, H. K. and W. B. Cteghom. 1964. The effects<br />
<strong>of</strong> ring-barking trees in B West 1969<br />
<strong>Ecorestoration</strong> <strong>of</strong><br />
<strong>Banni</strong> <strong>Grassland</strong><br />
Ward, H.K. and W.B. Cleghom. 1964-The effects <strong>of</strong><br />
ring-barking trees in rachystegia woodland on the<br />
yield <strong>of</strong> veld grass. Rhodhosean Agricultural journal.<br />
61. Pp 98-107.<br />
Werger, M. J. A. 1977. Environmental destruction<br />
in southern Africa: the role <strong>of</strong> overgrazing and trampling.<br />
In: Miyawaki, A. and R. Tuxen (Eds). Vegetation<br />
science and environmental protection. Pp 301-<br />
305, Maruzen, Tokyo. Yadav, M.S. 1991. Potential<br />
grasses for arid zone. In: Dry land Resources and<br />
Technology - 6. (Eds. A. Singh and L.L. Somani).<br />
Pp 115-119. Yadava, P. S. and J. S. Singh. 1986.<br />
Progress in ecology. Vol. 2. In: <strong>Grassland</strong> vegetation.<br />
Todays and Tommorrow’s Printers and Publishers.<br />
New Delhi. Pp 132.<br />
59